Endividamento das Famílias - planejamento.gov.br · Endividamento das Famílias SECRETARIAT OF...
190
Endividamento das Famílias December 2018 MACROECONOMIC OUTLOOK
Transcript of Endividamento das Famílias - planejamento.gov.br · Endividamento das Famílias SECRETARIAT OF...

Endividamento das Famílias
December 2018
MACROECONOMIC OUTLOOK

Endividamento das Famílias
Macroeconomic Outlook is a report prepared by the Secretariat for Planning and Economic Issues (SEPLAN) with the
most relevant economic data about Brazil.
This report does not constitute any indication of prospective policy decisions or
delimits the operational area of the Ministry of Planning, Development and
Management.

Endividamento das FamíliasContents
Highlights...................................................................................................... 4Market Expectations................................................................................... 42Economic Activity
GDP and Quarterly Economic Activity................................................... 51Monthly Economic Activity.................................................................... 66Other Monthly Economic Activity Indicators........................................ 76
Labor Market............................................................................................... 95Inflation..................................................................................................... 104Credit Market.............................................................................................118Financial Markets...................................................................................... 131Foreign Trade............................................................................................. 141External Sector........................................................................................... 157Public Sector Accounts.............................................................................. 168World Economy.......................................................................................... 179
Endividamento das Famílias
HIGHLIGHTS

Endividamento das Famílias
SECRETARIAT OF PLANNING AND ECONOMIC AFFAIRS
Source: IBGE/MP, Quarterly National Accounts Series.Note: Carry-over 2018 based on 2018 3rd quarter seasonally adjusted level compared to 2017 average.
Last 4Q / Previous 4Q (%)
Quarterly GDP
5

Endividamento das Famílias
SECRETARIAT OF PLANNING AND ECONOMIC AFFAIRS
Source: IBGE/MP, Quarterly National Accounts Series.
GDP and Economic Sectors Quarterly Volume IndicatorChained Series of the Seasonally Adjusted Index: 2007=100
Agriculture
Industry
Services
GDP
Quarterly GDP by Activity Sector
6

Endividamento das Famílias
SECRETARIAT OF PLANNING AND ECONOMIC AFFAIRS
Source: IBGE/MP, Quarterly National Accounts Series.
GDP and Demand Categories Quarterly Volume IndicatorChained Series of the Seasonally Adjusted Index: 2007=100
Government Expenditure
GDP
Gross Fixed Capital Formation
Exports of Goods and Services
Household Expenditure
Imports of Goods and Services
Quarterly GDP by Expenditure
7

Endividamento das Famílias
SECRETARIAT OF PLANNING AND ECONOMIC AFFAIRS
Source: IBGE/MP, Systematic Survey of Agricultural Production (LSPA) – October 2018.
Primary Sector GDPAnnual % of Change Major Crops Production (% of total)
Index: 1997=100
450Soybean (40,4%)
200Sugarcane (20,2%)
300Corn (12,4%)
Primary Sector Performance by Major Crops
8

Endividamento das Famílias
SECRETARIAT OF PLANNING AND ECONOMIC AFFAIRS
Quarterly % Change - Seasonally Adjusted Series
Sources: IBGE/MP and Central Bank of Brazil.
GDPIBC-Br
Economic Activity Index
Quarterly GDP Growth and IBC-Br Economic Activity Index
9

Endividamento das Famílias
SECRETARIAT OF PLANNING AND ECONOMIC AFFAIRS
10
Major Monthly Economic Activity Indicators
Sources: Central Bank of Brazil and IBGE/MP: Systematic Survey of Agricultural Production (LSPA), Monthly Survey of Industry (PIM), Monthly Survey of Trade (PMC), and Monthly Survey of Services (PMS).
IBC-Br, Grain Harvest (12-mo MA) and Industry ProductionSeasonally Adjusted Index (2003 = 100) Amplified Retail Sales and Volume of Services
Seasonally Adjusted Index (2003 = 100)
Industry Production
Grain Harvest (12-mo MA)
Amplified Retail Sales
Volume of Services

Endividamento das Famílias
SECRETARIAT OF PLANNING AND ECONOMIC AFFAIRS
11
Major Monthly Economic Activity Indicators
IBC-Br(YoY %)
IBC-Br, LSPA, PIM, PMC and PMS(YoY %)
Sources: Central Bank of Brazil and IBGE/MP: Systematic Survey of Agricultural Production (LSPA), Monthly Survey of Industry (PIM), Monthly Survey of Trade (PMC), and Monthly Survey of Services (PMS).
Industry Production - PIM
Grain Harvest (12-mo MA) - LSPA
Amplified Retail Sales - PMC
Volume of Services - PMS

Endividamento das Famílias
SECRETARIAT OF PLANNING AND ECONOMIC AFFAIRS
12
Sources: Central Bank of Brazil and IBGE/MP: Systematic Survey of Agricultural Production (LSPA), Monthly Survey of Industry (PIM), Monthly Survey of Trade (PMC), and Monthly Survey of Services (PMS).
General Industry Physical Production
Capacity Utilization Rate
Industry ProductionSeasonally Adjusted Index (2003 = 100)
Capacity UtilizationSeasonally Adjusted - % of Total Capacity
Industrial Production and Capacity Utilization

Endividamento das Famílias
SECRETARIAT OF PLANNING AND ECONOMIC AFFAIRS
Total Industrial Production and Economic Categories
Mining Industry
Capital Goods
Durable Consumer Goods
General Industry
Typical Construction Inputs
Semi and Non-Durable Consumer Goods
Intermediate Goods
Industry Physical Production by Economic CategorySeasonally Adjusted Index (2002 = 100)
Source: IBGE/MP, Monthly Survey of Industry (PIM).
71

Endividamento das Famílias
SECRETARIAT OF PLANNING AND ECONOMIC AFFAIRS
Total Retail Sales and Subsectors
Textiles, Apparel and Footwear
Vehicles, Motorcycles, Parts and Accessories
Fuel and Lubricants
Amplified Retail Sales
Furniture and Household Appliances
Hypermarkets, Supermarkets, Food, Beverage and Tobacco
Construction Material
Retail Sales by SubsectorSeasonally Adjusted Index (2002 = 100)
Source: IBGE/MP, Monthly Survey of Trade (PMC).
73

Endividamento das Famílias
SECRETARIAT OF PLANNING AND ECONOMIC AFFAIRS
15
Other Services
Professional, Administrative and Complementary Services
Volume of Services
Services Rendered to Families
Transportation, Support Activities for Transportation and Mailing Activities
Information and Communication Services
Volume of Services by SubsectorSeasonally Adjusted Index (2002 = 100)
Source: IBGE, Monthly Survey of Services (PMS).
Total Services and Subsectors

Endividamento das Famílias
SECRETARIAT OF PLANNING AND ECONOMIC AFFAIRS
16
CNI: Business Confidence and Consumers Expectation Indexes
Business Confidence Index – ICEI3-month moving average
Source: CNI.
Consumers Expectation Index – INEC3-month moving average
Business Confidence Index
Consumers Expectation Index

Endividamento das Famílias
SECRETARIAT OF PLANNING AND ECONOMIC AFFAIRS
17
FGV: Economic Confidence Indicators
Economic Confidence Indicators3-month moving average
Source: IBRE/FGV.
Industry96.43
Retail97.20
Consumers88.77
Services 90.30
Construction Industry 81.50

Endividamento das Famílias
SECRETARIAT OF PLANNING AND ECONOMIC AFFAIRS
18
ABRAS: Supermarket Sector Total Retail Sales
Total Retail SalesSeasonally Adjusted Data*
Source: ABRAS. * Seasonally adjusted by SEPLAN/MP.

Endividamento das Famílias
SECRETARIAT OF PLANNING AND ECONOMIC AFFAIRS
19
CNI: Industry Real Sales Revenues and Working Hours
Real Sales RevenueManufacturing IndustrySeasonally Adjusted Data
Source: CNI.
Working Hours in ProductionManufacturing Industry
Seasonally Adjusted DataReal Sales Revenue
Working Hours

Endividamento das Famílias
SECRETARIAT OF PLANNING AND ECONOMIC AFFAIRS
20
Capacity Utilization Rate
Capacity Utilization Rate - UCI (CNI)Seasonally Adjusted Data
Source: CNI and FGV.
Industry Capacity Utilization Rate – NUCI (FGV)Seasonally Adjusted Data

Endividamento das Famílias
SECRETARIAT OF PLANNING AND ECONOMIC AFFAIRS
21
Anfavea: Automotive Sector Production
Total Vehicles and Car ProductionDaily Average of Vehicles Monthly ManufacturedSeasonally Adjusted Data*
Source: ANFAVEA. * Seasonally adjusted by SEPLAN/MP.
Commercial Vehicles ProductionDaily Average of Vehicles Monthly Manufactured
Seasonally Adjusted Data*
Total Vehicles Production
Car Production
Commercial Vehicles Production

Endividamento das Famílias
SECRETARIAT OF PLANNING AND ECONOMIC AFFAIRS
22
ABCR: Heavy Vehicles Road Traffic Index
Heavy Vehicles Road Traffic IndexIndex: 1999=100Seasonally Adjusted Data
Source: ABCR.

Endividamento das Famílias
SECRETARIAT OF PLANNING AND ECONOMIC AFFAIRS
23
Unemployment Rate and Net Formal Job Creation
Net Formal Jobs Creation12-Month Accumulated Figures
Sources: IBGE/MP - PNADC, SEADE-PED and MTE-CAGED (adjusted data).
Brazil and Sao Paulo Unemployment Rate% of Labor Force
Net Jobs Created
Brazil Unemployment Rate

Endividamento das Famílias
SECRETARIAT OF PLANNING AND ECONOMIC AFFAIRS
24
Real Wage Bill and Average Real Earning
Average Real EarningR$ of last month
Real Wage BillR$ millions of last month
Source: IBGE/MP - PNADC.
Real Wage Bill Average Real Earning

Endividamento das Famílias
SECRETARIAT OF PLANNING AND ECONOMIC AFFAIRS
25
Major Inflation Indexes
Major Inflation Indexes12-month accumulated rate (%)
Sources: IBGE/MP and Central Bank of Brazil. *2018 = BCB-Focus Survey of 11/30/2018, median of market expectations (monthly).
INPC (12 months)3.96%
IPCA 2018*
IGP-DI (12 months) 8.67%
Sep
-18*
Oct
-18
*N
ov-
18
*
De
c-1
8*

Endividamento das Famílias
SECRETARIAT OF PLANNING AND ECONOMIC AFFAIRS
26
IBGE: Monthly Consumer Price Indexes
Source: IBGE.
IPCA-15 and IPCABy release order

Endividamento das Famílias
SECRETARIAT OF PLANNING AND ECONOMIC AFFAIRS
27
FGV: Monthly General Price Indexes
Source: FGV.
IGP-10, IGP-M and IGP-DIBy release order

Endividamento das Famílias
SECRETARIAT OF PLANNING AND ECONOMIC AFFAIRS
28
New Loans to Households and Non-Financial Corporations
Source: Central Bank of Brazil. * Seasonally adjusted by SEPLAN/MP.
Daily Average of New Loans to Non-Financial CorporationsR$ millions of the last month3-Month Moving Average - Seasonally Adjusted*
Daily Average of New Loans to HouseholdsR$ millions of the last month
3-Month Moving Average - Seasonally Adjusted*
Non-Financial Corporations
Households

Endividamento das Famílias
SECRETARIAT OF PLANNING AND ECONOMIC AFFAIRS
29
Non-earmarked Resources: Spread and Delinquency RatesAverage SpreadIn percentage points (pp)
Source: Central Bank of Brazil.
Average Spread
Average Delinquency Rate% Non-performing loans (by 90 days or more)
Average Delinquency Rate

Endividamento das Famílias
SECRETARIAT OF PLANNING AND ECONOMIC AFFAIRS
30
Official Interest Rates Evolution (Target Selic and TJLP)
Source: Central Bank of Brazil.
Selic and Long Term (TJLP)Official Interest Rates (% py)
Target Selic

Endividamento das Famílias
SECRETARIAT OF PLANNING AND ECONOMIC AFFAIRS
31
Ex-ante and Ex-post Real Interest Rates
Ex-ante and Ex-post Real (Interbank CDI/IPCA)Interest Rates (% py)
Ex-ante Real Interest Rate*
Ex-post Real Interest Rate**
Source: Central Bank of Brazil. * Ex-ante Real Interest Rate = Expected Interbank CDI/IPCA ratio, considering 360-days Swap DI-Pre rate and IPCA median of BCB-Focus Survey. ** Ex-post Real Interest Rate = Observed 12-months accumulated CDI/IPCA ratio.

Endividamento das Famílias
SECRETARIAT OF PLANNING AND ECONOMIC AFFAIRS
32
Sovereign Risk (EMBI+ BR)EMBI+ Brazil Spreadbasis points
Source: JPMorgan.
S&P and Fitch Investment Grade Period
240 bps (average from Apr-2008 to Sep-2015)

Endividamento das Famílias
SECRETARIAT OF PLANNING AND ECONOMIC AFFAIRS
33
Daily Nominal Exchange Rate R$/US$
Nominal Exchange Rate R$/US$
Source: Central Bank of Brazil. *Volatility = 5-days Moving Coefficient of Variation.
Nominal Exchange Rate Volatility*
Volatility Nominal Exchange Rate (R$/US$)
15.7% of BRLdevaluation to USD

Endividamento das Famílias
SECRETARIAT OF PLANNING AND ECONOMIC AFFAIRS
34
Trade Balance on Goods (52 weeks daily average)
Trade Balance on Goods52-weeks Accumulated FiguresUS$ millions FOB
Source: SECEX/MDIC.
Trade Balance on Goods
Total Exports
Total Imports
Total Exports and Total Imports52-weeks Moving Average
US$ millions FOB

Endividamento das Famílias
SECRETARIAT OF PLANNING AND ECONOMIC AFFAIRS
35
Brazilian Exports Evolution by Country of Destination
Source: MDIC/SECEX
% of Exports Value
China European United Argentina Chile Japan Mexico India Singapore Uruguay Korea Saudi ArabiaUnion States
( Ac. until Oct/18)

Endividamento das Famílias
SECRETARIAT OF PLANNING AND ECONOMIC AFFAIRS
36
Current Account Deficit as % of GDP
Source: Central Bank of Brazil.
Current Account as % of GDP12-month Figures

Endividamento das Famílias
SECRETARIAT OF PLANNING AND ECONOMIC AFFAIRS
37
Direct Investments and Components
Source: Central Bank of Brazil.
Direct Investments Abroad
FDI – Intercompany Operations
FDI – Equity Participation
Direct Investment FlowsNet Inflow (+) and Net Outflow (-)12-month Accumulated - US$ billions

Endividamento das Famílias
SECRETARIAT OF PLANNING AND ECONOMIC AFFAIRS
38
Primary Balance of Federal Government (as % GDP)
Primary Balance of Federal Government12-month Accumulated% of GDP
Primary Balance
Sources: STN/MF.*Excludes compulsory transfers to subnational entities
Net Primary Revenue and Primary Expenditure12-month Accumulated
% of GDP
Net Primary Revenue*
Primary Expenditure

Endividamento das Famílias
SECRETARIAT OF PLANNING AND ECONOMIC AFFAIRS
39
Public Sector Primary and Nominal Balance
Consolidated Public SectorPrimary and Nominal Balance12-month Accumulated% of GDP
PrimaryBalance
Source: Central Bank of Brazil.
Nominal Balance

Endividamento das Famílias
SECRETARIAT OF PLANNING AND ECONOMIC AFFAIRS
40
Public Sector Net Debt (as % GDP)
General Public Sector Net Debt (DSLP)% of GDP
Source: Central Bank of Brazil.
Implicit Interest Rate on DSLP12-month (%)
General Public Sector Net Debt Implicit Interest Rate

Endividamento das Famílias
SECRETARIAT OF PLANNING AND ECONOMIC AFFAIRS
41
World Major Economies GDP
GDP - real quarterly % chg. – seasonally adjusted data
Source: OECD.
CHINA
USA
EUROPEAN UNION
JAPAN

Endividamento das Famílias
MARKETEXPECTATIONS

Endividamento das Famílias
SECRETARIAT OF PLANNING AND ECONOMIC AFFAIRS
Market Expectations for 2018
Source: Focus Survey, Central Bank of Brazil.
Median of Market Expectations for 2018Consumer Inflation (IPCA) and GDP% p.a.
Median of Market Expectations for 2018Federal Government Primary Surplus
as % GDP
Federal Government Primary Surplus 2018
GDP 2018
43

Endividamento das Famílias
SECRETARIAT OF PLANNING AND ECONOMIC AFFAIRS
Market Expectations for 2019
Source: Focus Survey, Central Bank of Brazil.
Median of Market Expectations for 2019Consumer Inflation (IPCA) and GDP% p.a.
Median of Market Expectations for 2019Federal Government Primary Surplus
as % GDP
Federal Government Primary Surplus 2019
GDP 2019
44

Endividamento das Famílias
SECRETARIAT OF PLANNING AND ECONOMIC AFFAIRS
GDP: Median of Market Expectations
Source: Focus Survey, Central Bank of Brazil.
Real GDP chg. (%) - Median of Market Expectations
45

Endividamento das Famílias
SECRETARIAT OF PLANNING AND ECONOMIC AFFAIRS
Primary Surplus: Median of Market Expectations
Source: Focus Survey, Central Bank of Brazil.
Federal Government Primary Surplus (%) - Median of Market Expectations
46

Endividamento das Famílias
SECRETARIAT OF PLANNING AND ECONOMIC AFFAIRS
Consumer Price Index (IPCA): Median of Market Expectations
Source: Focus Survey, Central Bank of Brazil.
Consumer Price Index (IPCA) % p.a. - Median of Market Expectations
47

Endividamento das Famílias
SECRETARIAT OF PLANNING AND ECONOMIC AFFAIRS
Main Interest Rate (Selic target): Median of Market Expectations
Source: Focus Survey, Central Bank of Brazil.
Main Interest Rate (Selic target) - % p.a. end of period - Median of Market Expectations
48

Endividamento das Famílias
SECRETARIAT OF PLANNING AND ECONOMIC AFFAIRS
Nominal Exchange Rate: Median of Market Expectations
Source: Focus Survey, Central Bank of Brazil.
Nominal Exchange Rate (R$/US$) - end of period - Median of Market Expectations
49

Endividamento das Famílias
ECONOMICACTIVITY

Endividamento das Famílias
SECRETARIAT OF PLANNING AND ECONOMIC AFFAIRS
BCB/Focus:
Gross Domestic Product (IBGE) Q3 2018
% change
Agriculture 12.5% 0.3% 2.5% 0.5% 0.7% -0.3% 1.8% 0.4% 0.6% 0.16% 2.55% 3.00%
Industry -0.5% 0.8% 0.8% -0.3% 0.4% 0.9% 1.0% 1.3% 0.6% 1.25% 2.80% 2.75%
Services 0.5% 1.1% 1.2% 0.3% 0.5% 1.4% 1.5% 1.5% 1.2% 1.39% 1.39% 1.39%
GDP (market prices) 1.1% 0.9% 1.3% 0.2% 0.8% 1.1% 1.4% 1.4% 1.1% 1.32% 2.53% 2.50%
Household Expenditure 1.4% 1.8% 1.4% 0.1% 0.6% 2.0% 2.6% 2.3% 1.8%
Government Expenditure -0.9% -0.3% 0.3% -0.4% 0.3% 0.3% -0.1% 0.2% 0.1%
Gross Fixed Capital Formation -2.5% 3.0% 7.8% -1.3% 6.6% 4.5% 2.0% 4.3% 4.9%
Exports of Goods and Services 5.2% -2.9% 2.6% -5.1% 6.7% 1.5% 4.6% 3.3% 1.8%
Imports of Goods and Services (-) 5.0% 6.5% 13.5% -1.2% 10.2% 9.4% 7.0% 9.1% 9.9%
Economic Activity Indicators (BCB and IBGE) Q3 2018
% change
IBC-Br Economic Activity Index* 1.0% 0.9% 1.7% -0.8% 1.7% 1.1% 1.3% 1.4% 1.1%
LSPA: Grain Harvest 21.4% 1.0% -3.7% -5.7% 0.5% -5.3% 1.0% -3.7% -3.9%
PIM: Industrial Production 2.6% 1.7% 1.2% -2.8% 2.7% 1.9% 3.2% 2.7% 1.3%
PMC: Amplified Retail Sales 4.0% 4.7% 4.0% 0.4% 2.1% 5.2% 6.7% 5.8% 4.9%
PMS: Volume of Services -2.8% -3.0% 0.7% 0.3% 0.6% -1.3% -1.9% -1.0% -0.2%
2017Q2-2018 /
Q2-2017
2019 20202017Q2-2018 /
Q2-2017
Q3-2018 /
Q3-2017
Q2-2018 / Q1-
2018
(seasonally
adjusted)
Q3-2018 / Q2-
2018
(seasonally
adjusted)
Year-To-
Date
Q3-2018 /
Q3-2017
Q2-2018 / Q1-
2018
(seasonally
adjusted)
Q3-2018 / Q2-
2018
(seasonally
adjusted)
11/30/2018
Year-To-
Date
Q2-2018
accum. in
4-quarters
Q3-2018
accum. in
4-quarters
carry-over
20182018
Q2-2018
accum. in
4-quarters
Q3-2018
accum. in
4-quarters
carry-over
2018
51
GDP and Quarterly Economic Activity

Endividamento das Famílias
SECRETARIAT OF PLANNING AND ECONOMIC AFFAIRS
Source: IBGE/MP, Quarterly National Accounts Series.Note: Carry-over 2018 based on 2018 3rd quarter seasonally adjusted level compared to 2017 average.
Last 4Q / Previous 4Q (%)
Quarterly GDP
52

Endividamento das Famílias
SECRETARIAT OF PLANNING AND ECONOMIC AFFAIRS
Last 4Q / Previous 4Q (%)
Quarterly GDP by Activity Sector
Agriculture
Industry
Services
53
Source: IBGE/MP, Quarterly National Accounts Series.Note: Carry-over 2018 based on 2018 3rd quarter seasonally adjusted level compared to 2017 average.
GDP

Endividamento das Famílias
SECRETARIAT OF PLANNING AND ECONOMIC AFFAIRS
Last 4Q / Previous 4Q (%)
Quarterly GDP by Expenditure
Government Expenditure
Gross Fixed Capital Formation
Household Expenditure
54
Exports
Imports
Source: IBGE/MP, Quarterly National Accounts Series.Note: Carry-over 2018 based on 2018 3rd quarter seasonally adjusted level compared to 2017 average.

Endividamento das Famílias
SECRETARIAT OF PLANNING AND ECONOMIC AFFAIRS
Source: IBGE/MP, Quarterly National Accounts Series.
GDP and Economic Sectors Quarterly Volume IndicatorChained Series of the Seasonally Adjusted Index: 2007=100
Agriculture
Industry
Services
GDP
Quarterly GDP by Activity Sector
55

Endividamento das Famílias
SECRETARIAT OF PLANNING AND ECONOMIC AFFAIRS
Source: IBGE/MP, Quarterly National Accounts Series.
GDP and Demand Categories Quarterly Volume IndicatorChained Series of the Seasonally Adjusted Index: 2007=100
Government Expenditure
GDP
Gross Fixed Capital Formation
Exports of Goods and Services
Household Expenditure
Imports of Goods and Services
Quarterly GDP by Expenditure
56

Endividamento das Famílias
SECRETARIAT OF PLANNING AND ECONOMIC AFFAIRS
Agriculture Industry ServicesGDP
Annual GDP Real Growth by Activity Sector
Annual % of Change
57
Source: IBGE/MP, Quarterly National Accounts Series.Note: Carry-over 2018 based on 2018 3rd quarter seasonally adjusted level compared to 2017 average.

Endividamento das Famílias
SECRETARIAT OF PLANNING AND ECONOMIC AFFAIRS
Annual % of Change
HouseholdExpenditure
GovernmentExpenditure Gross Fixed
Capital Formation
Exports of Goods and Services
Annual GDP Real Growth by Expenditure
58
Source: IBGE/MP, Quarterly National Accounts Series.Note: Carry-over 2018 based on 2018 3rd quarter seasonally adjusted level compared to 2017 average.

Endividamento das Famílias
SECRETARIAT OF PLANNING AND ECONOMIC AFFAIRS
Source: IBGE/MP, Systematic Survey of Agricultural Production (LSPA) – October 2018.
Primary Sector GDPAnnual % of Change Major Crops Production (% of total)
Index: 1997=100
450Soybean (40,4%)
200Sugarcane (20,2%)
300Corn (12,4%)
Primary Sector Performance by Major Crops
59

Endividamento das Famílias
SECRETARIAT OF PLANNING AND ECONOMIC AFFAIRS
Industrial Production IndicatorsChained Series of the Seasonally Adjusted Index: 1995=100
Source: IBGE/MP, Quarterly National Accounts Series.
MiningIndustry
Manufacturing Industry 116.96
General Industry
ConstructionIndustry 129.04
Electricity and Gas, Water Supply, Sewage and Urban Sanitation Industry
Industry Performance by Subsectors
60

Endividamento das Famílias
SECRETARIAT OF PLANNING AND ECONOMIC AFFAIRS
Services Provision IndicatorsChained Series of the Seasonally Adjusted Index: 1995=100
Source: IBGE/MP, Quarterly National Accounts Series.
Retail 152.16
Other Services 159.50
Transportation, Storage and Mail Services 163.99
Public Administration Health and Education156.04
Services 174.42
Real Estate Services and Renting202.43
Financial Intermediation, Insurance, Social Security and Related Service Activities
Information Services
Services Performance by Subsectors
61

Endividamento das Famílias
SECRETARIAT OF PLANNING AND ECONOMIC AFFAIRS
Source: IBGE/MP, Quarterly National Accounts Series. * Domestic Absorption = GDP – Exports of Goods and Services + Imports of Goods and Services.
Domestic Volume and Absorption* Quarterly Volume IndicatorChained Series of the Seasonally Adjusted Index: 2007=100
Domestic Production (GDP)
Domestic Absorption*
Domestic Production and Absorption
62

Endividamento das Famílias
SECRETARIAT OF PLANNING AND ECONOMIC AFFAIRS
Disposable Income and Consumption% of GDP
Source: IBGE/MP, Quarterly National Accounts Series.
Savings and Investment% of GDPDisposable Income Consumption Savings Investment
Disposable Income, Consumption, Savings and Investment
63

Endividamento das Famílias
SECRETARIAT OF PLANNING AND ECONOMIC AFFAIRS
Inventory Change (% of GDP)Accumulated in 4 quarters
Source: IBGE/MP, Quarterly National Accounts Series.
GFCF and Total Investment (% of GDP)Accumulated in 4 quarters
Inventory Change
Gross Fixed Capital Formation (GFCF)
Total Investment = GFCF + Inventory Change
Inventory Change and Gross Fixed Capital Formation
64

Endividamento das Famílias
SECRETARIAT OF PLANNING AND ECONOMIC AFFAIRS
Quarterly % Change - Seasonally Adjusted Series
Sources: IBGE/MP and Central Bank of Brazil.
GDPIBC-Br
Economic Activity Index
Quarterly GDP Growth and IBC-Br Economic Activity Index
65

Endividamento das Famílias
SECRETARIAT OF PLANNING AND ECONOMIC AFFAIRS
IBC-Br Economic Activity Index September-18
% change
IBC-Br Economic Activity Index -4.0% 1.03% 2.3% 0.7% 0.5% -0.1% 1.1% 1.4% 1.4% 1.1%
Systematic Survey of Agricultural Production (IBGE) October-18
% change
Grain Harvest -11.3% 21.4% -6.5% -6.0% 0.2% 0.4% -5.6% -6.5% -6.0% -3.8%
Industry Production (IBGE) October-18
% change
General Industry -6.4% 2.6% -2.2% 1.1% -1.8% 0.2% 1.8% 2.7% 2.3% 1.0%
Mining Industry (weight 11,2%) -9.4% 4.5% 1.4% 0.2% -0.7% 3.1% 0.2% 0.3% 0.1% 1.2%
Manufacturing Industry (weight 88,8%) -6.0% 2.3% 1.7% -2.6% -1.6% 0.0% 2.1% 3.6% 3.1% 1.2%
Food (weight 13,9%) 0.5% 1.2% -6.6% -12.2% -1.5% -2.0% -4.1% -0.8% -2.4% -5.8%
Petroleum refinement and alcohol production (weight 10,3%) -8.5% -4.2% 3.8% -4.5% -1.7% -1.2% 1.9% 2.2% 1.4% 0.9%
Motor vehicles (weight 10,1%) -12.1% 17.8% 14.5% 2.9% -5.2% 3.0% 16.3% 19.9% 18.2% 13.9%
Capital Goods -10.2% 6.6% 9.1% 3.6% -1.8% 1.5% 8.4% 9.5% 9.1% 8.4%
Intermediate Goods -6.5% 1.7% 0.9% -2.6% -1.2% -0.3% 1.0% 2.2% 1.8% 0.0%
Durable Consumer Goods -14.4% 13.2% 9.7% -4.5% -6.6% 4.4% 11.6% 15.0% 13.1% 9.0%
Semi and Non-Durable Consumer Goods -3.2% 0.9% -0.7% -1.8% -0.9% -0.2% 0.0% 0.9% 0.8% -0.1%
Typical Construction Inputs -11.6% -3.2% 1.4% 0.9% -6.4% 6.8% 1.4% 2.0% 2.1% 3.3%
Retail Sales (IBGE) September-18
% change
Retail Sales -6.3% 2.1% 4.1% 0.1% 2.0% -1.3% 2.3% 3.3% 2.8% 2.1%
Amplified Retail Sales -8.7% 4.0% 6.9% 2.2% 4.2% -1.5% 5.2% 6.4% 5.8% 5.0%
Vehicles, Motorcycles, Parts and Accessories -14.0% 2.7% 15.8% 11.1% 5.5% -0.1% 15.7% 14.1% 14.1% 15.9%
Construction Material -10.7% 9.1% 5.9% -1.6% 3.4% -1.7% 3.9% 7.8% 6.3% 3.3%
Fuel and Lubricants -9.2% -3.3% -1.9% -4.9% 1.3% -4.9% -5.8% -5.1% -5.2% -5.2%
Hypermarkets, Supermarkets, Food, Beverage and Tobacco -3.1% 1.5% 5.5% 0.4% 1.8% -3.9% 4.4% 4.8% 4.4% 3.4%
Textiles, Apparel and Footwear -10.9% 7.6% 2.9% 1.2% 0.4% -9.0% -3.0% 0.7% 0.0% -1.2%
Furniture and Household Appliances -12.6% 9.5% -3.1% -2.2% -3.8% -4.9% -1.0% 3.6% 2.3% -0.6%
Volume of Services (IBGE) September-18
% change
Volume of Services -5.0% -2.8% 1.7% 0.4% 1.4% -0.3% -0.4% -0.6% -0.3% -0.2%
Services Rendered to Families -4.4% -1.1% 4.9% 0.5% -0.7% 1.4% -0.9% -1.2% -0.4% 0.3%
Information and Communication Services -3.2% -2.0% -1.1% 2.3% -0.5% 0.4% -1.6% -1.8% -1.6% -1.0%
Professional, Administrative and Complementary Services -5.5% -7.3% 0.6% -2.4% 3.1% -1.4% -1.8% -3.8% -3.2% -1.4%
Transportation, Support Activities for Transportation and Mailing Activities -7.6% 2.2% 4.4% 1.5% 2.8% -1.3% 1.3% 2.8% 2.8% 1.4%
Other Services -2.8% -8.9% 1.2% -4.0% 1.0% -3.2% 2.3% -1.8% -0.9% 0.4%
2017
2017
2017
2017
2017
carry-over 20182016 set/yy- set/yy out/yy- out/yy
set/yy - ago/yy
(seasonally
adjusted)
out/yy - set/yy
(seasonally
adjusted)
Year-To-Dateago/yy accum. in
12-months
Year-To-Dateset/yy accum. in 12-
months
out/yy accum. in 12-
months
Year-To-Dateset/yy accum. in 12-
months
out/yy accum. in 12-
monthscarry-over 2018
2016 ago/yy- ago/yy
2016 set/yy- set/yy out/yy- out/yy
set/yy - ago/yy
(seasonally
adjusted)
out/yy - set/yy
(seasonally
adjusted)
set/yy accum. in 12-
monthscarry-over 2018set/yy- set/yy
ago/yy - jul/yy
(seasonally
adjusted)
set/yy - ago/yy
(seasonally
adjusted)
Year-To-Dateago/yy accum. in
12-months
set/yy accum. in 12-
monthscarry-over 2018
set/yy accum. in 12-
monthscarry-over 2018Year-To-Date
ago/yy accum. in
12-months
set/yy - ago/yy
(seasonally
adjusted)
2016 ago/yy- ago/yy set/yy- set/yy
ago/yy - jul/yy
(seasonally
adjusted)
set/yy - ago/yy
(seasonally
adjusted)
2016 ago/yy- ago/yy set/yy- set/yy
ago/yy - jul/yy
(seasonally
adjusted)
66
Monthly Economic Activity

Endividamento das Famílias
SECRETARIAT OF PLANNING AND ECONOMIC AFFAIRS
67
Major Monthly Economic Activity Indicators
Sources: Central Bank of Brazil and IBGE/MP: Systematic Survey of Agricultural Production (LSPA), Monthly Survey of Industry (PIM), Monthly Survey of Trade (PMC), and Monthly Survey of Services (PMS).
IBC-Br, Grain Harvest (12-mo MA) and Industry ProductionSeasonally Adjusted Index (2003 = 100) Amplified Retail Sales and Volume of Services
Seasonally Adjusted Index (2003 = 100)
Industry Production
Grain Harvest (12-mo MA)
Amplified Retail Sales
Volume of Services

Endividamento das Famílias
SECRETARIAT OF PLANNING AND ECONOMIC AFFAIRS
68
Major Monthly Economic Activity Indicators
IBC-Br(YoY %)
IBC-Br, LSPA, PIM, PMC and PMS(YoY %)
Sources: Central Bank of Brazil and IBGE/MP: Systematic Survey of Agricultural Production (LSPA), Monthly Survey of Industry (PIM), Monthly Survey of Trade (PMC), and Monthly Survey of Services (PMS).
Industry Production - PIM
Grain Harvest (12-mo MA) - LSPA
Amplified Retail Sales - PMC
Volume of Services - PMS

Endividamento das Famílias
SECRETARIAT OF PLANNING AND ECONOMIC AFFAIRS
69
Sources: Central Bank of Brazil and IBGE/MP: Systematic Survey of Agricultural Production (LSPA), Monthly Survey of Industry (PIM), Monthly Survey of Trade (PMC), and Monthly Survey of Services (PMS).
General Industry Physical Production
Capacity Utilization Rate
Industry ProductionSeasonally Adjusted Index (2003 = 100)
Capacity UtilizationSeasonally Adjusted - % of Total Capacity
Industrial Production and Capacity Utilization

Endividamento das Famílias
SECRETARIAT OF PLANNING AND ECONOMIC AFFAIRS
Total Industrial Production and Economic Categories
Source: IBGE/MP, Monthly Survey of Industry (PIM). Note: Carry-over 2018 based on Oct-2018 compared to 2017 average.
General IndustryMining
IndustryCapital Goods
Intermediate Goods
Durable Consumer
Goods
Semi and Non-Durable
Consumer Goods
Typical Construction
Inputs
YoY %
(Oct/ 2018)
70

Endividamento das Famílias
SECRETARIAT OF PLANNING AND ECONOMIC AFFAIRS
Total Industrial Production and Economic Categories
Mining Industry
Capital Goods
Durable Consumer Goods
General Industry
Typical Construction Inputs
Semi and Non-Durable Consumer Goods
Intermediate Goods
Industry Physical Production by Economic CategorySeasonally Adjusted Index (2002 = 100)
Source: IBGE/MP, Monthly Survey of Industry (PIM).
71

Endividamento das Famílias
SECRETARIAT OF PLANNING AND ECONOMIC AFFAIRS
Total Retail Sales and Subsectors
Source: IBGE/MP, Monthly Survey of Trade (PMC).Note: Carry-over 2017 based on Sep-2018 compared to 2017 average.
Amplified Retail Trade Sales
Vehicles, Motorcycles, Parts
and Accessories
Construction Material
Fuel and Lubricants
Hypermarkets, Supermarkets, Food,
Beverage and Tobacco
Textiles, Apparel and
Footwear
Furniture and Household Appliances
YoY %
(Sep 2018)
72

Endividamento das Famílias
SECRETARIAT OF PLANNING AND ECONOMIC AFFAIRS
Total Retail Sales and Subsectors
Textiles, Apparel and Footwear
Vehicles, Motorcycles, Parts and Accessories
Fuel and Lubricants
Amplified Retail Sales
Furniture and Household Appliances
Hypermarkets, Supermarkets, Food, Beverage and Tobacco
Construction Material
Retail Sales by SubsectorSeasonally Adjusted Index (2002 = 100)
Source: IBGE/MP, Monthly Survey of Trade (PMC).
73

Endividamento das Famílias
SECRETARIAT OF PLANNING AND ECONOMIC AFFAIRS
74
Volume of Services and Subsectors
Source: IBGE/MP, Monthly Survey of Services (PMS).Note: Carry-over 2017 based on Sep-2018 compared to 2017 average.
YoY %
Volume of Services Services Rendered to Families
Information and Communication
Services
Professional, Administrative and
Complementary Services
Transportation, Support Activities for Transportation
and Mailing Activities
Other Services
(Sep 2018)

Endividamento das Famílias
SECRETARIAT OF PLANNING AND ECONOMIC AFFAIRS
75
Other Services
Professional, Administrative and Complementary Services
Volume of Services
Services Rendered to Families
Transportation, Support Activities for Transportation and Mailing Activities
Information and Communication Services
Volume of Services by SubsectorSeasonally Adjusted Index (2002 = 100)
Source: IBGE, Monthly Survey of Services (PMS).
Total Services and Subsectors

Endividamento das Famílias
SECRETARIAT OF PLANNING AND ECONOMIC AFFAIRS
% change
Industry Indicators (CNI)
Real Sales Revenue -0.1% 6.9% 3.0% 1.3% -1.8% 5.0% 5.7% 5.6% 3.8%
Working Hours in Production -2.1% 0.2% -1.9% 0.2% -0.7% 0.4% 0.4% 0.4% 0.1%
Capacity Utilization - UCI effecitve level: 78.5 0.4% 0.5% -0.3% 0.4% -0.9% 0.6% 1.0% 0.9% 0.2%
Industry Inventories (CNI) - Final Goods - planned x realized effecitve level: 50.8 1.0% 2.4% 1.0% -0.2% 1.2% 0.8% 0.8% 0.7% 0.8%
Supermarket Sector Total Retail Sales (ABRAS) 1.3% 0.5% 1.6% -0.7% 0.0% 2.2% 2.1% 2.3% 1.9%
Total Vehicles Production (ANFAVEA) 24.0% -6.1% 5.2% -4.3% 0.1% 9.9% 12.5% 10.0% 7.7%
Car Production 26.1% -8.0% 5.4% -5.3% 2.0% 8.2% 10.9% 8.6% 6.6%
Commercial Vehicles Production 37.3% 19.9% 31.8% 8.2% 5.5% 30.6% 37.9% 34.9% 25.5%
Total Vehicles Exports (ANFAVEA) 48.3% -34.5% -37.3% -17.3% -8.4% -10.9% -0.4% -6.8% -14.3%
Total Vehicles Sales/Licensing (FENABRAVE) 9.2% 7.1% 25.6% 4.7% 1.5% 15.3% 14.1% 14.2% 16.5%
Domestic Vehicles Sales/Licensing 12.3% 4.5% 24.1% 4.4% 1.7% 13.4% 13.0% 12.8% 14.9%
Imported Vehicles Sales/Licensing -10.7% 29.7% 38.7% 6.6% -0.9% 30.2% 22.8% 25.0% 30.4%
Natural Gas and Oil Production (ANP) 4.4% -6.7% -0.8% -2.4% 6.0% -1.8% -1.8% -1.9% -1.3%
Electric Energy Consumption - Total (EPE) 1.2% 0.3% 1.1% 0.6% 0.2% 1.1% 1.5% 1.3% 1.1%
Industry Consumption (EPE) 1.3% 1.2% 0.8% 0.3% -0.4% 1.5% 2.0% 1.9% 1.2%
Electric Energy System Supply (ONS) 1.5% 1.9% -0.1% -0.6% 0.3% 1.3% 1.8% 1.6% 1.1%
Corrugated Fiberboard Sales (ABPO) 4.9% -0.3% 4.6% -1.2% 0.6% 2.3% 3.2% 2.9% 2.2%
Heavy Vehicles Road Traffic (ABCR) 0.8% -1.5% 1.8% -1.5% 0.3% 0.8% 1.9% 1.3% 0.5%
% change
Business Confidence - ICEI (CNI) effecitve level: 63.2 19.7% -5.2% -4.1% -0.6% 2.8% 3.4% 6.2% 5.2% 4.6%
Consumer Expectations - INEC (CNI) effecitve level: 113.6 0.3% 7.5% 9.3% 2.1% 2.4% 1.7% 0.2% 1.3% 3.4%
Sao Paulo Industry Confidence - ICEI-SP (FIESP) effecitve level: 64.9 26.1% -8.8% 12.1% 3.6% 25.8% 2.4% 4.6% 4.6% 2.9%
Industry Capacity Utilization - NUCI (FGV) effecitve level: 77.3 0.7% 2.5% 0.9% -0.7% -1.6% 2.2% 2.2% 2.2% 2.1%
Industry Confidence (FGV) effecitve level: 94.9 12.5% -1.6% -2.8% -2.1% 0.2% 7.7% 9.9% 8.5% 6.6%
Consumer Confidence (FGV) effecitve level: 95.0 13.1% -0.6% 6.1% 4.9% 8.2% 4.6% 6.0% 5.6% 4.9%
Services Confidence (FGV) effecitve level: 93.5 14.6% 0.7% 6.7% 1.0% 5.8% 7.0% 8.2% 7.8% 6.6%
Construction Confidence (FGV) effecitve level: 83.7 8.5% 5.7% 8.0% 1.9% 3.5% 7.7% 8.2% 8.2% 7.4%
Retail Confidence (FGV) effecitve level: 103.1 15.2% -1.0% 0.1% -1.3% 4.3% 7.1% 10.0% 8.7% 7.6%
nov/yy - out/yy
(seasonally
adjusted)
Year-To-Dateout/yy accum. in
12-months
nov/yy accum.
in 12-monthscarry-over 2018
November-18
2017 out/yy- out/yy nov/yy- nov/yy
out/yy - set/yy
(seasonally
adjusted)
out/yy - set/yy
(seasonally
adjusted)
Year-To-Dateset/yy accum. in
12-months
out/yy accum. in
12-monthscarry-over 2018
October-18
2017 set/yy- set/yy out/yy- out/yy
set/yy - ago/yy
(seasonally
adjusted)
76
Other Monthly Economic Activity Indicators

Endividamento das Famílias
SECRETARIAT OF PLANNING AND ECONOMIC AFFAIRS
77
CNI: Business Confidence and Consumers Expectation Indexes
Business Confidence Index – ICEI3-month moving average
Source: CNI.
Consumers Expectation Index – INEC3-month moving average
Business Confidence Index
Consumers Expectation Index

Endividamento das Famílias
SECRETARIAT OF PLANNING AND ECONOMIC AFFAIRS
78
FIESP: Industry Confidence Index
Sao Paulo Industry Confidence - ICEI-SP3-month moving average
Source: FIESP.

Endividamento das Famílias
SECRETARIAT OF PLANNING AND ECONOMIC AFFAIRS
79
FGV: Economic Confidence Indicators
Economic Confidence Indicators3-month moving average
Source: IBRE/FGV.
Industry96.43
Retail97.20
Consumers88.77
Services 90.30
Construction Industry 81.50

Endividamento das Famílias
SECRETARIAT OF PLANNING AND ECONOMIC AFFAIRS
80
Gross Fixed Capital Formation and Investment Intention
Gross Fixed Capital Formation (Quarterly National Accounts)Chained Series of the Seasonally Adjusted Index: 1995=100
Source: IBGE/MP e IBRE/FGV.*Note: Measures the difference between positive and negative answers, plus 100.
Investment Intention Indicator*IBRE/FGV Investments Survey
Investment Intention Indicator
Gross Fixed Capital Formation

Endividamento das Famílias
SECRETARIAT OF PLANNING AND ECONOMIC AFFAIRS
81
IFO / FGV: Business Climate Index - Brazil
Business Climate – Brazil
Source: IFO and FGV.
Favourable Area
Unfavourable Area
ExpectationIndexBrazil
Business ClimateIndexBrazil
Current SituationIndex

Endividamento das Famílias
SECRETARIAT OF PLANNING AND ECONOMIC AFFAIRS
82
CNI: Fear of Unemployment Index
Fear of Unemployment and Life Satisfaction (CNI)3-month moving average
Source: CNI.

Endividamento das Famílias
SECRETARIAT OF PLANNING AND ECONOMIC AFFAIRS
83
Bankruptcy and Judicial Reorganization Requests
Number of Bankruptcy Requests12-month Accumulated
Source: Serasa-Experian.
Number of Requests for Judicial Reorganization12-month Accumulated
Judicial Reorganization Requests
Bankruptcy Requests

Endividamento das Famílias
SECRETARIAT OF PLANNING AND ECONOMIC AFFAIRS
84
ABRAS: Supermarket Sector Total Retail Sales
Total Retail SalesSeasonally Adjusted Data*
Source: ABRAS. * Seasonally adjusted by SEPLAN/MP.

Endividamento das Famílias
SECRETARIAT OF PLANNING AND ECONOMIC AFFAIRS
85
CNI: Industry Real Sales Revenues and Working Hours
Real Sales RevenueManufacturing IndustrySeasonally Adjusted Data
Source: CNI.
Working Hours in ProductionManufacturing Industry
Seasonally Adjusted DataReal Sales Revenue
Working Hours

Endividamento das Famílias
SECRETARIAT OF PLANNING AND ECONOMIC AFFAIRS
86
CNI: Industry Inventory
General Industry Inventories LevelFinal Goods - planned x effective
Source: CNI.

Endividamento das Famílias
SECRETARIAT OF PLANNING AND ECONOMIC AFFAIRS
87
Capacity Utilization Rate
Capacity Utilization Rate - UCI (CNI)Seasonally Adjusted Data
Source: CNI and FGV.
Industry Capacity Utilization Rate – NUCI (FGV)Seasonally Adjusted Data

Endividamento das Famílias
SECRETARIAT OF PLANNING AND ECONOMIC AFFAIRS
88
Anfavea: Automotive Sector Production
Total Vehicles and Car ProductionDaily Average of Vehicles Monthly ManufacturedSeasonally Adjusted Data*
Source: ANFAVEA. * Seasonally adjusted by SEPLAN/MP.
Commercial Vehicles ProductionDaily Average of Vehicles Monthly Manufactured
Seasonally Adjusted Data*
Total Vehicles Production
Car Production
Commercial Vehicles Production

Endividamento das Famílias
SECRETARIAT OF PLANNING AND ECONOMIC AFFAIRS
89
Automotive Sector Production, Sales and Inventory Change
Inventory ChangeDaily Average
Source: ANFAVEA and FENABRAVE. * Seasonally adjusted by SEPLAN/MP.
Production, Sales/Licensing and ExportsDaily Average - Seasonally Adjusted Data*
Inventory Change
Production of Domestic Vehicles
Sales/Licensing of Domestic Vehicles
Exports of Domestic Vehicles

Endividamento das Famílias
SECRETARIAT OF PLANNING AND ECONOMIC AFFAIRS
90
ANP: Natural Gas and Oil Production
Natural Gas and Oil ProductionMillions of Barrels of Oil Equivalent (BOE) per Month
Source: ANP.

Endividamento das Famílias
SECRETARIAT OF PLANNING AND ECONOMIC AFFAIRS
91
ANEEL: Electrical Energy Consumption
Total Electric Energy ConsumptionMillions of MWhSeasonally Adjusted Data*
Source: ANEEL. * Seasonally adjusted by SEPLAN/MP.
Electric Energy Industrial ConsumptionMillions of MWh
Seasonally Adjusted Data*
Total Consumption
Industrial Consumption

Endividamento das Famílias
SECRETARIAT OF PLANNING AND ECONOMIC AFFAIRS
92
ONS: Electric Energy System Supply
Electric Energy System SupplyMillions of MWhSeasonally Adjusted Data*
Source: ONS. * Seasonally adjusted by SEPLAN/MP.

Endividamento das Famílias
SECRETARIAT OF PLANNING AND ECONOMIC AFFAIRS
93
ABPO: Corrugated Fiberboard Sales
Corrugated Fiberboard Sales1.000 of TonsSeasonally Adjusted Data*
Source ABPO. * Seasonally adjusted by SEPLAN/MP.

Endividamento das Famílias
SECRETARIAT OF PLANNING AND ECONOMIC AFFAIRS
94
ABCR: Heavy Vehicles Road Traffic Index
Heavy Vehicles Road Traffic IndexIndex: 1999=100Seasonally Adjusted Data
Source: ABCR.

Endividamento das Famílias
LABORMARKET

Endividamento das Famílias
SECRETARIAT OF PLANNING AND ECONOMIC AFFAIRS
96
Labor Market
Employment Indicators October-18
Brasil (PNADC, IBGE)
Unemployment Rate % Labor Force 11.3 12.8 12.5 11.7 1.5 pp -0.5 pp -0.5 pp 1.5 pp 1.5 pp
Unemployed Population (in thousands) 166,189 168,210 169,581 170,360 1.2% 0.9% 0.9% 1.2% 1.2%
Labor Force (in thousands) 102,033 103,743 104,497 105,252 1.7% 0.8% 0.9% 1.7% 1.7%
Employed Population (in thousands) 90,539 90,495 91,629 92,901 0.0% 1.5% 1.5% 0.0% 0.0%
Working Age Population (in thousands) 11,494 13,248 12,868 12,351 15.3% -3.6% -3.1% 15.3% 15.3%
São Paulo Unemployment Rate % (RMSP, PED-Seade) 16.6 18.0 17.4 11.7 1.4 pp -1.4 pp -1.6 pp -1.4 pp -1.0 pp
Average Real Earnings (PNADC, IBGE) October-18
real values (in R$ of last month)
Employed Population 2,167 2,218 2,235 2,230 2.3% 0.6% 0.4% 2.3% 2.3%
Formal Contract 2,087 2,129 2,145 2,132 2.0% 0.3% -0.4% 2.0% 2.0%
Informal Contract 1,272 1,279 1,292 1,341 0.6% 1.4% 2.6% 0.6% 0.6%
Self-employed 1,635 1,618 1,627 1,606 -1.0% -0.2% -0.1% -1.0% -1.0%
Public Sector 3,402 3,460 3,524 3,528 1.7% 3.1% 3.0% 1.7% 1.7%
Real Wage Bill (in R$ milions of last months) 191,276 195,621 199,651 201,964 2.3% 2.2% 1.9% 2.3% 2.3%
Percentage of the Minimum Wage to Purchase the Basic Food Basket (Dieese) 46.3% 44.2% 43.2% 42.3% 1.0 pp 0.0 pp 0.0 pp -0.2% -3.0%
Formal Jobs (CAGED, MTE) October-18
Million people
Net Formal Jobs Creation -1,327 -13 474 444 791 58 -99.0% -3619.8% 237.1%
Job Oppenings 14,847 14,762 15,232 15,274 13,152 1,280 -0.6% 3.5% 104.0%
Job Separations 16,174 14,775 14,758 14,829 12,362 1,222 -8.7% 0.4% 100.4%
2016
average
2017
average
Oct/18
(12-months
moving
average)
Oct-18chg.% 2017
/ 2016
chg.% YTD
2018 / YTD
2017
chg.%
Oct/18 -
2017
average
chg.%
Sep/18-
Sep/17
chg.%
Oct/18-
Oct/17
chg.% YTD
2018 / YTD
2017
chg.%
Oct/18 -
2017
average
Oct-18chg.% 2017
/ 2016
chg.% Oct/18
accum.12-m /
2017
chg.% YTD
2018 / YTD
2017
2016
average
2017
average
Oct/18
(12-months
moving
average)
Oct-18
2016 2017
Sep/18
accum. in 12-
months
Oct/18
accum. in
12-months
Year-To-
Date
chg.% 2017
/ 2016
chg.%
Sep/18-
Sep/17
chg.%
Oct/18-
Oct/17

Endividamento das Famílias
SECRETARIAT OF PLANNING AND ECONOMIC AFFAIRS
97
Unemployment Rate and Net Formal Job Creation
Net Formal Jobs Creation12-Month Accumulated Figures
Sources: IBGE/MP - PNADC, SEADE-PED and MTE-CAGED (adjusted data).
Brazil and Sao Paulo Unemployment Rate% of Labor Force
Net Jobs Created
Brazil Unemployment Rate

Endividamento das Famílias
SECRETARIAT OF PLANNING AND ECONOMIC AFFAIRS
98
Net Formal Job Creation – Total Accumulation of Year
Source: MTE-CAGED (adjusted data).
Net Formal Job Creation - Accumulation of year to reference month

Endividamento das Famílias
SECRETARIAT OF PLANNING AND ECONOMIC AFFAIRS
99
Employed Population and Labor Force Evolution
Labor ForceIn 1.000 people
Source: IBGE/MP - PNADC.
Employed PopulationIn 1.000 people
Labor Force
Employed Population

Endividamento das Famílias
SECRETARIAT OF PLANNING AND ECONOMIC AFFAIRS 100
12-Month Total Unemployment Increase Decomposition
Source: IBGE/MP -- PNADC.
Losed Jobs
Labor Force Change Employed Population
Created Jobs

Endividamento das Famílias
SECRETARIAT OF PLANNING AND ECONOMIC AFFAIRS
101
Labor Market Evolution by Employment Type
Source: IBGE/MP - PNADC. Note: *Formal contract includes both private and public sectors and Self-Employed includes home-workers and family-workers.
Employment Rate(Employed Population / Labor Force)
Formal and Informal Contract Workers, Self-Employed and Employers% of Employed Population
Formal Contract Workers*
Self-Employed*
Employment Rate
Informal Contract Workers*
Employers

Endividamento das Famílias
SECRETARIAT OF PLANNING AND ECONOMIC AFFAIRS
102
Employment by Sector of Activity
Source: IBGE/MP - PNADC.
Employed Population by Sectors of ActivityIndex: 2013 = 100
Public Sector
Industry
Financial Services, TI and Real Estate Sector
Retail Sector
Agriculture and Livestock84.94
Transportation Sector
Construction Industry 84.98
Food Sector

Endividamento das Famílias
SECRETARIAT OF PLANNING AND ECONOMIC AFFAIRS
103
Real Wage Bill and Average Real Earning
Average Real EarningR$ of last month
Real Wage BillR$ millions of last month
Source: IBGE/MP - PNADC.
Real Wage Bill Average Real Earning

Endividamento das Famílias
INFLATION

Endividamento das Famílias
SECRETARIAT OF PLANNING AND ECONOMIC AFFAIRS
BCB/Focus:
Inflation Index October-18
IPCA Inflation Target (CMN) 4.5% 4.5% 4.5% 4.50% 4.25% 4.00%
Consumer Price Index IPCA (IBGE) 6.29% 2.95% 4.56% 2.21% 3.81% 0.19% 0.16% 0.42% -0.09% 0.48% 0.45% 3.89% 4.11% 4.00%
IPCA core (By exclusion food and energy - Ex2) 6.2% 3.8% 3.6% 3.3% 3.0% 0.5% 0.1% 0.4% 0.3% 0.6% 0.7%
Food and Beverages 8.6% -1.9% 3.3% -2.0% 3.2% -0.5% -1.1% -0.4% -0.1% -0.3% 0.1%
Housing 2.8% 6.3% 6.5% 5.4% 5.6% 1.6% 0.6% -0.1% 1.5% 0.4% 0.4%
Household Articles 3.4% -1.5% 2.2% -1.1% 2.7% -0.2% 0.2% 0.1% 0.5% 0.6% 0.1%
Apparel 3.5% 2.9% 0.8% 1.9% -0.1% -0.4% 0.3% 0.3% -0.6% 0.2% 0.0%
Transportation 4.2% 4.1% 7.4% 2.3% 5.5% 0.3% 1.5% 0.8% 0.5% -1.2% 1.7%
Health and Personal Care 11.0% 6.5% 5.1% 5.7% 4.4% 0.4% 0.4% 0.3% 0.1% 0.5% 0.3%
Personal Expenses 8.0% 4.4% 3.2% 3.5% 2.3% 0.4% 0.3% 0.6% 0.3% 0.4% 0.4%
Education 8.9% 7.1% 5.2% 6.9% 5.0% 0.0% 0.2% 0.0% -0.1% 0.3% 0.2%
Communication 1.3% 1.8% 0.0% 1.7% 0.0% 0.0% -0.6% 0.5% 0.1% 0.0% -0.1%
Consumer Price Index INPC (IBGE) 6.58% 2.07% 4.00% 1.62% 3.55% 0.17% -0.03% -0.02% 0.25% 0.00% 0.30% 3.94% 4.23% 4.00%
São Paulo Cost-of-Living Index ICV SP (DIEESE) 6.15% 2.44% 4.21% 2.01% 3.76% 0.13% -0.01% 0.20% 0.14% -0.09% 0.55%
São Paulo Consumer Price Index IPC RMSP (FIPE) 6.55% 2.28% 4.55% 1.43% 3.68% -0.01% 0.10% 0.02% 0.23% 0.41% 0.39% 3.40% 4.05% 4.00%
General Price Index IGP-DI (FGV) 7.15% -0.42% 10.51% -1.94% 8.83% -0.30% 0.24% 0.62% 0.44% 0.68% 1.79% 8.59% 4.44% 4.10%
Consumer Price Subindex IPC/Br-DI 6.19% 3.22% 4.81% 2.64% 4.21% 0.38% 0.13% -0.02% 0.17% 0.07% 0.45%
Construction Cost Subindex INCC-DI 6.10% 4.25% 3.96% 3.85% 3.56% 0.30% 0.36% 0.06% 0.61% 0.15% 0.23%
Wholesale Price Subindex IPA-DI 7.73% -2.52% 13.91% -4.56% 11.53% -0.67% 0.26% 0.97% 0.52% 0.99% 2.54% 11.60% 4.20% 4.50%
IPA-DI Industry 6.71% 1.22% 14.31% -1.05% 11.74% -0.41% 0.96% 1.05% 0.93% 0.69% 2.69%
IPA-DI Agriculture 9.92% -12.34% 12.83% -13.78% 10.98% -1.42% -1.81% 0.75% -0.69% 1.90% 2.11%
Inflation Index November-18
Consumer Price Index IPCA - 15 (IBGE) 6.58% 2.94% 4.39% 2.58% 4.03% 0.11% 0.34% 0.32% 0.09% 0.58% 0.19% 4.23% 4.20% 4.00%
General Price Index IGP-10 (FGV) 6.97% -0.42% 10.25% -1.31% 9.26% 0.39% 0.49% 0.24% 1.20% 1.43% -0.16%
General Price Index IGP-M (FGV) 7.19% -0.53% 10.23% -1.41% 9.26% 0.47% 0.20% 0.52% 1.52% 0.89% -0.49% 8.91% 4.48% 4.00%
Aug-17 Sep-17 Aug-18
2020Sep-17 Oct-17 Nov-17 Sep-18 Oct-18 Nov-18 2018 2019
11/30/2018
Oct-17 Oct-18Sep-18 2018 2019 20202016 2017
Accum. In
12-
months
YTD 2017YTD
2018
2016 2017
Accum. In
12-
months
YTD 2017YTD
2018
105
Inflation

Endividamento das Famílias
SECRETARIAT OF PLANNING AND ECONOMIC AFFAIRS
106
Relative Prices Convergence in the Consumer Price Index
Source: IBGE/MP.
Inflation Rate (% per annum)
IPCA Monitored Prices Market Prices
Au
gust
12-
mo
nth
s ac
cum
ula
ted

Endividamento das Famílias
SECRETARIAT OF PLANNING AND ECONOMIC AFFAIRS
107
Consumer Price Index (IPCA) and Subindexes
Source: IBGE/MP.
Consumer Price Index and Subindexes12-months accumulated rate (%)
Tradeables: 2.6%
Market Prices: 2.8%
IPCA main index: 4.6%
Non-Tradeables: 2.9%
Monitored Prices: 9.9%
Services: 3.0%

Endividamento das Famílias
SECRETARIAT OF PLANNING AND ECONOMIC AFFAIRS
108
Consumer Price Index (IPCA) and Seasonal Pattern
Sources: IBGE/MP and Central Bank of Brazil. *BCB-Focus Survey of 11/30/2018, median of market expectations. **Seasonal pattern estimated by SEPLAN/MP.
Inflation Rate (% per month) Seasonal Pattern (2006-2015)**
IPCA 2017 (2.95% p.a.)
IPCA 2018 (3.65% p.a.)
JAN
FEB
AP
R
MA
R
MA
Y
JUN
JUL
AU
G
SEP
OC
T
NO
V*
DEC
*

Endividamento das Famílias
SECRETARIAT OF PLANNING AND ECONOMIC AFFAIRS
109
Consumer Price Index (IPCA) by Groups
Source: IBGE/MP.
IPCA and components – by GroupsInflation Rate (%)
IPC
A
Foo
d a
nd
Bev
erag
es
Ho
usi
ng
Ho
use
ho
ld A
rtic
les
Wea
rin
g A
pp
are
l
Tran
spo
rtat
ion
Co
mm
un
icat
ion
Hea
lth
an
d P
erso
na
l Car
e
Per
son
al E
xpen
ses
Edu
cati
on
(Oct ac. 12m)
109

Endividamento das Famílias
SECRETARIAT OF PLANNING AND ECONOMIC AFFAIRS
110
Consumer Price Index (IPCA) by Groups
Source: IBGE.
Housing: 6.5%
Household Articles: 2.2%
Wearing Apparel: 0.8%
Transportation: 7.4%
Communication: 0.0%
Personal Expenses: 5.1%
Education: 5.2%
IPCA Groups12-months accumulated rate (%)
Health and Personal Care: 3.2%
Food and Beverages: 3.3%

Endividamento das Famílias
SECRETARIAT OF PLANNING AND ECONOMIC AFFAIRS
111
General Price Index (IGP-DI) by Subindexes
Source: FGV.
Consumer Price SubindexIPC-Br: 4.8%
Construction Cost SubindexINCC: 4.0%
IPA-DI Industry: 14.3%
IPA-DI Agriculture:12.8%
Wholesale Price SubindexIPA-DI: 13.9%
General Prices Subindexes12-months accumulated rate (%)

Endividamento das Famílias
SECRETARIAT OF PLANNING AND ECONOMIC AFFAIRS
112
Major Inflation Indexes
Major Inflation Indexes12-month accumulated rate (%)
Sources: IBGE/MP and Central Bank of Brazil. *2018 = BCB-Focus Survey of 11/30/2018, median of market expectations (monthly).
INPC (12 months)3.96%
IPCA 2018*
IGP-DI (12 months) 8.67%
Sep
-18*
Oct
-18
*N
ov-
18
*
De
c-1
8*

Endividamento das Famílias
SECRETARIAT OF PLANNING AND ECONOMIC AFFAIRS
113
IBGE: Monthly Consumer Price Indexes
Source: IBGE.
IPCA-15 and IPCABy release order

Endividamento das Famílias
SECRETARIAT OF PLANNING AND ECONOMIC AFFAIRS
114
FGV: Monthly General Price Indexes
Source: FGV.
IGP-10, IGP-M and IGP-DIBy release order

Endividamento das Famílias
SECRETARIAT OF PLANNING AND ECONOMIC AFFAIRS
115
Consumer Price Index and Commodity Index (Brazil Agriculture)
Sources: IBGE/MP and Central Bank of Brazil.
Commodity Index – Brazil Agriculture (IC-Br Ag)12-month accumulated change rate (%)
Consumer Inflation - IPCA12-month accumulated rate (%)
IC-Br Food-Agricultural Commodities Index
IPCA

Endividamento das Famílias
SECRETARIAT OF PLANNING AND ECONOMIC AFFAIRS
116
Exchange Rate Pass-Through in Consumer and General Price Indexes
Sources: IBGE/MP and FGV. Note: Pass-Through series estimated by SEPLAN/MP.
Exchange Rate-Inflation Pass-Trough = impact of 1% change of exchange rate in 12-months inflation
FX -> IPCA Pass-Trough
FX -> IGP-DI Pass-Trough

Endividamento das Famílias
SECRETARIAT OF PLANNING AND ECONOMIC AFFAIRS
117
IPCA, Core Inflation (IPCA Ex2) and Diffusion Index
IPCA and Core Ex2*12-month accumulated rate (%)
IPCA Diffusion Indexitems with prices increases (%)
IPCA Diffusion Index*
IPCA
IPCA Core Ex2*
Source: IBGE/MP. * Ex2 = Exclusion from the main index of 12 items, 10 from residence dining and 2 from monitored prices. The excluded items represent, on average, 16% of IPCA main index.** Diffusion Index = % of items from IPCA with price increase.

Endividamento das Famílias
CREDITMARKET

Endividamento das Famílias
SECRETARIAT OF PLANNING AND ECONOMIC AFFAIRS
Credit Market (BCB) October-18
End-of-Period Outstanding Credit (in R$ billions)
Total Credit to the National Financial System (NFS) 3,106.2 3,091.5 3,164.6 100.0% 100.0% 100.0% -0.5% 2.4% 49.6% 47.1% 46.3%
by type of borrower
Public Sector (incl. State-Owned Enterprises) 235.9 221.3 217.4 7.6% 7.2% 6.9% -6.2% -1.7% 3.8% 3.4% 3.2%
Private Sector 2,870.3 2,870.3 2,947.2 92.4% 92.8% 93.1% 0.0% 2.7% 45.9% 43.8% 43.1%
Non-Financial Corporations 1,545.2 1,442.0 1,418.4 49.7% 46.6% 44.8% -6.7% -1.6% 24.7% 22.0% 20.7%
Households 1,560.9 1,649.5 1,746.2 50.3% 53.4% 55.2% 5.7% 5.9% 24.9% 25.1% 25.5%
by type of lender
Public Financial Institutions 1,729.7 1,672.3 1,648.5 55.7% 54.1% 52.1% -3.3% -1.4% 27.6% 25.5% 24.1%
National Private Financial Institutions 976.8 994.8 1,052.9 31.4% 32.2% 33.3% 1.8% 5.8% 15.6% 15.2% 15.4%
Foreign Private Financial Institutions 399.6 424.5 463.2 12.9% 13.7% 14.6% 6.2% 9.1% 6.4% 6.5% 6.8%
by type of credit
Earmarked Resources 1,549.5 1,506.9 1,482.2 49.9% 48.7% 46.8% -2.8% -1.6% 24.8% 23.0% 21.7%
Housing 241.6 245.9 257.5 7.8% 8.0% 8.1% 1.8% 4.7% 3.9% 3.7% 3.8%
Rural 605.7 624.8 635.2 19.5% 20.2% 20.1% 3.2% 1.7% 9.7% 9.5% 9.3%
BNDES Development Bank 601.0 538.6 493.7 19.3% 17.4% 15.6% -10.4% -8.3% 9.6% 8.2% 7.2%
Others 101.2 97.5 95.8 3.3% 3.2% 3.0% -3.7% -1.7% 1.6% 1.5% 1.4%
Non-Financial Corporations 797.7 708.8 652.8 25.7% 22.9% 20.6% -11.1% -7.9% 12.7% 10.8% 9.5%
Households 751.8 798.0 829.3 24.2% 25.8% 26.2% 6.1% 3.9% 12.0% 12.2% 12.1%
Non-earmarked Resources 1,556.6 1,584.7 1,682.4 50.1% 51.3% 53.2% 1.8% 6.2% 24.9% 24.2% 24.6%
Non-Financial Corporations 747.5 733.2 765.6 24.1% 23.7% 24.2% -1.9% 4.4% 11.9% 11.2% 11.2%
Households 809.1 851.5 916.8 26.0% 27.5% 29.0% 5.2% 7.7% 12.9% 13.0% 13.4%
Non-earmarked Resources (BCB) October-18
New Loans, Spread and Delinquency Rates
New Loans (12-months accum. in R$ billions) 2,859.5 2,990.1 3,305.1 100.0% 100.0% 100.0% 4.6% 10.5% 45.7% 45.6% 48.3%
Non-Financial Corporations 1,301.9 1,292.9 1,465.4 45.5% 43.2% 44.3% -0.7% 13.3% 20.8% 19.7% 21.4%
Households 1,557.6 1,697.2 1,823.4 54.5% 56.8% 55.8% 9.0% 7.4% 24.9% 25.9% 26.8%
Spread (in pp per year) 39.9 31.9 28.7 -8.1 pp -3.2 pp
Non-Financial Corporations 16.5 13.7 12.1 -2.8 pp -1.6 pp
Households 60.2 46.1 42.0 -14.0 pp -4.1 pp
Delinquency (% non-performing loans by 90 days or more) 5.6 4.9 4.2 -0.7 pp -0.7 pp
Non-Financial Corporations 5.2 4.5 3.3 0.8 pp -1.2 pp
Households 6.1 5.3 5.0 -0.1 pp -0.3 pp
Dec-16 Oct-18% of Total
Credit dez/yy
% of Total
Credit dez/yy
chg.%
dez/yy-
dez/yy
Dec-17% of Total
Credit out/yy
Dec-16 Oct-18% of Total
Credit dez/yy
% of Total
Credit dez/yy
chg.%
dez/yy-
dez/yy
Dec-17% of Total
Credit out/yy
chg.%
out/yy-
dez/yy
% of GDP
dez/yy
% of GDP
dez/yy
% of GDP
dez/yy
% of GDP
out/yy
% of GDP
out/yy
chg.%
out/yy-
dez/yy
% of GDP
dez/yy
119
Credit Market

Endividamento das Famílias
SECRETARIAT OF PLANNING AND ECONOMIC AFFAIRS
120
Total Credit: Earmarked and Non-earmarkerd Resources
Source: Central Bank of Brazil.
Total Outstanding Credit in National Financial System (SFN)% of GDP Earmarked Resources
Non-earmarked Resources

Endividamento das Famílias
SECRETARIAT OF PLANNING AND ECONOMIC AFFAIRS
121
Total Credit Evolution by Major Segments
Total Outstanding Credit in National Financial System (% of GDP)
Source: Central Bank of Brazil.
Earmarked Resources: Real Estate Earmarked Resources: Rural Earmarked Resources: BNDES
Non-earmarked Resources: Households
Non-earmarked Resources: Non-Financial Corporations

Endividamento das Famílias
SECRETARIAT OF PLANNING AND ECONOMIC AFFAIRS
122
Total Credit by Types of Financial Institutions
% of Total Outstanding Creditto the National Financial System
Source: Central Bank of Brazil.
Public Financial Institutions
National Private Financial Institutions
Foreign Private Financial Institutions

Endividamento das Famílias
SECRETARIAT OF PLANNING AND ECONOMIC AFFAIRS
123
New Loans to Households and Non-Financial Corporations
Source: Central Bank of Brazil. * Seasonally adjusted by SEPLAN/MP.
Daily Average of New Loans to Non-Financial CorporationsR$ millions of the last month3-Month Moving Average - Seasonally Adjusted*
Daily Average of New Loans to HouseholdsR$ millions of the last month
3-Month Moving Average - Seasonally Adjusted*
Non-Financial Corporations
Households

Endividamento das Famílias
SECRETARIAT OF PLANNING AND ECONOMIC AFFAIRS
124
New Loans to Non-Financial Corp. by Type of Credit Lines
Daily Average of New Loans to Non-Financial Corporations – Last Month Real Values (IPCA)3-Month Moving Average - Seasonally Adjusted* - Index: 2013=100
Advance on Export Contracts146.67
Trade Receivables
Exports Financing 99.54
Secured Account 74.54
Credit Card 135.07
Compror Finance 129.75
Working Capital57.11
Non-Financ.Corp. TOTAL100.99
Source: Central Bank of Brazil. * Seasonally adjusted by SEPLAN/MP.
Overdraft 85.97

Endividamento das Famílias
SECRETARIAT OF PLANNING AND ECONOMIC AFFAIRS
125
New Loans to Households by Type of Credit Lines
Daily Average of New Loans to Households – Real Last Month Values (IPCA)3-Months Moving Average - Seasonally Adjusted* - Index: 2013=100
Credit Card73.52
Overdraft
Personal Loans
Vehicles Finance Loans114.18
Payroll-linked Loans
Other Goods Finance Loans62.38
Check Credit Loans
Households TOTAL
Source: Central Bank of Brazil. * Seasonally adjusted by SEPLAN/MP using X-13Arima-Seats/X12-Arima.

Endividamento das Famílias
SECRETARIAT OF PLANNING AND ECONOMIC AFFAIRS
126
Households Indebtedness RateHouseholds Indebtedness Rate* – Non-Real Estate Loans% of 12-month Accumulated Income
Source: Central Bank of Brazil. * Indebtedness rate = total outstanding debt / 12-months accumulated income.
Households* Indebtedness Rate* – Real Estate Loans% of 12-month Accumulated Income
Households Indebtedness: Non-Real Estate Loans
Households Indebtedness: Real Estate Loans
Reduction850 bps
126

Endividamento das Famílias
SECRETARIAT OF PLANNING AND ECONOMIC AFFAIRS
127
Households Income Commitment
Households Income Commitment* – Non-Real Estate Loans% of Monthly Income – 3-month moving average – seasonally adjusted data
Source: Central Bank of Brazil. * Households Income Commitment = Loans Service Monthly Expenditure / Monthly Income.
Households Income Commitment: Non-Real Estate Loans
Households Income Commitment: Real Estate Loans
Households Income Commitment* – Real Estate Loans% of Monthly Income – 3-month moving average – seasonally adjusted data
127

Endividamento das Famílias
SECRETARIAT OF PLANNING AND ECONOMIC AFFAIRS
128
Non-earmarked Resources: Spread and Delinquency RatesAverage SpreadIn percentage points (pp)
Source: Central Bank of Brazil.
Average Spread
Average Delinquency Rate% Non-performing loans (by 90 days or more)
Average Delinquency Rate

Endividamento das Famílias
SECRETARIAT OF PLANNING AND ECONOMIC AFFAIRS
129
Households Loans: Spread and Delinquency Rates
Average SpreadIn percentage points (pp)
Source: Central Bank of Brazil.
Average Delinquency Rate% Non-performing loans (by 90 days or more)
Average Spread
Average Delinquency Rate
129

Endividamento das Famílias
SECRETARIAT OF PLANNING AND ECONOMIC AFFAIRS
130
Non-Financial Corp. Loans: Spread and Delinquency RatesAverage SpreadIn percentage points (pp)
Source: Central Bank of Brazil.
Average Delinquency Rate% Non-performing loans (by 90 days or more)
Average Spread
Average Delinquency Rate
130
Endividamento das Famílias
FINANCIALMARKETS

Endividamento das Famílias
SECRETARIAT OF PLANNING AND ECONOMIC AFFAIRS
BCB/Focus:
Financial Savings (BCB) October-18
Outstanding Positions - R$ billions
Bank Certificates of Deposit (CDB/RDB) 627.4 749.1 757.5 882.3 13.6% 19.4% 17.8% 16.5%
Savings Accounts (Caderneta de Poupança) 665.0 724.6 695.2 776.2 1.3% 9.0% 7.1% 11.6%
Investment Funds 2,953.4 3,462.6 3,468.6 3,771.9 19.4% 17.2% 8.9% 8.7%
Off-market Funds (Fundos Extramercado) 14.9 13.5 13.6 13.8 25.0% -9.1% 2.1% 1.9%
Exchange-traded Funds 158.1 232.5 199.7 304.9 9.7% 47.0% 31.1% 52.7%
Treasury Bonds Direct (Tesouro Direto) 41.1 48.5 47.8 47.3 60.5% 18.1% -2.4% -1.1%
BM&F-Bovespa - listed companies value as % of GDP 39.4% 48.2% 47.5% 51.6% 7.52 pp 8.77 pp 3.45 pp 4.11 pp
Capital Market (CVM) October-18
New Public Offering - R$ billions
Stocks 0.5 8.4 7.5 3.4 -96.7% 1462.8% -100.0% -100%
Debentures 21.9 6.4 6.4 2.7 5.9% -70.9% - -84.6%
Housing Credit-backed Securities (CRI) 11.3 12.0 10.4 4.6 191.9% 5.9% -63.2% -81.5%
Investment Funds - new shares 2.1 5.2 4.1 14.6 -63.5% 150.0% 28.8% 119.2%
Monet Market (BCB) November-18
Interest Rates
Selic market rate (% py) 13.65 7.00 7.40 6.40 -0.5 pp -6.7 pp -0.6 pp -1.0 pp
CDI (% py) 13.63 6.99 7.39 6.40 -0.5 pp -6.6 pp -0.6 pp -1.0 pp
Swap DI-Pre 180 days (% py) 12.45 6.67 6.84 6.54 -2.7 pp -5.8 pp -0.1 pp -0.3 pp
Swap DI-Pre 360 days (% py) 11.56 6.86 7.02 6.91 -4.3 pp -4.7 pp 0.0 pp -0.1 pp
Monet Market (BCB) December-18
Selic target rate (% py) 13.75 7.00 7.00 6.50 -0.5 pp -6.75 pp -0.5 pp -0.5 pp 7.75% 8.00% 8.00%
TJLP (% py) 7.50 7.00 7.00 6.98 0.5 pp -0.5 pp -0.02 pp -0.02 pp
Brazil Sovereign Risk (BCB) November-18
Monthly Average (in basis points)
EMBI+ (JPMorgan) 328 240 241 278 -195 pp -88 pp 38 pp 37 pp
5 years CDS 281 162 171 210 -214 pp -119 pp 48 pp 40 pp
10 years CDS 360 259 272 290 -199 pp -100 pp 31 pp 18 pp
chg. pp
Dec/17 /
Dec/16
chg. %
nov/yy-
Dec/17
chg. %
nov/yy-
nov/yy
Dec-16 Dec-17 Nov-17 Nov-18
chg. pp
Dec/16 /
Dec/15
11/30/2018
Dec-16 Dec-17 Oct-17 Oct-18
chg. %
Dec/16 /
Dec/15
chg. %
Dec/17 /
Dec/16
chg. %
out/yy-
Dec/17
chg. %
out/yy-
out/yy
Dec-16 Dec-17 Nov-17 Nov-18
chg. %
Dec/16 /
Dec/15
chg. %
Dec/17 /
Dec/16
chg. %
nov/yy-
Dec/17
chg. %
nov/yy-
nov/yy
Dec-16 Dec-17 Oct-17 Oct-18
chg. %
Dec/16 /
Dec/15
chg. %
Dec/17 /
Dec/16
chg. %
out/yy-
Dec/17
chg. %
out/yy-
out/yy
Dec-16 Dec-17 Dec-17 Dec-18
chg. %
Dec/16 /
Dec/15
2020
chg. %
Dec/17 /
Dec/16
chg. %
dez/yy-
Dec/17
chg. %
dez/yy-
dez/yy
2018 2019
132
Financial Markets

Endividamento das Famílias
SECRETARIAT OF PLANNING AND ECONOMIC AFFAIRS
133
Major Financial Savings Instruments
Source: Central Bank of Brazil.
Outstanding Position as % of GDP
Bank Certificates of Deposit (CDB/RDB)
Savings Accounts Investment Funds
Off-market Funds Exchange-traded Funds
Treasury Bonds Direct

Endividamento das Famílias
SECRETARIAT OF PLANNING AND ECONOMIC AFFAIRS
134
Official Interest Rates Evolution (Target Selic and TJLP)
Source: Central Bank of Brazil.
Selic and Long Term (TJLP)Official Interest Rates (% py)
Target Selic

Endividamento das Famílias
SECRETARIAT OF PLANNING AND ECONOMIC AFFAIRS
135
Term Structure of Interbank Interest Rate
Source: Central Bank of Brazil.
Interbank Spot, 180 and 360-daysInterest Rate (% p.a.) Reverse Points of Yield Curve
CDI-Spot: 6.4%
Swap DI-Pre 180: 6.5%
Swap DI-Pre 360: 6.9%

Endividamento das Famílias
SECRETARIAT OF PLANNING AND ECONOMIC AFFAIRS
136
Ex-ante and Ex-post Real Interest Rates
Ex-ante and Ex-post Real (Interbank CDI/IPCA)Interest Rates (% py)
Ex-ante Real Interest Rate*
Ex-post Real Interest Rate**
Source: Central Bank of Brazil. * Ex-ante Real Interest Rate = Expected Interbank CDI/IPCA ratio, considering 360-days Swap DI-Pre rate and IPCA median of BCB-Focus Survey. ** Ex-post Real Interest Rate = Observed 12-months accumulated CDI/IPCA ratio.

Endividamento das Famílias
SECRETARIAT OF PLANNING AND ECONOMIC AFFAIRS
137
Domestic Federal Bond (NTN-B): Implicit Real Interest Rate
NTN-B 2024*Real Interest Rate (% p.a.) – End Of Month
Source: STN/MF. * Interest rate paid by the NTN-B 2024 besides the IPCA inflation rate.

Endividamento das Famílias
SECRETARIAT OF PLANNING AND ECONOMIC AFFAIRS
138
Brazilian Stock Market Evolution
Average Market Value ofBM&F-Bovespa Listed CompaniesR$ millions
Source: Central Bank of Brazil.
IBOVESPAStock Index
In basis points
Market Value of BM&F-Bovespa Listed Companies
IBOVESPA Index

Endividamento das Famílias
SECRETARIAT OF PLANNING AND ECONOMIC AFFAIRS
139
Sovereign Risk (EMBI+ BR)EMBI+ Brazil Spreadbasis points
Source: JPMorgan.
S&P and Fitch Investment Grade Period
240 bps (average from Apr-2008 to Sep-2015)
Endividamento das Famílias
SECRETARIAT OF PLANNING AND ECONOMIC AFFAIRS
140
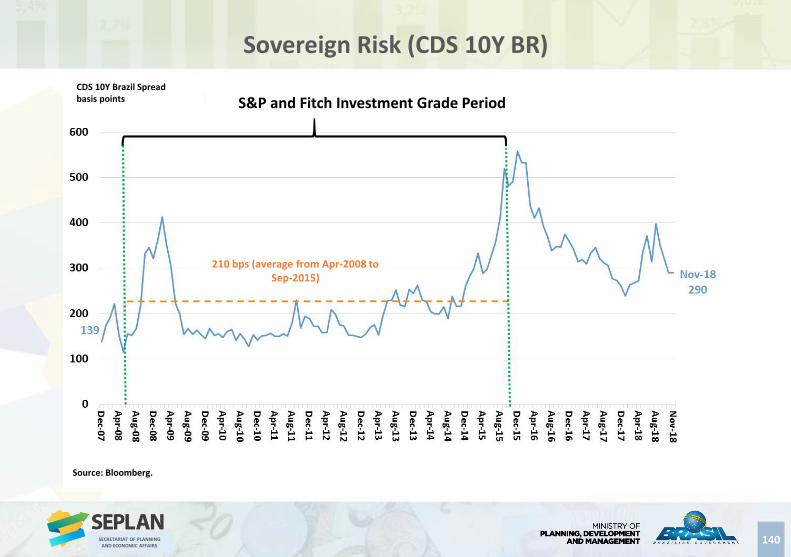
Sovereign Risk (CDS 10Y BR)
CDS 10Y Brazil Spreadbasis points S&P and Fitch Investment Grade Period
210 bps (average from Apr-2008 to Sep-2015)
Source: Bloomberg.

Endividamento das Famílias
FOREIGNTRADE

Endividamento das Famílias
SECRETARIAT OF PLANNING AND ECONOMIC AFFAIRS
BCB/Focus:
Exchange Rate Indicators (BCB) November-18
FX % change rate: appreciation (-) or depreciation (+) of the Real
Nominal Exchange Rate (R$/US$) - sale - end of period; month value: 3.8633 1.8% -7.2% 26.4% 13.5% 18.4% 14.7% 10.7% 11.6% 13.5% 3.67 3.76 3.74
Exchange Rate Indicators (BCB) October-18
FX % change rate: appreciation (-) or depreciation (+) of the Real
Real Effective Exchange Rate (IPCA) -5.3% -8.8% 16.9% 19.3% 8.6% 13.1% 8.9% 10.7% 11.3%
Exchange Rate / Wage Ratio adjusted by Labor Productivity -15.2% -1.2% 15.8% 17.6% 6.4% 11.4% 10.4% 11.3% 10.9%
Unitary Labor Cost in US$ 2.5% 7.4% -21.9% -20.7% -11.9% -12.0% -7.9% -9.7% -10.4%
Foreign Trade of Goods (FUNCEX) October-18
Average Price and Quantum
Exports (X) 3.3% 6.8% 2.3% -1.5% 12.2% 0.8% 5.5% 4.3% 3.3%
Basic Goods -2.7% 13.2% 2.7% 6.1% 26.0% 3.4% 10.2% 8.6% 8.3%
Semi-Manufactured 9.9% 0.6% -25.4% -1.2% -3.3% -5.8% -3.3% -3.6% -5.8%
Manufactured 7.9% 2.7% 13.9% -11.7% 4.0% 0.1% 3.8% 2.3% 1.1%
Imports (M) -11.9% 5.3% 26.4% -3.3% 11.5% 13.9% 14.2% 12.9% 12.6%
Intermediate Goods -7.4% 7.0% 8.5% -3.1% 10.7% 6.7% 5.9% 5.0% 5.2%
Capital Goods -17.0% -9.1% 178.4% -4.7% 18.7% 76.1% 73.4% 67.0% 65.4%
Durable Consumer Goods -36.0% 8.5% 64.1% 32.2% 19.8% 35.2% 32.5% 34.8% 33.9%
Semi and Non-Durable Consumer Goods -9.2% 8.2% 2.0% -8.6% 12.4% 5.6% 8.3% 6.3% 5.9%
Fuel and Lubricants -22.1% 9.4% 16.1% -10.2% 4.1% 1.4% 10.9% 10.2% 7.0%
Exports Profitability Index -8.2% -1.3% 18.1% 19.9% 7.0% 10.8% 6.7% 8.3% 8.4%
Quantum Ratio = average quantum X / average quantum M 15.6% 1.5% -14.2% 2.4% 0.6% -10.1% -6.3% -6.3% -7.0%
Exports (X) -6.2% 10.1% 8.4% 5.0% 3.9% 5.1% 4.6% 4.7% 4.4%
Basic Goods -6.7% 12.8% 14.8% 10.9% 4.7% 7.3% 5.6% 6.2% 5.9%
Semi-Manufactured -3.9% 11.7% 1.4% -1.6% 2.3% 2.2% 3.7% 3.3% 3.1%
Manufactured -5.9% 5.7% 5.5% 3.0% 6.8% 4.4% 3.8% 3.5% 3.7%
Imports (M) -8.9% 4.1% 7.1% 8.3% 5.6% 6.1% 5.7% 6.2% 6.3%
Intermediate Goods -7.7% 3.0% 7.2% 8.0% 5.4% 6.2% 5.8% 6.2% 6.3%
Capital Goods -5.0% -3.2% -7.3% 5.5% -2.1% -0.5% -1.9% -0.6% -0.7%
Durable Consumer Goods -3.9% 2.0% 1.8% -3.8% -10.6% 0.4% 3.2% 2.4% 0.7%
Semi and Non-Durable Consumer Goods -2.8% -1.8% -2.7% -4.5% 1.1% 1.0% 0.7% 0.6% 1.5%
Fuel and Lubricants -26.6% 29.5% 33.5% 31.6% 24.6% 20.7% 20.8% 21.5% 21.9%
Terms of Trade = average price X / average price M 3.1% 5.8% 1.2% -3.1% -1.6% -0.9% -1.0% -1.5% -1.8%
YTD 2017
ago/yy
accum. in
12-months
set/yy
accum. in
12-months
out/yy
accum. in
12-months
2016 2017
chg.%
ago/yy-
ago/yy
chg.%
set/yy-
set/yy
chg.%
out/yy-
out/yy
out/yy
accum. in
12-months
QUANTUM
PRICE
2016 2017
chg.%
ago/yy-
ago/yy
chg.%
set/yy-
set/yy
chg.%
out/yy-
out/yy
YTD 2017
ago/yy
accum. in
12-months
set/yy
accum. in
12-months
2016 2017
chg.%
set/yy-
set/yy
chg.%
out/yy-
out/yy
chg.%
nov/yy-
nov/yy
YTD 2017
set/yy
accum. in
12-months
out/yy
accum. in
12-months
11/30/2018
nov/yy
accum. in
12-months
Average
FX Rate
2018
Average
FX Rate
2019
Average
FX Rate
2020
142
Foreign Trade

Endividamento das Famílias
SECRETARIAT OF PLANNING AND ECONOMIC AFFAIRS
143
Daily Nominal Exchange Rate R$/US$
Nominal Exchange Rate R$/US$
Source: Central Bank of Brazil. *Volatility = 5-days Moving Coefficient of Variation.
Nominal Exchange Rate Volatility*
Volatility Nominal Exchange Rate (R$/US$)
15.7% of BRLdevaluation to USD
Endividamento das Famílias
SECRETARIAT OF PLANNING AND ECONOMIC AFFAIRS
144
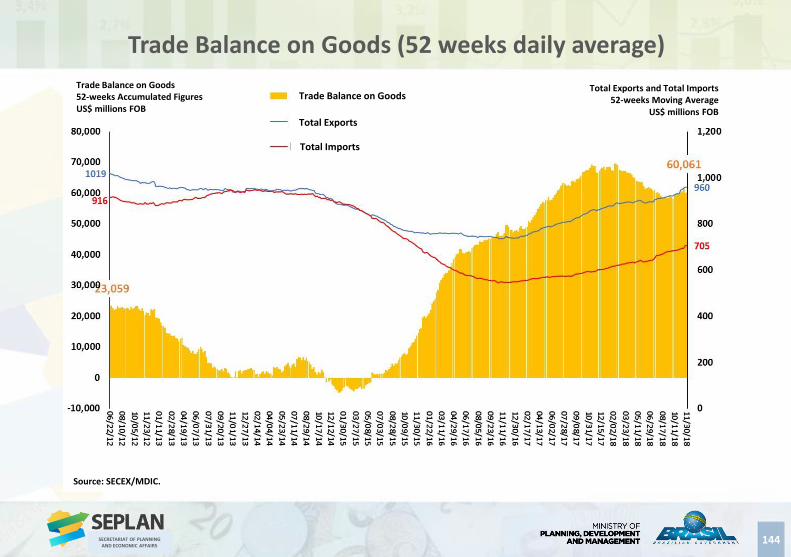
Trade Balance on Goods (52 weeks daily average)
Trade Balance on Goods52-weeks Accumulated FiguresUS$ millions FOB
Source: SECEX/MDIC.
Trade Balance on Goods
Total Exports
Total Imports
Total Exports and Total Imports52-weeks Moving Average
US$ millions FOB

Endividamento das Famílias
SECRETARIAT OF PLANNING AND ECONOMIC AFFAIRS
145
Nominal Exchange Rate R$/US$
Nominal Exchange Rate R$/US$Sale – End of Period
Source: Central Bank of Brazil. *Volatility = 12-months Moving Coefficient of Variation.
Volatility
Nominal Exchange Rate (R$/US$)
Nominal Exchange RateVolatility*

Endividamento das Famílias
SECRETARIAT OF PLANNING AND ECONOMIC AFFAIRS
146
Exchange Rate Indexes
Exchange Rate Indexes (2006=100)12-month Moving Average
Source: Central Bank of Brazil.
Nominal Exchange Rate (R$/US$)
Real Effective Exchange Rate (IPCA)
Exchange Rate / Wage Ratio adjusted by Labor Productivity

Endividamento das Famílias
SECRETARIAT OF PLANNING AND ECONOMIC AFFAIRS
147
Trade Balance, Quantum and Terms of Trade Ratios
Sources: SECEX/MDIC and FUNCEX.* Quantum Ratio = (average quantum Exports / average quantum Imports)
Terms of Trade = (average price Exports / average price Imports)
Trade Balance12-month Accumulated FiguresUS$ millions FOB
Quantum Ratio and Terms of Trade*12-month Moving Average
2006=100
Trade Balance on Goods
Quantum Ratio*
Terms of Trade*

Endividamento das Famílias
SECRETARIAT OF PLANNING AND ECONOMIC AFFAIRS
148
Exports: Profitability, Price and Real Exchange Rate
Sources: Central Bank of Brazil and FUNCEX.
Real Effective Exchange Rate (IPCA), Exports Average Price and Exports Profitability Index12-month Moving Average (2006=100)
Exports Average Price
Real Effective Exchange Rate (IPCA)
Exports Profitability Index

Endividamento das Famílias
SECRETARIAT OF PLANNING AND ECONOMIC AFFAIRS
149
Quantum of Exports and Imports
Source: FUNCEX.
Exports Quantum
Exports and Imports Quantum12-month Moving Average (2006=100)
Imports Quantum

Endividamento das Famílias
SECRETARIAT OF PLANNING AND ECONOMIC AFFAIRS
150
Total Exports: value, quantum and price
Sources: SECEX/MDIC and FUNCEX.
Total Exports Quantum
Exports Quantum and Average Price12-month Moving Average (2006=100)
Exports Value12-month Accumulated Figures (US$ millions FOB)
Total Exports Average Price
Total Exports Value

Endividamento das Famílias
SECRETARIAT OF PLANNING AND ECONOMIC AFFAIRS
151
Quantum of Total Exports by Class of Products
Source: FUNCEX.
Exports Quantum by Class of Products12-months Moving Average (2006=100)
Basic Goods
Total Exports
Manufactured Goods
Semi-Manufactured Goods 122

Endividamento das Famílias
SECRETARIAT OF PLANNING AND ECONOMIC AFFAIRS
Exports Quantum by Economic Categories12-month Moving Average (2006=100)
152
Quantum of Total Exports by Economic Categories
Source: FUNCEX.
Fuel and Lubricants
Intermediate Goods134
Total Exports126.6
Capital Goods
Semi and Non-Durable Consumer Goods86
Durable Consumer Goods

Endividamento das Famílias
SECRETARIAT OF PLANNING AND ECONOMIC AFFAIRS
153
Total Imports: value, quantum and price
Sources: SECEX/MDIC and FUNCEX.
Total Imports Quantum
Imports Quantum and Average Price12-month Moving Average (2006=100)
Imports Value12-month Accumulated Figures (US$ millions FOB)
Total Imports Average Price
Total Imports Value

Endividamento das Famílias
SECRETARIAT OF PLANNING AND ECONOMIC AFFAIRS
154
Quantum of Total Imports and by Economic Categories
Source: FUNCEX.
Imports Quantum by Economic Categories12-month Moving Average (2006=100)
Fuel and Lubricants 125
Intermediate Goods 149
Total Imports
Capital Goods 240
Semi and Non-Durable Consumer Goods 226
Durable Consumer Goods172

Endividamento das Famílias
SECRETARIAT OF PLANNING AND ECONOMIC AFFAIRS
155
Brazilian Commodity Price Indexes
Source: Central Bank of Brazil.
Brazilian Commodity Index (IC-Br)12-month Moving Average (2006=100)
IC-Br Agriculture 51.7
IC-Br Metallic
IC-Br Energy
IC-Br Main Index

Endividamento das Famílias
SECRETARIAT OF PLANNING AND ECONOMIC AFFAIRS
156
Brazilian Exports Evolution by Country of Destination
Source: MDIC/SECEX
% of Exports Value
China European United Argentina Chile Japan Mexico India Singapore Uruguay Korea Saudi ArabiaUnion States
( Ac. until Oct/18)

Endividamento das Famílias
EXTERNALSECTOR

Endividamento das Famílias
SECRETARIAT OF PLANNING AND ECONOMIC AFFAIRS
BCB/Focus:
Balance of Payments (BCB) October-18
In US$ millions
Balance of Payments 13,476 6,413 6,378 -52.4% -0.5% -51.3% 537.0% -45.8% -0.6%
Current Account Balance (CAB) -23,684 -5,487 -15,402 -76.8% 180.7% 186.4% -148.0% -91.7% 698.8% -15.1 -27.2 -38.0
CAB as % of GDP -1.3% -0.3% -0.8% 1.1 pp -0.5 pp -0.3 pp -0.4 pp
Balance on Goods 45,037 64,028 51,687 42.2% -19.3% -7.3% 10.9% 54.6% -22.0% 56.6 53.0 44.1
Exports 184,453 217,243 232,873 17.8% 7.2% 2.0% 16.6% 20.1% 8.5% 235.0 243.0 253.1
Imports 139,416 153,215 181,187 9.9% 18.3% -22.4% 16.2% 9.4% 3.4% 178.4 190.0 209.0
Balance on Services -30,447 -33,850 -34,762 11.2% 2.7% -22.4% 16.2% 9.4% 3.4%
Primary Income -41,219 -38,297 -35,149 -7.1% -8.2% -6.4% -26.5% 4.6% -9.7%
Secondary Income 2,944 2,632 2,823 -10.60% 7.2% -63.0% 45.1% -19.2% 9.8%
Capital Account 274 379 408 38.6% 7.6% -26.1% -53.2% 55.0% 7.7%
Financial Account -9,407 1,305 -8,615 -113.9% -760.1% -31.5% -168.9% -154.8% -221.1%
Direct Investments -57,832 -49,157 -62,001 -15.0% 26.1% 41.1% 16.2% 3.2% 27.8%
Foreign Direct Investments (FDI) 72,525 68,510 75,004 -5.5% 9.5% 24.5% 17.6% 13.0% 10.6% 70.0 76.0 83.5
Portfolio Investments 18,993 14,042 6,417 -26.1% -54.3% 104.8% -172.2% -53.7% -92.3%
Stock Market -7,503 -2,482 -1,679 -66.9% -32.3% -269.9% -93.5% -87.3% -85.2%
Bonds 30,726 9,713 3,710 -68.4% -61.8% 29.1% -82.9% -89.6% -210.9%
Others Investments and Capital Flows 29,433 36,421 46,969 23.7% 29.0% -10.5% 15.1% 125.9% 24.8%
International Reserves - liquidity concept 365,016 373,972 380,738 2.5% 1.8% -0.1% -0.1%
Gross External Debt (BCB) October-18
In US$ millions
Total External Debt 675,841 667,103 653,802 100.0% 100.0% - 37.6% 34.0% -3.6 pp
Gross External Debt 326,297 317,305 297,344 48.3% 45.5% -2.8 pp 18.2% 15.5% -2.7 pp
Public Sector 74,379 75,791 73,875 22.8% 24.8% 2.1 pp 4.1% 3.8% -0.3 pp
Private Sector and Public Financial Sector 251,918 241,514 223,469 77.2% 75.2% -2.1 pp 14.0% 11.6% -2.4 pp
Short Term 56,327 51,287 58,107 17.3% 19.5% 2.3 pp 3.1% 3.0% -0.1 pp
Medium and Long Term 269,970 266,018 239,237 82.7% 80.5% -2.3 pp 15.0% 12.4% -2.6 pp
Intercompany Loans 222,344 227,841 229,259 32.9% 35.1% 2.2 pp 12.4% 11.9% -0.5 pp
Domestic Bonds with Foreign Investors 127,199 121,956 127,199 18.8% 19.5% 0.6 pp 7.1% 6.6% -0.5 pp
chg. pp2016
% of GDP
out/yy
% of GDPchg. pp
chg.% - Jan-
set/yy - Jan-
set/yy
chg.% - Jan-
out/yy - Jan-
out/yy
2018 2019 2020
2016 2017 Oct-182016
% of total
out/yy
% of total
chg.%
set/yy -
set/yy
chg.%
out/yy -
out/yy
11/30/2018
2016 2017
out/yy
accum. in
12-months
chg.% 2017 /
2016
chg.% out/yy
accum. 12-m /
2017
158
External Sector

Endividamento das Famílias
SECRETARIAT OF PLANNING AND ECONOMIC AFFAIRS
159
Brazil: Real Exchange Rate and External Sector Adjustment
Source: Central Bank of Brazil.
Current Account Balance and Trade Balance on Goods and Services12-month Accumulated FiguresUS$ billions
Real Effective Exchange Rate12-month Moving Average
2006=100Current Account Balance
Trade Balance on Goods and Services
Real Effective Exchange Rate

Endividamento das Famílias
SECRETARIAT OF PLANNING AND ECONOMIC AFFAIRS
160
Current Account Deficit as % of GDP
Source: Central Bank of Brazil.
Current Account as % of GDP12-month Figures

Endividamento das Famílias
SECRETARIAT OF PLANNING AND ECONOMIC AFFAIRS
161
Current Account Deficit Financing
Source: Central Bank of Brazil. 2018* = 12 months ac. until Oct/18.accumulated up to December/2017.
% of GDPCurrent Account Balance
Direct Investments
Portfolio Investments
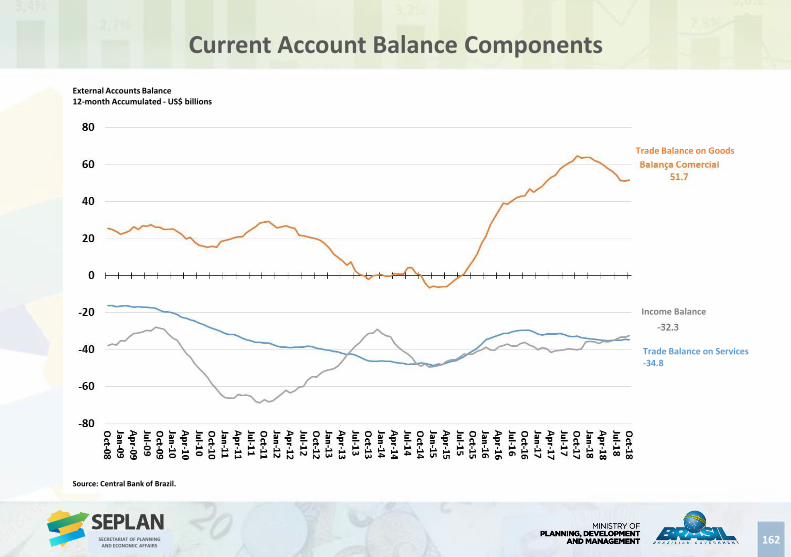
Endividamento das Famílias
SECRETARIAT OF PLANNING AND ECONOMIC AFFAIRS
162
Current Account Balance Components
Source: Central Bank of Brazil.
External Accounts Balance12-month Accumulated - US$ billions
Trade Balance on Goods
Trade Balance on Services -34.8
Income Balance

Endividamento das Famílias
SECRETARIAT OF PLANNING AND ECONOMIC AFFAIRS
163
Service Account Balance and Components
Source: Central Bank of Brazil. *Includes services of P&D, legal services, marketing, architecture & engineering, environmental services, among others.
External Accounts Balance12-month Accumulated - US$ billions
Others
Multiple Businesses*
Intellectual Property
Travels & Tourism-12.7
Transportation-6.2
Machinery and Equipment Rentals-15.3

Endividamento das Famílias
SECRETARIAT OF PLANNING AND ECONOMIC AFFAIRS
164
Financial Account Balance and Components
Source: Central Bank of Brazil. *Commercial Credit and Loans.
Direct Investment
External Financial FlowsNet Inflow (+) and Net Outflow (-)12-month Accumulated - US$ billions
Other Investments*
Portfolio Investment

Endividamento das Famílias
SECRETARIAT OF PLANNING AND ECONOMIC AFFAIRS
165
Direct Investments and Components
Source: Central Bank of Brazil.
Direct Investments Abroad
FDI – Intercompany Operations
FDI – Equity Participation
Direct Investment FlowsNet Inflow (+) and Net Outflow (-)12-month Accumulated - US$ billions

Endividamento das Famílias
SECRETARIAT OF PLANNING AND ECONOMIC AFFAIRS
166
Portfolio Investments and Components
Source: Central Bank of Brazil.
Stock Market
Bonds
Investment Funds
Portfolio Investment FlowsNet Inflow (+) and Net Outflow (-)12-month Accumulated - US$ billions

Endividamento das Famílias
SECRETARIAT OF PLANNING AND ECONOMIC AFFAIRS
167
Brazilian International Reserves
Source: Central Bank of Brazil. *Positive values represent net sell position on fx and negative values net buy position on fx.
FX-Interest Rate Swap Operations*Outstanding PositionsUS$ million
International ReservesLiquidity Concept
US$ millions
International Reserves
Swap Operations

Endividamento das Famílias
PUBLIC SECTORACCOUNTS

Endividamento das Famílias
SECRETARIAT OF PLANNING AND ECONOMIC AFFAIRS
BCB/Focus:
Federal Government Accounts October-18
Federal Budget (National Treasury/Ministry of Finance) 2013 2014 2015 2016 2017out/yy accum.
in 12-months2016 / 2015
Dec/17
accum. 12-
m / 2016
YTD 2018 /
YTD 2017
Total Primary Revenue (a) 157,550 1,221,474 1,247,789 1,314,953 1,383,082 1,491,842 5.2% 7.9% 9.8%
National Treasury 871,836 883,971 897,517 956,816 1,008,297 1,106,321 5.4% 9.7% 12.1%
Social Security General System 307,147 337,503 350,272 358,137 374,785 385,521 4.6% 2.9% 3.6%
States and Municipalities Mandatory Transfers (b) 181,895 198,462 204,684 226,835 228,335 247,003 0.7% 8.2% 10.1%
Net Primary Revenue (a-b) 997,088 1,023,013 1,043,105 1,088,118 1,154,746 1,244,839 6.1% 7.8% 9.8%
Total Primary Expenditure 920,095 1,040,223 1,159,535 1,249,393 1,279,008 19,217 2.4% 4.8% 6.0%
National Treasury 563,092 646,022 723,445 741,522 721,773 759,866 -2.7% 5.3% 6.6%
Social Security General System 357,003 394,201 436,090 507,871 557,235 581,086 9.7% 4.3% 5.3%
Federal Government Accounts October-18
Federal Budget (National Treasury/Ministry of Finance) 2013 2014 2015 2016 2017out/yy accum.
in 12-months2016 2017
out/yy
accum. in
12-months
Primary Account Balance of Federal Government (STN/MF) 76,994 -17,211 -116,430 -161,276 -124,261 -96,113 -2.6% -1.9% -1.4%
National Treasury 126,850 39,487 -30,612 -11,542 58,189 99,453 -0.2% 0.9% 1.5%
Social Security General System -49,856 -56,698 -85,818 -149,734 -182,450 -195,565 -2.4% -2.8% -2.9%
Consolidate Public Sector Accounts October-18
Public Sector Financial Need (Central Bank of Brazil - BCB) 2013 2014 2015 2016 2017out/yy accum.
in 12-months2015 2016
out/yy
accum. in
12-months
Primary Account Balance Target (% GDP) -1.78% -1.84% -1.36%
Primary Account Balance -91,306 32,536 111,249 155,791 110,583 84,754 2.5% 1.7% 1.2% -1.8% -1.5% -0.7%
Federal Government -75,291 20,472 116,656 159,473 -3,361 88,874 2.5% 1.8% 1.3%
States and Municipalities -16,337 7,790 -9,684 -4,666 -7,498 -392 -0.1% -0.1% 0.0%
State Owned Companies (except Petrobrás and Eletrobrás) 322 4,274 4,278 983 -362 -3,729 0.0% 0.0% -0.1%
Net Financial Public Expenditure (Debt Interest Payments) 248,856 311,380 501,786 407,024 400,826 379,694 6.5% 6.1% 5.6%
Nominal Account Balance 157,550 343,916 613,035 562,815 511,408 464,448 9.0% 7.8% 6.8% -7.1% -6.5% -6.1%
General Public Sector Debt (BCB) October-18
End of Period Debt Outstanding (in R$ millions) Dec-13 Dec-14 Dec-15 Dec-16 Dec-17 Oct-18dez/yy -
dez/yy
dez/yy -
dez/yy
out/yy -
dez/yy
Consolidated Public Sector 1,626,335 1,883,147 2,136,888 2,892,913 3,382,942 3,642,499 35.38% 16.94% 7.67%
Federal Government 1,025,358 1,200,680 1,312,962 2,090,133 2,534,119 2,739,822 59.2% 21.2% 8.1%
States and Municipalities 569,794 643,066 771,635 747,503 789,403 842,321 -3.1% 5.6% 6.7%
State Owned Companies (except Petrobrás and Eletrobrás) 31,183 39,402 52,292 55,278 59,420 60,356 5.7% 7.5% 1.6%
Net Domestic Debt 2,341,011 674,096 3,289,112 3,856,985 4,393,145 4,768,587 17.3% 13.9% 8.5%
Net External Debt -714,676 -786,400 -1,152,224 -964,072 -1,010,203 -1,126,087 -16.3% 4.8% 11.5%
General Public Sector Net Debt (% GDP) 30.5% 32.6% 35.6% 46.2% 51.6% 53.3% 10.6 pp 5.4 pp 1.7 pp 54.0% 57.0% 58.9%
General Public Sector Gross Debt (% GDP) 51.5% 56.3% 65.5% 70.0% 74.0% 76.5% 4.5 pp 4.1 pp 2.5 pp
General Public Sector Gross Debt (in R$ millions) 3,177,361 3,560,826 4,300,759 4,853,850 5,449,151 5,830,453 12.86% 12.26% 7.00%
12-month Acummulated Figures (in R$ millions) % of GDP
2018 2019 2020
Debt Outstanding (in R$ millions) chg. %
2018 2019 2020
11/30/2018
12-month Acummulated Figures (in R$ millions) chg. %
12-month Acummulated Figures (in R$ millions) % of GDP
169
Public Sector Accounts

Endividamento das Famílias
SECRETARIAT OF PLANNING AND ECONOMIC AFFAIRS
170
Fiscal Adjustment and Economic Recovery
GDP real % chg. Primary Account Balance (% GDP)*
GDPPrimary Account Balance*
Sources: IBGE, MF and MP.* Annex IV-Fiscal Targets of 2017 Budgetary Guidelines Bill of Law (LDO 2018) and Macroeconomic Projections from Nov-2018 - SPE/MF.

Endividamento das Famílias
SECRETARIAT OF PLANNING AND ECONOMIC AFFAIRS
171
Primary Balance of Federal Government (as % GDP)
Primary Balance of Federal Government12-month Accumulated% of GDP
Primary Balance
Sources: STN/MF.*Excludes compulsory transfers to subnational entities
Net Primary Revenue and Primary Expenditure12-month Accumulated
% of GDP
Net Primary Revenue*
Primary Expenditure
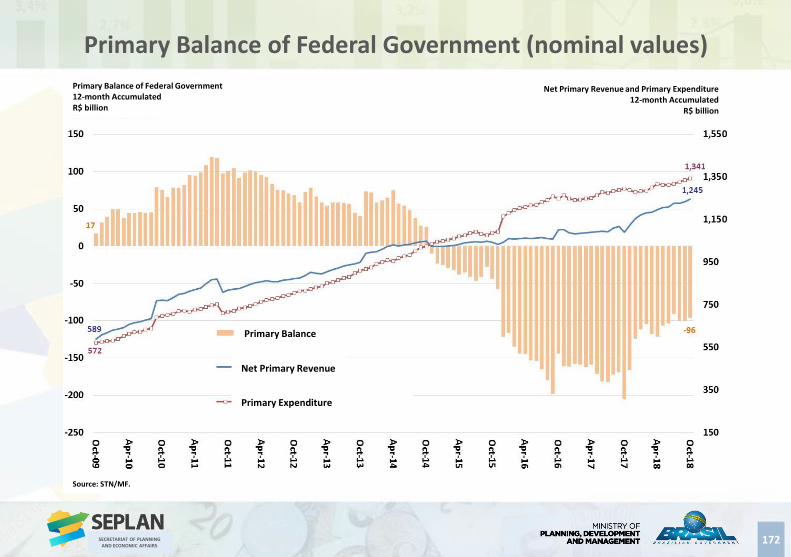
Endividamento das Famílias
SECRETARIAT OF PLANNING AND ECONOMIC AFFAIRS
172
Primary Balance of Federal Government (nominal values)
Primary Balance of Federal Government12-month AccumulatedR$ billion
Primary Balance
Source: STN/MF.
Net Primary Revenue and Primary Expenditure12-month Accumulated
R$ billion
Net Primary Revenue
Primary Expenditure

Endividamento das Famílias
SECRETARIAT OF PLANNING AND ECONOMIC AFFAIRS
173
Primary Balance of Federal Government (real values)
173
Primary Balance of Federal Government12-month Accumulated – real values (Feb/2017)R$ billion
Primary Balance
Source: STN/MF.
Net Primary Revenue and Primary Expenditure12-month Accumulated – real values (Feb/2017)
R$ billion
Net Primary Revenue
Primary Expenditure

Endividamento das Famílias
SECRETARIAT OF PLANNING AND ECONOMIC AFFAIRS
174
General Social Security System (RGPS) Balance
RGPS Balance12-month Accumulated% of GDP
Sources: STN/MF.
RGPS Net Revenue and Expenditure12-month Accumulated
% of GDP
RGPS Expenditure
RGPS Account Balance
RGPS Net Revenue

Endividamento das Famílias
SECRETARIAT OF PLANNING AND ECONOMIC AFFAIRS
175
Public Sector Primary Balance (as % GDP)
Federal GovernmentPrimary Balance12-month Accumulated% of GDP
Federal Government
Sources: Central Bank of Brazil. *Excludes Petrobras and Eletrobras.
State Owned Companies and States & MunicipalitiesPrimary Balance
12-month Accumulated% of GDP
States & Municipalities
State Owned Companies*

Endividamento das Famílias
SECRETARIAT OF PLANNING AND ECONOMIC AFFAIRS
176
Public Sector Primary and Nominal Balance
Consolidated Public SectorPrimary and Nominal Balance12-month Accumulated% of GDP
PrimaryBalance
Source: Central Bank of Brazil.
Nominal Balance

Endividamento das Famílias
SECRETARIAT OF PLANNING AND ECONOMIC AFFAIRS
177
Public Sector Net Debt (as % GDP)
General Public Sector Net Debt (DSLP)% of GDP
Source: Central Bank of Brazil.
Implicit Interest Rate on DSLP12-month (%)
General Public Sector Net Debt Implicit Interest Rate

Endividamento das Famílias
SECRETARIAT OF PLANNING AND ECONOMIC AFFAIRS
178
Public Sector Gross Debt (as % GDP)
Public Sector Gross Debt% of GDP
Source: Central Bank of Brazil.

Endividamento das Famílias
WORLDECONOMY

Endividamento das Famílias
SECRETARIAT OF PLANNING AND ECONOMIC AFFAIRS
World Q4 2017
data from IMF and WTO
World Output - GDP 3.5% 3.6% 3.5% 3.2% 3.7% 3.2% 3.2% 3.7% 3.7% 3.7%
Advanced Economies 1.3% 2.1% 2.3% 1.7% 2.4% 1.8% 2.0% 2.3% 2.4% 2.1%
Emerging Market and Developing Economies 5.1% 4.7% 4.3% 4.4% 4.7% 4.4% 4.4% 4.8% 4.7% 4.7%
Latin America and the Caribbean 2.9% 1.3% 0.3% -0.6% 1.3% -1.1% -1.1% 1.3% 1.2% 2.2%
World Trade of Goods and Services 3.6% 3.8% 2.8% 2.2% 5.2% 1.4% 0.9% 4.9% 4.2% 4.0%
National Accounts Q3 2018
data from IMF, OECD, Eurostat, NBSC and METI
USA - GDP 1.8% 2.5% 2.9% 1.6% 2.2% 2.9% 3.0% 2.4% 2.6% 2.7% 2.9% 2.5%
Household Expenditure 1.5% 2.9% 3.7% 2.7% 2.5% 2.6% 2.5% 2.5%
Government Expenditure -2.4% -0.9% 1.9% 1.4% -0.1% 1.3% 0.1% 0.4%
Gross Fixed Capital Formation 6.9% 5.4% 4.8% -1.3% 4.8% 4.8% 5.6% 5.7%
Exports of Goods and Services 3.6% 4.3% 0.6% -0.1% 3.0% 5.7% 3.5% 4.2%
Imports of Goods and Services (-) 1.5% 5.1% 5.5% 1.9% 4.6% 4.2% 4.8% 4.7%
Industrial Production 3.7% 4.9% -1.8% -1.0% 3.6% 3.6% 1.0% 3.2%
Unemployment (% of Labor Force) 7.4% 6.2% 5.3% 4.9% 4.3% -0.30 pp -0.1 pp 4.2% 4.1% 4.0% 4.1% 4.2%
Consumer Price Index 1.5% 0.8% 0.7% 2.1% 2.1% 2.9% 2.6% 2.1% 2.4% 2.4% 2.3% 2.1%
European Union - GDP 0.3% 1.8% 2.4% 2.0% 2.5% 2.2% 1.9% 2.6% 2.5% 2.2% 2.2% 2.0%
Household Expenditure -0.1% 1.0% 2.0% 1.8%
Government Expenditure 0.3% 0.8% 1.7% 2.0%
Gross Fixed Capital Formation -1.6% 2.8% 3.7% 2.5%
Exports of Goods and Services 1.6% 4.7% 6.0% 2.3%
Imports of Goods and Services (-) 2.5% 5.0% 7.1% 2.8%
Industrial Production -0.5% 1.2% 2.3% 1.3% 4.7% 1.5% 3.0% 3.4%
Unemployment (% of Labor Force) 10.8% 10.2% 9.4% 8.7% 7.6% -0.6 pp -0.2 pp 7.4% 7.2% 7.0% 7.6% 7.6%
Consumer Price Index 1.0% 0.0% 0.2% 0.9% 1.7% 2.0% 2.2% 1.6% 1.8% 1.8% 1.9% 1.9%
Japan - GDP 2.0% 0.4% 1.4% 0.9% 1.7% 1.4% 0.4% 1.7% 1.6% 1.2% 1.1% 0.9%
Industrial Production -0.7% 2.1% -0.9% -0.2% 4.5% 2.0% 2.4% 3.8%
Unemployment (% of Labor Force) 4.0% 3.6% 3.4% 3.1% 2.8% -0.4 pp 2.7% 2.6% 2.6% 2.9% 2.9%
Consumer Price Index 1.5% 2.5% 0.2% -0.1% 1.0% 0.7% 1.1% 0.8% 0.9% 0.9% 0.8% 1.5%
China - GDP 7.8% 7.3% 6.9% 6.7% 6.9% 6.7% 6.5% 6.8% 6.8% 6.7% 6.6% 6.2%
Industrial Production 9.9% 7.9% 6.6% 6.0% 6.1% 6.6% 7.2% 7.9%
Unemployment (% of Labor Force) 4.1% 4.1% 4.1% 4.0% 4.0% -0.2 pp 3.9% 3.9% 4.0% 4.0%
Consumer Price Index 2.5% 1.5% 1.6% 2.0% 1.8% 1.9% 2.3% 1.8% 1.9% 2.0% 2.2% 2.4%
Q1-2018
accum. in 4-
quarters
2016 2019Q2-2018 / Q2-
2017
Q3-2018 / Q3-
2017
Q2-2018
accum. in 4-
quarters
Q3-2018
accum. in 4-
quarters
2017 20182013 2014 2015
IMF - WEO, October 2018.
2013 2014 2015Q4-2017 / Q4-
2016
Q4-2015 / Q4-
2014
Q4-2016 / Q4-
20152016 201920182017
180
World Economy

Endividamento das Famílias
SECRETARIAT OF PLANNING AND ECONOMIC AFFAIRS
181
World Major Economies GDP
GDP - real quarterly % chg. – seasonally adjusted data
Source: OECD.
CHINA
USA
EUROPEAN UNION
JAPAN

Endividamento das Famílias
SECRETARIAT OF PLANNING AND ECONOMIC AFFAIRS
182
World Major Economies Unemployment Rate
Unemployment Rate as % of Labor Force
Source: OECD.
CHINAUSAEUROPEAN UNION JAPAN

Endividamento das Famílias
SECRETARIAT OF PLANNING AND ECONOMIC AFFAIRS
183
World Major Economies Consumer Price Index
Consumer Price Indexes – annual chg.%
Source: OECD.
CHINAUSA EUROPEAN UNION JAPAN

Endividamento das Famílias
SECRETARIAT OF PLANNING AND ECONOMIC AFFAIRS
184
World Major Economies Total Exports
Total Exports Volume Index – Q3-2012 = 100
Source: OECD.
CHINA
USA
EUROPEAN UNION
JAPAN
WORLD
*Estimated values IMF

Endividamento das Famílias
SECRETARIAT OF PLANNING AND ECONOMIC AFFAIRS
185
World Major Economies Government Primary Surplus
Central Government Primary Surplus as % of GDP
Source: IMF. * Estimated values
GERMANY
USA
CHINA
JAPAN

Endividamento das Famílias
SECRETARIAT OF PLANNING AND ECONOMIC AFFAIRS
186
Selected Economies Main Interest Rate
Main Interest Rates – Selected Economies – % per year
Source: Central Bank of Brazil.
USA
Euro Area
China
Mexico
India
Japan
Brazil
Russia
South Africa
United Kingdom

Endividamento das Famílias
SECRETARIAT OF PLANNING AND ECONOMIC AFFAIRS
187
Selected Economies FX-dollar Rate Evolution
Selected Economies FX-rate Indexes – Dec/2008 = 100
Sources: Bloomberg.
Turkey
China
Euro Area
United Kingdom
Russia
Brazil
Mexico
Japan
South Africa
India

Endividamento das Famílias
SECRETARIAT OF PLANNING AND ECONOMIC AFFAIRS
188
Selected Economies Main Stock Index Evolution
Sources: Bloomberg.
Selected Economies Main Stock Indexes – Dec/2008 = 100
Turkey
Germany
USA
Mexico
France
China
Brazil
Russia
United Kingdom
Japan

Endividamento das FamíliasMINISTER OF PLANNING, DEVELOPMENT AND MANAGEMENT - DYOGO HENRIQUE DE OLIVEIRA
EXECUTIVE SECRETARY - ESTEVES PEDRO COLNAGO JÚNIOR
SECRETARY FOR PLANNING AND ECONOMIC AFFAIRS (SEPLAN) - MARCOS ADOLFO RIBEIRO FERRARI
SEPLAN DEPUTY SECRETARY – JÚLIO ALEXANDRE MENEZES DA SILVA
SEPLAN CHIEF OF STAFF - ELISE SUELI PEREIRA GONÇALVES
DIRECTOR OF MACROECONOMIC AFFAIRS (DEMAC) - FABIO RIBEIRO SERVODIRECTOR OF MICROECONOMIC AFFAIRS (DEMIR) - CLAUDIO EVANGELISTA DE CARVALHODIRECTOR OF FINANCIAL AFFAIRS (DEFIN), INTERIM – SÉRGIO RICARDO ROSA CALDERINIDIRECTOR OF PLANNING AND EVALUATION (DEPAS) , INTERIM – RODRIGO RAMIRO
MACROECONOMIC OUTLOOK TECHNICAL TEAM (DEMAC):FABIO RIBEIRO SERVOFAUSTO JOSÉ ARAUJO VIEIRADIEGO COTA PACHECOELDER LINTON ALVES DE ARAÚJOJONATHAS DELDUQUE JÚNIORPRISCILLA BELLE OLIVEIRA PINTOSILAS FRANCO DE TOLEDOSÉRGIO ROSA FERRÃOSURIPONGSE CHIMPLIGANOND
SOCIAL COMMUNICATION SPECIAL ADVISORY:SEVERINO GOESTHAISIS SOUZACARLA SIMÕES
CONTACT: [email protected] LINK: http://www.planejamento.gov.br/publicacoes/estudos-economicos

Endividamento das Famílias