End of Topic Test Form A
18
DRAWING INFERENCES: End of Topic Test Form A • 19 End of Topic Test Form A Name Date 1. A recent survey of 2000 student athletes from across the U.S. shows 3 out of 4 student athletes sleep 7 to 8 hours each night. a. What was the population in the survey? b. Was the data collected in the survey a census? Why or why not? c. What was the sample for the survey? d. Was a parameter or a statistic reported? e. Of the 2000 student athletes, how many sleep 7 to 8 hours each night? DRAWING INFERENCES
Transcript of End of Topic Test Form A

Drawing inferences: End of Topic Test Form A • 19
End of Topic Test Form AName Date
1. a recent survey of 2000 student athletes from across the U.s. shows 3 out of 4 student athletes sleep 7 to 8 hours each night.
a. what was the population in the survey?
b. was the data collected in the survey a census? why or why not?
c. what was the sample for the survey?
d. was a parameter or a statistic reported?
e. Of the 2000 student athletes, how many sleep 7 to 8 hours each night?
DrawiNg iNfereNces
C02_AS_EoTA_M04_T03.indd 19 8/1/17 11:20 PM

20 • MODUle 4: analyzing Populations and Probabilities
Drawing inferences
2. a recent survey of all the seventh graders at Jackson Middle school shows that 82% of seventh graders ride the bus to school.
a. what was the population in the survey?
b. was the data collected in the survey a census? why or why not?
c. was a parameter or a statistic reported?
d. Of the 350 seventh-grade students at Jackson Middle school, how many ride the bus to school?
C02_AS_EoTA_M04_T03.indd 20 8/1/17 11:20 PM

Drawing inferences: End of Topic Test Form A • 21
Drawing inferences
3. According to a new text survey of 3500 students, 12 to 15 years old, who own MP3 players and belong to a school sports team, 78% claim better sports performance if they listen to their own music while practicing.
a. what was the population in the survey?
b. was the data collected in the survey a census? why or why not?
c. what was the sample for the survey?
d. Is the “78% of the 12- to 15-year-olds who claim better sports performance if they listen to their own music while practicing” a parameter or a statistic? explain your reasoning.
e. Of those 3500 students who answered the survey, how many claim better sports performance while listening to their own music?
C02_AS_EoTA_M04_T03.indd 21 8/1/17 11:20 PM
22 • MODUle 4: analyzing Populations and Probabilities
Drawing inferences
4. stacia is helping to set up temporary basketball hoops for a weekend sports clinic for first graders. she decides to use the mean height of first-grade students at walker elementary as a guide. rather than using the heights of all the first-grade students in the school, she decides to take a sample of students.
a. what is the population for this problem?
b. Suppose Stacia decides to use 10 first graders from Ms. Ingram’s class as the sample. Is this sample a random sample? explain your reasoning.
c. Suppose Stacia decides to use 10 first-grade girls as the sample. Is this sample a random sample? explain your reasoning.
d. Suppose Stacia decides to choose the first 10 first graders to enter the school in the morning for her sample. is this sample a random sample? explain your reasoning.
C02_AS_EoTA_M04_T03.indd 22 8/1/17 11:20 PM

Drawing inferences: End of Topic Test Form A • 23
Drawing inferences
e. suppose stacia assigns every student in first grade a different number, writes each number on a slip of paper, places the slips in a cloth bag, and selects 10 slips from the bag without looking. is this sample a random sample? explain your reasoning.
f. Stacia decides to use a random number generator to select 10 first-grade students from the school. Suppose that when choosing 10 students using the random generator on the graphing calculator, Stacia’s sample is all first graders who ride the bus. Does that mean the sample is not a random sample? explain your reasoning.
Decide if each sample is random. explain why or why not.
5. asking every 25th person leaving a shopping mall if they prefer to get their news from a newspaper or from an online news source.
6. Measuring the height of all the members of the football team to find the mean height of all the students in a high school.
C02_AS_EoTA_M04_T03.indd 23 8/1/17 11:20 PM

24 • MODUle 4: analyzing Populations and Probabilities
Drawing inferences
7. Use the random number table shown.
Line 3 95639 99754 31199 92558 68368 04985 51092 37780 40261 14479
Line 4 61555 76404 86210 11808 12841 45147 97438 60022 12645 62000
Line 5 78137 98768 04689 87130 79225 08153 84967 64539 79493 74917
a. Beginning on line 4, write the first 8 random digits.
b. Beginning on line 3, write the first 8 random two-digit numbers.
c. Beginning on line 5, write the first 8 random two-digit numbers.
d. Beginning on line 4, write the first 8 random three-digit numbers.
C02_AS_EoTA_M04_T03.indd 24 8/1/17 11:20 PM

Drawing inferences: End of Topic Test Form A • 25
Drawing inferences
8. Mr. gurule is trying to decide whether to take the 7th grade to the zoo or the aquarium on a field trip. He wants to survey the students using a random sample of 5 students. He assigned each of the 145 students in the 7th grade a three-digit number from 000-144 and uses the random number table shown beginning on Line 19.
Line 18 17048 94523 97444 59904 16936 39384 97551 09620 63932 03091
Line 19 93039 89416 52795 10631 09728 68202 20963 02477 55494 39563
Line 20 82244 34392 96607 17220 51984 10753 76272 50985 97593 34320
Line 21 65285 97198 12138 53010 94601 15838 16805 61004 43516 17020
a. What are the first 5 three-digit numbers that appear in Line 19?
b. what do you think Mr. gurule should do with those numbers?
c. what are the 5 three-digit numbers to be chosen for the sample?
C02_AS_EoTA_M04_T03.indd 25 8/1/17 11:20 PM

26 • MODUle 4: analyzing Populations and Probabilities
Drawing inferences
9. Susan has a collection of 60 gift boxes in assorted sizes in her craft room. She wants to calculate the total volume that her gift boxes will hold. Suppose you stood in Susan’s craft room and selected 5 boxes for a sample. Then you calculated the mean volume of the 5 boxes you selected.
a. what is the sample?
b. is the mean volume of the 5 boxes a parameter or a statistic? explain your reasoning.
c. when you chose your sample, was it a random sample? explain your reasoning.
d. How might you randomly choose 5 boxes for your sample?
C02_AS_EoTA_M04_T03.indd 26 8/1/17 11:20 PM
Drawing inferences: End of Topic Test Form A • 27
Drawing inferences
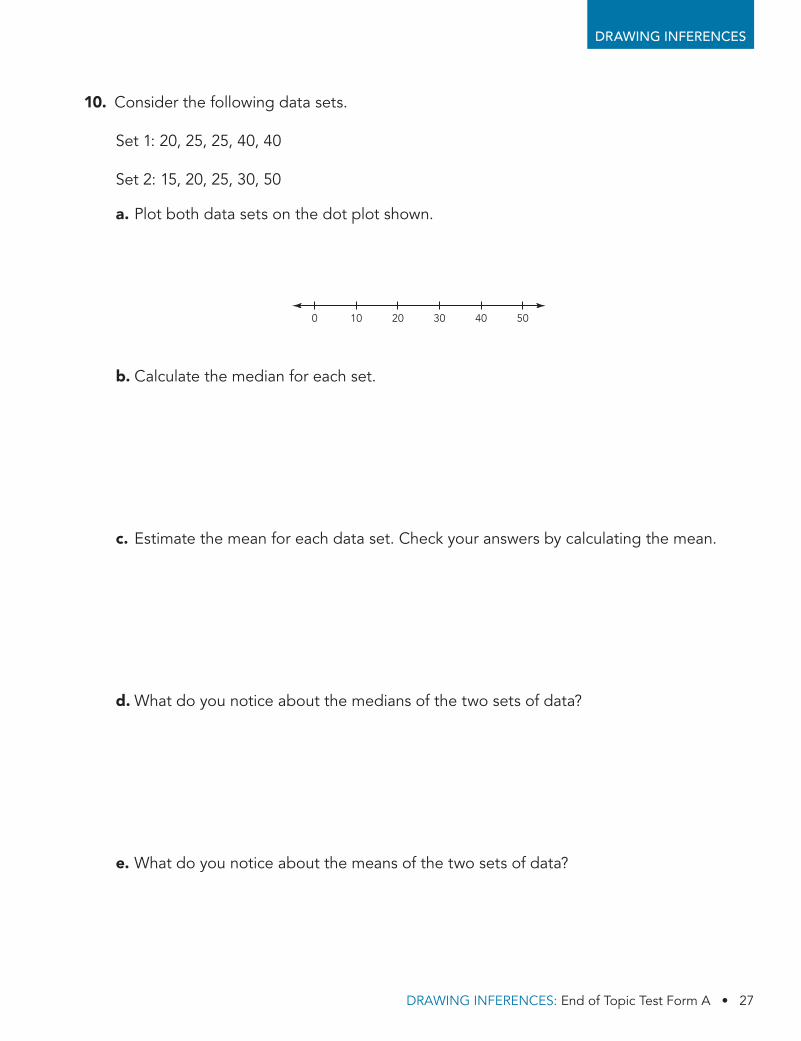
10. consider the following data sets.
Set 1: 20, 25, 25, 40, 40
Set 2: 15, 20, 25, 30, 50
a. Plot both data sets on the dot plot shown.
b. calculate the median for each set.
c. estimate the mean for each data set. check your answers by calculating the mean.
d. what do you notice about the medians of the two sets of data?
e. what do you notice about the means of the two sets of data?
0 10 20 30 40 50
C02_AS_EoTA_M04_T03.indd 27 8/1/17 11:20 PM

28 • MODUle 4: analyzing Populations and Probabilities
Drawing inferences
f. what observations can you make about the spread of the two data sets?
g. complete the tables and calculate the mean absolute deviation for each data set.
Set 1Deviation from
the MeanAbsolute Deviation
from the Mean2025254040
Mean Absolute Deviation
Set 2Deviation from
the MeanAbsolute Deviation
from the Mean1520253050
Mean Absolute Deviation
h. interpret and compare the mean absolute deviations for the two sets.
C02_AS_EoTA_M04_T03.indd 28 8/1/17 11:21 PM

Drawing inferences: End of Topic Test Form A • 29
Drawing inferences
11. Joan asked a random sample of 10 seventh grade girls and 10 seventh grade boys how much time, in minutes, they spend on social network sites each day. she recorded her results in the table.
Girls Boys
45 75 0 30 120 90 60 15 30 60 45 75 60 105 15 30 15 0 45 30
a. construct a back-to-back stem and left plot for the two sets of data.
b. Describe the distribution for the girls. Describe any clusters or gaps of the data values.
c. Describe the distribution for the boys. Describe any clusters or gaps of the data values.
d. estimate the mean data values for each dot plot. explain how you determined your answer.
C02_AS_EoTA_M04_T03.indd 29 8/1/17 11:21 PM

30 • MODUle 4: analyzing Populations and Probabilities
Drawing inferences
e. calculate the mean data values for each sample.
f. when comparing the two samples, do girls or boys spend more time on social networking sites each day?
g. calculate the mean absolute deviation for the girls and for the boys.
h. what do you notice about the mean absolute deviations of the two sets of data?
C02_AS_EoTA_M04_T03.indd 30 8/1/17 11:21 PM

Drawing inferences: End of Topic Test Form A • 31
Drawing inferences
12. Mr. williams recorded the time, in minutes, he spends talking on the phone each day for two weeks. The results are shown.
Week 1 Week 2
57, 123, 90, 138, 101, 35, 64 160, 45, 98, 115, 124, 25, 63
a. calculate the range of talk times for each week.
b. calculate and interpret the quartiles for each set of data.
c. calculate and interpret the iQr for the talk times for each week.
d. contruct box-and-whisker plots for the talk times for each week. Use the same number line for each box-and-whisker plot and place one on top of the other.
e. what conclusions can you draw from the box-and-whisker plots about the distribution of the data in each set?
C02_AS_EoTA_M04_T03.indd 31 8/1/17 11:21 PM

32 • MODUle 4: analyzing Populations and Probabilities
Drawing inferences
13. Virginia took a random sample survey of how many books students in her class read over the summer dividing the results into boys and girls. The results are in the plots shown.
0 1 2 3 4 5 6 1097 8 0 1 2 3 4 5 6 1097 8Girls Boys
Describe the overlap of the two data sets.
14. A random sample survey was taken of 6th grade students and 7th grade students to see how many pets the students have. The results are in the histograms shown.
0 1Number of pets
2
Num
ber
of 6
th g
rad
e st
uden
ts
3 4 502468
101214161820
0 1
Number of pets2
Num
ber
of 7
th g
rad
e st
uden
ts
3 4 502468
101214161820
Describe the degree of visual overlap.
C02_AS_EoTA_M04_T03.indd 32 8/1/17 11:21 PM

Drawing inferences: End of Topic Test Form A • 33
Drawing inferences
15. Both Mr. flores and Mrs. Duncan gave the same math test to their classes. The results are in the tables shown.
Mr. Flores Mrs. Duncan92 87 61 82 98 100 77 64
85 93 92 87 100 93 90
82 85 91 76 79 82 95 56
95 89 88 64 69 78 88
a. Calculate the range for each class’ test scores.
b. Compare the mean for each class’ test scores.
C02_AS_EoTA_M04_T03.indd 33 8/1/17 11:21 PM

34 • MODUle 4: analyzing Populations and Probabilities
Drawing inferences
16. lianne measures the heights in inches of two rows of flowers in her garden. The heights are in the tables shown.
Row #1 Row #239 40 45 42 46
38 39 41 48 43
14 15 17 12 19
22 18 19 16 15
a. calculate the range for each data set.
b. compare the means of the two rows of flowers.
17. The principal at Fairfax Middle School wants to meet with 10 students and get their ideas for new elective classes. Explain how to use a random number table to pick 10 random students from the school population of 650.
18. Mrs. franchelli needs to pick two random students in her class to be representatives on the student council. explain how Mrs. franchelli could use slips of paper to generate a random sample.
C02_AS_EoTA_M04_T03.indd 34 8/1/17 11:21 PM

Drawing inferences: End of Topic Test Form A • 35
Drawing inferences
19. Mr. Westin took two random sample surveys of student’s favorite pizza toppings between cheese, pepperoni, and mushroom. The results are in the table shown.
Cheese Pepperoni Mushroom Total
Sample #1 5 8 2 15
Sample #2 4 7 4 15
a. what inferences can you make based on the survey results shown?
b. considering both samples together, what percent of students prefer cheese?
c. If the total population is 150, how many students would you expect to pick cheese?
C02_AS_EoTA_M04_T03.indd 35 8/1/17 11:21 PM

36 • MODUle 4: analyzing Populations and Probabilities
Drawing inferences
20. Hank practices at the archery range on saturday and sunday. random samples of his target points for each day are in the table shown.
0–9 10–19 20–29 Total
Saturday 1 2 7 10
Sunday 1 1 8 10
at an upcoming archery competition, Hank needs to score at least 20 points to qualify for the final round. Based on the data in the table, can Hank expect to qualify for the final round? explain your reasoning.
C02_AS_EoTA_M04_T03.indd 36 8/1/17 11:21 PM