Encouraging Participation in Tax Filing via Tax Credits ... · PDF fileEncouraging...
21
Encouraging Participation in Tax Encouraging Participation in Tax Filing via Tax Credits and Social Filing via Tax Credits and Social Safety Nets Safety Nets James Alm, Todd Cherry, Michael Jones, and Michael McKee IRS Research Conference June 2008
Transcript of Encouraging Participation in Tax Filing via Tax Credits ... · PDF fileEncouraging...
Encouraging Participation in Tax Encouraging Participation in Tax Filing via Tax Credits and Social Filing via Tax Credits and Social
Safety Nets Safety Nets James Alm, Todd Cherry, Michael
Jones, and Michael McKee
IRS Research ConferenceJune 2008
IntroductionIntroductionNon-filers (“ghosts”) contribute to the tax gap.Non-filers are not in the “system”, and so may be ineligible for social programs.Non-filers may stay out of the system even when their incomes increase, thereby contributing to a larger share of the tax gap.What can be done to encourage filing (as distinct from encouraging individuals already filing a return to report more income)?

Positive Inducements for Tax FilingPositive Inducements for Tax Filing
Fiscal ExchangeAmnestiesTax CreditsSocial Safety Net
⇒ In this paper we examine the effects of tax credits and social safety nets on the filing decision.

Our MethodologyOur Methodology
Laboratory Experiments o Compliance is difficult to observe in the
field, and non-filing is even more so.In a controlled setting, we introduce filing inducements – tax credits and social safety nets.Our results suggest filing increases most with credits that are simple to obtain.

Empirical Assessment of Filing Empirical Assessment of Filing InducementsInducements
Field StudiesoAlm, Bahl, and Murray (1991)o Crain and Nourzad (1993)o Erard and Ho (2001)
Other work?
The Filing Decision and the The Filing Decision and the Compliance DecisionCompliance Decision
The compliance decision is typically analyzed as a gamble in which a filer balances the expected costs and the expected benefits of reporting another dollar.The filing decision adds another decision stage, but the issue is still the same: what is the expected utility of filing versus non-filing?
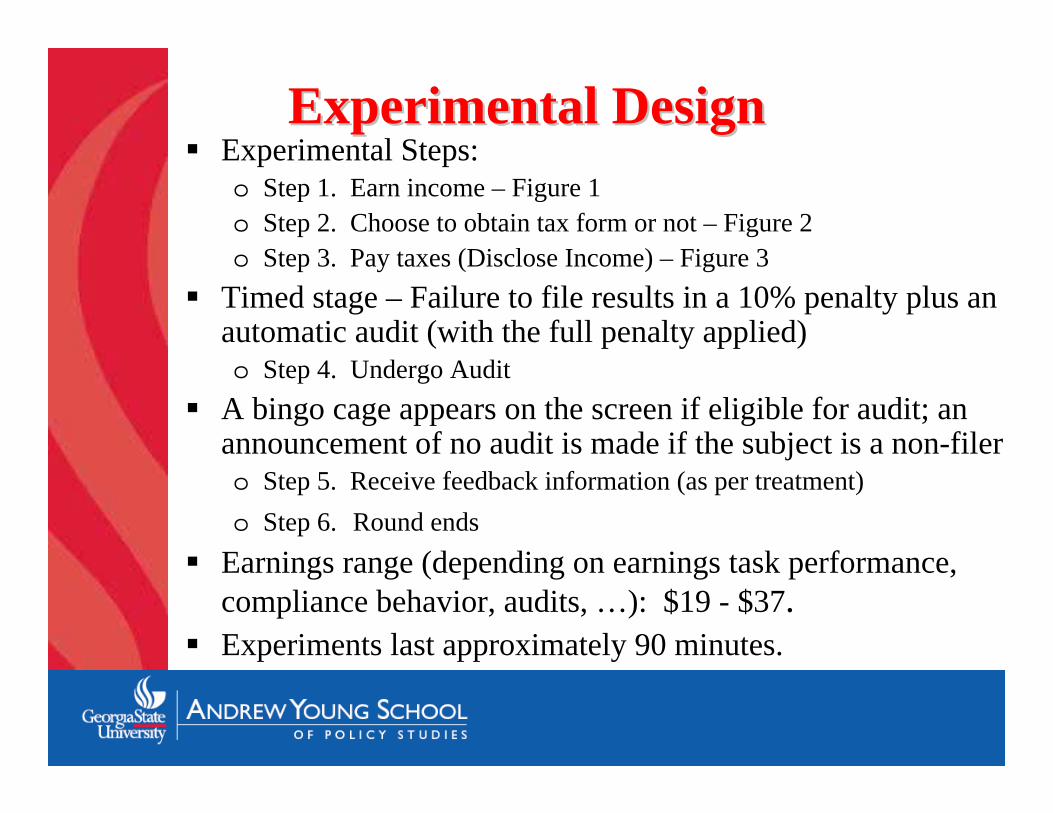
Experimental DesignExperimental DesignExperimental Steps:o Step 1. Earn income – Figure 1o Step 2. Choose to obtain tax form or not – Figure 2o Step 3. Pay taxes (Disclose Income) – Figure 3
Timed stage – Failure to file results in a 10% penalty plus an automatic audit (with the full penalty applied)o Step 4. Undergo Audit
A bingo cage appears on the screen if eligible for audit; an announcement of no audit is made if the subject is a non-filer.o Step 5. Receive feedback information (as per treatment)o Step 6. Round ends
Earnings range (depending on earnings task performance, compliance behavior, audits, …): $19 - $37.Experiments last approximately 90 minutes.

Figure 1 Figure 1 –– Income Earning TaskIncome Earning Task
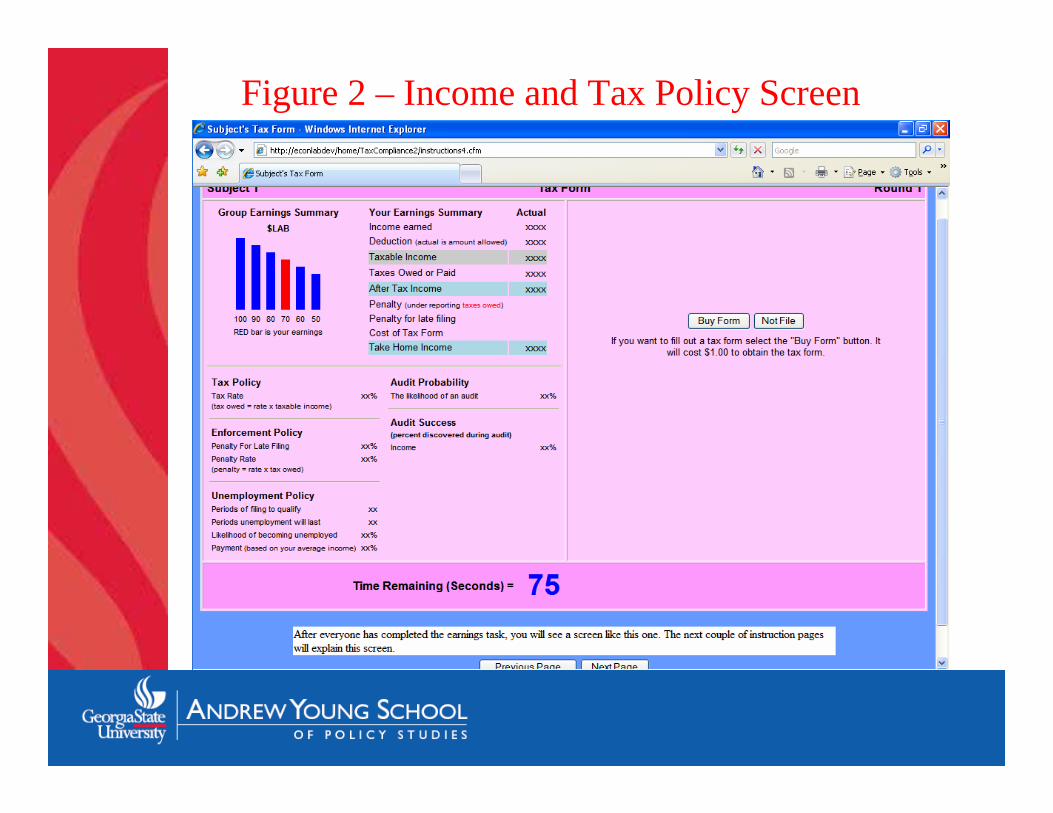
Figure 2 – Income and Tax Policy Screen

Figure 3 – Tax Form – Two Player Example with Deductions (with no Tax Credit)

Experimental Design Experimental Design –– Treatments Treatments Two Inducements to File (Treatments)o Tax Credito Social Safety Net
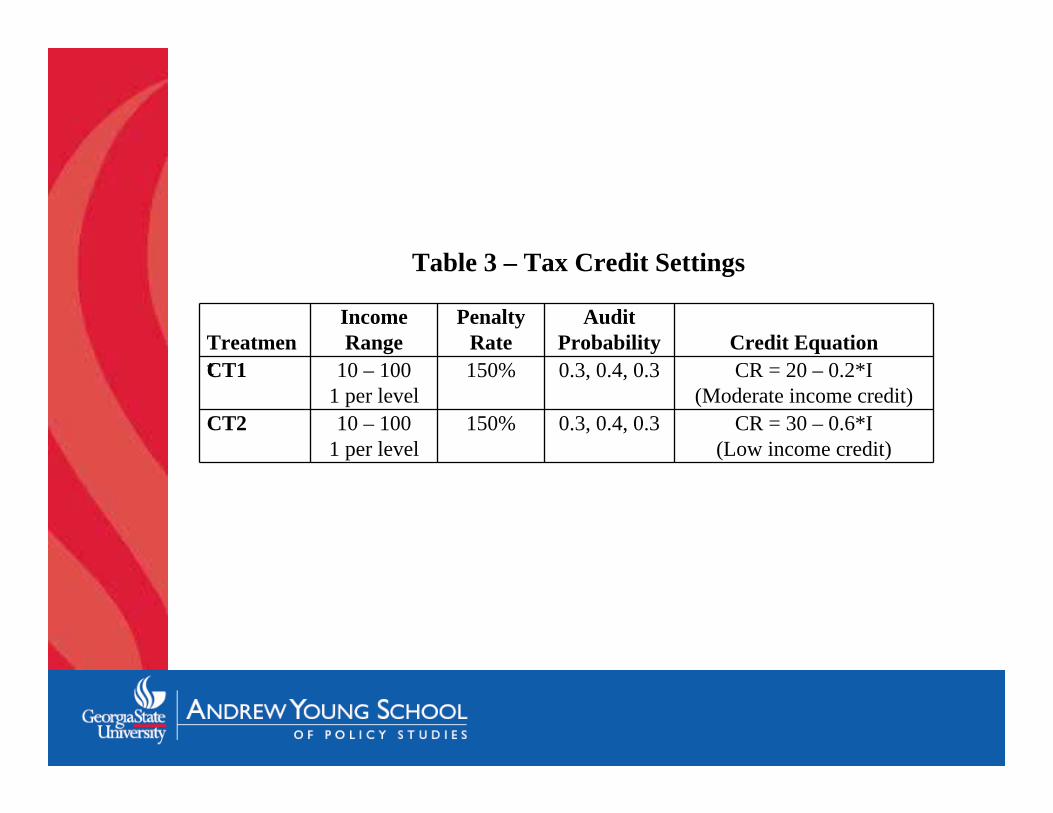
Tax Credito Low Income Target: CR = 30 – 0.6*IoModerate Income Target: CR = 20 – 0.2*I
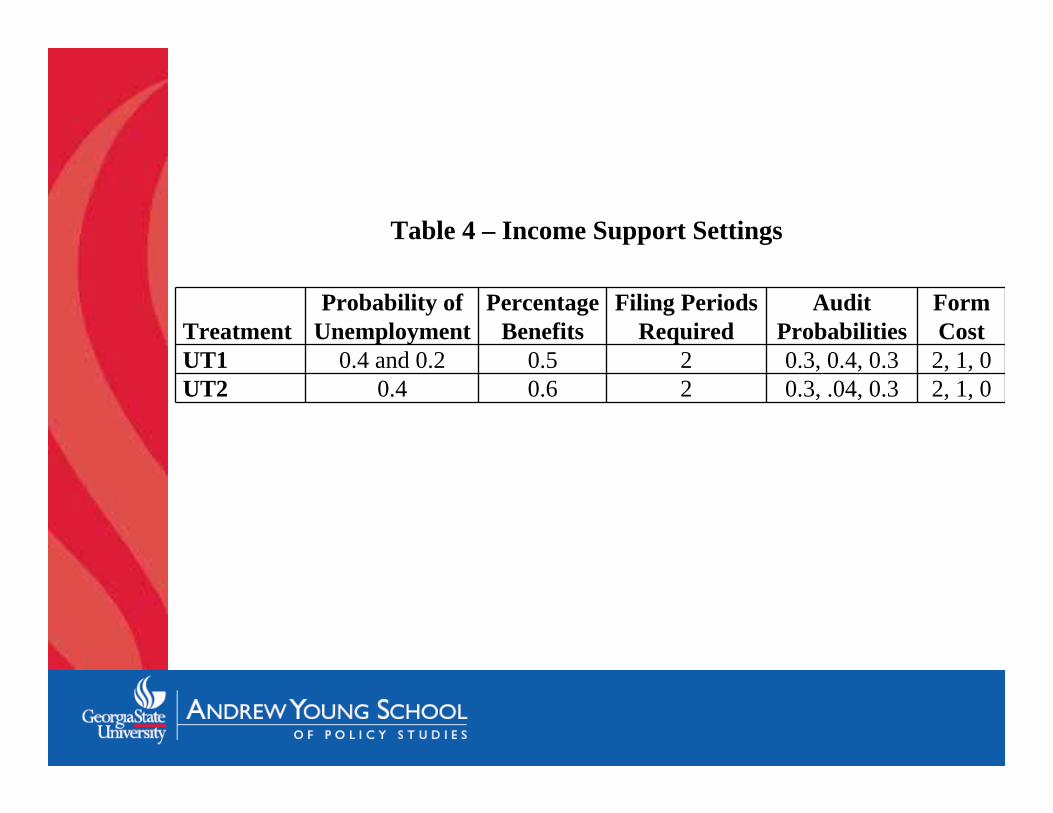
Social Safety Neto Benefits paid if unemployedo Benefits paid as a function of past filing

Treatment Sample ParametersNo Positive Inducement Cost of Tax Form and Probability of AuditRefundable Tax Credit Conditional on
Low IncomeAvailable to Low and Medium Income
Available to All Income Levels
Income (Employment) Risk Support: Moderate Percentage of Previous Income
Support: High Percentage of Previous Income
Table 1 – General Treatment Design for Investigation of Inducements to File

Treatment Tax RateAudit
ProbabilitiesPenalty
Rate DeductionIncome Range
Form Cost
NI1 35% 0.4, 0.3, 0.4 150% 15% 10 to 1001 per level
2, 1, 0
Table 2 – No Inducement Conditions
Treatment
Income Range
Penalty Rate
Audit Probability Credit Equation
CT1 10 – 1001 per level
150% 0.3, 0.4, 0.3 CR = 20 – 0.2*I(Moderate income credit)
CT2 10 – 1001 per level
150% 0.3, 0.4, 0.3 CR = 30 – 0.6*I(Low income credit)
Table 3 – Tax Credit Settings
TreatmentProbability of
UnemploymentPercentage
BenefitsFiling Periods
RequiredAudit
ProbabilitiesForm Cost
UT1 0.4 and 0.2 0.5 2 0.3, 0.4, 0.3 2, 1, 0UT2 0.4 0.6 2 0.3, .04, 0.3 2, 1, 0
Table 4 – Income Support Settings

Results and DiscussionResults and DiscussionDecisions: Obtain Form and File FormGeneral Results – Table 7

TreatmentFrequency of Filing
Frequency of Obtaining Form
Cost of Specific Program
No Inducement 0.445 0.460 N/ACredit (All) 0.624 0.660 N/ACredit (Low Income) 0.610 0.665 60Credit (Moderate Income) 0.630 0.655 90Social Safety Net 0.561 0.579 90 (expected)
Table 7 – Aggregate Filing Behavior

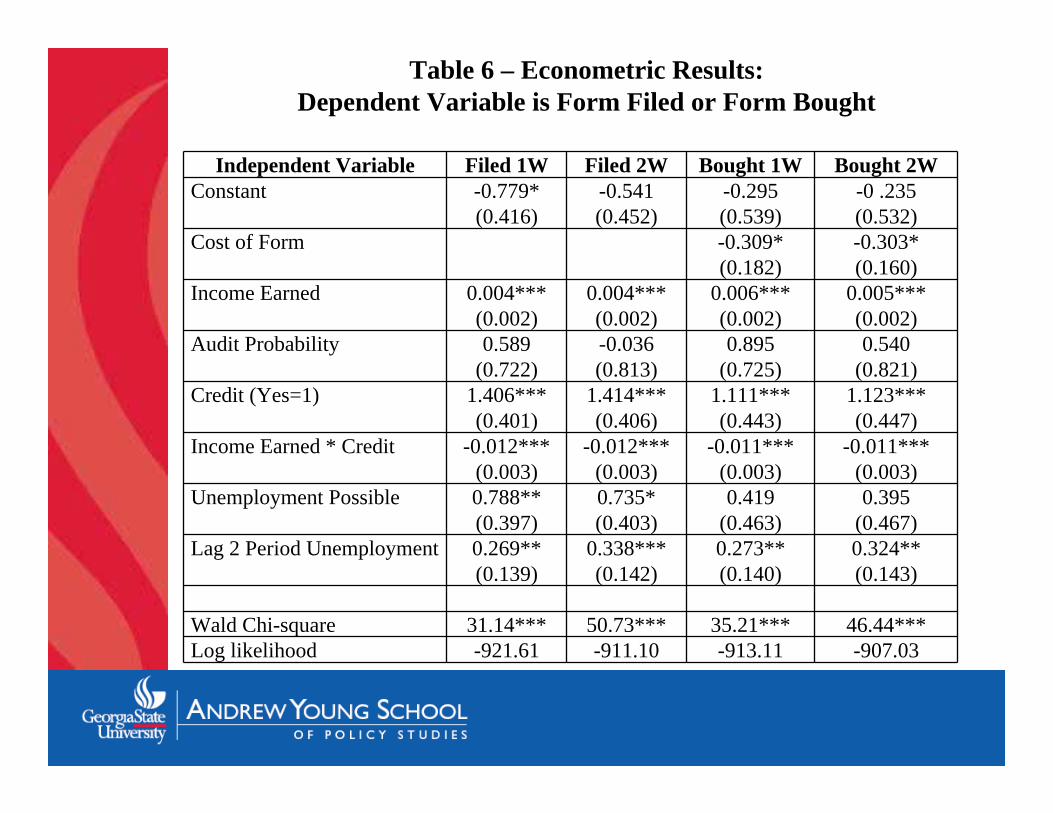
Econometric EstimationsEconometric EstimationsPanel Dataset – 106 subjects and 18 or 20 decision roundsRandom effects probit model:
where (suppressing subscripts):o T denotes the decision to buy or file a tax form in periodo P is the price to obtain a tax formo I is the subject’s earned income in the roundo p(A) is the audit probabilityo C and U are indicator variables that signifies the presence of a tax
credit and unemployment benefitso LB is an indicator variable that signifies the subject received
unemployment benefits two periods prioro I*C is an interaction term between income and credito ψ is a set of T-1 dummies that capture potential non-linear period
effectso u are random effects that control for unobserved individual
characteristics
Ti,t = β1 + β2Pi +β3Ii + β4p(A)i,t + β5Ci + β6Ui + β7LBi,t-2 + β8(I*C)i + ψt + ui + εi,t,
Independent Variable Filed 1W Filed 2W Bought 1W Bought 2WConstant -0.779*
(0.416)-0.541(0.452)
-0.295(0.539)
-0 .235(0.532)
Cost of Form -0.309*(0.182)
-0.303*(0.160)
Income Earned 0.004***(0.002)
0.004***(0.002)
0.006***(0.002)
0.005***(0.002)
Audit Probability 0.589(0.722)
-0.036(0.813)
0.895(0.725)
0.540(0.821)
Credit (Yes=1) 1.406***(0.401)
1.414***(0.406)
1.111***(0.443)
1.123***(0.447)
Income Earned * Credit -0.012***(0.003)
-0.012***(0.003)
-0.011***(0.003)
-0.011***(0.003)
Unemployment Possible 0.788**(0.397)
0.735*(0.403)
0.419(0.463)
0.395(0.467)
Lag 2 Period Unemployment 0.269**(0.139)
0.338***(0.142)
0.273**(0.140)
0.324**(0.143)
Wald Chi-square 31.14*** 50.73*** 35.21*** 46.44***Log likelihood -921.61 -911.10 -913.11 -907.03
Table 6 – Econometric Results:Dependent Variable is Form Filed or Form Bought

Discussion of ResultsDiscussion of Results
A targeted tax credit gives the highest return for its program cost.The social safety net (e.g., unemployment insurance) is less effective.For the tax credit taken up by low income participants, the coefficient on the I*C interaction term is negative.

ConclusionsConclusionsPositive inducements can increase filing.Future work?o The cost of filing reduces form acquisition but
the effect is weakly significant – further work is required.
o There may be an interaction of inducement instruments – further work is required.
o There may also be an interaction of inducements and complexity/information – again further work is required.