Encouraging Behavioural Change Through …transportforqualityoflife.com/u/files/IATBR 2003 Jones and...
36
Encouraging Behavioural Change Through Marketing and Management: What can be achieved? Peter M. Jones, University of Westminster Lynn Sloman, University of Westminster Resource paper Applied workshop 1 Moving through nets: The physical and social dimensions of travel 10 th International Conference on Travel Behaviour Research Lucerne, 10-15. August 2003
-
Upload
nguyencong -
Category
Documents
-
view
217 -
download
1
Transcript of Encouraging Behavioural Change Through …transportforqualityoflife.com/u/files/IATBR 2003 Jones and...

Encouraging Behavioural Change Through Marketing and Management: What can be achieved?
Peter M. Jones, University of Westminster Lynn Sloman, University of Westminster
Resource paper Applied workshop 1
Moving through nets: The physical and social dimensions of travel 10th International Conference on Travel Behaviour Research
Lucerne, 10-15. August 2003

10th International Conference on Travel Behaviour Research
______________________________________________________________ August 10-15, 2003
I
Encouraging Behavioural Change Through Marketing and
Management: What can be achieved?
Peter M. Jones Transport Studies Group University of Westminster London NW1 5LS
Phone: +44 (0)20 7911 5073 Fax: +44 (0)20 7911 5057 eMail: [email protected]
Abstract
Marketing and management measures – often colloquially know as soft measures – can encour-age a shift from car travel to more sustainable transport modes, and may also increase public support for direct actions to limit car use. These measures are often effective because many people lack information about alternatives to the car, even for journeys where good alternatives already exist. Other people may have a general negative image of non-car modes. Better infor-mation and persuasive marketing can help shift both attitudes and behaviour. The use of such measures is comparatively new, and transport models to predict their impacts in different cir-cumstances are not well developed. However, empirical evidence suggests that these measures may have significant impact, particularly when introduced in combination. The introduction of workplace and school travel plans, personalised travel planning, bus information and marketing, and car clubs, if applied intensively together in a conurbation, could reduce 24 hour car travel demand by 9% – 22% under different scenarios. However, induced traffic could erode some of the benefit, if soft measures were implemented without complementary traffic restraint or road capacity re-allocation. Marketing and management measures should be attractive to policy makers and transport planners, because: they are politically less contentious than some restraint measures; offer high benefit-cost ratios; and increase the benefit of investment in new sustain-able transport infrastructure.
Keywords
Information, marketing, travel plans, soft policies, attitudes, travel behaviour, International Con-ference on Travel Behaviour Research, IATBR
Preferred citation
Jones, P.M. and L. Sloman (2003) Encouraging behavioural change through marketing and management: what can be achieved? Paper presented at the 10th International Conference on Travel Behaviour Research, Lucerne, August 2003.


10th International Conference on Travel Behaviour Research
______________________________________________________________ August 10-15, 2003
3
1. Introduction
This paper examines a broad set of policy instruments under the general headings of ‘market-
ing’ and ‘management’. These include information provision and marketing initiatives, as
well as small scale measures usually introduced at or in the vicinity of particular sites (work-
places, schools, leisure facilities, etc.) to increase the attractiveness of walking, cycling and
public transport. Collectively, these are often referred to colloquially as soft measures, in con-
trast to hard measures such as major infrastructure improvements or significant service im-
provements.
It is only recently that transportation planners have started paying serious attention to employ-
ing soft measures to help meet sustainable transport policy objectives, either directly (by seek-
ing to influence travel behaviour and so encourage a voluntary switch from car travel to more
sustainable modes), or indirectly (by seeking to increase public support for more contentious
policies, such as measures to discourage car use). In a policy context where there is pressure
to contain traffic levels, yet a political nervousness to apply strong restraint measures, then
soft measures potentially offer an attractive means of addressing this problem.
This lack of familiarity with such approaches is in stark contrast with much of the commercial
sector, where the techniques of consumer marketing and management are regarded as impor-
tant means of achieving market share and maximising financial success.
One reason for the slow take-up of soft policy measures is a general lack of understanding of
the ways in which marketing and management initiatives influence travel attitudes and behav-
iour. Most of the accumulated travel behaviour and modelling research – even in the area of
activity-based analysis – is predicated on an explicit or implicit adoption of an economic
paradigm in which travellers are generally assumed to be rational decision makers, who have
perfect knowledge and take decisions that maximise their utility1.
While stated preference and related techniques have been used to explore decision making
structures (compensatory or non-compensatory, lexicographic, etc.), in the main they still op-
erate on the basis of perfect information (as provided to respondents during the experiment),
1 Random utility models do recognise that choices are probabilistic and are taken in conditions of some uncer-
tainty, but this is largely a statistical device that accommodates unexplained variation rather than explicitly
analysing the causes of that variation. Much of the effect is captured in the model constant.

10th International Conference on Travel Behaviour Research
______________________________________________________________ August 10-15, 2003
4
and there is an assumption that there is a direct and consistent relationship between perceived
and objective measures of system performance. There is usually no consideration of the pos-
sibility that reducing the disparity between perceived and objective measures might itself be
the purpose behind a policy intervention.
As a consequence, while travel demand models are generally very successful at predicting the
influence of changes in travel times and travel costs on travel behaviour, and relatively suc-
cessful in incorporating more subjective factors such as vehicle comfort, they cannot presently
take account of initiatives to change perception. For example, they could not predict nor repli-
cate the finding that a closely targeted marketing campaign can result in the doubling of the
patronage of a new tram line, compared with a control area where conventional information
was provided (Socialdata, 1999).
This issue was recognised at the last IATBR conference in the paper by Steg et al. (2001),
who noted that (p. 832): “To the authors’ knowledge, efforts for improving the current gen-
eration of transport forecasting models and efforts to develop state-of-the-art activity-based
transport models do not yet include the explicit modelling of the influence of motivational
factors on mode choice or car use.”
The authors review a large number of empirical studies that demonstrate the importance of
motivational factors in influencing travel behaviour. These factors include attitudes, emotions,
social norms and comparisons, personal norms, awareness of problems caused by cars, and
perceived responsibility and control; all can change over time, either ‘autonomously’ or in re-
sponse to explicit policy interventions. They develop a regression model relating reported
weekly car mileage to a range of socio-economic variables; by adding in just one motivational
variable (responses to a simple question on the extent to which car use contributes to envi-
ronmental problems in the Netherlands) the R2 value increases from 21.2% to 25.5%.
Recently, soft policy measures have begun to be implemented and monitored on a growing
scale, both in one-off, local initiatives and as part of national and trans-European trials. This
growing body of data and experience is resulting in insights into new aspects of traveller atti-
tude formation and behavioural response, and providing a challenge to modellers to add soft
measures to the policy packages for which they are able to predict impacts.
This paper draws on this recent evidence to explore what is now known about the impacts and
effectiveness of soft measures, and to assess the implications both for policy and travel behav-
iour analysis. A number of issues for further discussion are identified. While studies from
several countries are reviewed, the authors are most familiar with the UK experience, much of
it in the form of grey literature.

10th International Conference on Travel Behaviour Research
______________________________________________________________ August 10-15, 2003
5
The next section sets out a basic framework for analysis that addresses two key issues. First,
evidence that not all trips by car are car dependent, so there is a latent scope for voluntary
modal shift. Second, it summarises some conceptual models of attitude and behaviour change
that can help to explain the effectiveness of soft policies and guide their successful implemen-
tation.
The following section forms the core of the paper and summarises key empirical evidence on
the effectiveness of various soft policy measures. This is followed by a discussion of issues
relating to scalability and synergy: how much impact on car traffic levels could be achieved
through the widespread introduction of such measures, and are they largely complementary
(with cumulative impacts) or competitive? A number of implications for policy and research
are identified, and the paper concludes with a set of suggested issues for further discussion.
In reviewing the various soft measures, this paper seeks to report the range of impacts
achieved, not simply the most positive outcomes. There are reasons to expect either that
achievement rates might increase, or that they might reduce, over time. As professionals be-
come more familiar with soft measures and more adept at applying them, then average suc-
cess rates should increase. On the other hand, in areas with well-developed packages of soft
policy measures, it could be argued that the easy wins have already been achieved, and future
gains might be more difficult to achieve.
2. Framework for analysis
2.1 The extent of car dependency in daily travel
Although in most places in the developed world the car has the largest share of daily travel,
this does not mean that all trips currently made by car are car dependent. Several UK studies,
for example, have addressed this issue with varying degrees of sophistication.
An attitude survey by MORI (1990) for the RAC Motoring Services, among 1100 British
drivers, asked them to think about their annual driving in terms of four categories: ‘essential’,
‘important’, ‘not very important’ and ‘not at all important’. They were asked to estimate how
much of their driving fell into each category, by allocating ten points among the four. Over-
all, less than 50% of annual driving was categorised as essential, with higher scores for
women (5.1) than men (4.3), and among people aged 35-54 (5.1). Across all groups, around
10% of car travel was rated as ‘not at all important’ and another 18% ‘not very important’.

10th International Conference on Travel Behaviour Research
______________________________________________________________ August 10-15, 2003
6
A much more detailed study into car dependence for the RAC Foundation for Motoring and
the Environment was carried out by the Transport Studies Unit (1995) at Oxford University.
A variety of research techniques were employed, including in-depth interviews, opinion sur-
veys and activity/travel diaries.
The study found a spectrum of dependence on the car among the drivers interviewed, ranging
from those who strongly disliked driving (particularly in urban areas during peak periods) to
those who regarded their car as a welcome convenience – with many of the latter viewing the
car as providing independence rather than dependence. There was a tendency for car depend-
ence to grow over time, as households got used to the extra spatial and temporal opportunities
it afforded them. Segments of the car owning population varied in their level of general de-
pendence on the car, ranging from 20% to 80% of different groups claiming a high degree of
reliance. Interestingly, in the context of this paper, people who reported being most reliant on
their car had the least knowledge about current public transport alternatives (but perceived
them more negatively than other groups) – and had least interest in acquiring that information.
A detailed analysis of a selection of reported car trips found that, on average, in only 15% of
cases was there no realistic alternative to driving, though often the alternative would involve
an interchange and a doubling in average journey times; however, this figure was strongly af-
fected by location, ranging from 5% of car trips with no alternative (traditional urban area) to
35% (rural area). Overall, the study found that between a quarter and a third of respondents
reported that they would like to travel less by car, if circumstances allowed – this varied both
by residential location and by trip purpose. Thus, although car use may be regarded as essen-
tial in many situations (given current travel conditions), this does not necessarily mean that it
always represents people’s preferred means of travel.
An in-depth study for the AA Foundation (Jones and Bradshaw, 2000) found that around half
the parents who currently drive their children to/from school would prefer not to have to un-
dertake the school run. Nearly 60% of the 476 parents who were interviewed felt that meas-
ures could potentially be introduced that would enable them to stop driving their children to
school. Among the current barriers were lack of convenient public transport services and con-
cerns about traffic danger (mentioned by 66% of respondents) and exposure to strangers
(52%). Again, parents did not always have comprehensive information about the existing al-
ternatives.
Detailed work on car dependence, at the trip level, has been carried out by Werner Brög and
colleagues at Socialdata in a number of studies in several countries. In ECMT (1996), for ex-
ample, Brög and Erl draw on German studies from 1995 to look at the potential for modal
shift from car to public transport, walking and cycling. They found that 45% of current car

10th International Conference on Travel Behaviour Research
______________________________________________________________ August 10-15, 2003
7
trips could not reasonably switch mode, due either to material constraints (e.g. need to carry
luggage, health-related reasons) or the lack of a reasonable alternative mode to the same des-
tination at that time of day. Of the 55% that could in theory switch mode, there were an aver-
age of 1.3 alternatives per car trip, giving potential switches of 34% to public transport, 26%
to bicycle and 15% to walking.
In about half of the cases where the journey could in principle switch from car to another
mode (representing 28% of all car trips), there was a lack of information about the available
alternatives, or a general negative attitude towards these modes. This proportion did not vary
significantly between regions or urban areas.
This type of in-depth analysis exposes the nature of car dependency, and both indicates the
scope for reducing car use and provides clues as to the types and targeting of interventions
that might be successful in influencing driver perceptions, attitudes and travel behaviour.
2.2 Models of attitude formation and behavioural change
The various mechanisms by which changes in the provision of information and the level of
motivation might lead to changes in attitudes and behaviour have been examined in two re-
search projects funded by the European Commission: INPHORMM (IN formation and Pub-
licity Helping the Objective of Reducing Motorised Mobility) and its successor TAPESTRY
(Travel Awareness, Publicity and Education supporting a Sustainable Transport Strategy in
Europe). See Tyler (2003).2
Both studies have looked in detail at how to use information, publicity and communication
programmes to change attitudes and travel behaviour and reduce car use. TAPESTRY has
also involved carrying out and monitoring a number of demonstration projects in several
European countries. The work has been undertaken by a consortium of partners from Member
States, with the findings aimed at local authorities, public transport operators, environmental
campaigners, cycling and walking groups, and site managers and businesses.
Drawing on experience from the health sector, in particular (e.g. Fergusson et al, 1999),
INPHORMM identified a five-stage process that has to be facilitated among appropriate tar-
get groups, if changes in travel behaviour are to be achieved and sustained. This process was
characterised as the ‘Five A’s’, namely:
2 Other conceptual models have also been advanced to explain factors underlying changes in travel behaviour;
Gärling et al. (2002), for example, develop a framework drawing on goal setting theory and control theory.

10th International Conference on Travel Behaviour Research
______________________________________________________________ August 10-15, 2003
8
• Awareness of the problems
• Acceptance of the need for change
• Changing attitudes towards alternative travel modes
• Initiating action to reduce car use
• Assimilation of this new behaviour into everyday life
It was recognised that any information or marketing actions taken in accordance with this
model would need to be repeated over time, both because of changes in personal circum-
stances that lead to new demands for travel (e.g. a change of job or the birth of a child), and
due to the turnover of the population in an area, as incomers gradually replace established
residents.
TAPESTRY has subsequently developed this model further, by incorporating the Theory of
Planned Behaviour (Ajzen, 1991) and the Transtheoretical Model (Prochasaka and Marcus,
1994). It has proposed and developed the ‘Seven Stages of Change’ model shown in Figure 1.
This also regards changing travel behaviour as the outcome of a process, and incorporates a
feedback loop, from modified habitual behaviour back to awareness of new issues. Like an
iceberg, there is much action taking place beneath the surface to change perceptions, attitudes
and intentions, before any manifest behavioural change is apparent. In some respects, the
seven stage model can be regarded as a barometer: the higher an individual rises up the scale,
the closer they are to potentially making a behavioural change.
The seven stages can be described as follows:
1. Awareness of a key issue: Gaining awareness of the problems caused by car traffic
(e.g. congestion, pollution etc.), or of the difficulties experienced when travelling by car (e.g.
stress), or of the existence of suitable modal alternatives, is the first step to changing attitudes
and behaviour.
2. Accepting responsibility/acknowledging relevance: The second stage is to accept a
level of personal responsibility for, or personal contribution to, the problems and hence a po-
tential willingness to contribute to the solutions; or otherwise acknowledging that there might
be possibilities to change personal travel behaviour.

10th International Conference on Travel Behaviour Research
______________________________________________________________ August 10-15, 2003
9
Figure 1: The ‘Seven Stages of Change’ Model from TAPESTRY
7.Habitual behaviour Long-term adoption of sustainable m odes?
6.Experimental behaviour Trying out new travel choices?
5. Making a choice Really intend to m odify behaviour?
4. Evaluation of options Is there actually a viable alternative?
33 .. PP eerrcceepp ttiioo nn oo ff oo pp ttiioo nn ss Perception of sustainable m odes?
2.Accepting responsibility Accept personal/corporate responsibility?
Accept relevance of alternative m ode?
1. Aw areness of key issue Aware of the issue of traffic congestion? Aware of public transport alternatives?

10th International Conference on Travel Behaviour Research
______________________________________________________________ August 10-15, 2003
10
3. Perception of options: The most important factors at this stage are related to the “sys-
tem” (e.g. whether public transport is seen to be on time, safe, efficient, easy to use), and
those related to “society” (e.g. an individual’s reliance on the views of other people in shaping
their own attitudes and behaviour).
4. Evaluation of options: People may perceive different modes in different ways, and the
way in which they prioritise the characteristics of the alternatives may vary according to par-
ticular circumstances. People will only consider voluntarily changing their current mode if
they have a positive perception of the alternatives with regard to the factors that are most im-
portant to them.
5. Making a choice: This fifth stage relates to whether an individual really intends to
change to using an alternative mode for certain trips. The establishment of an intention to
change, resulting in a plan to change, is one step before a change in behaviour can be ob-
served.
6. Experimental behaviour: Trying out the new mode for certain trips on an experimental
basis is the penultimate step. If the experience is positive, then this change may become more
permanent. If, however the (positive) perceptions are not confirmed by experience, then it
may lead to a re-evaluation of the options and a relapse to the old pattern of behaviour. It
may also lead to a re-assessment of their actual/stated level of concern about the underlying
problem.
7. Habitual behaviour: The final stage is the long term adoption of the new mode for cer-
tain trips. When this stage has been reached, the old habitual behaviour has been broken and
a new pattern established. This is final goal of a programme to change travel behaviour, but it
is the most difficult to achieve.
The model has formed the basis of a set of questions, designed to address each of the seven
stages, as part of the TAPESTRY monitoring and assessment of the case studies.
Implications
Both INPHORMM and TAPESTRY have established that achieving sustained changes in atti-
tudes and behaviour cannot be realised simply through one-off events, such as ‘Car Free’
days, though these may play a useful contributory role. Rather it requires the development of
a comprehensive, long term communications strategy. This should ensure that all local agen-
cies involved in developing and implementing transport policies, or providing transport ser-

10th International Conference on Travel Behaviour Research
______________________________________________________________ August 10-15, 2003
11
vices, should be consistent in the messages and strategies that they employ. These also need
to be consistent at local, regional and national levels.
An important finding from this work is that there is a need to adopt a phased approach for
achieving change; and that an appropriate campaign to achieve one step of the process would
be unsuited to realising another. In particular, the research has identified two key phases and
three elements that are associated with a move from a broad-brush to a highly focused cam-
paign, as the emphasis gradually switches from awareness raising to changes in individual be-
haviour. In the context of an overall objective to reduce car use, these might be organised as
follows:
Phase 1: campaigns to raise public awareness and acceptance of the need for change. A
general recognition of the existence of transport-related problems that require some form of
action to ameliorate them is a prerequisite to achieving any change in attitudes and behaviour.
Only when there is a critical level of awareness will groups such as the business community
accept that reducing car use is a relevant topic for discussion, and one in which they should
actively engage.
Here wide-ranging communication tools are appropriate, to build up levels of awareness
across the appropriate communities. These include posters, local cinema and radio advertis-
ing, media events and travel awareness initiatives. Bringing other agencies on board (e.g.
health, environment) can assist in gaining credibility and coverage. It is also important to in-
volve key employees from the relevant organisations, so that they are aware of and supportive
of the campaign in their dealings with members of the public.
Typical messages might include:
• “Current air quality is a danger to health, and traffic growth is a major cause”
• “Traffic congestion is bad and is going to get worse”
• “City life is being threatened by the dominance of the car”
Phase 2A: initiatives targeted on particular groups to encourage attitude change and ex-
perimentation. Here it is necessary to carefully target particular groups and settings, in order
to provide messages and information of more direct relevance to individuals. At the same
time, however, it is important to continue with a base level of awareness raising initiatives, in
order to maintain the momentum and bring newcomers up to speed.
Much of this activity will be channelled through particular sites, such as schools, hospitals,
offices, leisure centres, where particular target groups can be identified; in most cases, these
comprise at least employees and visitors. Adopting a site level focus enables information of

10th International Conference on Travel Behaviour Research
______________________________________________________________ August 10-15, 2003
12
direct relevance to be supplied (e.g. pattern of bus services to the site), provides opportunities
for local initiatives based around the site (e.g. a car pooling scheme) and adds an element of
peer group support and pressure. The increasing number of companies now promoting travel
plans or mobility management usually incorporate such measures in their initiatives.
Typical messages might include:
• “Cycling and walking to school improve children’s health and independence”
• “Less car use means less congestion and pollution around sites”
• “Car parking space can be used more productively for other purposes”
• “Encouraging sustainable travel is good for the image of a company”
Phase 2B: Individualised campaigns. Once awareness in a local community has reached a
critical mass, then significant changes in travel behaviour can be assisted by also targeting in-
dividuals in their households. Here the aim is to achieve a general reduction in levels of
household car use, wherever suitable alternatives exist.
The most effective techniques involve identifying households with a propensity to change be-
haviour, and then providing highly personalised packages of information. This is an interac-
tive communication process, usually involving at least telephone contact and in some cases a
personal visit.
Typical messages might include:
• “Reducing car use saves money and hassle”
• “Walking and cycling is a cheap way to exercise”
• “Small changes in individual behaviour add up to big differences on the road”
INPHORMM suggested a sequential approach, starting with Phase 1 and moving on to Phase
2A and then Phase 2B. However, alternative sequences (e.g. developing individualised cam-
paigns before moving on to site-based campaigns) also seem to be effective: there are no hard
and fast rules.
3. Evidence of the effectiveness of measures
Here we look at a number of the more common marketing and management measures that
draw on four main approaches:
• Awareness raising, designed to increased awareness of the need for – and opportuni-ties for – change, either as a prelude to encouraging voluntary changes in personal

10th International Conference on Travel Behaviour Research
______________________________________________________________ August 10-15, 2003
13
travel behaviour, or to increase acceptance of the need for local authorities to intro-duce measures to curb car use (e.g. lower speed limits, or traffic restraint measures).
• Techniques such as Individualised Marketing and Travel Blending, which provide detailed, personalised information about modal alternatives (so increasing subjective choice sets), as a basis for encouraging experimental changes in behaviour. These techniques do not usually involve any changes in transport service provision.
• Site-based travel planning (i.e. management), designed both to provide information and increase the relative attractiveness of modal alternatives through modest im-provements in provision, thereby increasing both subjective and objective choice sets. The approach is known in much of Europe as mobility management and now supports an annual conference (see www.epommweb.org).
• Techniques which couple more major improvements in the objective choice set (e.g. a new or upgraded bus service or a ‘car club’ to encourage collective car ownership) with information, branding and targeted marketing. Here it can be difficult to deter-mine how much of the resulting behaviour change is due to the marketing and man-agement (soft) measures, and how much is due to the changes in transport service provision, as the two are tightly packaged together. Under this heading we discuss public transport information and marketing (as part of wider strategies to encourage public transport use) and collective car ownership, through the development of car clubs.
Mobility management has been comprehensively assessed in a large scale demonstration pro-
ject called ‘MOST’ (Mobility Management Strategies for the Next Decades) supported by the
European Commission. (See http://mo.st). Site-based travel plans have been under develop-
ment in Europe and North America for a number of years. Early applications were introduced
at major workplaces and schools. More recently, the approach has been extended to retail,
tourist and leisure sites (e.g. large sports stadia), but in these latter cases insufficient evidence
has yet accumulated to be able to make a general assessment of their effectiveness. In this sec-
tion, we therefore limit ourselves to workplace and school travel plans.
Since the preparation of this paper, the UK Department for Transport has issued the findings
from a major research study that examined a large body of empirical evidence concerning the
effectiveness of soft factors (see Cairns et al 2004), and has provided an action guide for local
authorities under the slogan ‘making smarter choices work’ (Department for Transport, 2004).
3.1 Travel awareness campaigns
Awareness raising campaigns have been widely used as a means of promoting government
policy, for example in the areas of health promotion (e.g. safe sex or smoking campaigns) and
road safety (e.g. drink driving or seat belt campaigns). In the latter case, these campaigns have
been run as a precursor (and successor) to national legislation, in part to prepare the popula-
tion for regulatory action and later to inform them of its implementation.

10th International Conference on Travel Behaviour Research
______________________________________________________________ August 10-15, 2003
14
A report prepared for Hampshire County Council (1993), as part of the development of a
county-wide awareness raising initiative, reviewed a wide range of campaigns from different
sectors. In general, success was judged mainly in terms of the level of awareness of the cam-
paign message among the population, but a small number went further to measure impacts on
behaviour. Examples included:
• A campaign to reduce home burglaries led to a high increase in awareness of the is-sues and a more than doubling of sales of window locks in the areas exposed to the advertisements.
• A regional advertising campaign to reduce cycle accidents, by asking drivers to give them more room on the road, resulted in a 30% recall of the campaign overall. Inter-estingly, although there was no significant change in driver attitudes towards cyclists, cycle accidents in the affected region dropped by around 15%, though the numbers of cycle trips were unchanged.
• A campaign to encourage seat belt wearing in rural parts of Australia achieved an awareness level of 83% and a 3% increase in seat belt use.
All of these examples included television advertising.
During the early 1990s the TravelWise initiative was established in the UK, and now involves
the majority of local authorities in a series of awareness raising and information provision ini-
tiatives to encourage a switch from car to public transport, walking and cycling. These initia-
tives often provide a backcloth to the development of workplace and school travel plans, by
helping to raise local awareness of the need to take action.
The regional public transport authority for Madrid (Consorcio de Transportes de Madrid) ran
a high profile campaign between 1989 and 1991 to increase awareness of improved services
and new ticketing options, and to gain support for increasing public transport priority meas-
ures on the road network, using television, press, radio and leaflets/posters. It characterised
cars as turtles, moving slowly in city traffic. The campaign achieved its main objectives, to
improve the image of public transport, raise awareness of services and increase support for
public transport priority measures (INPHORMM, 1998).
Several city councils have employed awareness raising techniques to increase support for lo-
cal traffic restriction policies. For example, as a consequence of a sustained public awareness
campaign in Kassel, Germany, public opinion in favour of giving cars priority in city planning
dropped from 27% in 1988 to 9% in 1994, and support for 30kph speed limits in residential
areas increased from 67% to 92% over the same period (INPHORMM, 1998).

10th International Conference on Travel Behaviour Research
______________________________________________________________ August 10-15, 2003
15
3.2 Personalised travel planning
Personalised travel planning provides pro-active travel advice and information to people
based on an understanding of their personal travel needs and trip patterns. It appears to be a
very successful form of intervention because, as previously noted, many people make jour-
neys by car for which a reasonable alternative (public transport, walking or cycling) already
exists, but of which they are unaware.
Most of the experience of personalised travel planning comes from work by two different
consultancies. The German organisation Socialdata has developed a technique, which it calls
‘Individualised Marketing’. British transport consultant Steer Davies Gleave has developed
another approach, which it calls ‘Travel Blending’.
One of the larger trials of Individualised Marketing was in Perth, Western Australia, and in-
volved contact with just under 15,000 households (TravelSmart, 2001). Here the aim was to
encourage a switch from car driver to all other modes3. Each household in the chosen area
was contacted and offered information about alternative modes; those who expressed interest
(55%) were sent a range of information, according to requirements, and existing public trans-
port users were thanked for their support; those not at all interested were not pursued further.
Random sample surveys before and after the project showed a fall in car driver trips in the
area of 14% (down from 60% to 52% of trips by all modes), and a fall in vehicle kilometres of
17% across the population as a whole (suggesting that not only were people switching from
car to other modes, but that some destination switching or trip-chaining had also been taking
place).
Other Individualised Marketing projects have shown comparable results, with car driver mode
share in urban areas generally falling by 7% – 14% (across different trials mainly targeting
public transport modal shift in Germany, Australia and the UK), and rather lower reductions
in car driver mode share (2% – 6%) in a smaller number of rural trials.
Travel Blending differs from Individualised Marketing in that it requires more involvement
from participants, who complete ‘before’ and ‘after’ travel diaries, with specific suggestions
for changes to travel behaviour being supplied to participants based on an analysis of their
first diary. It also seems to be effective in reducing car driver trips among participating
3 Most of the European applications focus on the switch from car to public transport only.

10th International Conference on Travel Behaviour Research
______________________________________________________________ August 10-15, 2003
16
households, with reductions in car driver mode share of 8% – 15%; however, take-up can be
relatively low due to the effort involved4.
Travel Blending encourages participants to chain car trips as well as to switch to greener
modes, which means that its effect on car mileage may be much greater than its effect on car
trips. More recent applications have also been promoted as part of a ‘Living Neighbourhood’
initiative, in which the whole community is encouraged to take part in actions to promote
more sustainable travel and other more sustainable activities (see Ampt, 2003).
Some experience is also reported from personalised journey plans that have been prepared for
employees as part of a workplace travel plan. For example, the South Yorkshire Passenger
Transport Executive has distributed personalised journey plans to 1300 employees, mainly
based at nine organisations. Follow-up monitoring has found an 18% increase in bus use, 10%
increase in train use and 12% increase in tram use. At the Meadowhall shopping centre (a
large edge of city hypermarket outside Sheffield), personal plans were prepared for 250 man-
agement staff, resulting in a 19% shift from car to bus (see Cairns et al. 2004).
Fujii and Taniguchi (2003) report on a small Japanese trial, in which asking households to
prepare travel behaviour plans resulted in significant reductions in car use (more than a 25%
reduction in total trip duration), whereas providing general advice/information to an equiva-
lent sample had no significant effect5.
One concern that has been expressed about personalised travel planning is that its effects may
be short-lived: people may quickly slide back into their old travel habits after the intervention
and monitoring have been completed. However, there is evidence to suggest that this is not
the case. In the South Perth pilot study, follow-up monitoring a year later found the change in
travel behaviour had not only been sustained but that there had been a slight further decrease
in car use. Follow-up monitoring was carried out in Nürnberg, Germany, two years after the
Individualised Marketing project, and in Kassel, Germany, four years after the project
(INPHORMM, 1998). In both places, the initial increase in public transport use was still evi-
dent at that time.
4 These figures are not strictly comparable with the Individualised Marketing findings, as the latter quotes results
based on the entire population approached, whereas Travel Blending results do not include households who
do not participate or who have dropped out.
5 Gärling and Rise (2004) report on several studies that show how the preparation of a plan to change behaviour,
rather than simply reporting a general intention to change, strongly increases the likelihood of implementing
that behavioural change.

10th International Conference on Travel Behaviour Research
______________________________________________________________ August 10-15, 2003
17
Travel Blending in Adelaide, Australia, has also found that the changes in behaviour have
been maintained after the project was completed. A sample of participants interviewed six
months after the initial programme had reduced their car use by a further 5% as a result of a
combination of factors: people ‘taking a while to get round to it’; developing other measures
themselves; changing school or job; or moving house (Ampt et al 1998).
Finally, it is interesting to see which journey purposes are most affected by personalised travel
planning. In the Nürnberg and Kassel Individualised Marketing projects, the greatest increase
in public transport use was for shopping and leisure trips, which accounted for more than 70%
of the behaviour change.
3.3 Workplace travel plans
Workplace travel plans use a combination of pull and push measures to encourage people to
use public transport, walk or cycle to get to work. Pull measures might include special staff
buses; discount tickets for public transport; cycle parking and other cycle facilities; car-
sharing schemes; and parking ‘cash out’ schemes which pay staff extra on the days they do
not drive to work. While push factors usually include restrictions on car parking, ranging from
preferential parking places for car sharers to the introduction of parking charges.
The aggregate impact of workplace travel plans in an area depends on the number of work-
places adopting a travel plan (that is, the level of take-up), and the average effectiveness of
individual plans. A British study (DTLR 2001a) found that public sector organisations such as
local authorities and hospitals were much more likely than private companies to have adopted
a travel plan; and within the private sector, take-up was higher amongst companies with over
300 employees. This study also found evidence that travel plans were rapidly becoming more
common: 24% of local authorities had drawn up a travel plan, compared to just three 3% in an
equivalent study three years earlier (DETR 1998).
Several studies have examined the average effectiveness of individual travel plans. Again in
Britain, a recent study commissioned by the Department for Transport (2002) analysed the be-
fore and after car use of staff at 20 private and public sector workplaces where travel plans
had been implemented. On average, travel plans had reduced the number of commuter cars ar-
riving by more than 14 per 100 staff (equivalent to an 18% reduction in the proportion of
commuting journeys made as a car driver). There was considerable variation, from 3 to as
high as 52 fewer cars per 100 staff across the 20 employers.

10th International Conference on Travel Behaviour Research
______________________________________________________________ August 10-15, 2003
18
Other studies have found similar results, although some have also been able to show that
travel plan effectiveness is related to the number and type of measures implemented. Their
findings are summarised by DfT (2002):
• A review of Dutch studies and survey of 40 Dutch organisations found that plans containing basic measures (such as car-sharing schemes) reduced car mileage by 6% – 8%. Plans with ‘luxury’ measures (such as works buses) and/or push measures (such as parking management) achieved reductions in the range 15% – 20% (Ligter-moet 1998). Another review of Dutch travel plans by Touwen (1999) came to similar conclusions.
• In the US, a study of travel plans implemented by 49 employers found an average vehicle trip reduction of 15.3%. Travel plans which only provided information achieved no car trip reduction; those with alternatives to the car (such as van pools) reduced car use by an average 8.5%; those with financial incentives (such as transit subsidies) achieved a 16.4% reduction; and those providing both financial incentives and alternatives such as van pools achieved a 24.5% reduction (TCRP, 1994).
The European Commission MOST project co-ordinated demonstration projects at a number of
different kinds of site. One was at a technology park, about 15km outside Malaga, with poor
public transport access. While around 75% of employees travelled to work by car before the
introduction of the travel plan, two-thirds expressed an interest in using alternatives, such as
public transport, car pooling or telecommunications. A bus route was extended from the en-
trance of the site to serve the main workplaces, and a car pool matching scheme was provided
on the site’s intranet. Both were heavily advertised among employees. As a result, the car
driver share dropped from 74% to 63%, car sharing increased from 13% to 19%, and bus use
rose from 9% to 12% (MOST, 2003).
There is some evidence that the impact of individual workplace travel plans may become
greater the longer they are in place. For example, Shoup (1997) studied the role of a parking
‘cash out’ programme in eight Californian businesses. For one firm, monitoring data was
available for three years after the cash-out programme began, and single-occupancy car mode
share fell in each of the three years. The DfT (2002) study included three employers where
monitoring had been carried out over several years. One showed a steady fall over time in
staff driving to work. The others showed an initial fall, followed by an increase, followed by a
further decline. These findings led the authors to conclude that there is no ‘natural maximum’
level of use of sustainable modes, and that over time the potential for modal shift is likely to
increase.
The impacts of workplace travel plans may increase over time for several reasons:
• More measures: the longer a travel plan goes on, the more range of incentives that can be put in place.

10th International Conference on Travel Behaviour Research
______________________________________________________________ August 10-15, 2003
19
• Turnover of employees: new employees are less likely to have fixed ideas about how to get to work, and may be more receptive to options such as car-share matching or cheap public transport.
• Ideas take root: as employees see ‘early adopter’ colleagues trying new ways of get-ting to work, the idea that they could try these too will gradually take root.
This is not to say that the benefits of travel plans are in any way automatic: the experience of
travel plan co-ordinators shows that successful travel plans require determination and sus-
tained commitment.
3.4 School travel plans
Growth in the car-based school run has led to increasing traffic congestion at the school gate
and growing concerns about traffic accident risk in the vicinity of schools, which in turn is
prompting interest in school travel plans. Measures to encourage non-car travel to school are
also perceived to be important because it is believed that sustainable patterns of travel behav-
iour learnt by children may be carried into adult lives (and conversely, children who never
travel by bike or bus are less likely to switch to these modes in adult life). There is a health
benefit too: tentative evidence suggests a correlation (although not necessarily a causal link)
between levels of cycling in different European countries and overweight problems among
children (Department for Transport, 2003a).
Many school travel plans concentrate on education and information measures, perhaps cou-
pled with initiatives such as ‘walking buses’ and, more recently, ‘cycle trains’. These involve
volunteer parents escorting groups of children by foot or by bicycle on a fixed route. Some-
times these measures are accompanied by physical street improvements, such as traffic calm-
ing, 20mph zones, cycle lanes and safe crossings. More uncommonly, measures to encourage
bus use are promoted: for example personalised timetable information, discount tickets, new
bus services and dedicated school buses.
Jones and Bradshaw (2000) concluded that improvements to public transport offer the greatest
potential to reduce car escort mileage, because most car mileage for this journey purpose is
associated with trips too long to be walked or cycled. However, they also note that there are
often multiple factors encouraging parents to drive their children to school, including lack of
supervision before and after school (to tie in with bus service timetables) and lack of secure
locker facilities for coats during the day, sports gear over night, etc.
Sloman (2003) reported before and after monitoring data on 17 school travel plans, gathered
from a variety of sources. As with workplace travel plans, there was considerable variation in
outcomes: the number of cars arriving per 100 pupils declined by between 4 and 23 (equiva-

10th International Conference on Travel Behaviour Research
______________________________________________________________ August 10-15, 2003
20
lent to a reduction in car use of between 8% and 52%). However, the three schools with the
lowest before car mode share (all under 10%) failed to achieve any further reduction (and in
fact, in one case car mode share slightly increased).
In research commissioned by DTLR (2001b), only four local authorities felt they had suffi-
cient experience to estimate the impact of school travel plans. One authority judged that travel
plans typically reduced car travel at targeted schools by 30%; the other local authorities gave
estimates of between 10% and 20%. Further data on the impact of school travel plans in Brit-
ain is provided in Cairns et al (2004).
As with workplace travel plans, there is some evidence suggesting that impacts may grow
over time. The potential to influence mode choice for the journey to school may be increased
because a new cohort of children and parents arrives each year, receptive to information and
encouragement to walk, cycle, or travel by public transport.
Although there has been considerable interest in the concept of school travel plans for some
time – especially from transport professionals – there has been a slow take up among schools
in Britain. The DTLR (2001b) report estimated that 4% – 5% of schools had implemented
travel plans, with a comparable proportion having one firmly planned. However, the UK
government has now switched its initial support for workplace travel planning to focus re-
sources on school travel plans (Department for Transport 2003b). Substantial funding is be-
ing provided for local authority school travel plan advisers, and schools will be provided with
additional cash to help implement measures in their plans (typically, 7,500 euros for primary
schools and 15,000 euros for secondary schools). The aim is to achieve 100 percent coverage,
as soon as possible.
3.5 Public transport information and marketing
Soft measures to encourage greater public transport use involve a variety of techniques, rang-
ing from generalised (non-targeted) information about routes, frequencies and fares, to highly
targeted personal journey planning services. A report by TAS (2001) listed a range of tech-
niques available to promote bus use, as follows:
• Displays at bus stops / vehicles with times or frequencies of services; maps of local area around bus stops; named bus stops; interchange information.
• Real-time displays at stops or on vehicles.
• Branding of vehicles with service details, and branding services at stops.
• Individual timetables, booklets and maps.
• Phone enquiry lines.

10th International Conference on Travel Behaviour Research
______________________________________________________________ August 10-15, 2003
21
• Internet information.
It can be difficult to distinguish the impacts of these soft measures from conventional (hard)
measures to encourage public transport use, such as changes to infrastructure to give buses
greater priority in the traffic flow; improvements in vehicle quality; changes to service fre-
quencies; and changes to fares and ticketing, because hard and soft measures are usually in-
troduced together. So reported effects on patronage are the result of a mixture of interven-
tions.
However, there is some evidence to suggest that soft measures are playing an important part
in the behaviour change arising from these mixed interventions. For example, Brighton, a
British south-coast city that has placed particular emphasis on information-based measures to
encourage public transport use, has seen bus patronage increase by 50% over the last ten years
(while the rest of Britain has experienced a decline in bus use). The measures adopted in
Brighton include one-stop travel information shops (covering all modes) in the town centre
and at the railway station; a colour-coded network of bus services; a phone-based travel en-
quiry service; leaflets to promote bus access for leisure walks in the surrounding rural area;
and more recently, large, freestanding real-time information displays three metres away from
bus shelters, which are intended to attract motorists’ attention. A very simple ticketing system
(a flat fare of £1 for any trip) is also perceived by the local authority to have helped attract
passengers6.
Strong branding and easy-to-understand networks have helped increase bus use in the city of
Cambridge. Here, the bus network was cut from about 12 services to a simpler six service
network. This enabled service frequency on three routes to be increased to every 10 minutes.
The new service was publicised using high-quality guides and maps for individual services,
and pocket-sized timetables. Park and Ride buses were coloured blue, red or green depending
on which park-and-ride site they served. Patronage increased by 25% in the four months fol-
lowing the re-design of the network (CPT, 2002).
Brighton and Cambridge are examples of the use of generalised information and strong brand-
ing, but do not involve marketing targeted at specific sectors of the population. In Perth, Scot-
land, the bus operator ran a targeted marketing campaign to encourage increased bus use on a
poor performing, low frequency bus route with a catchment profile of aged owner-occupiers
with high car dependency. Marketing was accompanied by service improvements: frequency
6 Personal communication from Paul Crowther, Principal Public Transport Officer, Brighton and Hove Council.

10th International Conference on Travel Behaviour Research
______________________________________________________________ August 10-15, 2003
22
doubled, low floor buses were introduced, fares were simplified and the council introduced
bus priority measures and new bus shelters. The marketing included launch publicity, door-to-
door interviews with potential customers, the offer of free trips, and promotions such as chil-
dren’s competitions and pensioners’ lunches. This was followed by a telephone-based direct
marketing campaign targeted at non-users. Patronage grew by 56% over two years, and the
telephone marketing campaign resulted in conversion to public transport of 7-8% of those
non-users contacted (Stagecoach, 2002).
3.6 Car clubs
Car clubs provide member households with access to a car when it is needed, without the high
fixed costs of individual car ownership. Car club members are able to mix-and-match their
travel patterns, using a car when that is the best option, but travelling by foot, bike or public
transport at other times; they are also usually able to access a range of vehicle types to match
their needs on different occasions. Because car club members pay all the costs of car use as
they drive, they are directly aware of the operating costs involved and rational decision-
making about which mode to use for each trip is encouraged. By changing the way transport
costs are perceived, there is evidence that car clubs stimulate behavioural change.
Car clubs have proved more successful in some countries than in others. In Switzerland and
Germany, car club growth has been rapid. According to the German car club umbrella organi-
sation Bundesverband Carsharing, all large cities in Germany (over 200,000 people) now
have a car club and there are more than 50,000 individual members altogether. In Switzerland,
one national organisation, Mobility, was formed by the merger of several car clubs. Mobility
has members in some 400 communities, and a total membership of around 50,000. Car clubs
are also proving popular, although on a smaller scale, in North America. In mid-2002 US car
clubs had between them about 11,500 members, and Canadian car clubs had about 5000
members (Shaheen and Meyn, 2002). In other countries car club growth has been much
slower. For example, in the UK around a dozen cities have car clubs, mostly with a member-
ship of about 30 – 60 people, with the largest (in Edinburgh) having a little over a hundred
members.
It is difficult to judge how much the relative success of car clubs in different countries is a
consequence of cultural differences in attitude to car ownership and use, which might be diffi-
cult to change, and how much it is related to the presence or absence of support mechanisms
to enable car clubs to become established. The fact that car clubs seem to be doing well in
North America, where membership is marketed as convenient and cool, and in Germany and

10th International Conference on Travel Behaviour Research
______________________________________________________________ August 10-15, 2003
23
Switzerland, where the green virtues are more strongly promoted, suggests that car clubs can
be made to work in different cultural contexts.
Research reported in Muheim (1998) and Meijkamp and Aarts (1997) has investigated how
people’s travel habits change when they join a car club. Broadly, there are three types of be-
haviour. Some people give up their personal car when they join a car club, and this group ap-
pears to cut its car mileage by about 60% – 70%. Others join a car club but keep their existing
car, so the car club effectively functions as providing a second household car. This group in-
creases its car mileage, but only by a few percentage points. Finally, people who were non-car
owners before joining a car club seem to use the car club as an alternative to taxis, lifts from
friends and occasional car hire, and their car mileage remains about the same (in fact Mei-
jkamp and Aarts reported that it went down). Taken together, Meijkamp and Aarts (1997)
found that the average reduction in car club mileage of all car club members was about a
third.
While car clubs in Germany and Switzerland may have grown rapidly, they will need to grow
a lot more if they are to have a significant aggregate effect on traffic levels. Estimates of the
number of people who might potentially join a car club suggest that there is significant
growth potential. Muheim (1998) estimated that approximately 9% of the Swiss population
were potential car club members, based on an evaluation of the number of people whose per-
sonal circumstances meant they could benefit from car club membership, coupled with survey
data which found about a third were very or fairly interested in the idea. Steininger et al.
(1996) concluded that about 18% of residents in an average urban residential area in Austria
had the right profile to be car club early adopters.
4. Scalability: can marketing and management measures
have significant impacts over a wide area?
Research carried out by one of the authors (Sloman, 2003) sought to assess how much impact
marketing and management measures might have on future car travel demand in Britain (tak-
ing the year 2010), if applied together and at greater intensity. Two scenarios were examined:
• ‘Enlightened business as usual’, in which most local authorities do what the best ones are doing already; and
• ‘Ambitious change’, in which national and local government match international best practice.

10th International Conference on Travel Behaviour Research
______________________________________________________________ August 10-15, 2003
24
Both scenarios estimated the effect of adding together the individual impacts of marketing and
management measures reviewed in this paper, plus some other measures which are a mix of
hard infrastructure and soft marketing and management elements. Here we report only the
findings relating to marketing and management measures, that is:
• personalised travel planning
• workplace travel plans
• school travel plans
• bus information and marketing
• car clubs.
The potential contribution from travel awareness programmes and rail information and mar-
keting was not assessed.
The relative contribution of the different measures in a typical urban conurbation over a 24
hour period (using data from the West Midlands conurbation) is shown in Table 1, assuming
that they are additive. Workplace travel plans, bus information and marketing, and personal-
ised travel planning have roughly similar effects; school travel plans have rather less effect
(because car escort trips to school make up a fairly small proportion of total car mileage); and
car clubs have negligible effect. It should be noted, though, that the contribution from car
clubs is low because it is assumed that car clubs will still be at an early stage of development
in Britain in 2010. In other countries where growth is more advanced, the contribution from
car clubs could be greater.
Nationally, the cumulative impact of the measures is much less, as shown in Table 2. This is
because journeys outside urban areas (that is, inter-urban journeys and rural journeys) are
more difficult to shift from the car to more sustainable modes, and these tend to be the longer
distance trips.

10th International Conference on Travel Behaviour Research
______________________________________________________________ August 10-15, 2003
25
Table 1 Reduction in 24 hr. car travel demand in 2010 in a typical UK urban conurbation
Type of measure ‘Enlightened’ business as usual scenario
‘Ambitious’ change scenario
Personalised travel planning
Workplace travel plans
School travel plans
Bus information & marketing7
Car clubs
Total*
-2.7%
-3.4%
-0.9%
-1.8%
-0.14%
-8.9%
-5.5%
-6.9%
-2.8%
-6.0%
-0.3%
-21.5%
Source: Derived from Sloman (2003)
* Totals assume that the combined effect of separate soft factors is additive i.e. equal to the sum of the parts. See
section 5 for discussion of the validity of this assumption.
Table 2 Reduction in 24 hr. car travel demand 2010: national & urban impact compared
Affected area ‘Enlightened’ business as usual scenario
‘Ambitious’ change scenario
Impact in urban areas
National impact
-8.9%
-2.7%
-21.5%
-5.9%
Source: Derived from Sloman (2003)
7 The impact of bus information and marketing is difficult to distinguish from the impact of infrastructure meas-
ures such as bus lanes and priority at signals, as in practice both are generally applied together. In Britain a
package of both types of measures is known as a ‘quality bus partnership’. The figures quoted here are based
on observed patronage increases for bus quality partnerships, and hence slightly overestimate the contribution
from information and marketing measures alone.

10th International Conference on Travel Behaviour Research
______________________________________________________________ August 10-15, 2003
26
5. Synergy, redundancy and induced traffic
The discussion so far has assumed that the impact of introducing a set of marketing and man-
agement measures is simply additive. However, there are at least four factors that might lead
the combined impact of these measures (with each other and with more conventional transport
measures) to be greater than the sum of their parts. This means we might expect to see syn-
ergistic effects. There are also two factors acting in the opposite direction, which might re-
duce the observed impact of marketing and management on travel demand and on observed
car traffic levels.
The likely synergistic effects are of two types. First , those applying among combinations of
soft measures alone:
1. Marketing and management measures acting together may address the multiple rea-
sons for making linked trips by car. Cars are well-suited to making linked trips (for exam-
ple, dropping children off at school on the way to work, or picking up shopping on the way
home), because they offer several attributes which other modes cannot always match: freedom
of destination, flexibility of timing, and storage and transport of goods. One measure – better
information and marketing of bus services, or workplace travel plans, or school travel plans –
may have little impact on travel choice for these complex trips. However, several measures in
combination may have a greater effect. For example, a school travel plan combined with a
workplace travel plan and local home delivery facilities would free working parents from the
need to escort children to school and collect shopping, thus enabling them to take advantage
of new choices available through a workplace travel plan (such as cut-price public transport
tickets).
2. The snowball effect: long-term effects may be greater than short-term ones. Long-
term effects of changes in the transport system on travel behaviour are generally larger than
short-term effects – as is evident with regard to long-term versus short-term elasticities
(Goodwin, 1992). In the case of marketing and management measures, there is some evidence
that change may be very slow at first, but then accelerate as people see their colleagues and
neighbours changing their travel behaviour. There are also effects at the level of the individ-
ual: for example Individualised Marketing programmes seem to lead some people to make
further cutbacks in car use over a period after their participation in the programme, as their
circumstances change. Finally, measures like workplace travel plans are not simply on/off, but
can become more effective over time, as more elements are put in place. These observations
suggest that consistent implementation of marketing and management measures might plausi-
bly snowball in their effectiveness over time.

10th International Conference on Travel Behaviour Research
______________________________________________________________ August 10-15, 2003
27
Second, synergetic effects from linking soft measures with other policy measures:
3. Marketing and management measures may amplify the impact of hard measures. As
already noted, marketing and management measures are likely to be particularly effective
when carried out in conjunction with conventional transport measures. For example, if new
bus services or bike lanes are introduced, their use may be increased by a targeted marketing
programme. The quality bus partnership in Perth, Scotland, illustrates this well. The project
achieved patronage increases of about double the average for a quality bus partnership,
probably because conventional measures such as bus lanes were coupled with a door-to-door
and telesales marketing campaign which targeted people living in or near the bus corridor.
4. Marketing and management may increase the elasticity of response to restraint
measures. Motorists respond to higher motoring costs in a variety of ways. Higher parking
charges may lead some motorists to switch destination to another town or out-of-town shop-
ping centre, but still drive; while others may switch modes. If fuel prices go up, some motor-
ists may drive less, while others may adapt by buying a more fuel-efficient car (or driving
more fuel-efficiently), or by cutting back their spending in other areas. However, if alterna-
tives to driving are actively marketed, drivers’ responses to higher travel costs are likely to
become more elastic. Jones (2003) argues that, by combining the introduction of road user
charging with a targeted information and marketing campaign, it would be possible to achieve
desired reductions in traffic levels with a lower charge than would otherwise be needed,
thereby reducing negative social impacts.
Acting in the opposite direction to these synergistic effects, there are two effects which may
reduce the impact of marketing and management initiatives: redundancy and the impact of in-
duced traffic.
1. Redundancy. Redundancy arises where two (or more) marketing interventions are di-
rected at the same group of people, who are unable to change their behaviour twice. For ex-
ample, if the introduction of a workplace travel plan has led a proportion of a workforce to
start car-sharing or taking the bus to work, there may be relatively little benefit in exposing
the same group to an individualised marketing programme. Those people most receptive to
change will already have altered their travel habits, leaving only the group which is less will-
ing to change (or less able to do so) to be influenced by the second intervention. The com-
bined effect of the two interventions will then be less than might be predicted from knowledge
of their separate effects on separate populations.
2. Impact of induced traffic. If some people switch from car to other modes as a result of
marketing and management interventions, others may notice that congestion is easing up, and
10th International Conference on Travel Behaviour Research
______________________________________________________________ August 10-15, 2003
28
may decide to drive on the less congested networks, perhaps re-routing or re-timing their trip,
or switching to car from another mode of transport. In other words, in congested conditions
some of the benefit of traffic reduction arising from successful marketing and management
measures may be eroded by traffic induction.
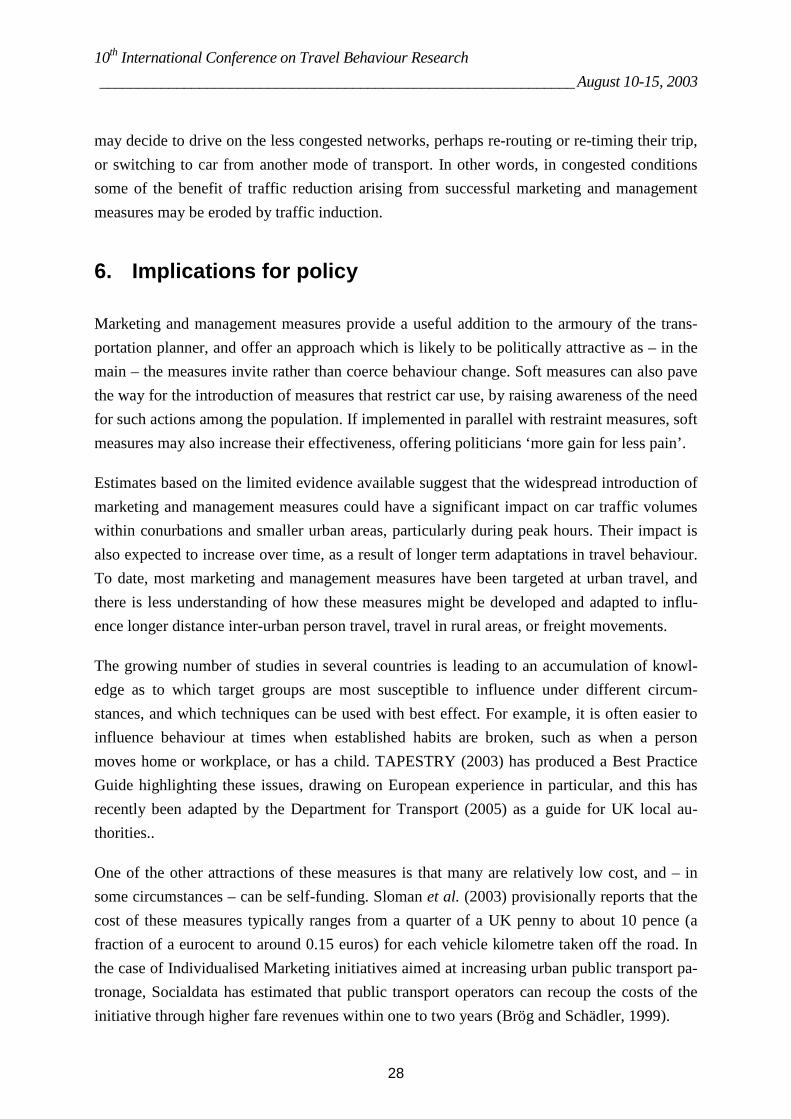
6. Implications for policy
Marketing and management measures provide a useful addition to the armoury of the trans-
portation planner, and offer an approach which is likely to be politically attractive as – in the
main – the measures invite rather than coerce behaviour change. Soft measures can also pave
the way for the introduction of measures that restrict car use, by raising awareness of the need
for such actions among the population. If implemented in parallel with restraint measures, soft
measures may also increase their effectiveness, offering politicians ‘more gain for less pain’.
Estimates based on the limited evidence available suggest that the widespread introduction of
marketing and management measures could have a significant impact on car traffic volumes
within conurbations and smaller urban areas, particularly during peak hours. Their impact is
also expected to increase over time, as a result of longer term adaptations in travel behaviour.
To date, most marketing and management measures have been targeted at urban travel, and
there is less understanding of how these measures might be developed and adapted to influ-
ence longer distance inter-urban person travel, travel in rural areas, or freight movements.
The growing number of studies in several countries is leading to an accumulation of knowl-
edge as to which target groups are most susceptible to influence under different circum-
stances, and which techniques can be used with best effect. For example, it is often easier to
influence behaviour at times when established habits are broken, such as when a person
moves home or workplace, or has a child. TAPESTRY (2003) has produced a Best Practice
Guide highlighting these issues, drawing on European experience in particular, and this has
recently been adapted by the Department for Transport (2005) as a guide for UK local au-
thorities..
One of the other attractions of these measures is that many are relatively low cost, and – in
some circumstances – can be self-funding. Sloman et al. (2003) provisionally reports that the
cost of these measures typically ranges from a quarter of a UK penny to about 10 pence (a
fraction of a eurocent to around 0.15 euros) for each vehicle kilometre taken off the road. In
the case of Individualised Marketing initiatives aimed at increasing urban public transport pa-
tronage, Socialdata has estimated that public transport operators can recoup the costs of the
initiative through higher fare revenues within one to two years (Brög and Schädler, 1999).

10th International Conference on Travel Behaviour Research
______________________________________________________________ August 10-15, 2003
29
In the case of Perth, it was argued that by rolling out the TravelSmart initiative over large
parts of the city, it would be possible to delay or abandon proposed new freeway construction,
saving expenditure of hundreds of millions of dollars. A conventional cost-benefit analysis
applied to the Perth programme resulted in benefit-cost ratios of 30:1, well in excess of what
might be achieved through a conventional road scheme. More needs to be done to evaluate the
cost-effectiveness of soft measures under different circumstances.
One aspect that lacks evidence concerns the potential for synergetic benefits from intensively
promoting a portfolio of soft measures within the same urban area. The Department for
Transport announced in April 2004 that three English urban areas (Darlington, Peterborough
and Worcester) had been selected as winners of the ‘sustainable travel towns’ competition,
with a total budget of 15 million euro to implement packages of measures over five years; re-
sults will be fully monitored as part of the programme.
There is also considerable potential for using marketing and management techniques to
maximise the benefit of major investment in new sustainable transport infrastructure, such as
a cycle network or a light rail scheme. As previously noted, through a personalised travel
planning campaign, the patronage of an improved public transport service (whether a new
tram line or enhanced bus service) can be doubled compared with what would normally be
expected if traditional information strategies had been employed. This represents very good
value for money.
One concern that has been raised is that the benefits of such initiatives may be eroded as a re-
sult of induced traffic being attracted by the released road capacity. This is a wider problem
associated with any policy designed to achieve traffic reduction in an area (e.g. new public
transport service), and points to the need to remove or protect the capacity that has been re-
leased by the initiative. This might be done by reallocating roadspace (e.g. allocating reserved
lanes for buses and cyclists, or installing wider footways), or by some method of traffic re-
straint (e.g. congestion charging or access restrictions), depending on local circumstances.
Again, the use of marketing techniques can assist in gaining public support for taking action
to safeguard the benefits derived from the voluntary reduction in car usage in the area.
7. Implications for research
The growing policy interest in marketing and management initiatives in many countries is
highlighting our lack of understanding of the processes by which these measures can influ-
ence attitudes and behaviour. We are presently unable to forecast the impacts of soft measures
within travel demand models.

10th International Conference on Travel Behaviour Research
______________________________________________________________ August 10-15, 2003
30
While there is a limited literature on the importance of subjective factors affecting travel be-
haviour that goes back several decades (e.g. Hartgen, 1974), it is not something that has been
given prominence in the more quantitative analyses in the travel behaviour literature. Steg et
al. (2001) suggest a number of reasons for this, including the limited involvement of sociolo-
gists and psychologists in the field, the lack of motivational variables in national travel sur-
veys and other commonly used data sets, and a lack of knowledge as to how these factors
might change over time.
A number of actions will need to be taken by the research community to rectify these defi-
ciencies. Our conceptual models of travel behaviour need to be expanded to recognise more
fully the various subjective elements of travel decision making. While there is already ac-
knowledgement of the importance of perceived rather than objective measures of transport
system performance in shaping travel choices, there are two related areas where our knowl-
edge is very weak:
• How to encapsulate image and acceptability into estimates of the utility of different transport modes. One of the arguments commonly used to justify light rail schemes is that they offer a much more socially acceptable alternative than buses to car drivers, but this has not been recognised (other than by capturing it in the general modal con-stant term).
• How to forecast the effectiveness of different policy interventions that are designed to improve the image8 of different transport modes.
We have relatively little understanding of the societal factors that affect these responses, such
as the influence of champions and role models. The commercial sector recognises the impor-
tance of this factor and relies heavily on the endorsement of its products by such people.
Some other relevant aspects of travel behaviour have been the subject of more substantial on-
going research, but gaps in knowledge remain. The first deals with the longitudinal and dy-
namic nature of information acquisition and application. A traveller’s current knowledge of
travel alternatives is based on a history of past personal experiences and other forms of data
acquisition, some of which can have a very strong influence on decision making (e.g. the ex-
perience of a long wait for a bus in unpleasant conditions might effectively rule out this op-
tion thereafter).
This argues for the adoption of techniques that explore ‘life histories’, to establish how cur-
rent attitudes and expectations are shaped by past experiences. It also suggests that ‘tracking’
8 Wright and Egan (2000) propose exactly the opposite: that marketing techniques should be employed to ‘de-
market’ the car.

10th International Conference on Travel Behaviour Research
______________________________________________________________ August 10-15, 2003
31
studies would be useful in understanding the long term effects of different types of soft (and
hard) policy interventions.
Similarly, travellers are more amenable to and interested in acquiring new information in
some situations than others. Interest tends to be greatest when new travel patterns need to be
formed (e.g. when moving house, or retiring), or when current travel patterns are causing un-
due stress or dissatisfaction (e.g. increasing traffic delays on the journey to work). More un-
derstanding is still needed about the incidence and influence of these critical decision points,
by tracking a sample of people passing through critical ‘life choice’ events.
The successful application of marketing and management measures also links strongly with
on-going work on choice set formation, which is a key factor in successful model calibration
and prediction. A key question in applying and forecasting the likely effectiveness of such
measures is how modal options enter – and leave - the choice set and how their relative attrac-
tiveness can be affected by policy interventions.
As Steg et al. (2001) recognise, one of the key limitations from a research perspective is the
lack of data. This relates not only to the need which they identify to attach motivational vari-
ables to conventional travel surveys, but also to the current use of stated preference and other
techniques designed to elicit information on preferences and behavioural responses. In par-
ticular, stated preference exercises need to be more sophisticated, in at least two respects:
• In the treatment of information deficiency and uncertainty. Computer-based gaming exercises have tried to assess the effects of incomplete or inaccurate traffic informa-tion on route choice behaviour in the context of improved ITS systems (e.g. Bonsall and Parry, 1991), and some SP studies have tried to build unreliability into the trans-port choices presented to respondents (e.g. Bates et al., 2001), but much more needs to be done.
• In their recognition of respondent’s interest in, or willingness to consider, a change in behaviour. At present all respondents in SP exercises are normally assumed to be ‘active’ choosers – or are asked in the exercise to imagine that they were in that situation. As noted previously, this is unrealistic and makes it difficult to estimate rates of take-up and eventual saturation levels for new products or policy interven-tions.
There is a requirement, therefore, not only for improved data collection per se, but also for the
development of new instruments and techniques in order that we can reliably elicit the neces-
sary information from respondents.
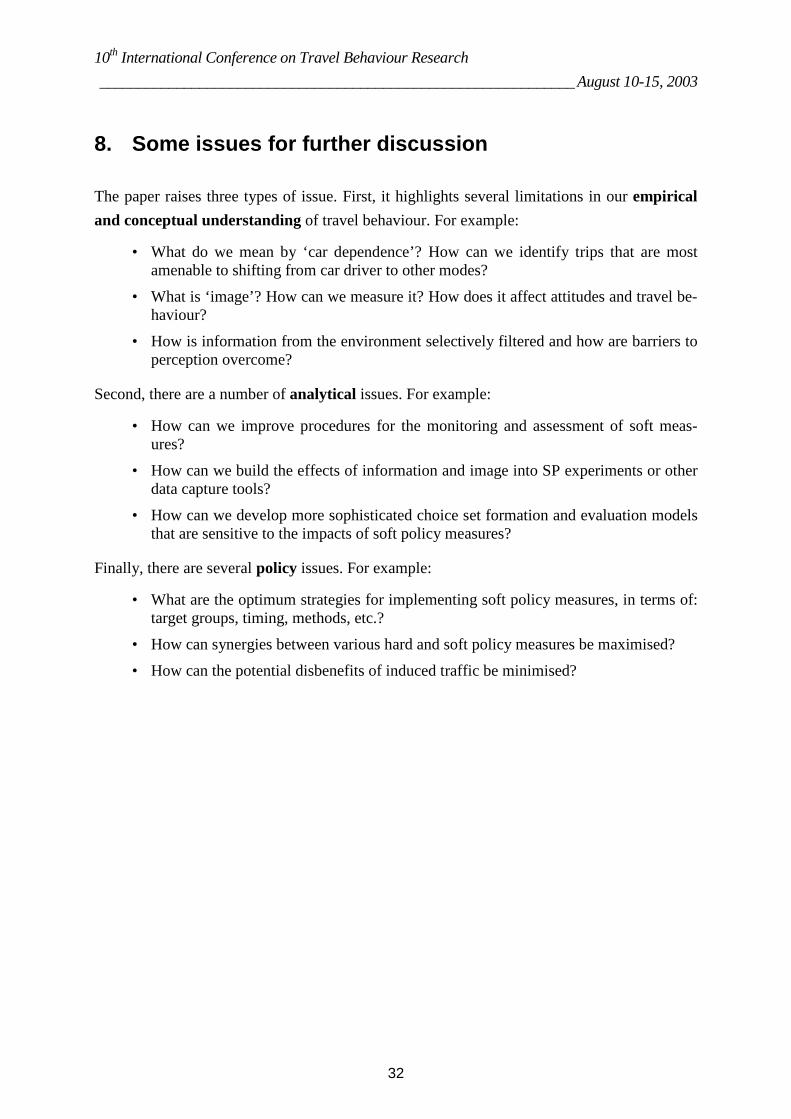
10th International Conference on Travel Behaviour Research
______________________________________________________________ August 10-15, 2003
32
8. Some issues for further discussion
The paper raises three types of issue. First, it highlights several limitations in our empirical
and conceptual understanding of travel behaviour. For example:
• What do we mean by ‘car dependence’? How can we identify trips that are most amenable to shifting from car driver to other modes?
• What is ‘image’? How can we measure it? How does it affect attitudes and travel be-haviour?
• How is information from the environment selectively filtered and how are barriers to perception overcome?
Second, there are a number of analytical issues. For example:
• How can we improve procedures for the monitoring and assessment of soft meas-ures?
• How can we build the effects of information and image into SP experiments or other data capture tools?
• How can we develop more sophisticated choice set formation and evaluation models that are sensitive to the impacts of soft policy measures?
Finally, there are several policy issues. For example:
• What are the optimum strategies for implementing soft policy measures, in terms of: target groups, timing, methods, etc.?
• How can synergies between various hard and soft policy measures be maximised?
• How can the potential disbenefits of induced traffic be minimised?

10th International Conference on Travel Behaviour Research
______________________________________________________________ August 10-15, 2003
33
References
Ajzen, I. (1991) The theory of planned behaviour, Organisational behavior and human deci-sion processes, 50 179-211.
Ampt, E., L. Buchanan, I. Chatfield and A. Rooney (1998) Reducing the impact of the car – creating the conditions for individual change, European Transport Conference, Seminar C, PTRC, London.
Ampt, E. (2003) Voluntary household travel behaviour change – theory and practice, paper presented at the 10th International Conference on Travel Behaviour Research, Lucerne, August 2003.
Andersen, T. (undated) Safe routes give healthy cycling children. See www.cyclecity.dk
Bates, J.J., J. Polak, P.M. Jones and A. Cook (2001). The valuation of reliability for personal travel, Transportation Research Part E, 37(2-3) 191-229.
Bonsall, P.W. and T. Parry (1991). Using an interactive route-choice simulator to investigate drivers’ compliance with route guidance advice, Transportation Research Record, 1306, 59-68.
Brög, W. and M. Schädler (1999) More passengers, higher profits for public transport – (im)possible dream?, paper to the 53rd UITP Congress, Toronto, Canada, May 1999.
Cairns, S., L. Sloman, C. Newson, J. Anable, A. Kirkbride and P. Goodwin (2004). The influ-ence of soft factor interventions on travel demand, main report, Department for Trans-port, July 2004, London.
CPT (2002) Better Buses. A manifesto from the Confederation of Passenger Transport, Lon-don, UK.
DETR (1998) Levels of activity relating to safer routes to school type projects and green transport plans, report by University of Westminster, London.
DTLR (2001a) Take up and effectiveness of travel plans and travel awareness campaigns, re-port by Steer Davies Gleave, London.
DTLR (2001b) Levels of activity relating to school travel plans and initiatives, report by TRL and Adrian Davis Associates, Crowthorne and Bristol.
DTLR (2002) A review of the effectiveness of personalised journey planning techniques, re-port by Steer Davies Gleave, London.
Department for Transport (2002) Making travel plans work. Research report and case study summaries, report by ESRC Transport studies Research Unit (UCL), Adrian Davis As-sociates and Transport 2000, London.
Department for Transport (2003a) Assessment of attitudes to, and potential take-up of, addi-tional home to school transport, London.
Department for Transport (2003b) Travelling to School: an Action Plan, London.
Department for Transport (2004) Making Smarter Choices Work, London.
Department for Transport (2005) Making Campaigning for Smarter Choices Work: Guide-lines for Local Authorities, London.

10th International Conference on Travel Behaviour Research
______________________________________________________________ August 10-15, 2003
34
ECMT (1996) Changing Daily Mobility: Less or differently? Contribution by Brög and Erl. ECMT Round Table 102, Paris.
Fergusson, M., A. Davis and I. Skinner (1999) Delivering changes in travel behaviour: les-sons from health promotion, Institute for European Environmental Policy, London.
Fujii, S. and A. Tanaguchi (2003) Reducing family car use by providing travel advice or by requesting behavioural plans: an experimental analysis of travel feedback programs, pa-per presented at the 10th International Conference on Travel Behaviour Research, Lu-cerne, August 2003.
Gärling. T. and J. Rise (2004) Understanding attitude, intention and behavior: a common in-terest to economics and psychology. In C.L. Spash and A. Biel (Eds.) (forthcoming) So-cial psychology and economics in environmental research.
Gärling, T., D. Eek, P. Loukopoulos, S. Fujii, O. Johnasson-Stenman, R. Kitamura, R. Pend-yala and B. Vilhelmson (2002) A conceptual analysis of the impact of travel demand management on private car use, Transport Policy, 9(1) 59-70.
Goodwin, P.B. (1992) A review of new demand elasticities with special reference to the short and long run effects of price changes, Journal of Transport Economics and Policy, 26(2) 155-169.
Goodwin, P.B. (2003) The influence of soft factor interventions on travel demand, presenta-tion to ‘In Town Without my Car!’ conference, London, September 2003.
Hampshire County Council (1993) Hampshire Transport Awareness Campaign: Final report and Technical Appendix, prepared by University of Westminster, Publicis Dailogue, Transport Research Laboratory and Wootton Jeffreys Consultants, London.
Hartgen, D.T. (1974) Attitudinal and situational variables influencing mode choice: Some empirical findings. Transportation 4 277-292.
INPHORMM (1998) Case studies of transport information and publicity/marketing cam-paigns to reduce car use and promote cycling, walking and public transport, INPHORMM Deliverable D2 to the European Commission. Transport Studies Group, University of Westminster, and partners, London.
Jones, P.M. and R. Bradshaw (2000) The family and the school run: What would make a real difference? Summary report to the AA Foundation for Road Safety Research, Univer-sity of Westminster, London.
Jones, P.M. (2003) Acceptability of road user charging: Meeting the challenge. In J. Schade and B. Schlag (Eds) Acceptability of Transport Pricing Strategies, 27-62. Pergamon, Oxford.
Meijkamp, R. and H. Aarts (1997) Breaking through habitual behaviour: Is car sharing an in-strument for reducing car use? European Transport Forum, Seminar C, PTRC, London.
MORI (1990) Green Drivers, Report to RAC Motoring Services, London.
MOST (2003) Mobility Management Strategies for the Next Decades. Final Report (plus Appendices) to the European Commission, DGTREN.
Muheim, P. (1998) Car Sharing – the key to combined mobility. Report to the Swiss Federal Office of Energy, Mobility, Lucerne.

10th International Conference on Travel Behaviour Research
______________________________________________________________ August 10-15, 2003
35
Prochasaka, J. and B. Marcus (1994) The transtheoretical model: Applications to exercise. In R. Dishman (Ed), Advances in Exercise Adherence, Champion.
Shaheen, S.A. and M.A. Meyn (2002) Shared use vehicle surveys: A survey of North Ameri-can market developments, see: www.gocarlink.com/pdf/shaheen_meyn.pdf
Shoup, D. (1998) Evaluating the effects of cashing out employer-paid parking: Eight case studies. Transport Policy 4(4), 201-216.
Sloman, L. (2003) Less traffic where people live: How local transport schemes can help cut traffic, Royal Commission for the Exhibition of 1851, University of Westminster and Transport 2000 Trust, London.
Socialdata (1999) Wirkungsanalyse Stadtbahn Saar. Maximale Ausschöpfung des ÖPNV-Potentials durch kundenorientierte Angebotsgestaltung und Individualisiertes Marketing am Beispiel eines neuen Stadtbahnsystems im Auftrag des Bundesministeriums für Verkehr, Bau-und Wohnungswesen, Socialdata, München.
Stagecoach (2002) Kickstart: better value, better bus services, Stagecoach Group, Perth.
Steer Davis Gleave (2003) Weymouth Relief Road: Alternatives to the proposed scheme. Re-port for Woodland Trust, Transport 2000, Friends of the Earth and the Campaign to Pro-tect Rural England, London.
Steg, L., K. Geurs and M. Ras (2001) Motives in transport models: Can they be ignored? In D. Hensher (Ed), Travel Behaviour Research – The Leading Edge, 829-844, Pergamon, Oxford.
Steininger, K., C. Vogl and R. Zettl (1996) Car-sharing organisations; the size of the market segment and revealed change in mobility behaviour, Transport Policy 3(4) 177-185.
TAPESTRY (2003) Best Practice Guidelines (Deliverable 5). Report to the European Com-mission (DGTREN). Travel and Transport Research, Nottingham and partners.
TAS (2001) Quality Bus Partnerships: Good Practice Guide, Preston.
TCRP (1994) Cost-effectiveness of TDM programs. Working paper #2, COMSIS Corpora-tion, Washington D.C.
Touwen, M. (1999) Travel planning in the Ranstaad: an evaluation based on ReMOVE. Re-port to the Netherlands Ministry of Transport, The Hague.
Transport Studies Unit (1995) Car Dependence, report for the RAC Foundation for Motoring and the Environment, Oxford.
TravelSmart (2001) Individualised Marketing Program for Perth, The Government of Western Australia, May 2001. See also: www.travelsmart.transport.wa.gov.au
Tyler, S. (2003) TAPESTRY- Changing travel behaviour through information, education and marketing, UTSG Annual Conference, January 2003.
WS Atkins (1999) Assessing the effect of integrated transport White Paper policies on na-tional traffic. Final report for DETR and the Commission for Integrated Transport, Lon-don.
Wright, C. and J. Egan (2000) De-marketing the car, Transport Policy 7(4) 287-294.