
Encore Capital Group, Inc.
36
Encore Capital Group, Inc. Q4 2020 EARNINGS CALL
Transcript of Encore Capital Group, Inc.

Encore Capital Group, Inc.Q4 2020 EARNINGS CALL

2
CAUTIONARY NOTE ABOUT FORWARD-LOOKING STATEMENTS
The statements in this presentation that are not historical facts, including, most importantly, those statements preceded by, or that include, the words “will,” “may,” “believe,” “projects,” “expects,” “anticipates” or the negation thereof, or similar expressions, constitute “forward-looking statements” within the meaning of the Private Securities Litigation Reform Act of 1995 (the “Reform Act”). These statements may include, but are not limited to, statements regarding our future operating results, earnings per share, growth and impacts of COVID-19. For all “forward-looking statements,” the Company claims the protection of the safe harbor for forward-looking statements contained in the Reform Act. Such forward-looking statements involve risks, uncertainties and other factors which may cause actual results,
performance or achievements of the Company and its subsidiaries to be materially different from any future results, performance or achievements expressed or implied by such forward-looking statements. These risks, uncertainties and other factors are discussed in the reports filed by the Company with the Securities and Exchange Commission, including its most recent reports on Form 10-K and Form 10-Q, as they may be amended from time to time. The Company disclaims any intent or obligation to update these forward-looking statements.

TODAY’S CALL
3
2020 – A Year of Unprecedented Challenge and Achievement
Our Strategy
Financial Results
Priorities for 2021 and Beyond
Encore’s 2020 Annual Report, including a letter to shareholders and our Form 10-K, is available on our website at www.encorecapital.com/investors
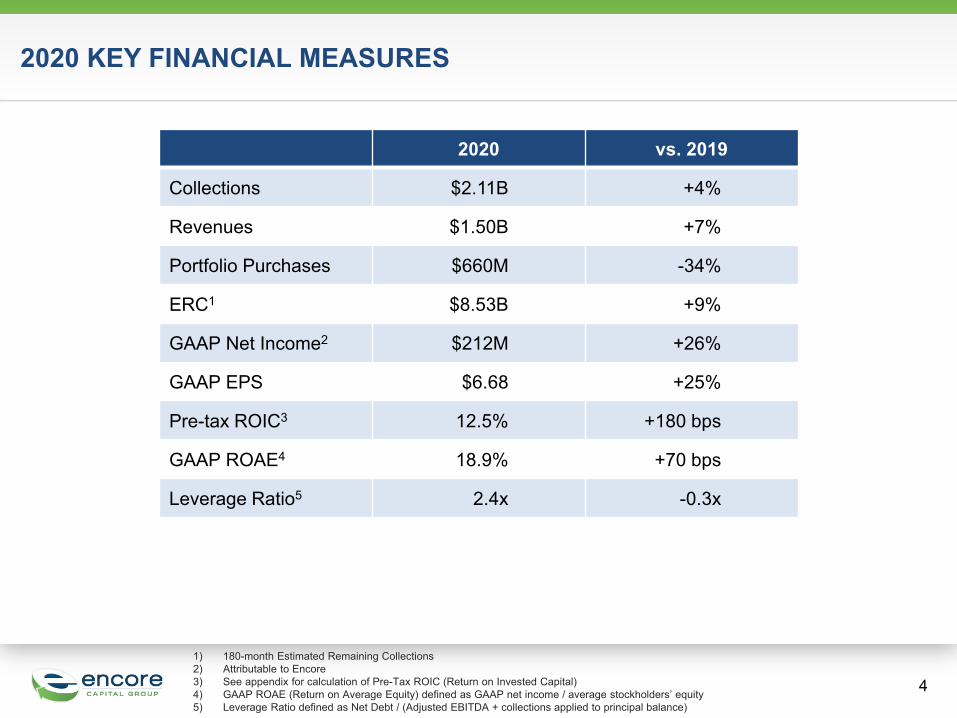
2020 KEY FINANCIAL MEASURES
4
1) 180-month Estimated Remaining Collections2) Attributable to Encore3) See appendix for calculation of Pre-Tax ROIC (Return on Invested Capital)4) GAAP ROAE (Return on Average Equity) defined as GAAP net income / average stockholders’ equity5) Leverage Ratio defined as Net Debt / (Adjusted EBITDA + collections applied to principal balance)
2020 vs. 2019
Collections $2.11B +4%
Revenues $1.50B +7%
Portfolio Purchases $660M -34%
ERC1 $8.53B +9%
GAAP Net Income2 $212M +26%
GAAP EPS $6.68 +25%
Pre-tax ROIC3 12.5% +180 bps
GAAP ROAE4 18.9% +70 bps
Leverage Ratio5 2.4x -0.3x

5
OUR BUSINESS AND OUR STRATEGY
Our StrategyOur Business
► Purchase NPL portfolios at attractive cash returns
► Focus on the consumer and ensure the highest level of compliance
► Meet or exceed collection expectations
► Maintain efficient cost structure
► Minimize cost of funding
Market Focus
Competitive Advantage
Balance Sheet Strength

6
FIRST PILLAR OF OUR STRATEGY
Market Focus
Concentrating on our most valuable markets with the highest risk-adjusted returns
► Target market characteristics:● Large, consistent flow of purchasing opportunities ● Strong regulatory framework ● Sophistication and data availability ● Stable, long-term returns
► Emphasizing U.S. and U.K. now, strengthening in Spain, France, Portugal and Ireland
► Thrive on recurring portfolio sales through the credit cycle. Our success does not rely on large macro events.

7
MARKET FOCUS: 2020 FOR MCM CHARACTERIZED BY STRONG COLLECTIONS, BUT REDUCED PURCHASING LATER IN THE YEAR
Collections grew 16% in 2020 to $1.53B
Portfolio purchases of $543M in the U.S. in 2020 were down 20% from 2019, but had highest purchase price multiples in years
MCM’s expenses in 2020 were lower than expected due to COVID impact
We are well-prepared to fully implement long-awaited CFPB industry rules, which will become effective in late 2021
Collections in 2020 were 106% of ERC forecast for 20201
MCM (U.S.) Business
MCM Collections by Channel and CTC
42.4%40.3%
37.4%
0
250
500
750
1,000
1,250
1,500
1,750
2,000
2018 2019 2020
Call Center & Digital Legal CollectionsCollection Agencies Cost to Collect
$1.53B
$1.32B$1.22B
54% 56%62%
45%43%
38%
1) Compared to ERC as of 12/31/2019 and excludes collections on portfolios purchased in 2020.

MARKET FOCUS: CABOT’S FOCUS ON COST MANAGEMENT HAS ENABLED CONTINUED SOLID PROFITABILITY
8
Cabot (Europe) Business
Cabot’s collection trends improved throughout 2020, finishing the year at 88% of ERC forecast for the year1
Cabot’s cost management enabled continued solid profitability in 2020 despite the pandemic’s impact on the timing of collections
In 2020, COVID caused U.K. banks to pause much of their portfolio sales activity
We anticipate an increase in opportunities as charge-offs are expected to rise due to the impact of the COVID pandemic on European economies.
New global funding structure enhances Cabot’s ability to deploy at attractive returns
1) Compared to ERC as of 12/31/2019 and excludes collections on portfolios purchased in 2020.

9
SECOND PILLAR OF OUR STRATEGY
Competitive Advantage
Innovating to enhance our competitive advantages
► We are built around certain key competencies which allow us to both deliver differentiated returns and earnings as well as generate significant cash flow.
● Price risk and optimize collections using data analytics
● Excel at operating in highly regulated environments
● Embed compliance in all we do
● Treat each consumer with fairness and respect
● Operate effectively, supported by scale, efficient platforms and digital technology investments

10
COMPETITIVE ADVANTAGE – WE DELIVERED STRONG EARNINGS, WHICH WE EXPECT TO CONTINUE IN 2021
GAAP Net Income1 (in $M)
116
168
212
2018 2019 2020
Both GAAP and adjusted net income in 2020 negatively impacted by $40M ($1.26/share) of expenses, after tax, related to establishing new funding structure and refinancing
$212Mup 26% vs 2019
2020 GAAP Net Income1
$6.68 per share
$246Mup 31% vs 2019
2020 Adjusted Net Income2
$7.75 per share
1) Attributable to Encore2) See appendix for reconciliation of adjusted net income and Economic EPS to GAAP. Beginning in Q1 2021, Encore will discontinue providing
adjusted net income and Economic EPS.

COMPETITIVE ADVANTAGE – WE GENERATE SIGNIFICANT, CONSISTENT CASH FLOW
11
$0
$200
$400
$600
$800
$1,000
$1,200
$1,400
2018 2019 2020
Adjusted EBITDA Collections applied to principal balance
1) Cash Generation defined as Adjusted EBITDA + collections applied to principal balance. 2) See appendix for reconciliation of Adjusted EBITDA to GAAP net income.
Adjusted EBITDA + Collections applied to principal balance ($M)
Our cash generation is the result of our operational efficiency and portfolio resiliency
up 6% vs 2019
2020 Cash Generation1
2

12
COMPETITIVE ADVANTAGE – WE DELIVER DIFFERENTIATED RETURNS
1) GAAP ROAE (Return on Average Equity) defined as GAAP net income / average stockholders’ equity 2) See appendix for calculation of Pre-Tax ROIC (Return on Invested Capital)
Strong performance underpins increasing ROIC over time
12.5%
2020 Pre-Tax ROIC2
18.9%
2020 GAAP ROAE1
Returns
16.6%18.2% 18.9%
10.1% 10.8%12.5%
2018 2019 2020
GAAP ROAE
Pre-Tax ROIC
1
2

13
COMPETITIVE ADVANTAGE – OUR STRONG OPERATING PERFORMANCE AND BALANCE SHEET TOGETHER CREATE VALUE
1) See appendix for calculation of Pre-Tax ROIC (Return on Invested Capital). 2) Weighted Average Cost of Debt (WACD) is defined as the sum of the products of (each borrowing’s period end weight * each
borrowing’s stated interest rate). Data points represent average for each year.
We create increased value as the spread between our returns and our cost of debt expands
Value Creation
10.1%10.8%
12.5%
4.9% 5.1% 4.8%
2018 2019 2020
Pre-Tax ROIC Weighted Average Cost of Debt (WACD)1 2

14
THIRD PILLAR OF OUR STRATEGY
Balance Sheet Strength
Continuing focus on the strength of our balance sheet
► Reduced leverage ratio1 from 2.7x to 2.4x, comfortably within our targeted range of 2.0x-3.0x
► Combined balance sheets of our U.S. and European businesses, formed unified global funding structure
► Established best-in-class capital structure: cost, liquidity, tenor, diversification of capital sources, overall flexibility
► Well positioned with ample liquidity and access to attractive funding to increase NPL purchases and capitalize on opportunities through the cycle
1) Leverage ratio defined as net debt / (Adjusted EBITDA + collections applied to principal balance).

15
Detailed Financial Discussion

16
2020 PORTFOLIO PURCHASES REFLECT THE IMPACTS OF THE COVID-19 PANDEMIC ON SUPPLY AND OUR FOCUS ON RETURNS
2020 Deployments
United States $543M
Europe$117M
Total $660M
2.5xvs 2.1x in 2019
2020 Initial Purchase Price Multiple1
1) Initial purchase price multiple defined as total estimated gross collections for all geographies at end of purchase year / total purchase price for all geographies at end of purchase year.

17
2020 COLLECTIONS GREW 4% DESPITE THE CHALLENGES ASSOCIATED WITH THE COVID PANDEMIC
Collections by Geographic Location
0
500
1,000
1,500
2,000
2018 2019 2020 United States Europe Other
2,1121,968 2,027
$M
2020 Collections were 100% of the ERC forecast for 20201
1) Compared to ERC as of 12/31/2019 and excludes collections on portfolios purchased in 2020. U.S. collections were 106% and Europe collections were 88% of our 12/31/2019 ERC forecast, respectively.

2020 REVENUES WERE $1.5 BILLION, REFLECTING OUR CONTINUED FOCUS ON THE U.S. AND EUROPE
Revenue by Geographic Location
18
$M
0
200
400
600
800
1,000
1,200
1,400
2018 2019 2020
United States Europe Other
$M
1,362 1,3981,501

NEW GLOBAL FUNDING STRUCTURE ENABLED US TO CAPITALIZE ON FAVORABLE MARKET CONDITIONS TO REFINANCE $840M OF DEBT
19
New Global Funding Structure
Redeemed £287M of 7.5% notes due 2023. Replaced them with £300M of 5.375% notes due 2026.
Redeemed €400M of EURIBOR + 6.375% notes due 2024. Replaced them with €415M of EURIBOR + 4.25% notes due 2028.
Enhances access to capital markets
Extends debt maturities
Enhances ability to allocate capital toward the best returns
Reduces cost of funds
RecentActions
Funding Structure Benefits
Our leverage is amongst the lowest in our peer group
20
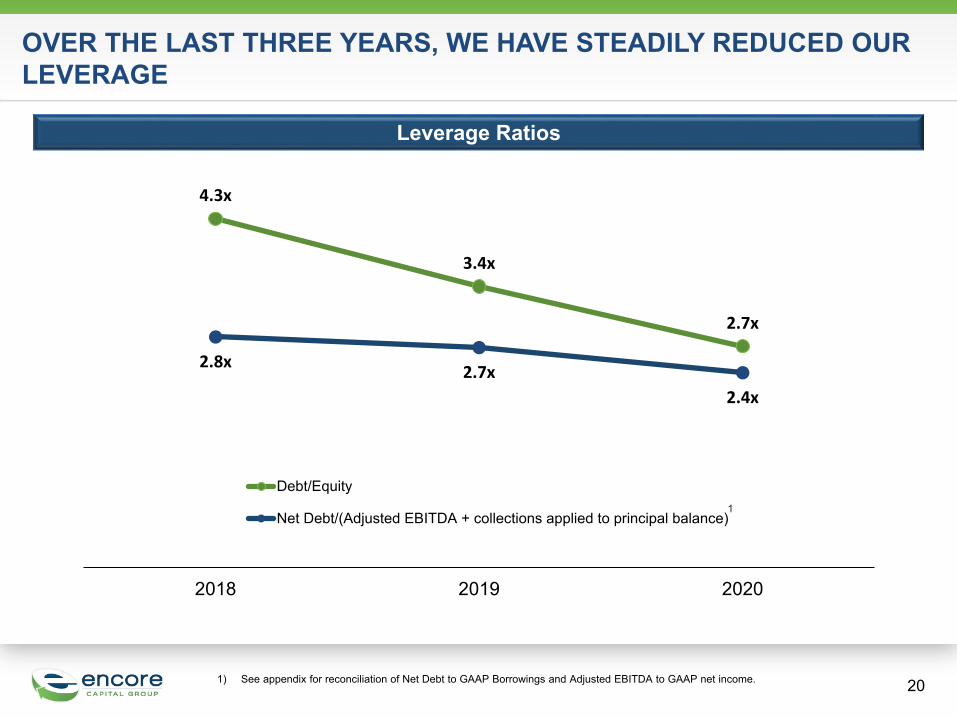
OVER THE LAST THREE YEARS, WE HAVE STEADILY REDUCED OUR LEVERAGE
Leverage Ratios
1) See appendix for reconciliation of Net Debt to GAAP Borrowings and Adjusted EBITDA to GAAP net income.
4.3x
3.4x
2.7x
2.8x 2.7x2.4x
2018 2019 2020
Debt/Equity
Net Debt/(Adjusted EBITDA + collections applied to principal balance)1

WE HAVE A DIVERSIFIED GLOBAL FUNDING STRUCTURE
21
Debt Maturity Profile at December 31, 2020 ($M)
Note: At 12/31/2020, LTV Ratio (loan-to-value) = 37.5% (72.5% covenant), FCCR (Fixed Charge Coverage Ratio) = 7.5x (2.0x covenant). Each as calculated under our Senior Secured Note indentures.
309427 410
506
161 150
173100
481
478
200 189
521 510
1,005
410506
2021 2022 2023 2024 2025 2026 2027 2028
Bonds (49% of total funding)Convertible Notes (17%)Revolving Credit Facility (14%)Securitisation Facility (14%)Private Placement Notes (5%)
Type of Debt (% of Total Debt)
49%
5%14%
14%
17%
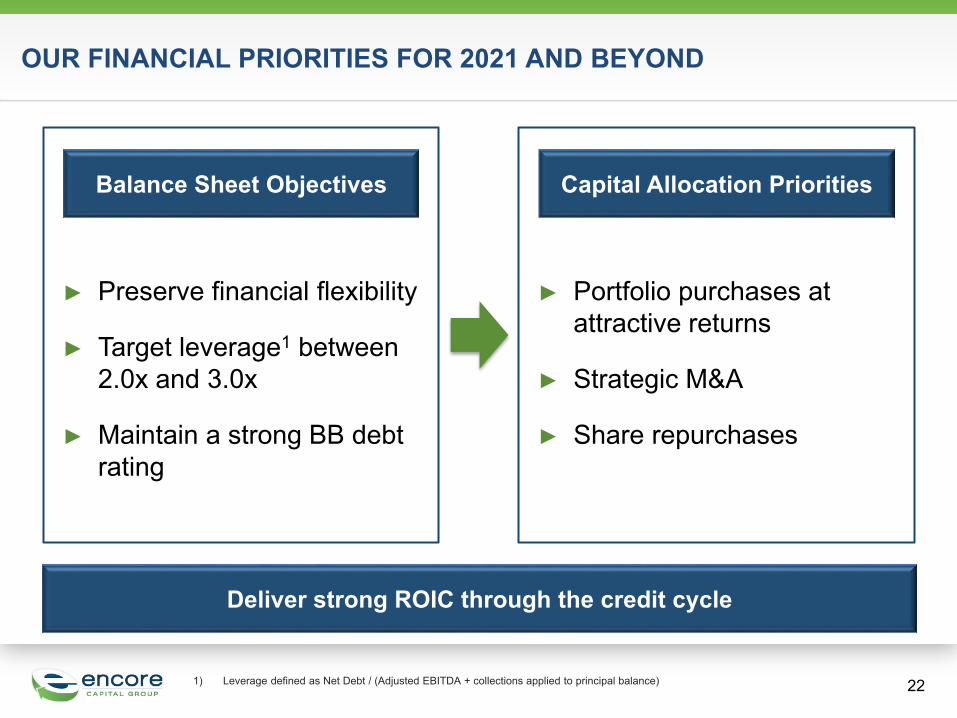
OUR FINANCIAL PRIORITIES FOR 2021 AND BEYOND
22
► Preserve financial flexibility
► Target leverage1 between 2.0x and 3.0x
► Maintain a strong BB debt rating
Deliver strong ROIC through the credit cycle
Balance Sheet Objectives
► Portfolio purchases at attractive returns
► Strategic M&A
► Share repurchases
Capital Allocation Priorities
1) Leverage defined as Net Debt / (Adjusted EBITDA + collections applied to principal balance)

23
Appendix

KEY FINANCIAL MEASURES BY YEAR
24
2018 2019 2020
Collections $1.97B $2.03B $2.11B
Revenues $1.36B $1.40B $1.50B
Portfolio Purchases $1.13B $1.00B $0.66B
ERC1 $7.22B $7.83B $8.53B
GAAP Net Income2 $116M $168M $212M
GAAP EPS $4.06 $5.33 $6.68
Pre-tax ROIC3 10.1% 10.8% 12.5%
GAAP ROAE4 16.6% 18.2% 18.9%
Leverage Ratio5 2.8x 2.7x 2.4x
1) 180-month Estimated Remaining Collections2) Attributable to Encore3) See appendix for calculation of Pre-Tax ROIC (Return on Invested Capital)4) GAAP ROAE (Return on Average Equity) defined as GAAP net income / average stockholders’ equity5) Leverage ratio defined as Net debt / (Adjusted EBITDA + collections applied to principal balance).

KEY FINANCIAL MEASURES BY QUARTER
25
Q4 2019 Q1 2020 Q2 2020 Q3 2020 Q4 2020
Collections $499M $527M $508M $540M $537M
Revenues $348M $289M $426M $404M $383M
Portfolio Purchases $235M $214M $148M $170M $128M
ERC1 $7.83B $8.46B $8.38B $8.46B $8.53B
GAAP Net Income2 $43M ($10M) $130M $55M $37M
GAAP EPS $1.36 ($0.33) $4.13 $1.72 $1.17
LTM Pre-tax ROIC3 10.8% 9.4% 11.9% 12.7% 12.5%
LTM GAAP ROAE4 18.2% 12.2% 20.8% 21.3% 18.9%
Leverage Ratio5 2.7x 2.6x 2.4x 2.4x 2.4x
1) 180-month Estimated Remaining Collections2) Attributable to Encore3) See appendix for calculation of LTM Pre-Tax ROIC (Return on Invested Capital)4) GAAP ROAE (Return on Average Equity) defined as GAAP net income / average stockholders’ equity5) Leverage ratio defined as Net debt / (Adjusted EBITDA + collections applied to principal balance).

26
ENCORE’S LEVERAGE RATIOS
Encore Consolidated at 03/31/18 at 06/30/18 at 09/30/18 at 12/31/18
Debt / Equity 5.9x 5.7x 4.6x 4.3x
Net Debt / (LTM Adjusted EBITDA + LTM Collections applied to principal balance)1 3.2x 3.0x 2.9x 2.8x
1) See appendix for reconciliation of Adjusted EBITDA to GAAP net income and for reconciliation of Net Debt to GAAP Borrowings.
Encore Consolidated at 03/31/19 at 06/30/19 at 09/30/19 at 12/31/19
Debt / Equity 4.1x 3.9x 3.7x 3.4x
Net Debt / (LTM Adjusted EBITDA + LTM Collections applied to principal balance)1 2.8x 2.7x 2.7x 2.7x
Encore Consolidated at 03/31/20 at 06/30/20 at 09/30/20 at 12/31/20
Debt / Equity 3.8x 3.2x 2.9x 2.7x
Net Debt / (LTM Adjusted EBITDA + LTM Collections applied to principal balance)1 2.6x 2.4x 2.4x 2.4x

27
NON-GAAP FINANCIAL MEASURES
This presentation includes certain financial measures that exclude the impact of certain items and therefore have not been calculated in accordance with U.S. Generally Accepted Accounting Principles (“GAAP”). The Company has included information concerning Adjusted EBITDA because management utilizes this information in the evaluation of its operations and believes that this measure is a useful indicator of the Company’s ability to generate cash collections in excess of operating expenses through the liquidation of its receivable portfolios. The Company has included information concerning Adjusted Operating Expenses in order to facilitate a comparison of approximate cash costs to cash collections for the portfolio purchasing and recovery business in the periods presented. The Company has included Adjusted Income Attributable to Encore and Adjusted Income Attributable to Encore per Share (also referred to as Economic EPS when adjusted for certain shares associated with our convertible notes that will not be issued but are reflected in the fully dilutedshare count for accounting purposes) because management uses these measures to assess operating performance, in order to highlight trends in the Company’s business that may not otherwise be apparent when relying on financial measures calculated in accordance with GAAP. The Company has included Pre-Tax ROIC as management uses this measure to monitor and evaluate operating performance relative to our invested capital and because the Company believes it is a useful measure for investors to evaluate effective use of capital. The Company has included impacts from foreign currency exchange rates to facilitate a comparison of operating metrics that are unburdened by variations in foreign currency exchange rates over time.
Adjusted EBITDA, Adjusted Operating Expenses, Adjusted Income from Operations (used in Pre-Tax ROIC), Adjusted Income Attributable to Encore, Adjusted Income Attributable to Encore per Share/Economic EPS, and impacts from foreign currency exchange rates have not been prepared in accordance with GAAP. These non-GAAP financial measures should not be considered as alternatives to, or more meaningful than, net income, net income per share, income from operations, and total operating expenses as indicators of the Company’s operating performance. Further, these non-GAAP financial measures, as presented by the Company, may not be comparable to similarly titled measures reported by other companies. The Company has attached to this presentation a reconciliation of these non-GAAP financial measures to their most directly comparable GAAP financial measures.

28
RECONCILIATION OF ADJUSTED INCOME AND ECONOMIC EPS TO GAAP NET INCOME AND GAAP EPS
December 31, 2020 December 31, 2019
$ Per Diluted Share $ Per Diluted Share
GAAP net income attributable to Encore, as reported $ 211,848 $ 6.68 $ 167,869 $ 5.33
CFPB settlement fees1 15,009 0.47 --- ---
Convertible and exchangeable notes non-cash interest and issuance cost amortization 14,444 0.46 15,501 0.50
Acquisition, integration and restructuring related expenses2 4,962 0.16 7,049 0.22
Amortization of certain acquired intangible assets3 7,010 0.22 7,017 0.22
Loss on Baycorp Transaction4 --- --- 12,489 0.40
Goodwill impairment4 --- --- 10,718 0.34
Net gain on fair value adjustments to contingent considerations5 --- --- (2,300) (0.07)
Change in tax accounting method6 --- --- (7,825) (0.25)
Income tax effect of the adjustments7 (7,478) (0.24) (23,230) (0.74)
Adjusted net income attributable to Encore $ 245,795 $ 7.75 $ 187,288 $ 5.95
1) Amount represents a charge resulting from the Stipulated Judgment with the CFPB. We have adjusted for this amount because we believe it is not indicative of ongoing operations; therefore, adjusting for it enhances comparability to prior periods, anticipated future periods, and our competitors’ results.
2) Amount represents acquisition, integration and restructuring related expenses. We adjust for this amount because we believe these expenses are not indicative of ongoing operations; therefore, adjusting for these expenses enhances comparability to prior periods, anticipated future periods, and our competitors’ results.
3) We have acquired intangible assets, such as trade names and customer relationships, as a result of our acquisition of debt solution service providers. These intangible assets are valued at the time of the acquisition and amortized over their estimated lives. We believe that amortization of acquisition-related intangible assets, especially the amortization of an acquired company’s trade names and customer relationships, is the result of pre-acquisition activities. In addition, the amortization of these acquired intangibles is a non-cash static expense that is not affected by operations during any reporting period. As a result, the amortization of certain acquired intangible assets is excluded from our adjusted income attributable to Encore and adjusted income per share.
4) The sale of Baycorp resulted in a goodwill impairment charge of $10.7 million and a loss on sale of $12.5 million during the year ended December 31, 2019. We believe the goodwill impairment charge and the loss on sale are not indicative of ongoing operations, therefore adjusting for these expenses enhances comparability to prior periods, anticipated future periods, and our competitors’ results.
5) Amount represents the net gain recognized as a result of fair value adjustments to contingent considerations that were established for our acquisitions of debt solution service providers in Europe. We have adjusted for this amount because we do not believe this is indicative of ongoing operations.
6) Amount represents the benefit from the tax accounting method change related to revenue reporting. We adjust for certain discrete tax items that are not indicative of our ongoing operations.7) Amount represents the total income tax effect of the adjustments, which is generally calculated based on the applicable marginal tax rate of the jurisdiction in which the portion of the adjustment
occurred. Additionally, we adjust for certain discrete tax items that are not indicative of our ongoing operations. We recognized approximately $17.5 million, or $0.55 per diluted share, in tax benefit as a result of the sale of Baycorp, which is included in this income tax adjustment during the year ended December 31, 2019.
(Unaudited, in $ thousands except for per share amounts) Twelve Months Ended

29
RECONCILIATION OF ADJUSTED INCOME AND ECONOMIC EPS TO GAAP NET INCOME AND GAAP EPS
December 31, 2020 December 31, 2019
$ Per Diluted Share $ Per Diluted Share
GAAP net income attributable to Encore, as reported $ 37,320 $ 1.17 $ 43,085 $ 1.36
Convertible and exchangeable notes non-cash interest and issuance cost amortization 3,239 0.10 3,930 0.13
Acquisition, integration and restructuring related expenses1 22 --- 704 0.02
Amortization of certain acquired intangible assets2 1,803 0.06 1,659 0.05
Change in tax accounting method3 --- --- 1,245 0.04
Income tax effect of the adjustments4 (1,079) (0.03) (1,390) (0.04)
Adjusted net income attributable to Encore $ 41,305 $ 1.30 $ 49,233 $ 1.56
1) Amount represents acquisition, integration and restructuring related expenses. We adjust for this amount because we believe these expenses are not indicative of ongoing operations; therefore, adjusting for these expenses enhances comparability to prior periods, anticipated future periods, and our competitors’ results.
2) We have acquired intangible assets, such as trade names and customer relationships, as a result of our acquisition of debt solution service providers. These intangible assets are valued at the time of the acquisition and amortized over their estimated lives. We believe that amortization of acquisition-related intangible assets, especially the amortization of an acquired company’s trade names and customer relationships, is the result of pre-acquisition activities. In addition, the amortization of these acquired intangibles is a non-cash static expense that is not affected by operations during any reporting period. As a result, the amortization of certain acquired intangible assets is excluded from our adjusted income attributable to Encore and adjusted income per share.
3) Amount represents the benefit from the tax accounting method change related to revenue reporting. We adjust for certain discrete tax items that are not indicative of our ongoing operations.4) Amount represents the total income tax effect of the adjustments, which is generally calculated based on the applicable marginal tax rate of the jurisdiction in which the portion of the adjustment
occurred. Additionally, we adjust for certain discrete tax items that are not indicative of our ongoing operations.
(Unaudited, in $ thousands except for per share amounts) Three Months Ended
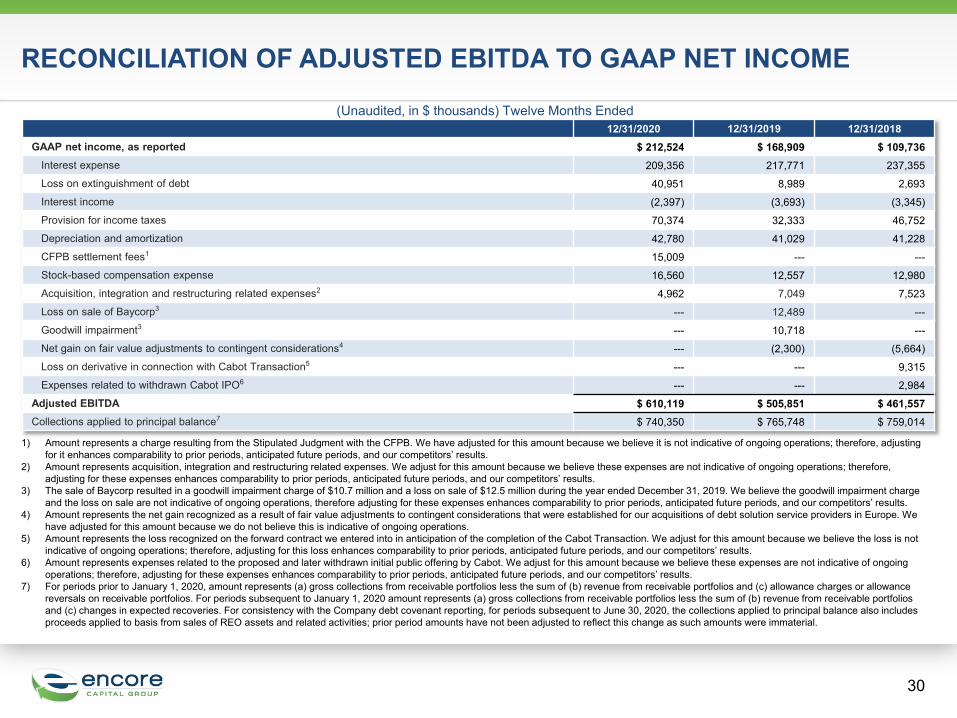
(Unaudited, in $ thousands) Twelve Months Ended12/31/2020 12/31/2019 12/31/2018
GAAP net income, as reported $ 212,524 $ 168,909 $ 109,736 Interest expense 209,356 217,771 237,355Loss on extinguishment of debt 40,951 8,989 2,693 Interest income (2,397) (3,693) (3,345)Provision for income taxes 70,374 32,333 46,752 Depreciation and amortization 42,780 41,029 41,228 CFPB settlement fees1 15,009 --- ---Stock-based compensation expense 16,560 12,557 12,980 Acquisition, integration and restructuring related expenses2 4,962 7,049 7,523Loss on sale of Baycorp3 --- 12,489 ---Goodwill impairment3 --- 10,718 ---Net gain on fair value adjustments to contingent considerations4 --- (2,300) (5,664)Loss on derivative in connection with Cabot Transaction5 --- --- 9,315 Expenses related to withdrawn Cabot IPO6 --- --- 2,984
Adjusted EBITDA $ 610,119 $ 505,851 $ 461,557 Collections applied to principal balance7 $ 740,350 $ 765,748 $ 759,014
RECONCILIATION OF ADJUSTED EBITDA TO GAAP NET INCOME
30
1) Amount represents a charge resulting from the Stipulated Judgment with the CFPB. We have adjusted for this amount because we believe it is not indicative of ongoing operations; therefore, adjusting for it enhances comparability to prior periods, anticipated future periods, and our competitors’ results.
2) Amount represents acquisition, integration and restructuring related expenses. We adjust for this amount because we believe these expenses are not indicative of ongoing operations; therefore, adjusting for these expenses enhances comparability to prior periods, anticipated future periods, and our competitors’ results.
3) The sale of Baycorp resulted in a goodwill impairment charge of $10.7 million and a loss on sale of $12.5 million during the year ended December 31, 2019. We believe the goodwill impairment charge and the loss on sale are not indicative of ongoing operations, therefore adjusting for these expenses enhances comparability to prior periods, anticipated future periods, and our competitors’ results.
4) Amount represents the net gain recognized as a result of fair value adjustments to contingent considerations that were established for our acquisitions of debt solution service providers in Europe. We have adjusted for this amount because we do not believe this is indicative of ongoing operations.
5) Amount represents the loss recognized on the forward contract we entered into in anticipation of the completion of the Cabot Transaction. We adjust for this amount because we believe the loss is not indicative of ongoing operations; therefore, adjusting for this loss enhances comparability to prior periods, anticipated future periods, and our competitors’ results.
6) Amount represents expenses related to the proposed and later withdrawn initial public offering by Cabot. We adjust for this amount because we believe these expenses are not indicative of ongoing operations; therefore, adjusting for these expenses enhances comparability to prior periods, anticipated future periods, and our competitors’ results.
7) For periods prior to January 1, 2020, amount represents (a) gross collections from receivable portfolios less the sum of (b) revenue from receivable portfolios and (c) allowance charges or allowance reversals on receivable portfolios. For periods subsequent to January 1, 2020 amount represents (a) gross collections from receivable portfolios less the sum of (b) revenue from receivable portfolios and (c) changes in expected recoveries. For consistency with the Company debt covenant reporting, for periods subsequent to June 30, 2020, the collections applied to principal balance also includes proceeds applied to basis from sales of REO assets and related activities; prior period amounts have not been adjusted to reflect this change as such amounts were immaterial.

(in $ thousands) Twelve Months Ended12/31/2020 12/31/2019 12/31/2018
NumeratorIncome from operations $ 533,562 $ 446,345 $ 405,300Adjustments:1
CFPB settlement fees2 15,009 --- ---Acquisition, integration and restructuring related expenses3 154 7,049 9,041Amortization of certain acquired intangible assets4 7,010 7,017 8,337 Goodwill impairment5 --- 10,718 ---Net gain on fair value adjustments to contingent considerations6 --- (2,300) (5,664)Expenses related to withdrawn Cabot IPO7 --- --- 2,984
Adjusted income from operations $ 555,735 $ 468,829 $ 419,998
DenominatorAverage net debt $ 3,311,835 $ 3,429,624 $ 3,388,336Average equity 1,122,741 922,547 695,811 Average redeemable noncontrolling interest --- --- 75,989 Total invested capital $ 4,434,576 $ 4,352,171 $ 4,160,136
Pre-tax ROIC 12.5% 10.8% 10.1%
CALCULATION OF ROIC RECONCILIATION OF ADJUSTED INCOME FROM OPERATIONS
31
1) Adjustments below are to adjust GAAP income from operations and accordingly do not include any amounts related to other income and expense. 2) Amount represents a charge resulting from the Stipulated Judgment with the CFPB. We have adjusted for this amount because we believe it is not indicative of ongoing operations; therefore, adjusting
for it enhances comparability to prior periods, anticipated future periods, and our competitors’ results.3) Amount represents acquisition, integration and restructuring related expenses. We adjust for this amount because we believe these expenses are not indicative of ongoing operations; therefore,
adjusting for these expenses enhances comparability to prior periods, anticipated future periods, and our competitors’ results. 4) We have acquired intangible assets, such as trade names and customer relationships, as a result of our acquisition of debt solution service providers. These intangible assets are valued at the time of
the acquisition and amortized over their estimated lives. We believe that amortization of acquisition-related intangible assets, especially the amortization of an acquired company’s trade names and customer relationships, is the result of pre-acquisition activities. In addition, the amortization of these acquired intangibles is a non-cash static expense that is not affected by operations during any reporting period.
5) The sale of Baycorp resulted in a goodwill impairment charge during the year ended December 31, 2019. We believe the goodwill impairment charge is not indicative of ongoing operations, therefore adjusting for this expense enhances comparability to prior periods, anticipated future periods, and our competitors’ results.
6) Amount represents the net gain recognized as a result of fair value adjustments to contingent considerations that were established for our acquisitions of debt solution service providers in Europe. We have adjusted for this amount because we do not believe this is indicative of ongoing operations.
7) Amount represents expenses related to the proposed and later withdrawn initial public offering by Cabot. We adjust for this amount because we believe these expenses are not indicative of ongoing operations; therefore, adjusting for these expenses enhances comparability to prior periods, anticipated future periods, and our competitors’ results.

Q4 2019 Q1 2020 Q2 2020 Q3 2020 Q4 2020NumeratorIncome from operations $ 446,345 $ 382,489 $ 488,449 $ 522,559 $ 533,562Adjustments:1
CFPB settlement fees2 --- --- --- 15,009 15,009Acquisition, integration and restructuring related expenses3 7,049 6,028 4,678 836 154Amortization of certain acquired intangible assets4 7,017 6,783 6,737 6,866 7,010 Goodwill impairment5 10,718 10,718 10,718 --- ---Net gain on fair value adjustments to contingent considerations6 (2,300) (2,300) (101) --- ---
Adjusted income from operations $ 468,829 $ 403,718 $ 510,481 $ 545,270 $ 555,735
DenominatorAverage net debt $ 3,429,624 $ 3,417,019 $ 3,301,314 $3,274,693 $ 3,311,835Average equity 922,547 890,184 972,672 1,025,626 1,122,741 Total invested capital $ 4,352,171 $ 4,307,203 $ 4,273,986 $ 4,300,319 $ 4,434,576
Pre-tax ROIC 10.8% 9.4% 11.9% 12.7% 12.5%
CALCULATION OF ROIC RECONCILIATION OF ADJUSTED INCOME FROM OPERATIONS
32
1) Adjustments below are to adjust GAAP income from operations and accordingly do not include any amounts related to other income and expense. 2) Amount represents a charge resulting from the Stipulated Judgment with the CFPB. We have adjusted for this amount because we believe it is not indicative of ongoing operations; therefore, adjusting
for it enhances comparability to prior periods, anticipated future periods, and our competitors’ results.3) Amount represents acquisition, integration and restructuring related expenses. We adjust for this amount because we believe these expenses are not indicative of ongoing operations; therefore,
adjusting for these expenses enhances comparability to prior periods, anticipated future periods, and our competitors’ results. 4) We have acquired intangible assets, such as trade names and customer relationships, as a result of our acquisition of debt solution service providers. These intangible assets are valued at the time of
the acquisition and amortized over their estimated lives. We believe that amortization of acquisition-related intangible assets, especially the amortization of an acquired company’s trade names and customer relationships, is the result of pre-acquisition activities. In addition, the amortization of these acquired intangibles is a non-cash static expense that is not affected by operations during any reporting period.
5) The sale of Baycorp resulted in a goodwill impairment charge during the year ended December 31, 2019. We believe the goodwill impairment charge is not indicative of ongoing operations, therefore adjusting for this expense enhances comparability to prior periods, anticipated future periods, and our competitors’ results.
6) Amount represents the net gain recognized as a result of fair value adjustments to contingent considerations that were established for our acquisitions of debt solution service providers in Europe. We have adjusted for this amount because we do not believe this is indicative of ongoing operations.
(in $ thousands) Last Twelve Months Ended
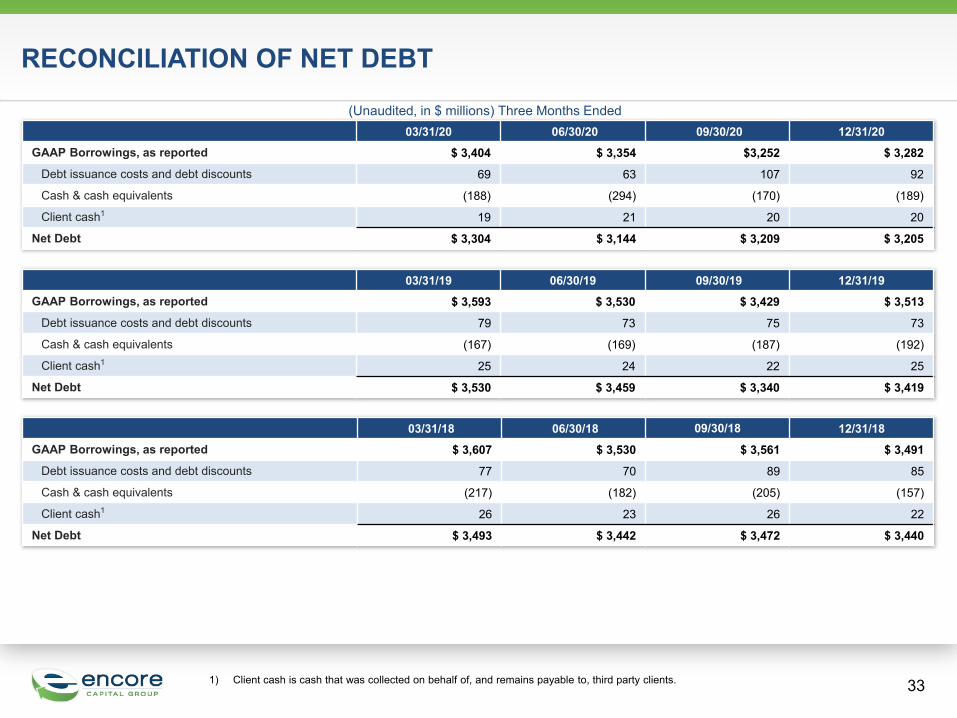
03/31/20 06/30/20 09/30/20 12/31/20GAAP Borrowings, as reported $ 3,404 $ 3,354 $3,252 $ 3,282
Debt issuance costs and debt discounts 69 63 107 92
Cash & cash equivalents (188) (294) (170) (189)
Client cash1 19 21 20 20
Net Debt $ 3,304 $ 3,144 $ 3,209 $ 3,205
RECONCILIATION OF NET DEBT
331) Client cash is cash that was collected on behalf of, and remains payable to, third party clients.
03/31/19 06/30/19 09/30/19 12/31/19GAAP Borrowings, as reported $ 3,593 $ 3,530 $ 3,429 $ 3,513
Debt issuance costs and debt discounts 79 73 75 73
Cash & cash equivalents (167) (169) (187) (192)
Client cash1 25 24 22 25
Net Debt $ 3,530 $ 3,459 $ 3,340 $ 3,419
03/31/18 06/30/18 09/30/18 12/31/18GAAP Borrowings, as reported $ 3,607 $ 3,530 $ 3,561 $ 3,491
Debt issuance costs and debt discounts 77 70 89 85
Cash & cash equivalents (217) (182) (205) (157)
Client cash1 26 23 26 22
Net Debt $ 3,493 $ 3,442 $ 3,472 $ 3,440
(Unaudited, in $ millions) Three Months Ended

RECONCILIATION OF ADJUSTED OPERATING EXPENSES RELATED TO PORTFOLIO PURCHASING AND RECOVERY BUSINESS
03/31/19 06/30/19 09/30/19 12/31/19 03/31/20 06/30/20 09/30/20 12/31/20
GAAP total operating expenses, as reported $ 236,019 $ 233,142 $ 247,591 $ 234,584 $ 241,879 $ 206,341 $ 261,221 $ 258,397
Operating expenses related to non-portfolio purchasing and recovery business1 (46,082) (42,232) (42,503) (42,373) (41,489) (42,386) (54,001) (45,054)
CFPB settlement fees2 --- --- --- --- --- --- (15,009) ---
Stock-based compensation expense (1,826) (3,581) (4,005) (3,145) (4,527) (4,778) (3,884) (3,371)
Gain on fair value adjustments to contingent considerations3 --- 2,199 101 --- --- --- --- ---
Goodwill impairment4 --- --- (10,718) --- --- --- --- ---
Acquisition, integration and restructuring related expenses5 (1,208) (1,318) (3,819) (704) (187) 32 23 (22)
Adjusted operating expenses related to portfolio purchasing and recovery business $ 186,903 $ 188,210 $ 186,647 $ 188,362 $ 195,676 $ 159,209 $ 188,350 $ 209,950
34
1) Operating expenses related to non-portfolio purchasing and recovery business include operating expenses from other operating segments that primarily engage in fee-based business, as well as corporate overhead not related to our portfolio purchasing and recovery business.
2) Amount represents a charge resulting from the Stipulated Judgment with the CFPB. We have adjusted for this amount because we believe it is not indicative of ongoing operations; therefore, adjusting for it enhances comparability to prior periods, anticipated future periods, and our competitors’ results.
3) Amount represents the net gain recognized as a result of fair value adjustments to contingent considerations that were established for our acquisitions of debt solution service providers in Europe. We have adjusted for this amount because we do not believe this is indicative of ongoing operations.
4) The sale of Baycorp resulted in a goodwill impairment charge of $10.7 million that is included in operating expenses during the year ended December 31, 2019. We believe the goodwill impairment charge is not indicative of ongoing operations, therefore, adjusting for the expense enhances comparability to prior periods, anticipated future periods, and our competitors’ results.
5) Amount represents acquisition, integration and restructuring related operating expenses. We adjust for this amount because we believe these expenses are not indicative of ongoing operations; therefore, adjusting for these expenses enhances comparability to prior periods, anticipated future periods, and our competitors’ results.
(Unaudited, in $ thousands) Three Months Ended

BEGINNING IN Q1 2020, COST-TO-COLLECT INCLUDES 100% OF COURT COSTS, BRINGING ENCORE INTO ALIGNMENT WITH THE INDUSTRY
35
Overall Cost-to-Collect1
36.4% 37.1% 36.6%
31.3%
37.4%34.9%
37.8% 39.1%
2019
2020
2019
2020
2019
2020
2019
2020
Q1 Q2 Q3 Q4
1) Cost-to-Collect = Adjusted operating expenses / collections. See appendix for reconciliation of Adjusted operating expenses to GAAP.
Location Q4 2019 CTC
Q4 2020 CTC
United States 42.6% 41.2%
Europe 27.5% 33.1%
Other 52.3% 57.0%
Encore total 37.8% 39.1%
Location FY2019 CTC
FY2020 CTC
United States 40.3% 37.4%
Europe 28.2% 29.9%
Other 54.3% 55.9%
Encore total 37.0% 35.7%

IMPACT OF FLUCTUATIONS IN FOREIGN CURRENCY EXCHANGE RATES
Three Months Ended 12/31/20 As Reported Constant
Currency
Revenues $383 $379
Operating expenses $258 $256
Net income1 $37 $37
Adjusted net income1 $41 $41
GAAP EPS1 $1.17 $1.17
Economic EPS1 $1.30 $1.29
Collections $537 $533
ERC2 $8,526 $8,349
Debt2 $3,282 $3,167
36
Note: Constant Currency figures are calculated by employing Q4 2019 foreign currency exchange rates to recalculate Q4 2020 results and FY2019 foreign currency exchange rates to recalculate FY2020 results. All constant currency values are calculated based on the average exchange rates during the respective periods, except for ERC and debt, which are calculated using the changes in the period-ending exchange rates. Management refers to operating results on a constant currency basis so that the operating results can be viewed without the impact of fluctuations in foreign currency exchange rates, thereby facilitating period-to-period comparisons of the company's operating performance. Constant currency financial results are calculated by translating current period financial results in local currency using the prior period’s respective currency conversion rate. Certain foreign subsidiaries’ local currency financial results in our calculation include the translation effect from their foreign operating results.
1. Attributable to Encore.2. At December 31, 2020.
Twelve Months Ended 12/31/20 As Reported Constant
Currency
Revenues $1,501 $1,499
Operating expenses $968 $968
Net income1 $212 $210
Adjusted net income1 $246 $244
GAAP EPS1 $6.68 $6.62
Economic EPS1 $7.75 $7.71
Collections $2,112 $2,111
ERC2 $8,526 $8,349
Debt2 $3,282 $3,167
(Unaudited, in $ millions, except per share amounts)