ENCON - Emprise Corporation
126
MILITARY SEALIFT COMMAND ENCON 23 March 2020 UNCLASSIFIED Energy Awareness, Requirements, Organization and Processes
Transcript of ENCON - Emprise Corporation

MILITARY SEALIFT COMMAND
ENCON
23 March 2020
UNCLASSIFIED
Energy Awareness, Requirements, Organization and Processes
N7
Part 1 Outline
• Current Energy Consumption and Cost• Culture and Energy Management• Energy Regulatory and Policy Requirement• Ship Energy Efficiency Management Plan
(SEEMP)
N7
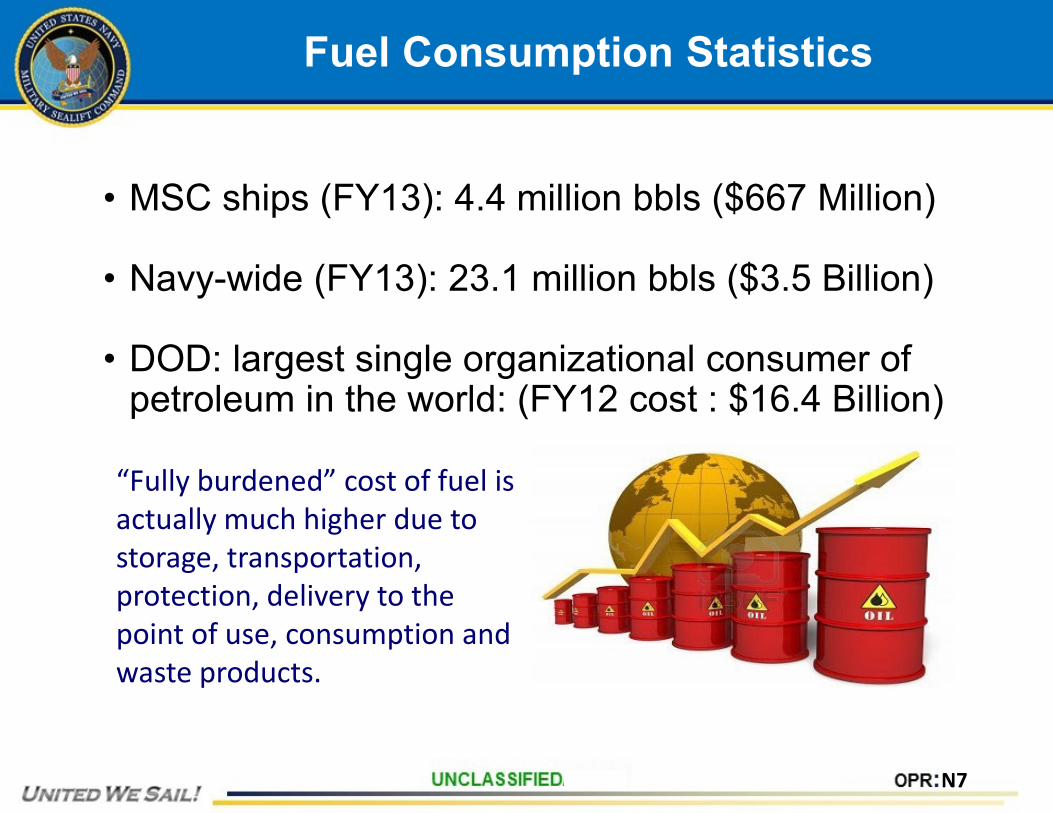
Fuel Consumption Statistics
• MSC ships (FY13): 4.4 million bbls ($667 Million)
• Navy-wide (FY13): 23.1 million bbls ($3.5 Billion)
• DOD: largest single organizational consumer of petroleum in the world: (FY12 cost : $16.4 Billion)
“Fully burdened” cost of fuel is actually much higher due to storage, transportation, protection, delivery to the point of use, consumption and waste products.
N7
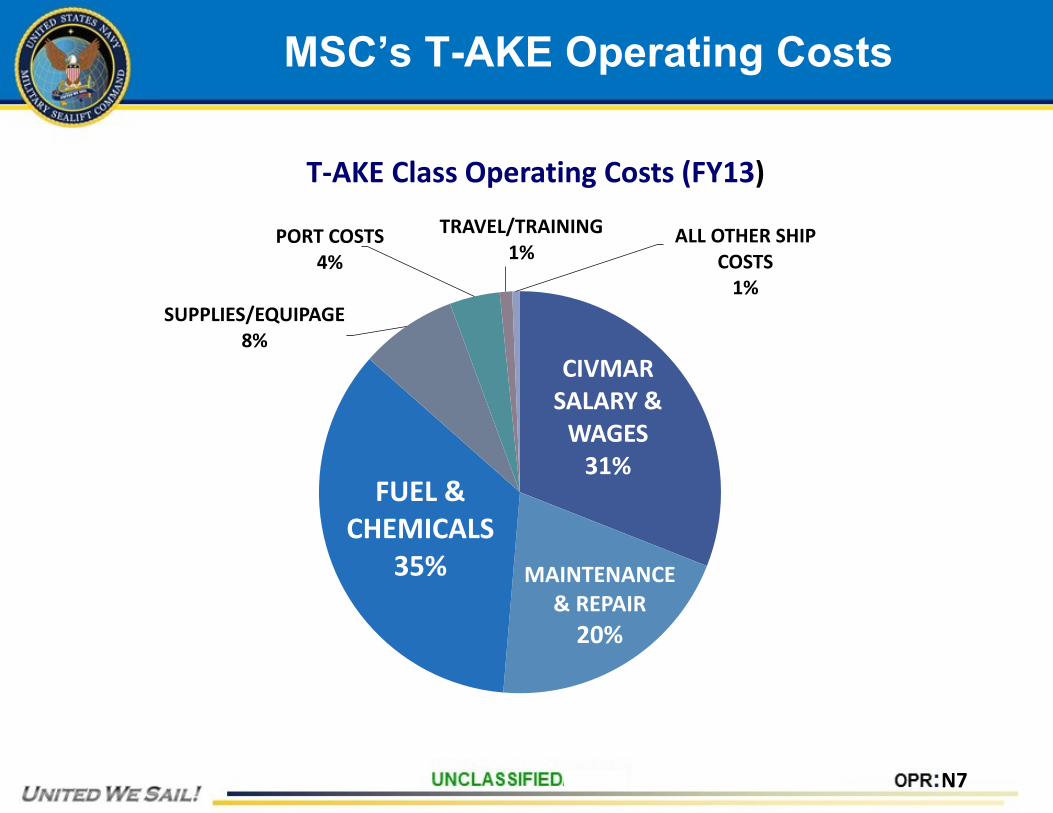
MSC’s T-AKE Operating Costs
CIVMAR SALARY &
WAGES31%
MAINTENANCE & REPAIR
20%
FUEL & CHEMICALS
35%
SUPPLIES/EQUIPAGE8%
PORT COSTS4%
TRAVEL/TRAINING1%
ALL OTHER SHIP COSTS
1%
T-AKE Class Operating Costs (FY13)
N7
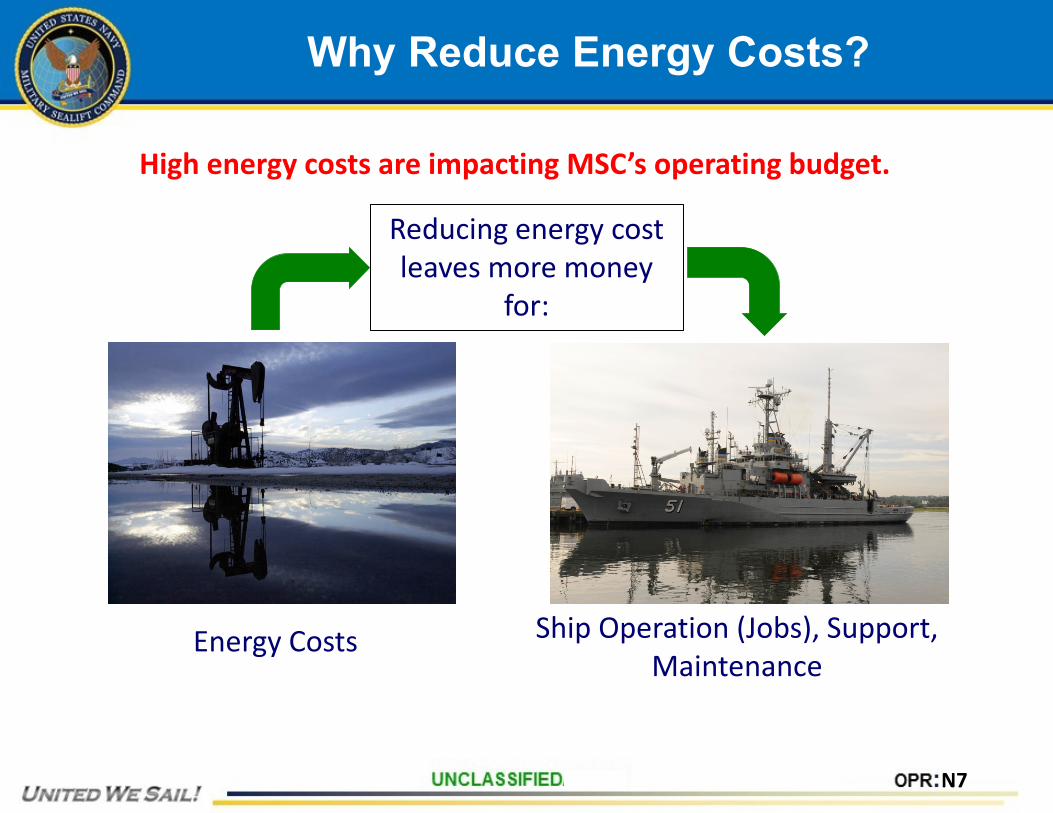
Why Reduce Energy Costs?
High energy costs are impacting MSC’s operating budget.
Reducing energy cost leaves more money
for:
Ship Operation (Jobs), Support, Maintenance
Energy Costs
N7
Key Regulatory and Policy Requirements
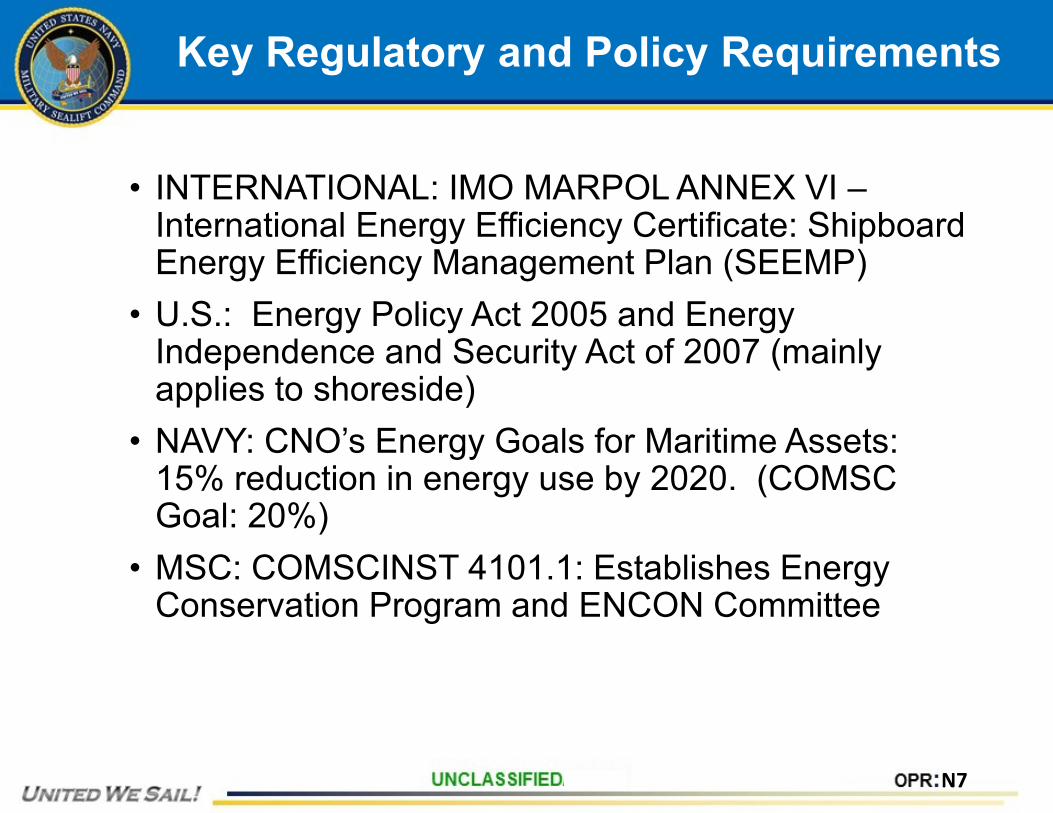
• INTERNATIONAL: IMO MARPOL ANNEX VI –International Energy Efficiency Certificate: Shipboard Energy Efficiency Management Plan (SEEMP)
• U.S.: Energy Policy Act 2005 and Energy Independence and Security Act of 2007 (mainly applies to shoreside)
• NAVY: CNO’s Energy Goals for Maritime Assets: 15% reduction in energy use by 2020. (COMSC Goal: 20%)
• MSC: COMSCINST 4101.1: Establishes Energy Conservation Program and ENCON Committee
N7
International Requirement
Ship Energy Efficiency Management Plan
Presenter
Presentation Notes
The Ship Energy Efficiency Management Plan is a special tool devised by the International Maritime Organization (IMO) to measure and control the green house gas (GHG) emissions from ships. ... Mostly all new ships are implemented with SEEMP and EEDI tools to keep a proper check on pollution from ships
N7
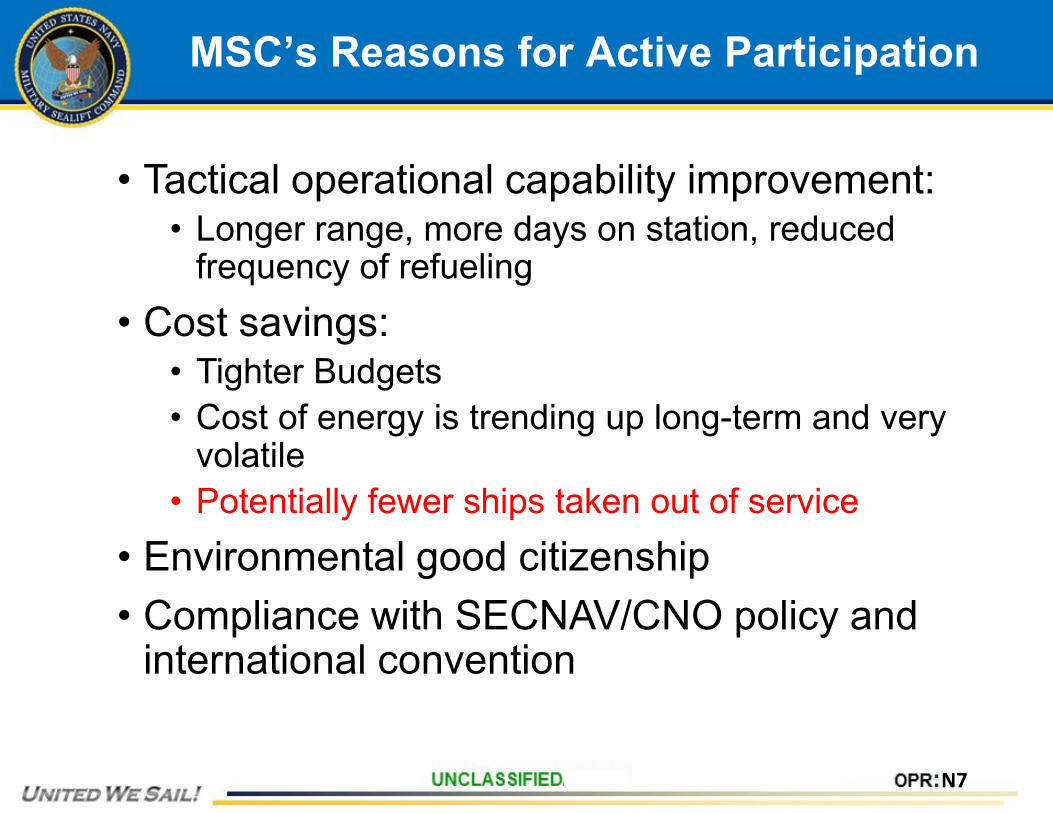
MSC’s Reasons for Active Participation
• Tactical operational capability improvement:• Longer range, more days on station, reduced
frequency of refueling• Cost savings:
• Tighter Budgets• Cost of energy is trending up long-term and very
volatile• Potentially fewer ships taken out of service
• Environmental good citizenship • Compliance with SECNAV/CNO policy and
international convention
N7
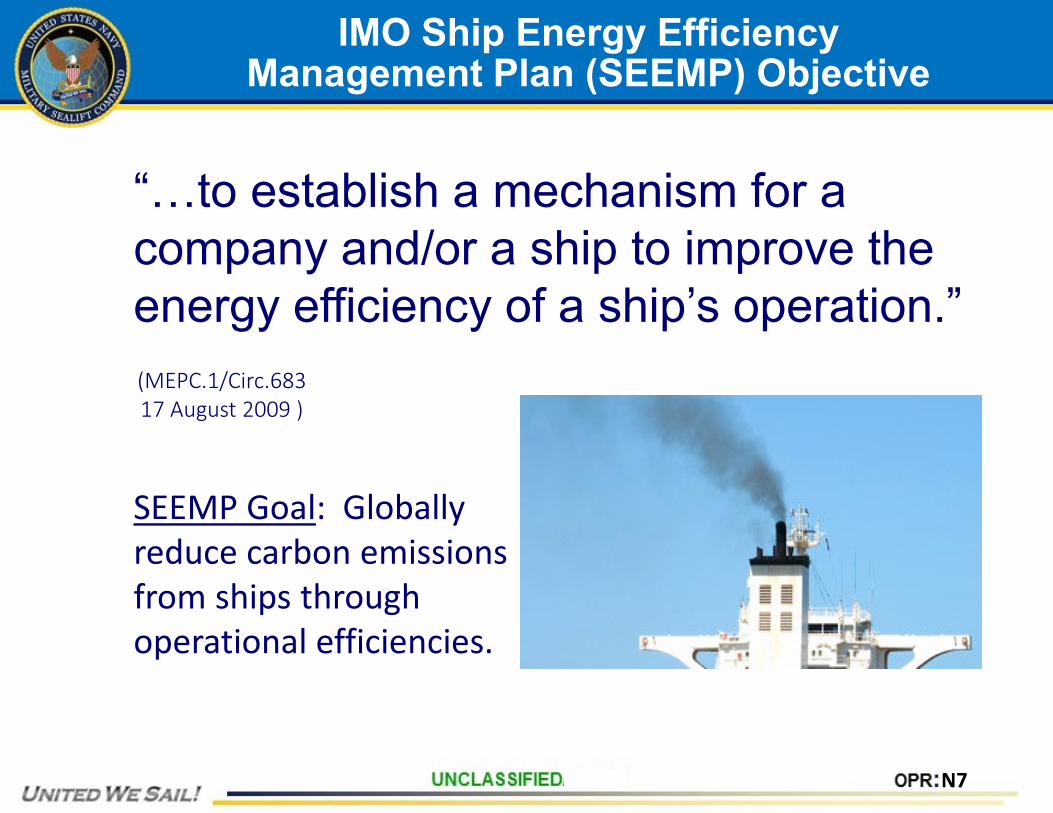
IMO Ship Energy Efficiency Management Plan (SEEMP) Objective
“…to establish a mechanism for a company and/or a ship to improve the energy efficiency of a ship’s operation.”(MEPC.1/Circ.68317 August 2009 )
SEEMP Goal: Globally reduce carbon emissions from ships through operational efficiencies.
N7
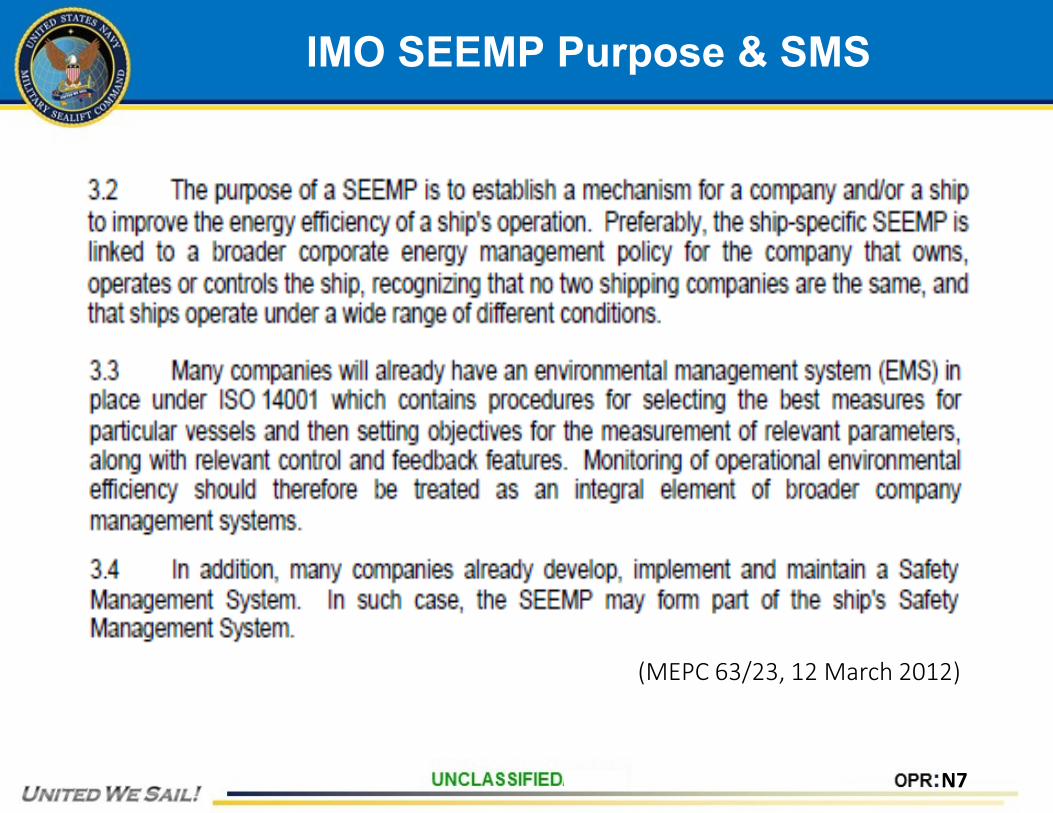
IMO SEEMP Purpose & SMS
(MEPC 63/23, 12 March 2012)
N7
MSC’s SEEMP
• MSC incorporated the SEEMP into its Safety Management System
• Procedure SMS 2.2-017-ALL• Part of ISM Audit, Effective Jan 2013 • International Energy Efficiency Certificate
(for MSC vessels, a Statement of Voluntary Compliance (SOVC))
N7
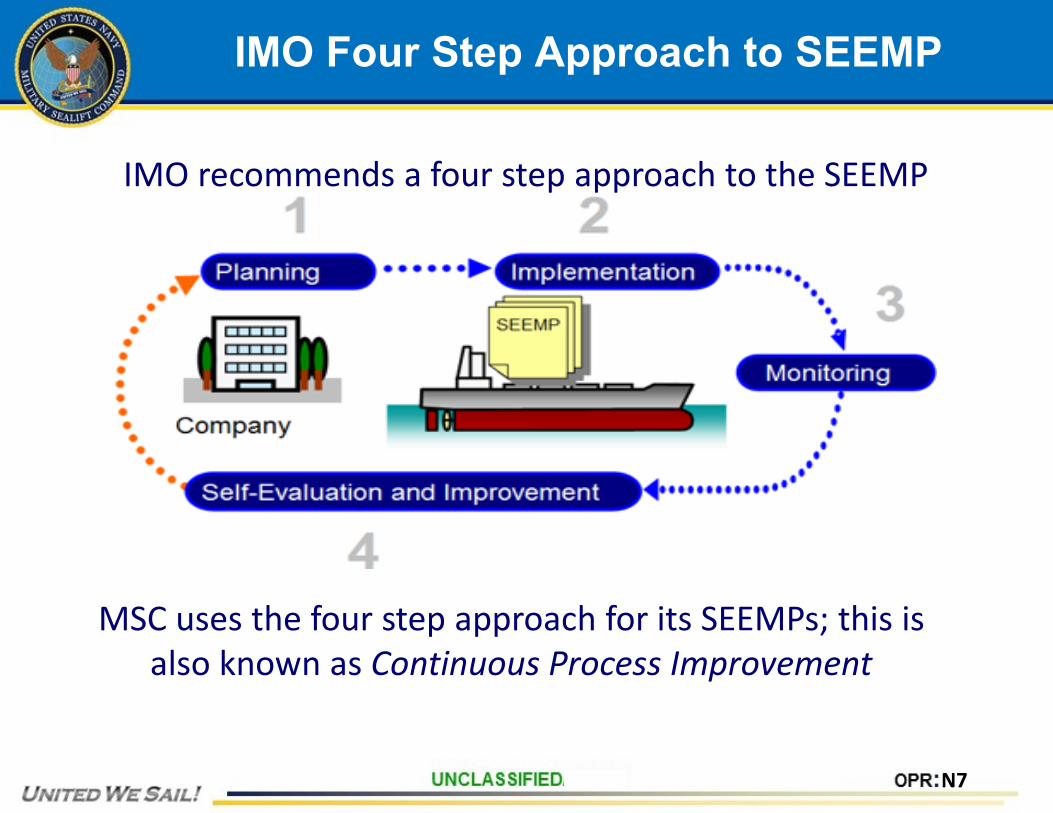
IMO Four Step Approach to SEEMP
MSC uses the four step approach for its SEEMPs; this is also known as Continuous Process Improvement
IMO recommends a four step approach to the SEEMP
N7
IMO Step 1: Planning
• Most crucial stage of the SEEMP• Two Phases
• Phase 1: Baseline • Determines current status of ship energy usage and
efficiency• Measures efficiency improvement from baseline
• Phase 2: Select most appropriate, effective Energy Conservation Measures (ECMs) and implementable plan
Presenter
Presentation Notes
Phase 1: How can you determine improvements if you have no idea what the status used to be? Phase 2: Designing and selecting energy conservation measures
N7
MSC Planning Approach
• Establish Energy Conservation Program• Identify N7 code responsible for program• Plan program management infrastructure• Plan for accepting and implementing Energy
Conservation Concepts (ECCs)• Plan to incorporate SEEMP concepts into SMS
procedure• Plan on implementing SEEMP in phases
• Phase 1: Baseline• Phase 2: Selecting Energy Conservation Measures (ECMs)
and implementation plan
Step 1: Create Plan for Implementing SEEMP
N7
MSC Phased Approach
• Phase 1: Baseline• Energy Audits (Five Levels) to determine current
status of ship energy usage and efficiency• Vessel Reporting methods to validate
improvements from baseline
• Phase 2: ECM Evaluation and Selection• Begins with Energy Conservation Concepts
(ECCs)• Crew ingenuity results in energy saving ECCs• Crew submits ECC Submission Form (QMS form
no. N0720-203.01C)
Presenter
Presentation Notes
Phase 1: Energy Audiots Phase 2: Obtain good ideas from anywhere.
N7
IMO Step 2: Implementation
• IMO recommendations for implementation: • Define person(s) responsible for implementation• Define tasks required for implementation• Define the period for implementation and
evaluation• Keep records of implementation
Presenter
Presentation Notes
Without a person responsible for implementation, good ideas go nowhere Define tasks – How exactly its going to happen Define time period – “you never said WHEN it had to be done” Example: Honey-Do lists Good Records is how you determine success

N7
MSC Step 2: Implementation
• Establish Energy Conservation Program• Designate N7 code responsible for program• Identify ECMs and implement plan• Develop program for accepting and implementing
Energy Conservation Concepts (ECCs)• Incorporate SEEMP concepts into SMS procedure• Develop processes for evaluating ECCs• Identify quantifiable metrics to monitor savings• Conduct baseline study to establish current energy
consumption baseline• Implement program in phases• Implement Energy Awards Program
Step 2 - Phase 1: Implement SEEMP
N7
MSC Energy Conservation Program
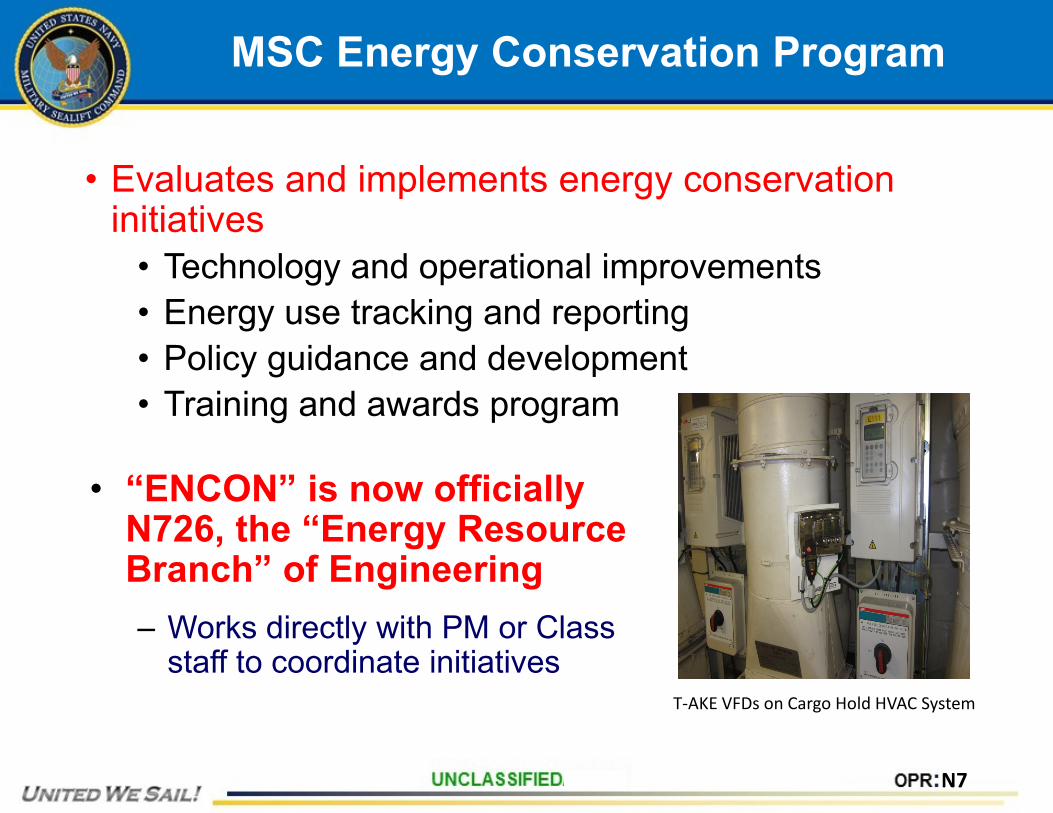
• Evaluates and implements energy conservation initiatives
• Technology and operational improvements• Energy use tracking and reporting• Policy guidance and development• Training and awards program
• “ENCON” is now officially N726, the “Energy Resource Branch” of Engineering– Works directly with PM or Class
staff to coordinate initiativesT-AKE VFDs on Cargo Hold HVAC System
N7
MSC Step 2: Implementation
Step 2 – Phase 2: Implement ECMs • ECMs are implemented through SEEMP
Addendum and normal procedure: T-ALT, Class Notice, Safety Management Procedures Manual, Standing Orders…
• Class SEEMP Addendum can be accessed through SMS:
• Name of ECM• Background• Responsible Person• Procedure for implementation
N7
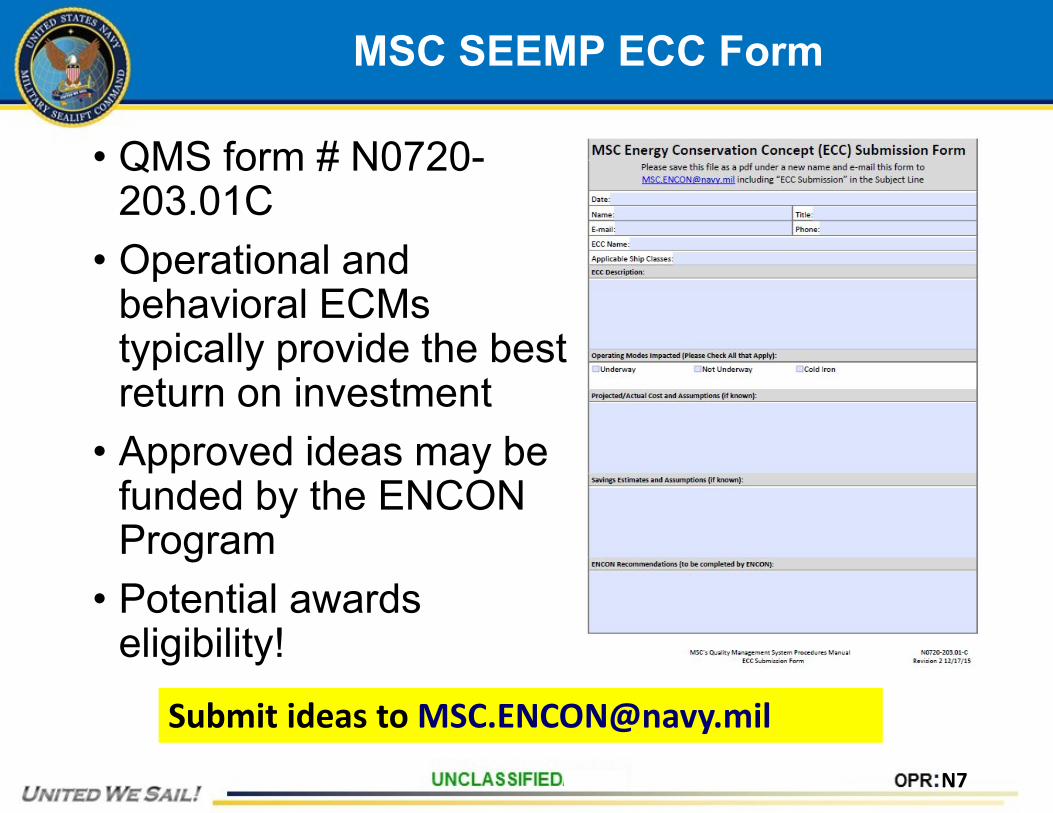
MSC SEEMP ECC Form
• QMS form # N0720-203.01C
• Operational and behavioral ECMs typically provide the best return on investment
• Approved ideas may be funded by the ENCON Program
• Potential awards eligibility!
Submit ideas to [email protected]
N7
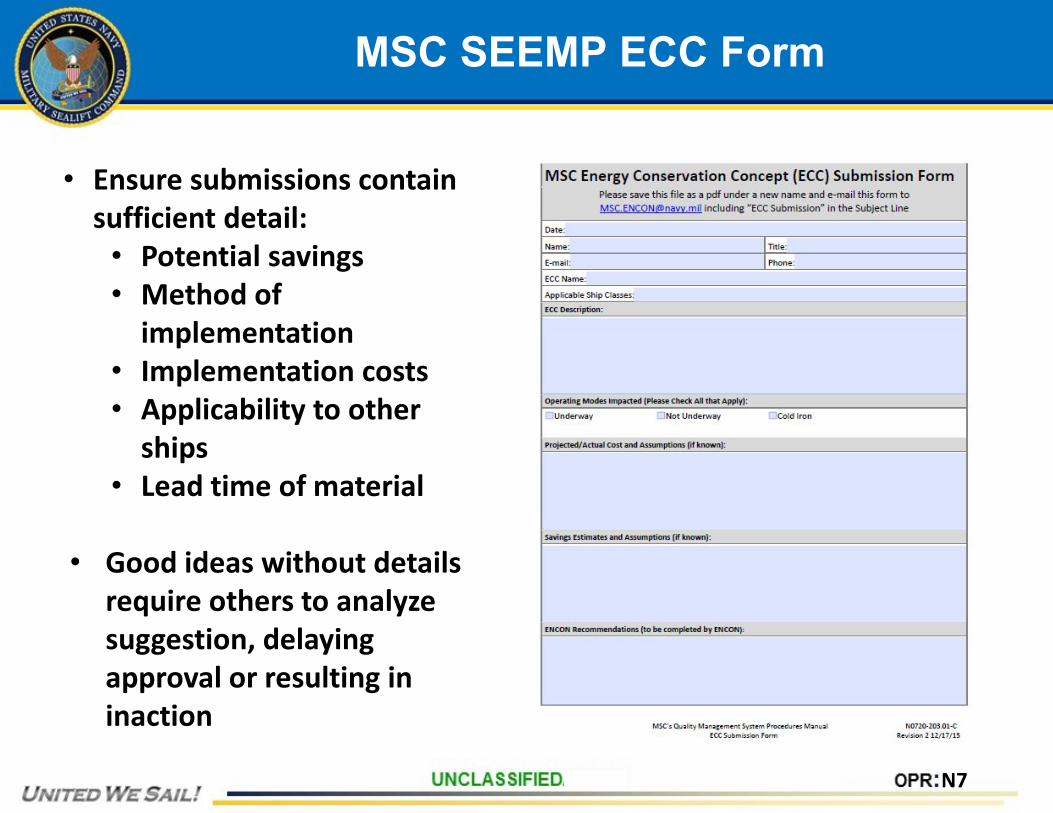
MSC SEEMP ECC Form
• Ensure submissions contain sufficient detail:
• Potential savings• Method of
implementation• Implementation costs• Applicability to other
ships• Lead time of material
• Good ideas without details require others to analyze suggestion, delaying approval or resulting in inaction
N7
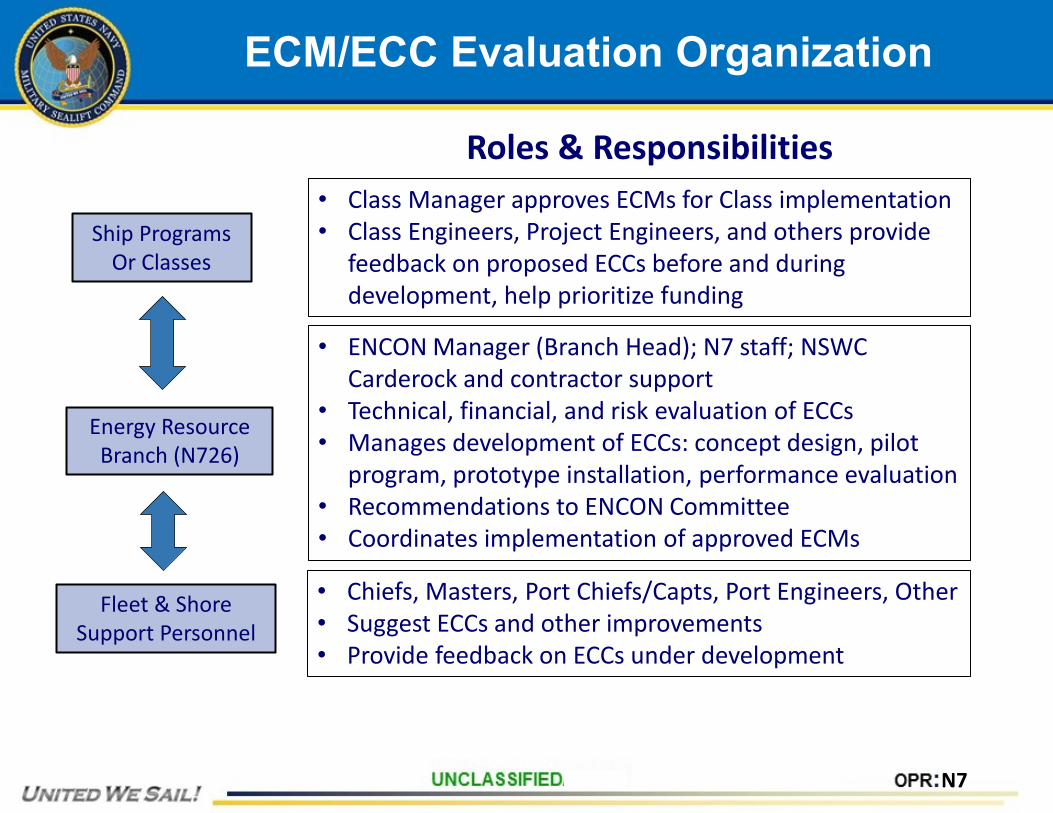
ECM/ECC Evaluation Organization
Ship ProgramsOr Classes
Energy ResourceBranch (N726)
Fleet & Shore Support Personnel
• Class Manager approves ECMs for Class implementation• Class Engineers, Project Engineers, and others provide
feedback on proposed ECCs before and during development, help prioritize funding
Roles & Responsibilities
• ENCON Manager (Branch Head); N7 staff; NSWC Carderock and contractor support
• Technical, financial, and risk evaluation of ECCs• Manages development of ECCs: concept design, pilot
program, prototype installation, performance evaluation• Recommendations to ENCON Committee• Coordinates implementation of approved ECMs
• Chiefs, Masters, Port Chiefs/Capts, Port Engineers, Other• Suggest ECCs and other improvements• Provide feedback on ECCs under development
N7
Energy Awards Recognition Program
• Approved in December 2015 for immediate implementation
• Details in QMS procedure N0720-204.00-AQ• Ships can be recognized for improving operating
energy efficiency, including both government and contract-operated ships
• MSC shoreside and shipboard employees can win monetary awards for submitting successful energy conservation concepts or for other outstanding energy conservation efforts
N7
Energy Awards Recognition Program
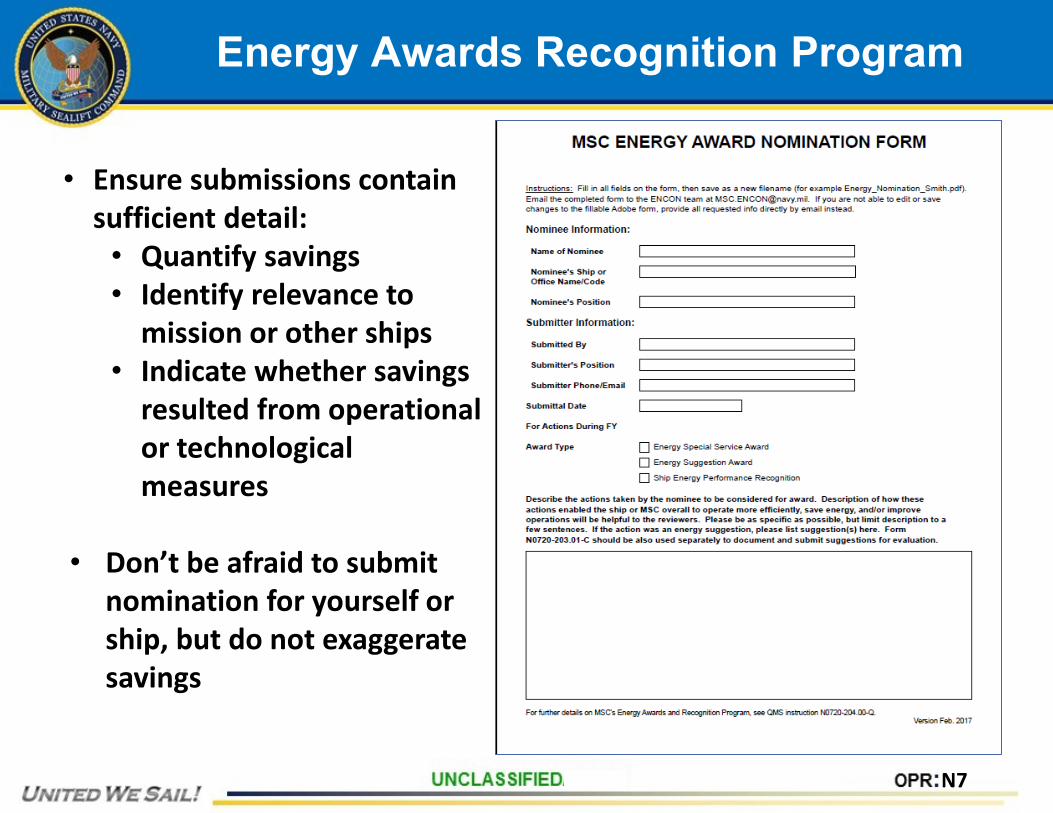
• Ensure submissions contain sufficient detail:
• Quantify savings• Identify relevance to
mission or other ships• Indicate whether savings
resulted from operational or technological measures
• Don’t be afraid to submit nomination for yourself or ship, but do not exaggerate savings

N7
IMO Step 3: Monitoring
• Identify quantitative metrics for program level metrics
• Quantitatively measure specific ECM improvement
• Consistent data collection and reporting
N7
MSC Step 3: Monitoring
• N7 responsible for monitoring: ENCON Group supports monitoring and analysis of data
• NEURS report• Daily Vessel Report• Combat Logistic Force (CLF) report
• Current macro metrics• Gallons/Nautical Mile• Gallons/hour not underway• kWh/day inport shorepower (some facilities)
• Other metrics being developed for program and ECM monitoring

N7
IMO Step 4: Self-Evaluation & Improvement
• Periodically evaluate SEEMP and ECMs• What ECMs worked and what did not• Were goals achieved? If not, why not?• Program level SEEMP and how to improve
• Begin cycle again, Step 1: Planning
N7
MSC Step 4: Self-Evaluation & Improvement
• Coordinated by the ENCON group (N726)• Analysis of collected data
• Identification of subjective data• Exclusion/Inclusion of data based on context
• Vessel, Port Engineer, and Class Manager feedback on effectiveness of ECMs (via PM Life Cycle Managers or others)
• What worked/did not work• What may yet work
• Other input as needed
N7
ENCON Part 1 Summary
• Program is based on International, National, DoD and MSC Requirements (ISM)
• Program purpose: to reduce carbon emissions and energy costs by implementing ECMs
• Program premise: It is possible to manage energy costs by implementing ECM
• Program success requires active participation of all shipboard and shoresidesupport staff
• ECCs allow those closest to energy consumption to suggest new ECMs
• Awards program rewards successful ECM implemented by individual, ship or command
N7
ENCON Part 2 Outline
• Shipboard Energy Efficiency Overview• Ship Energy Consumption and Cost Baselines• Reducing Energy Cost• Strategies for Conservation:
• Propulsion• Auxiliary Systems• Retro-Commissioning • Power Quality
N7
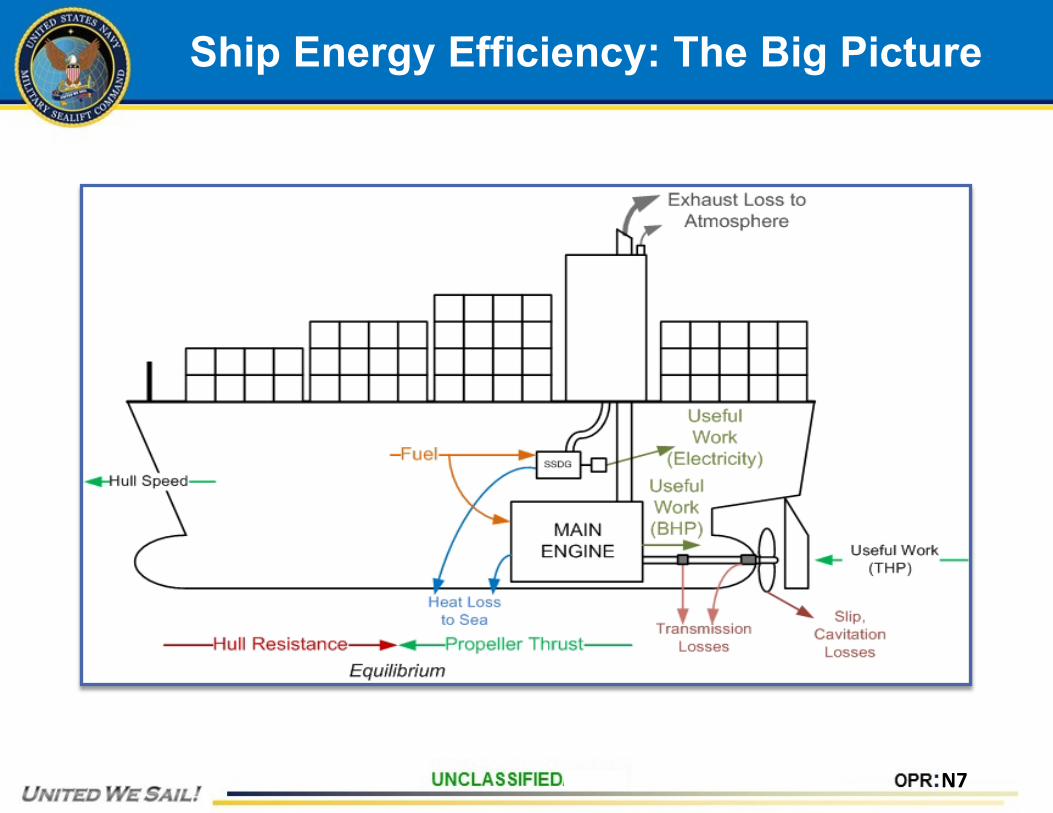
Ship Energy Efficiency: The Big Picture
N7
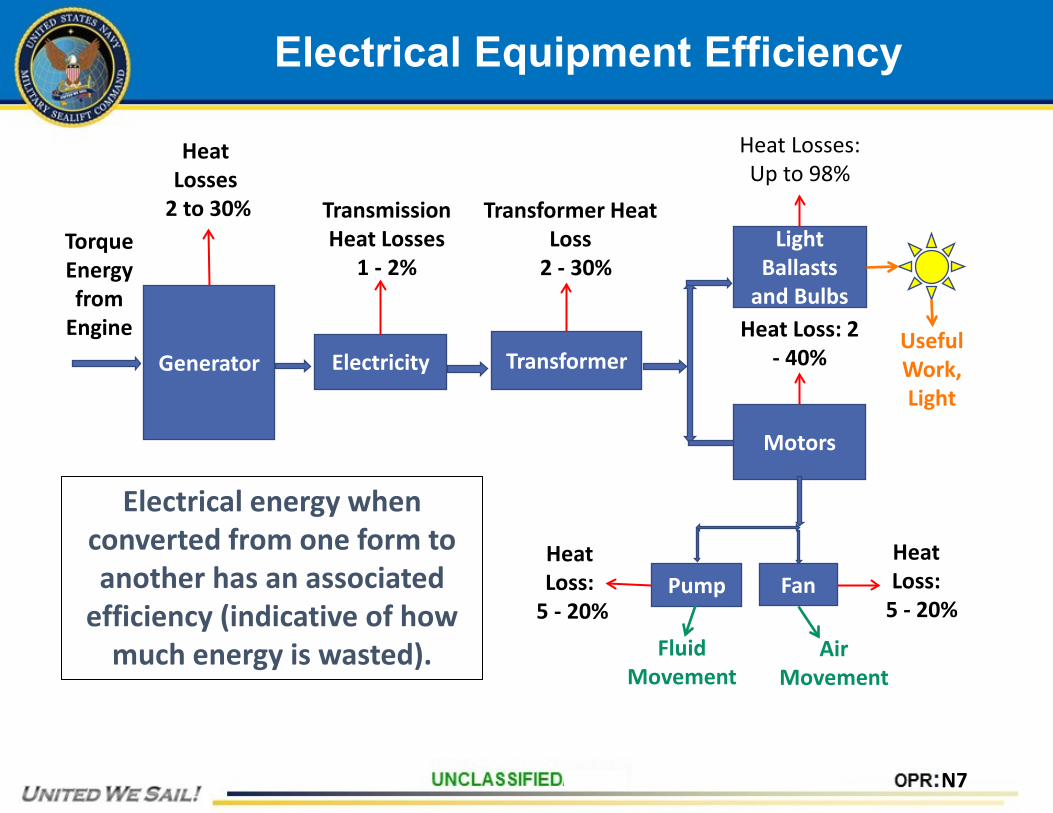
Electrical Equipment Efficiency
Generator
Heat Losses
2 to 30%
Electricity
Transmission Heat Losses
1 - 2%
Transformer
Transformer Heat Loss
2 - 30%Light
Ballasts and Bulbs
Motors
Heat Losses: Up to 98%
Useful Work, Light
Heat Loss: 2 - 40%
Heat Loss:
5 - 20%Pump Fan
Heat Loss:
5 - 20%
Electrical energy when converted from one form to another has an associated
efficiency (indicative of how much energy is wasted). Fluid
MovementAir
Movement
Torque Energy from
Engine
N7
Electrical Equipment Efficiency
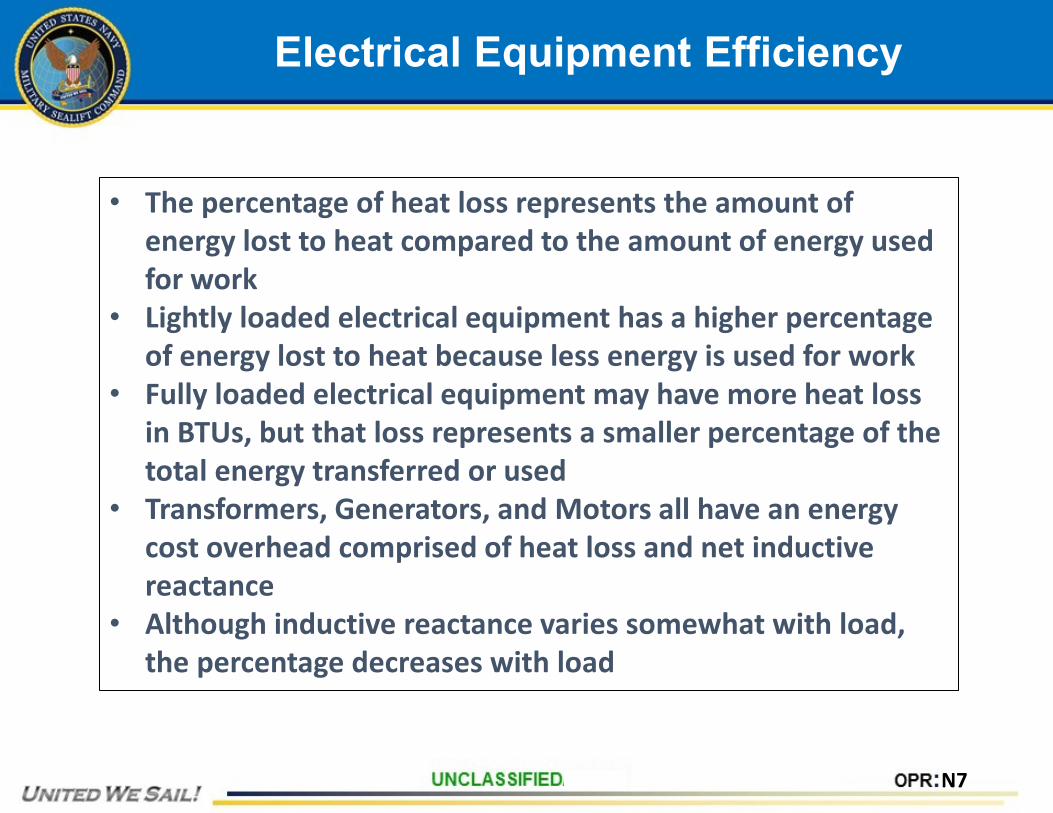
• The percentage of heat loss represents the amount of energy lost to heat compared to the amount of energy used for work
• Lightly loaded electrical equipment has a higher percentage of energy lost to heat because less energy is used for work
• Fully loaded electrical equipment may have more heat loss in BTUs, but that loss represents a smaller percentage of the total energy transferred or used
• Transformers, Generators, and Motors all have an energy cost overhead comprised of heat loss and net inductive reactance
• Although inductive reactance varies somewhat with load, the percentage decreases with load
N7
Electrical Equipment Efficiency
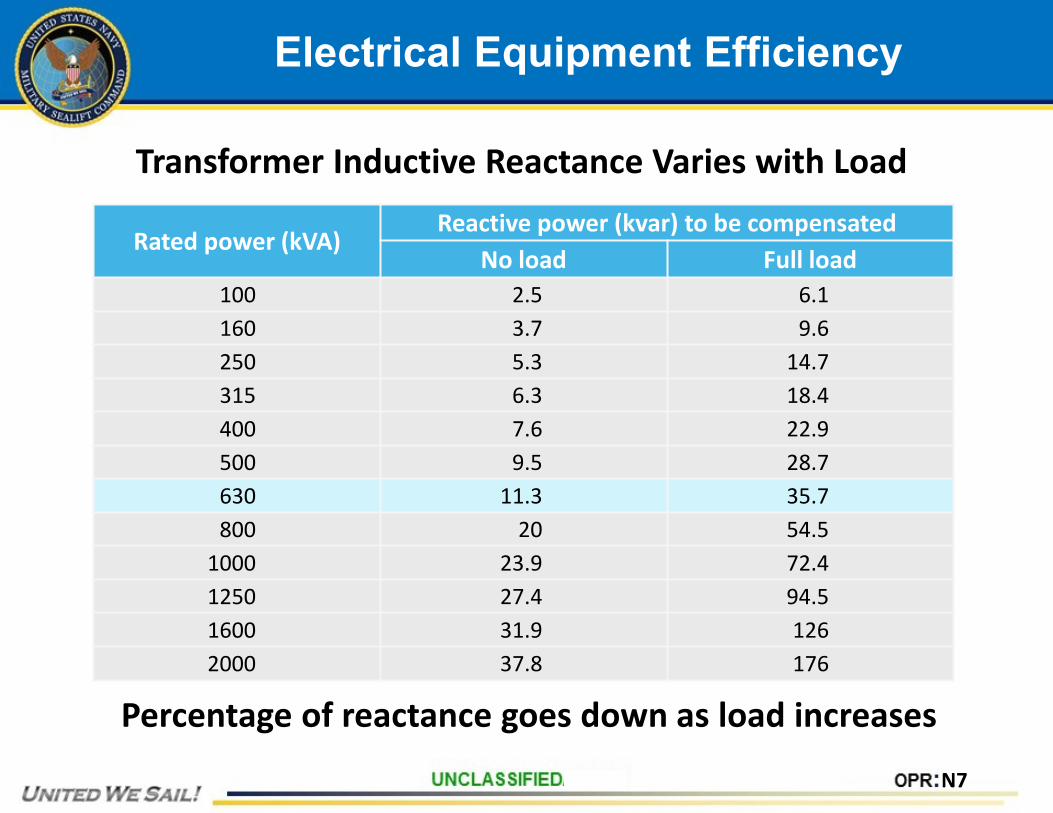
Rated power (kVA)Reactive power (kvar) to be compensated
No load Full load100 2.5 6.1160 3.7 9.6250 5.3 14.7315 6.3 18.4400 7.6 22.9500 9.5 28.7630 11.3 35.7800 20 54.5
1000 23.9 72.41250 27.4 94.51600 31.9 1262000 37.8 176
Transformer Inductive Reactance Varies with Load
Percentage of reactance goes down as load increases
N7
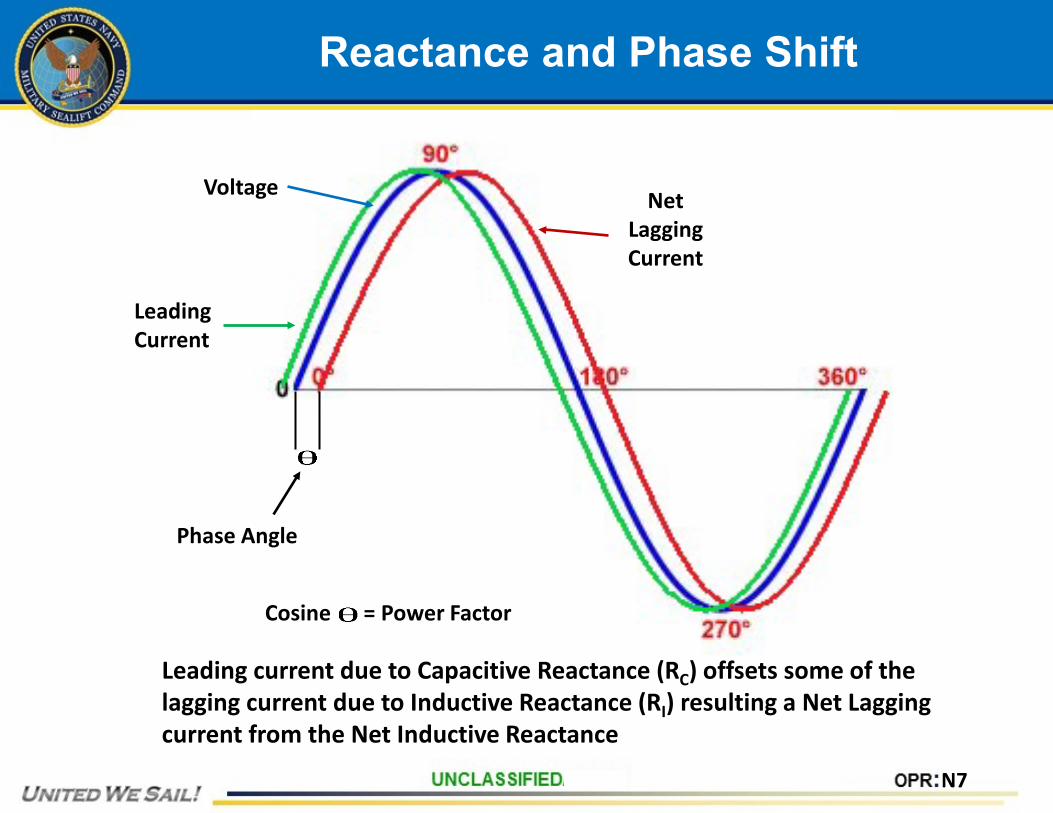
LeadingCurrent
NetLaggingCurrent
Voltage
Phase Angle
Cosine = Power Factor
Reactance and Phase Shift
Leading current due to Capacitive Reactance (RC) offsets some of the lagging current due to Inductive Reactance (RI) resulting a Net Lagging current from the Net Inductive Reactance
N7
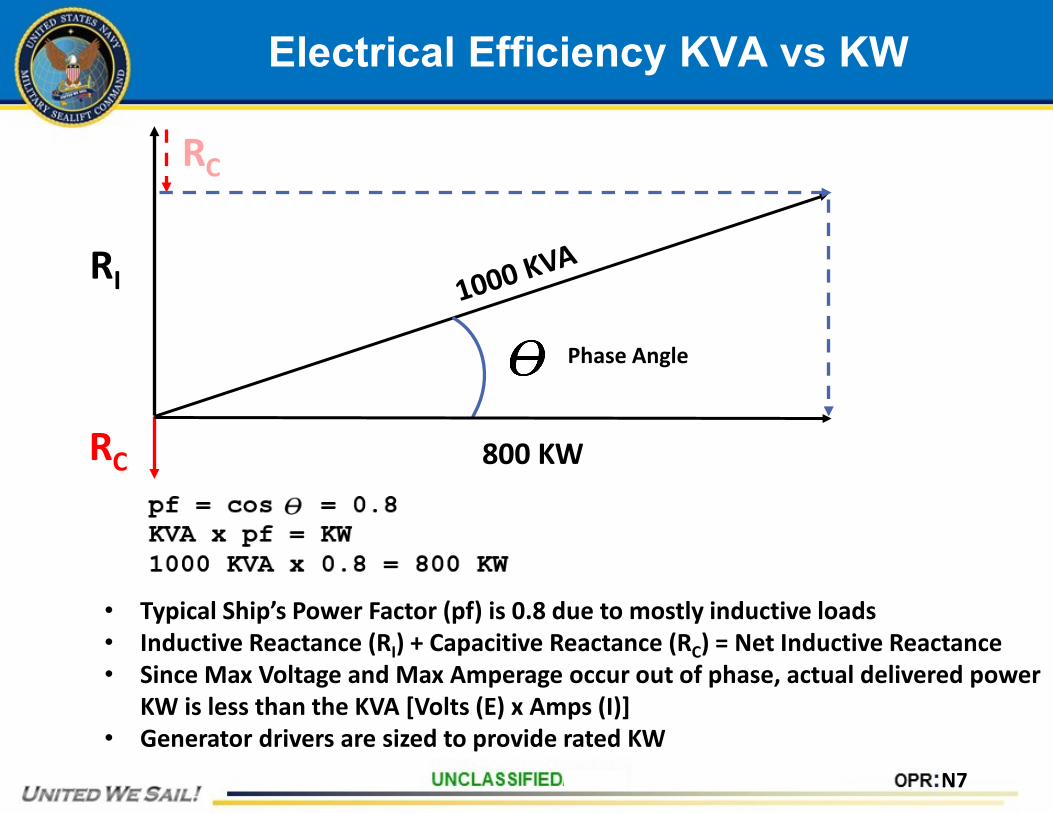
Electrical Efficiency KVA vs KW
RI
RC 800 KW
Phase Angle
• Typical Ship’s Power Factor (pf) is 0.8 due to mostly inductive loads• Inductive Reactance (RI) + Capacitive Reactance (RC) = Net Inductive Reactance• Since Max Voltage and Max Amperage occur out of phase, actual delivered power
KW is less than the KVA [Volts (E) x Amps (I)]• Generator drivers are sized to provide rated KW
RC
N7
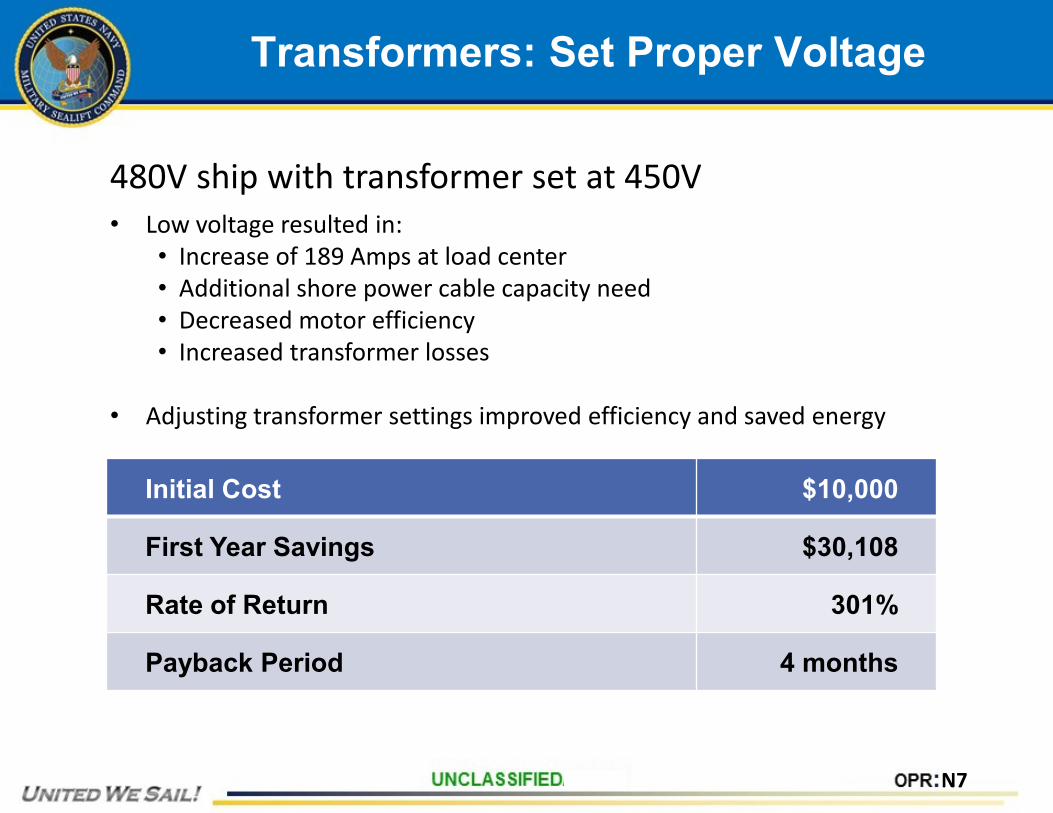
Transformers: Set Proper Voltage
Initial Cost $10,000
First Year Savings $30,108
Rate of Return 301%
Payback Period 4 months
• Low voltage resulted in:• Increase of 189 Amps at load center• Additional shore power cable capacity need• Decreased motor efficiency• Increased transformer losses
• Adjusting transformer settings improved efficiency and saved energy
480V ship with transformer set at 450V
N7
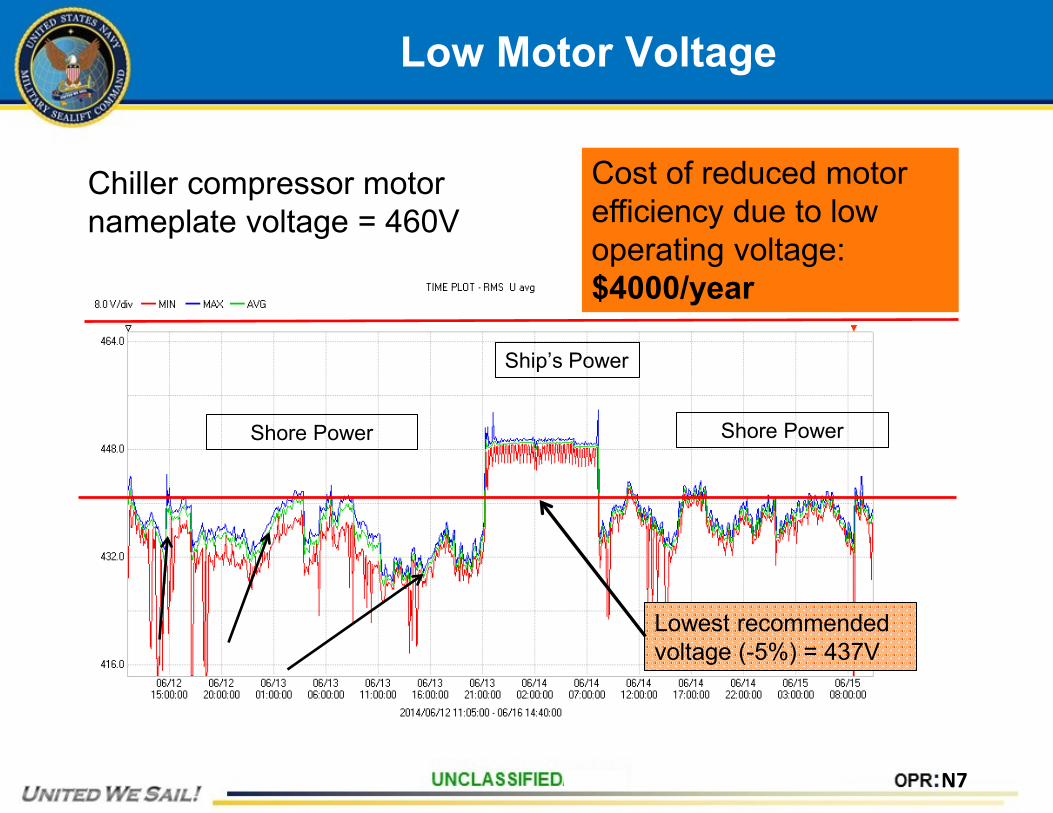
Low Motor Voltage
Chiller compressor motor nameplate voltage = 460V
Lowest recommended voltage (-5%) = 437V
Shore Power Shore Power
Ship’s Power
Cost of reduced motor efficiency due to low operating voltage: $4000/year
N7
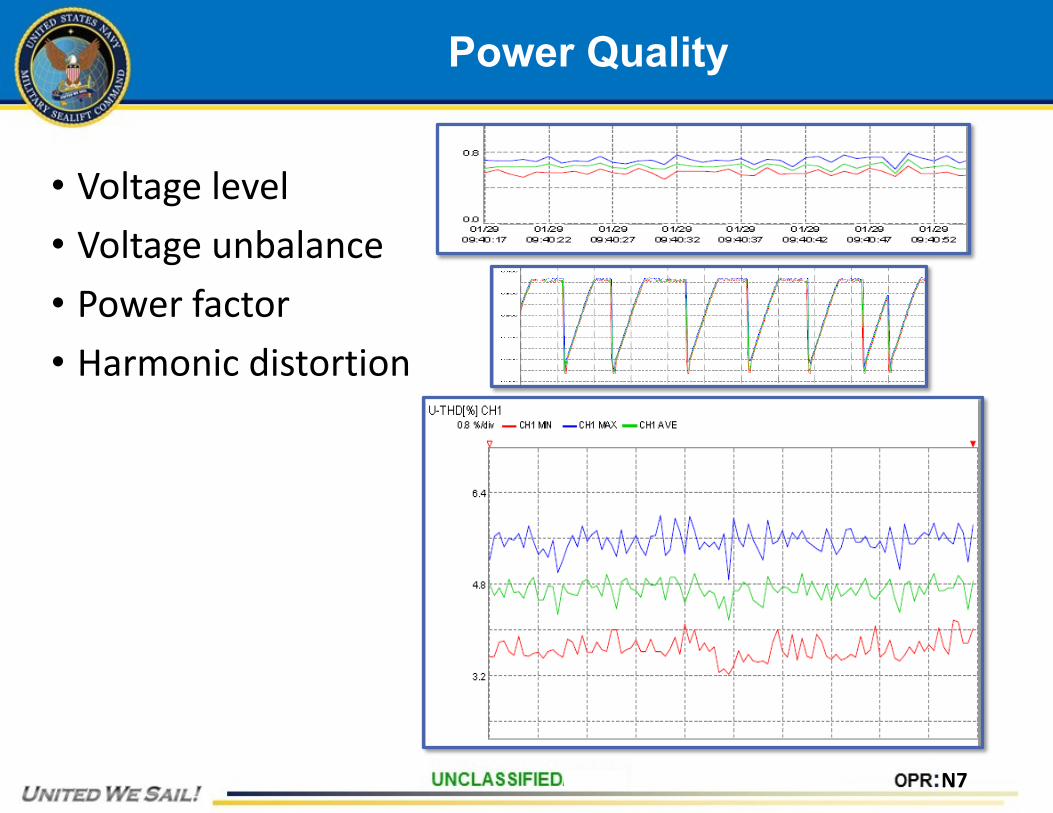
Power Quality
• Voltage level• Voltage unbalance• Power factor• Harmonic distortion
N7
Baselining Energy Cost & Consumption
N7
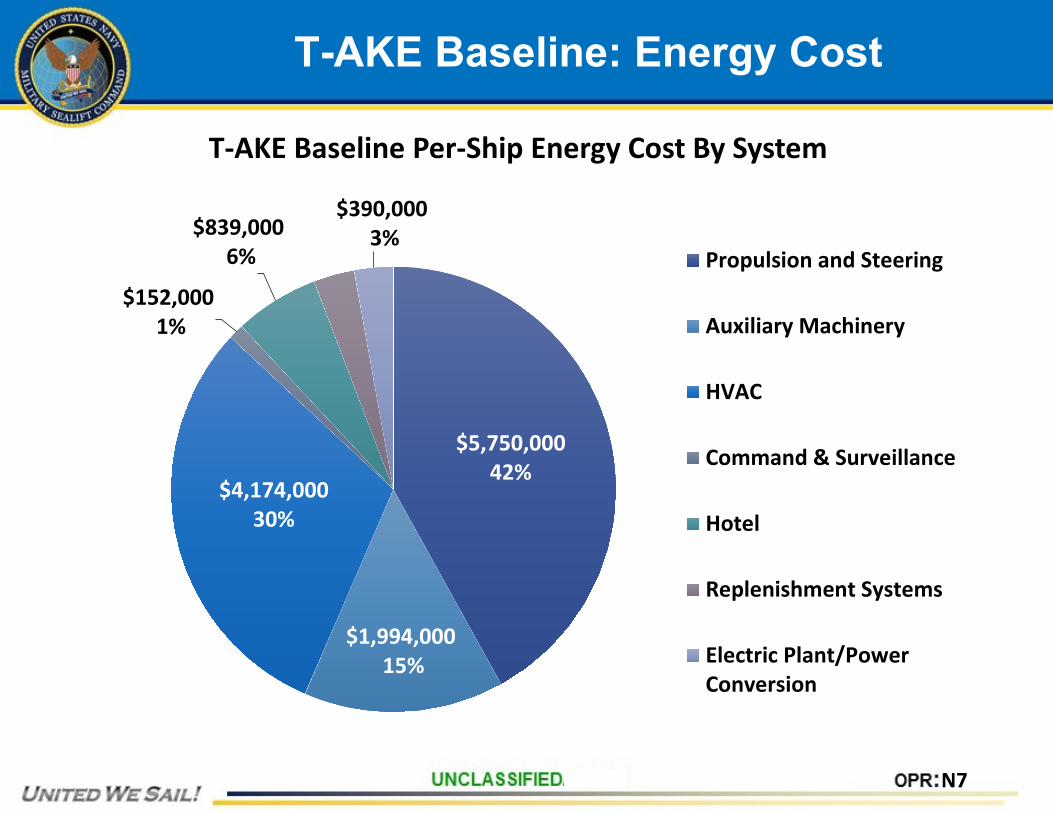
T-AKE Baseline: Energy Cost
$5,750,000 42%
$1,994,00015%
$4,174,00030%
$152,0001%
$839,0006%
$390,0003%
Propulsion and Steering
Auxiliary Machinery
HVAC
Command & Surveillance
Hotel
Replenishment Systems
Electric Plant/PowerConversion
T-AKE Baseline Per-Ship Energy Cost By System
N7
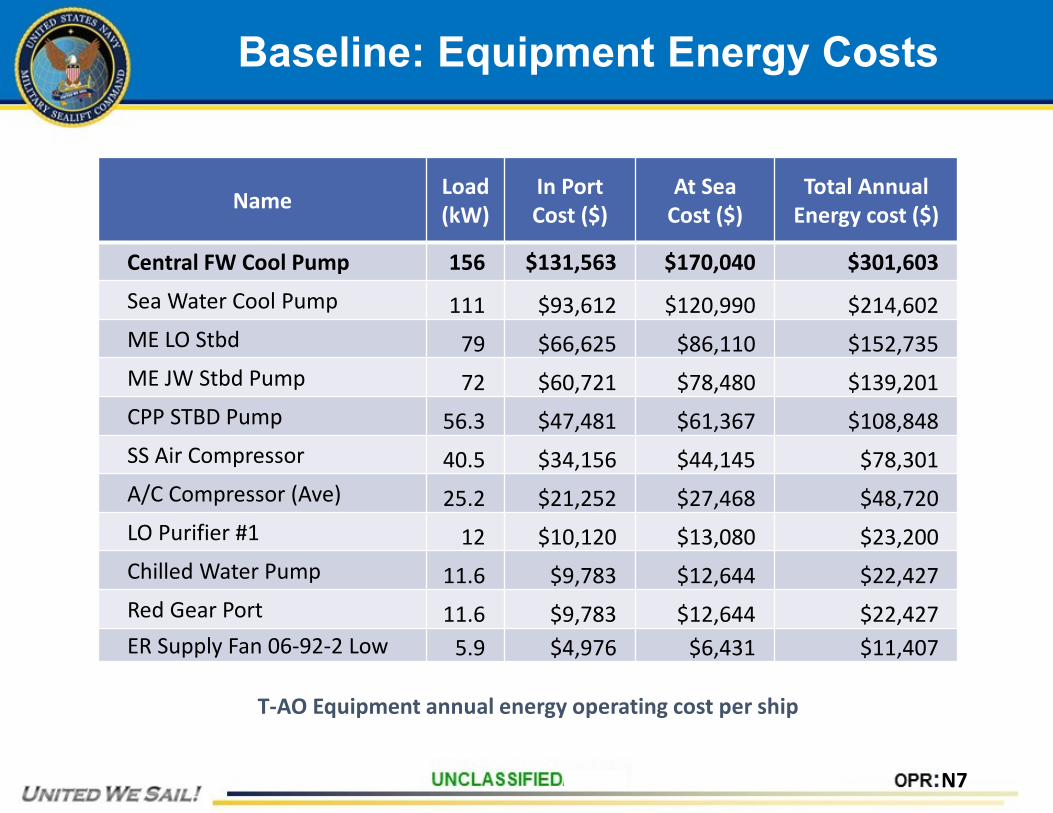
Baseline: Equipment Energy Costs
Name Load (kW)
In Port Cost ($)
At Sea Cost ($)
Total Annual Energy cost ($)
Central FW Cool Pump 156 $131,563 $170,040 $301,603
Sea Water Cool Pump 111 $93,612 $120,990 $214,602ME LO Stbd 79 $66,625 $86,110 $152,735ME JW Stbd Pump 72 $60,721 $78,480 $139,201CPP STBD Pump 56.3 $47,481 $61,367 $108,848SS Air Compressor 40.5 $34,156 $44,145 $78,301A/C Compressor (Ave) 25.2 $21,252 $27,468 $48,720LO Purifier #1 12 $10,120 $13,080 $23,200Chilled Water Pump 11.6 $9,783 $12,644 $22,427Red Gear Port 11.6 $9,783 $12,644 $22,427ER Supply Fan 06-92-2 Low 5.9 $4,976 $6,431 $11,407
T-AO Equipment annual energy operating cost per ship
N7
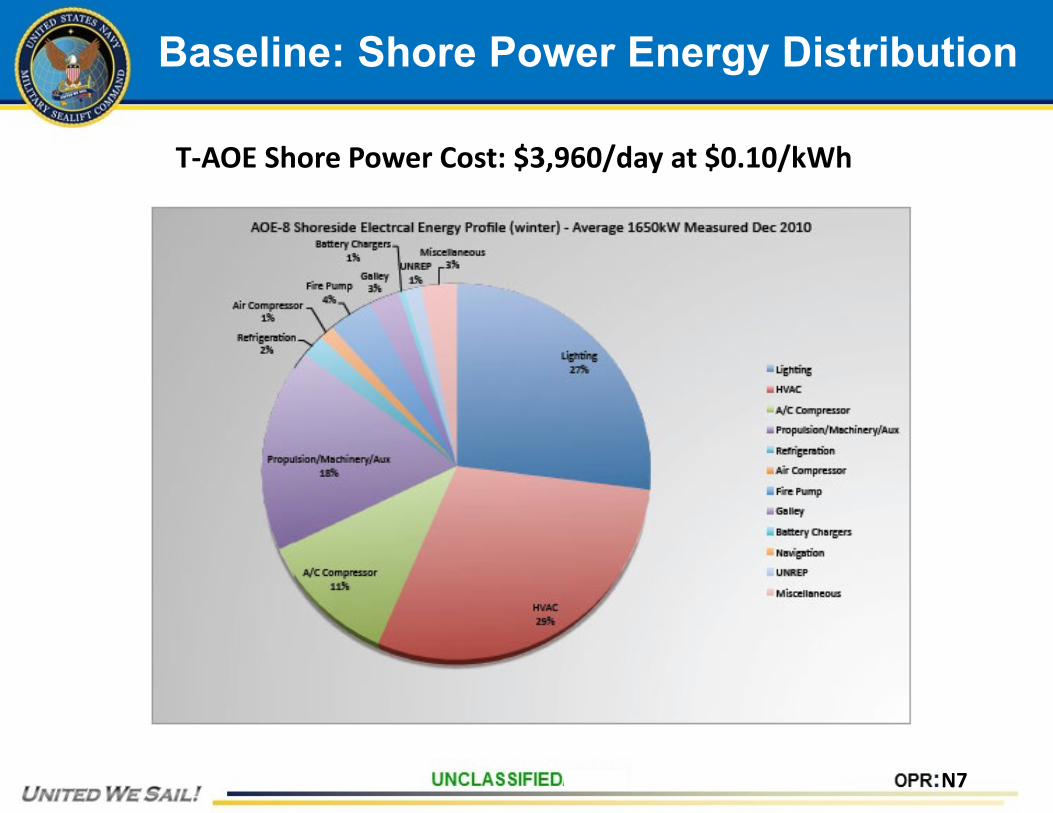
Baseline: Shore Power Energy Distribution
T-AOE Shore Power Cost: $3,960/day at $0.10/kWh
N7
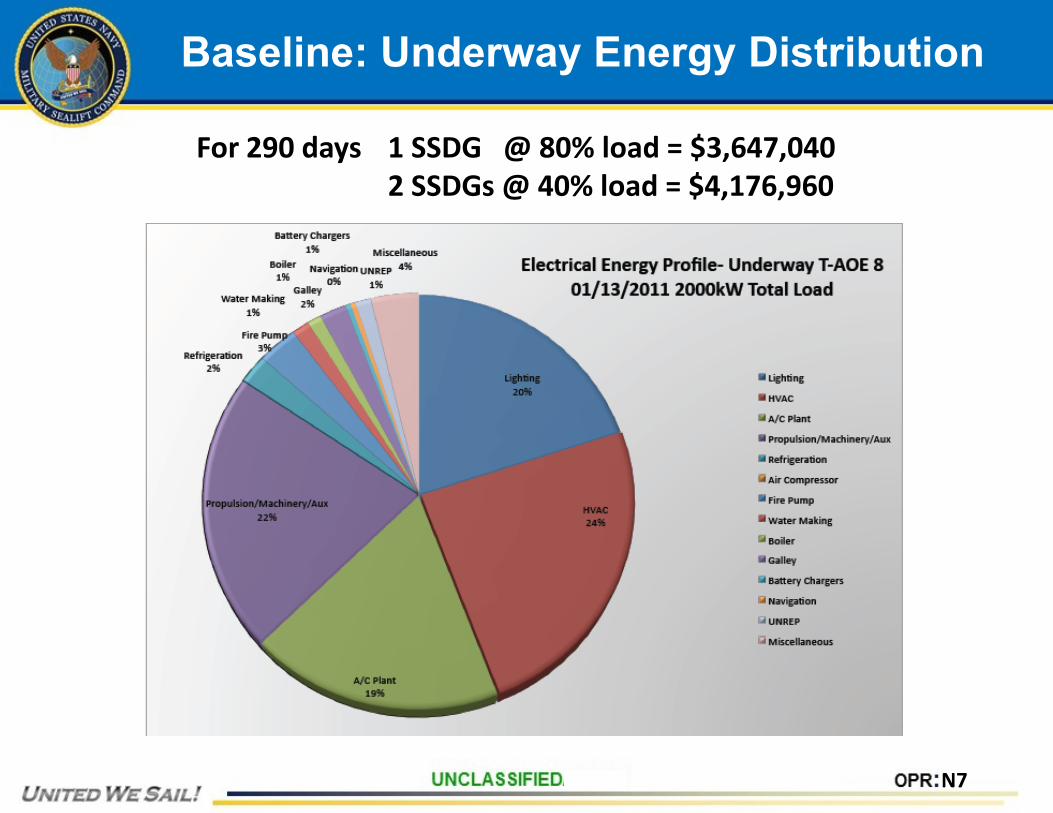
Baseline: Underway Energy Distribution
For 290 days 1 SSDG @ 80% load = $3,647,0402 SSDGs @ 40% load = $4,176,960
N7
Baseline: Underway Energy Distribution
$10,000,000
$12,000,000
$14,000,000
$16,000,000
$18,000,000
$20,000,000
0 25 50 75 100
Annu
al C
ost
% Engine Load
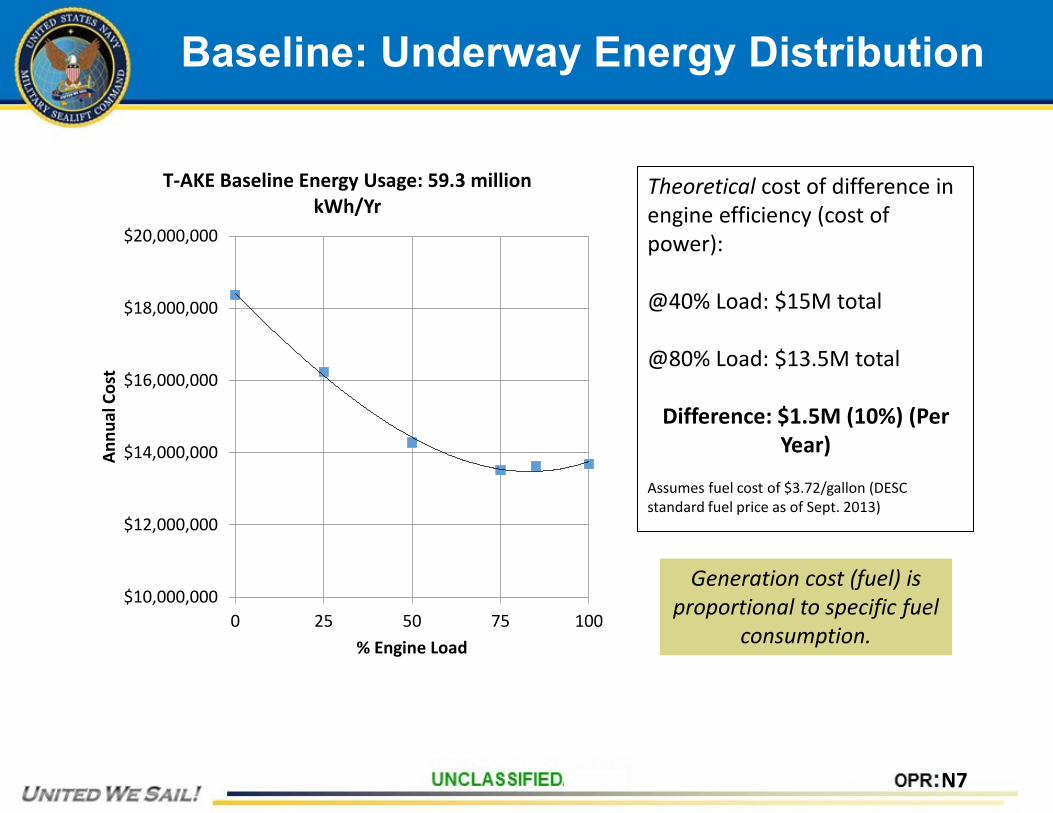
T-AKE Baseline Energy Usage: 59.3 million kWh/Yr
Theoretical cost of difference in engine efficiency (cost of power):
@40% Load: $15M total
@80% Load: $13.5M total
Difference: $1.5M (10%) (Per Year)
Assumes fuel cost of $3.72/gallon (DESC standard fuel price as of Sept. 2013)
Generation cost (fuel) is proportional to specific fuel
consumption.
N7
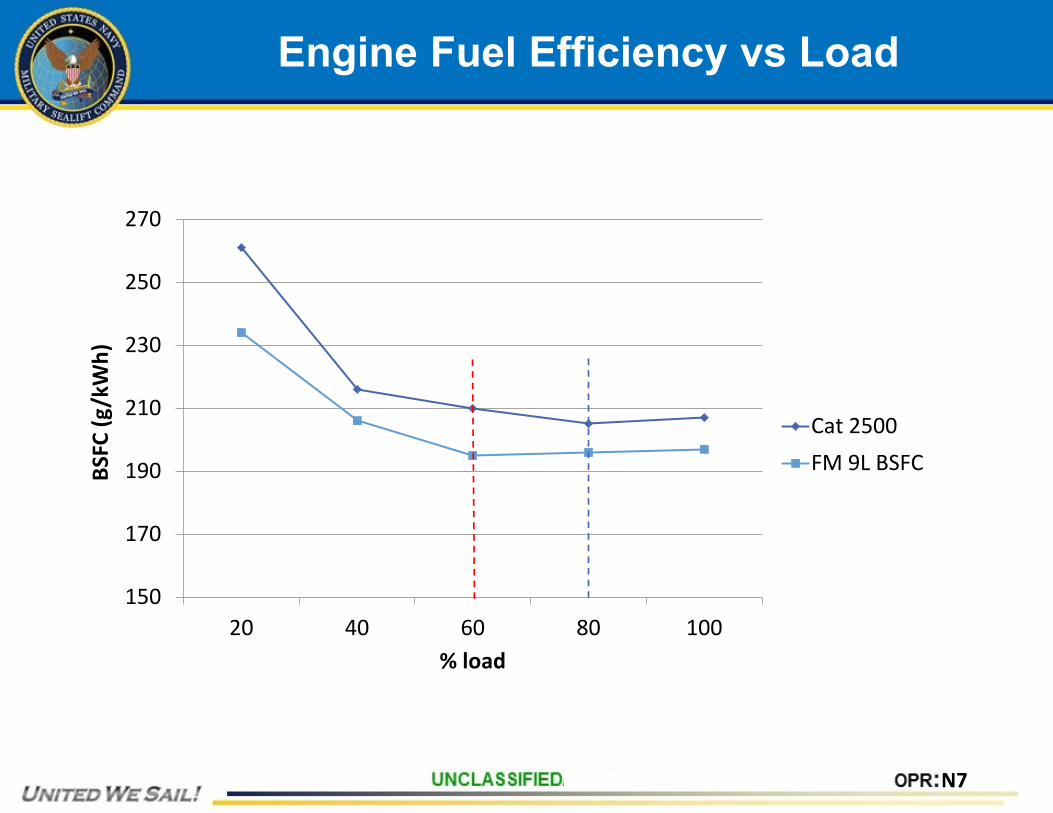
Engine Fuel Efficiency vs Load
150
170
190
210
230
250
270
20 40 60 80 100
BSFC
(g/k
Wh)
% load
Cat 2500FM 9L BSFC
N7
Strategies for Conservation
N7
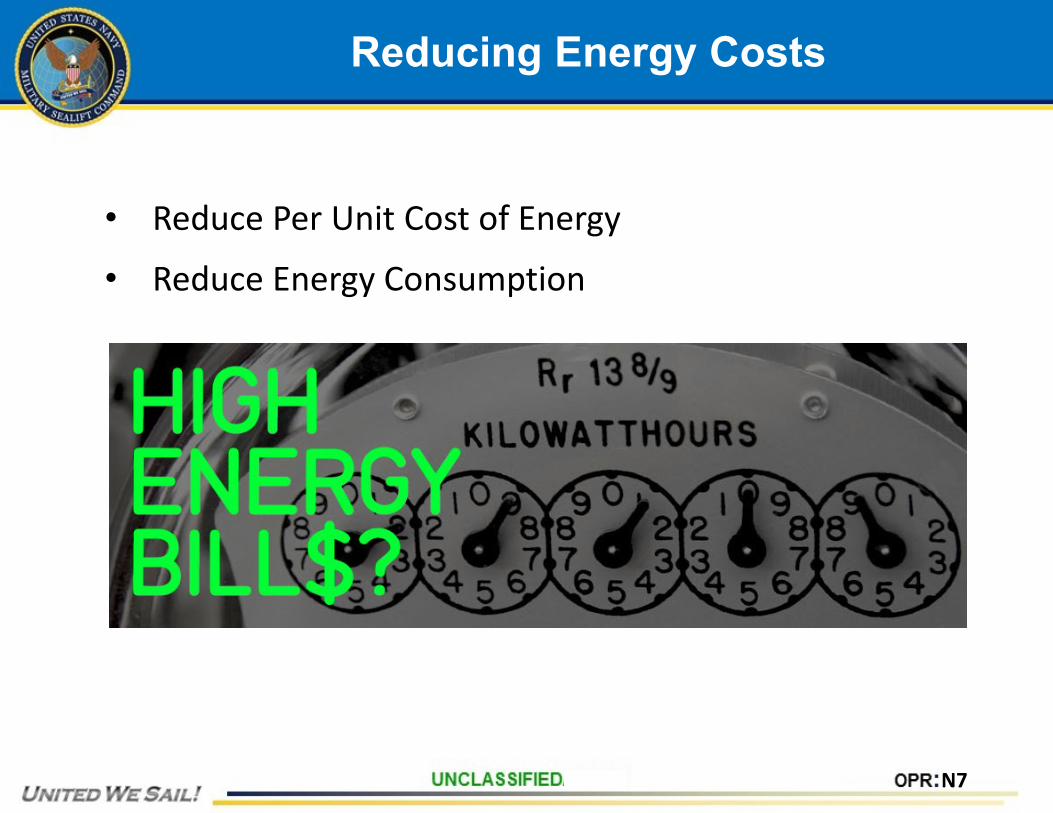
Reducing Energy Costs
• Reduce Per Unit Cost of Energy
• Reduce Energy Consumption
N7
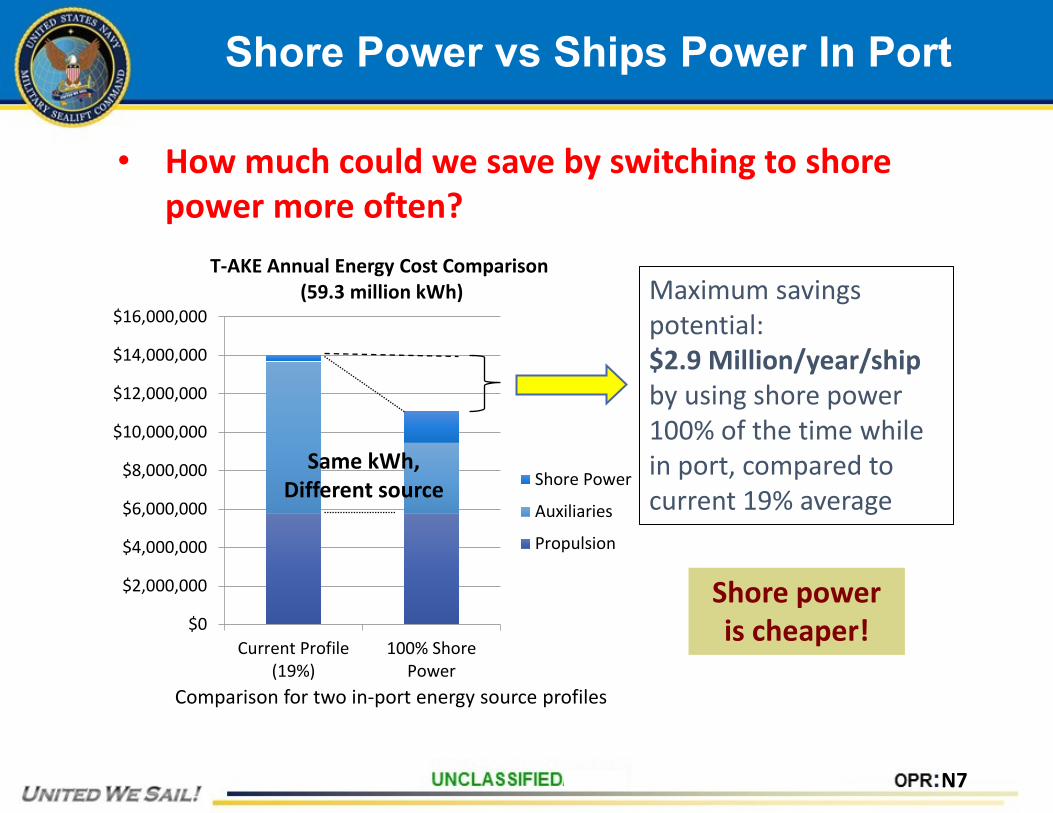
Shore Power vs Ships Power In Port
$0
$2,000,000
$4,000,000
$6,000,000
$8,000,000
$10,000,000
$12,000,000
$14,000,000
$16,000,000
Current Profile(19%)
100% ShorePower
T-AKE Annual Energy Cost Comparison(59.3 million kWh)
Shore Power
Auxiliaries
Propulsion
Maximum savings potential:$2.9 Million/year/shipby using shore power 100% of the time while in port, compared to current 19% average
Comparison for two in-port energy source profiles
Shore poweris cheaper!
Same kWh,Different source
• How much could we save by switching to shore power more often?
N7
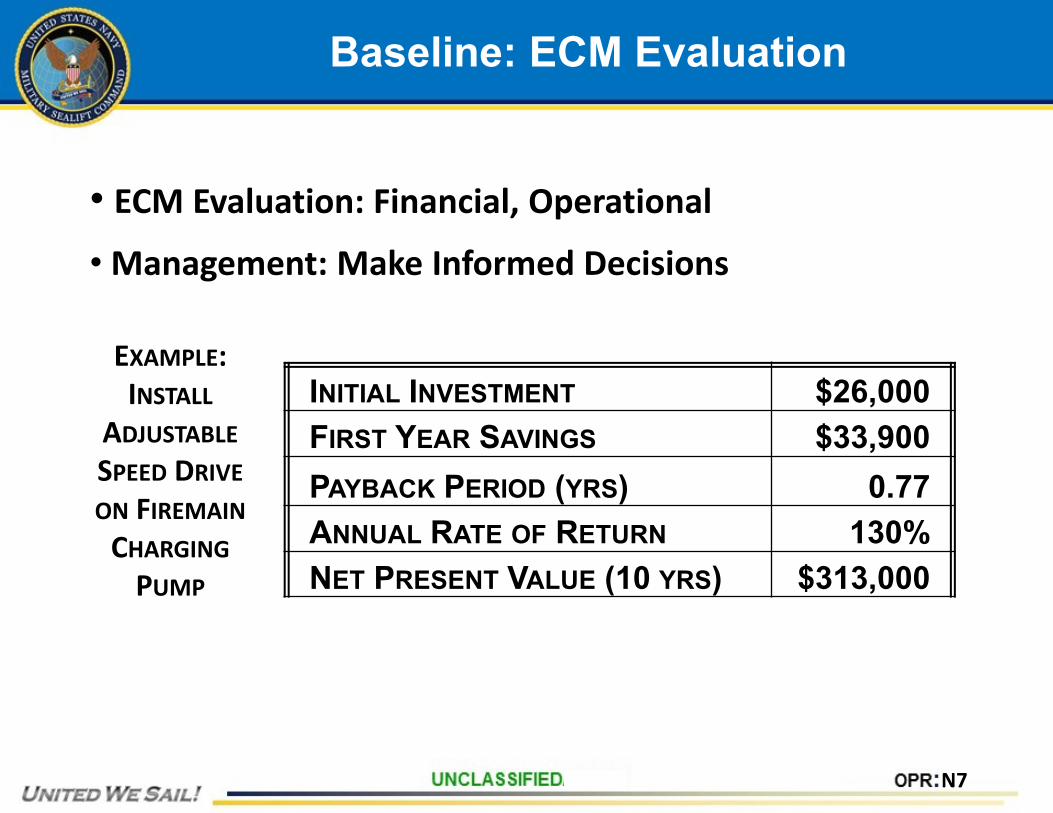
Baseline: ECM Evaluation
INITIAL INVESTMENT $26,000FIRST YEAR SAVINGS $33,900PAYBACK PERIOD (YRS) 0.77ANNUAL RATE OF RETURN 130%NET PRESENT VALUE (10 YRS) $313,000
EXAMPLE:INSTALL
ADJUSTABLESPEED DRIVEON FIREMAIN
CHARGINGPUMP
• ECM Evaluation: Financial, Operational
• Management: Make Informed Decisions
N7
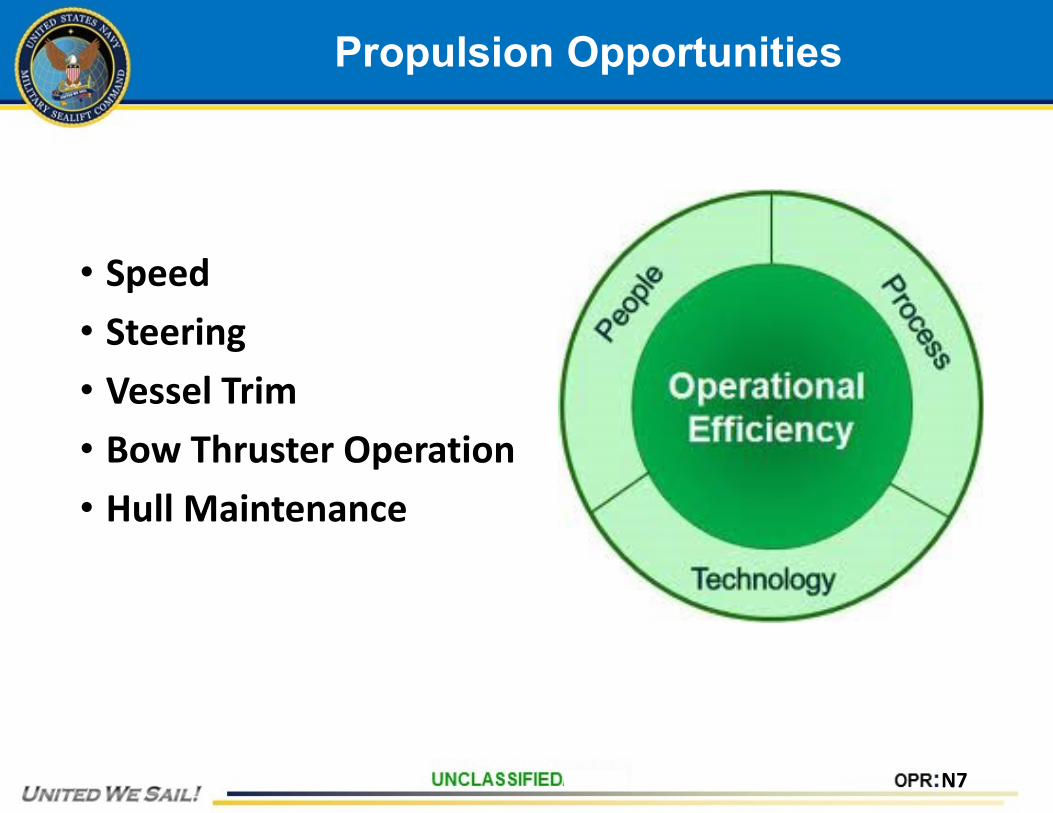
Propulsion Opportunities
• Speed• Steering• Vessel Trim• Bow Thruster Operation• Hull Maintenance
N7
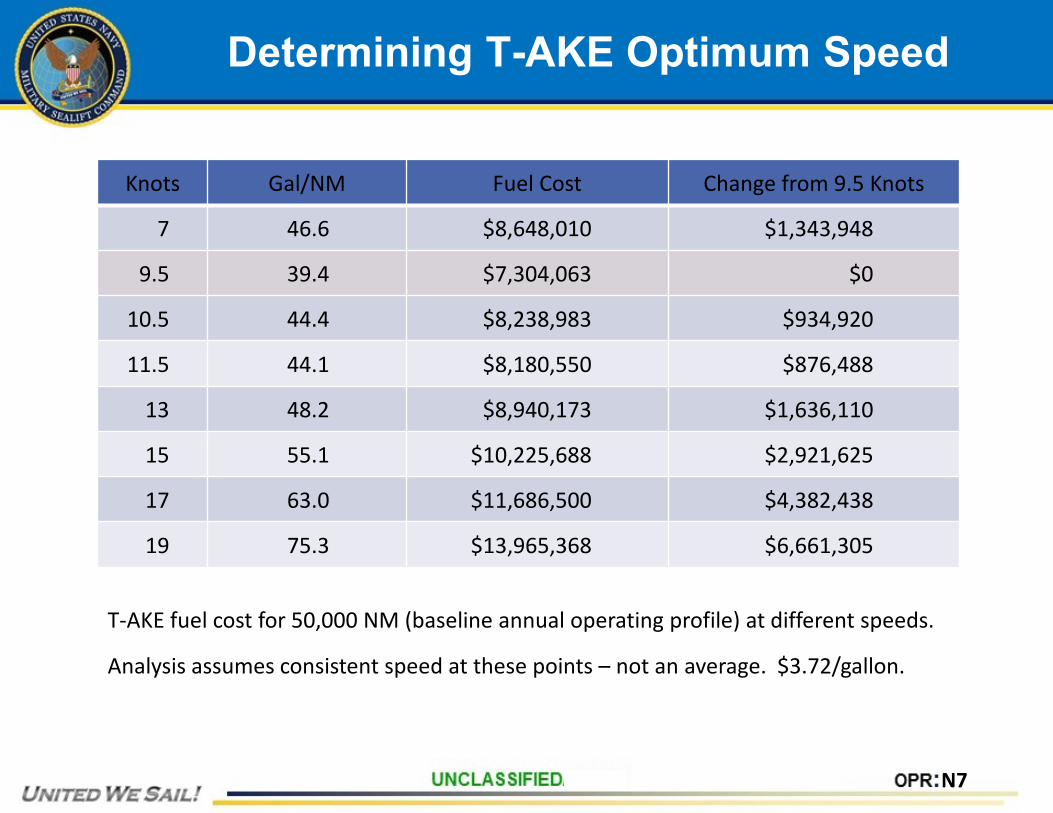
Determining T-AKE Optimum Speed
Knots Gal/NM Fuel Cost Change from 9.5 Knots
7 46.6 $8,648,010 $1,343,948
9.5 39.4 $7,304,063 $0
10.5 44.4 $8,238,983 $934,920
11.5 44.1 $8,180,550 $876,488
13 48.2 $8,940,173 $1,636,110
15 55.1 $10,225,688 $2,921,625
17 63.0 $11,686,500 $4,382,438
19 75.3 $13,965,368 $6,661,305
T-AKE fuel cost for 50,000 NM (baseline annual operating profile) at different speeds.
Analysis assumes consistent speed at these points – not an average. $3.72/gallon.
N7
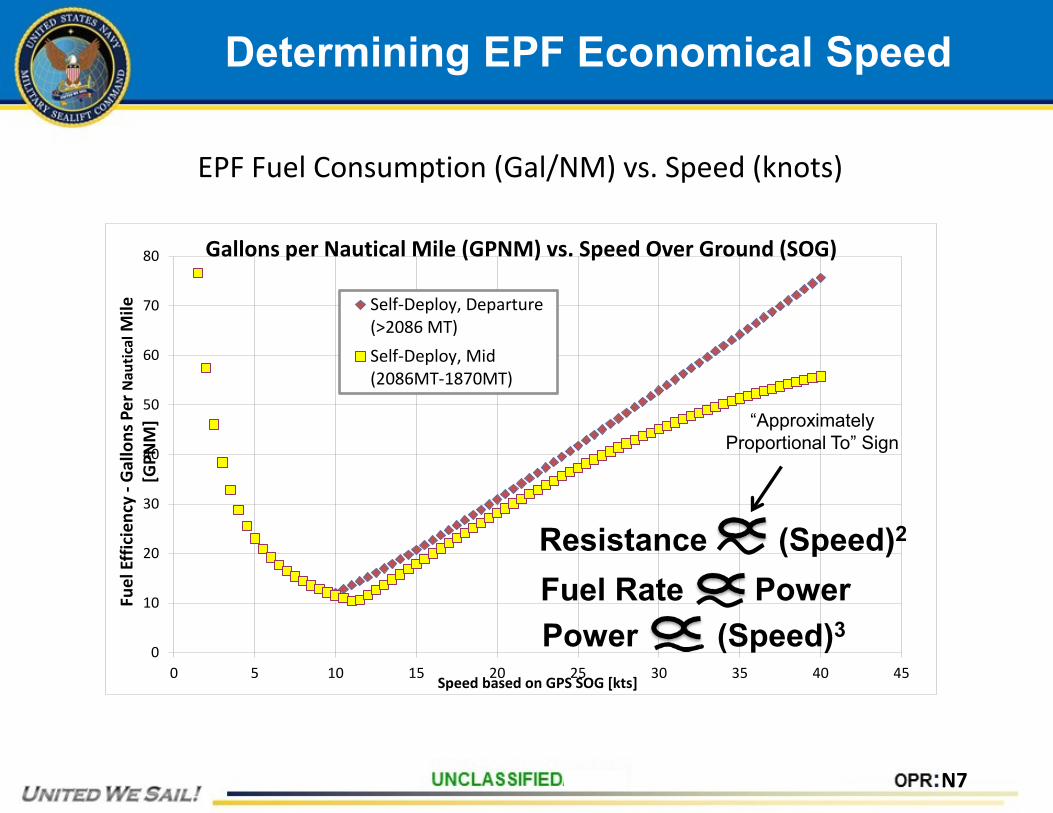
Determining EPF Economical Speed
0
10
20
30
40
50
60
70
80
0 5 10 15 20 25 30 35 40 45
Fuel
Eff
icie
ncy
-Gal
lons
Per
Nau
tical
Mile
[G
PNM
]
Speed based on GPS SOG [kts]
Gallons per Nautical Mile (GPNM) vs. Speed Over Ground (SOG)
Self-Deploy, Departure(>2086 MT)Self-Deploy, Mid(2086MT-1870MT)
Resistance (Speed)2
Fuel Rate PowerPower (Speed)3
“Approximately Proportional To” Sign
EPF Fuel Consumption (Gal/NM) vs. Speed (knots)
N7
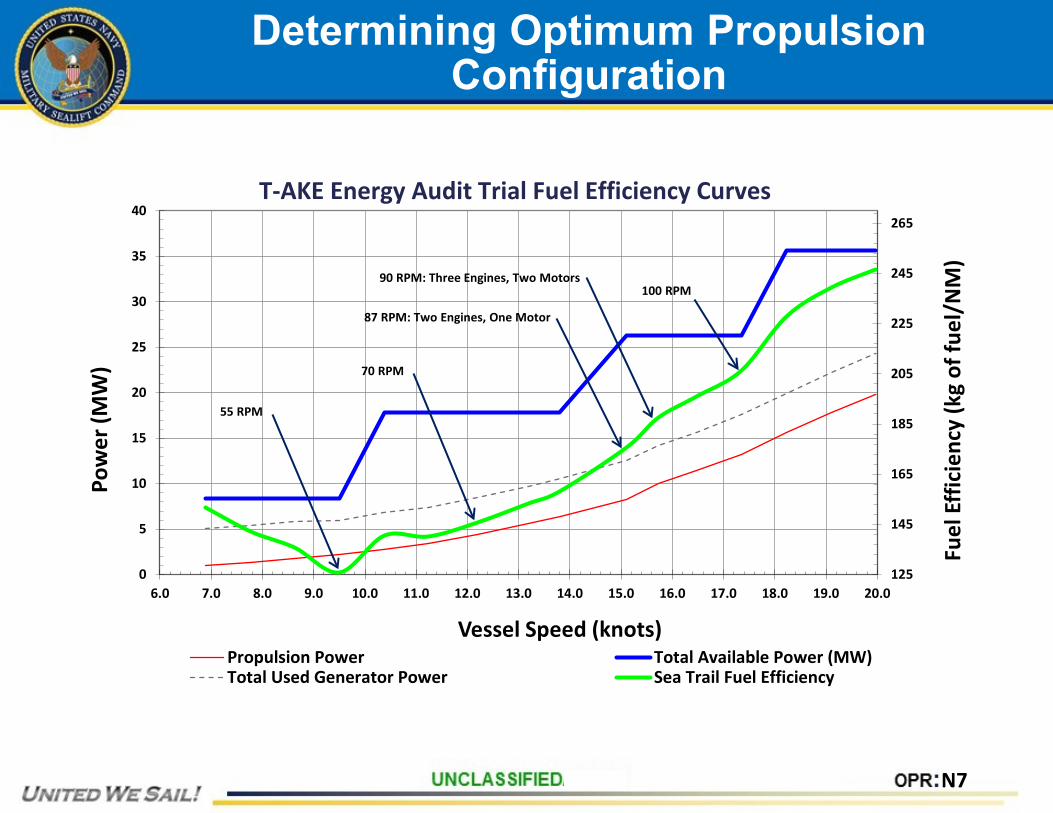
Determining Optimum Propulsion Configuration
125
145
165
185
205
225
245
265
0
5
10
15
20
25
30
35
40
6.0 7.0 8.0 9.0 10.0 11.0 12.0 13.0 14.0 15.0 16.0 17.0 18.0 19.0 20.0
Fuel
Effi
cien
cy (k
g of
fuel
/NM
)
Pow
er (M
W)
Vessel Speed (knots)Propulsion Power Total Available Power (MW)Total Used Generator Power Sea Trail Fuel Efficiency
55 RPM
87 RPM: Two Engines, One Motor
90 RPM: Three Engines, Two Motors100 RPM
70 RPM
T-AKE Energy Audit Trial Fuel Efficiency Curves
N7
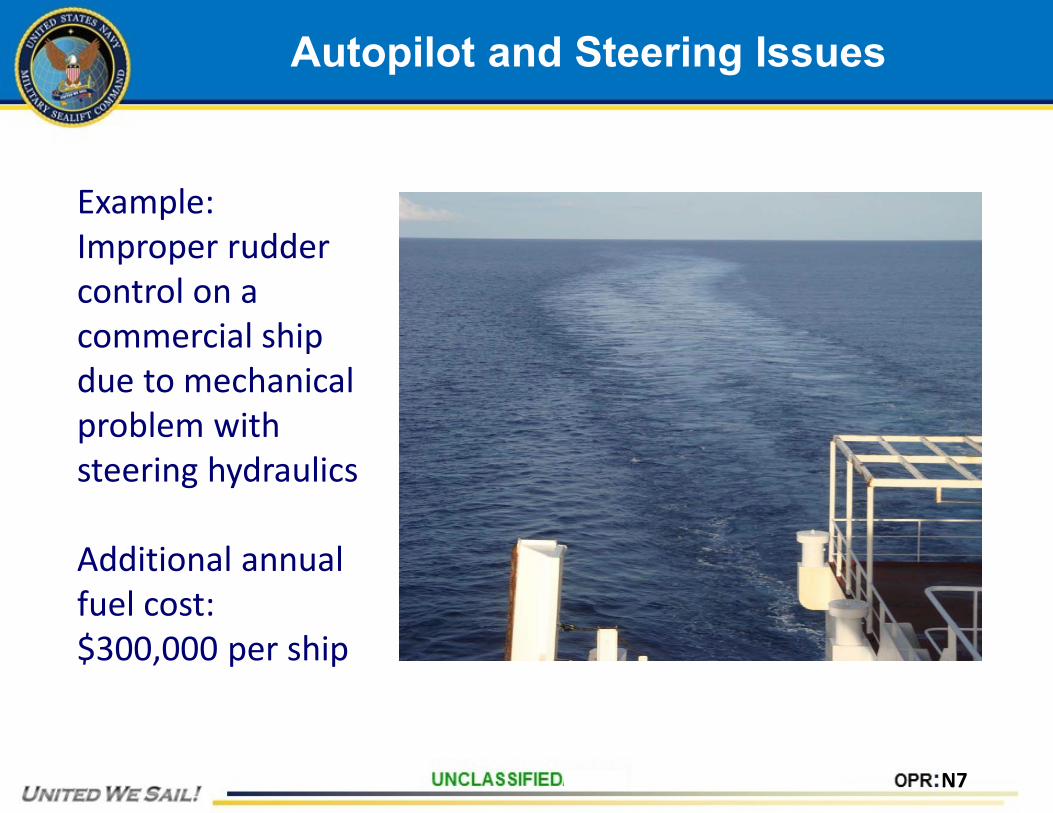
Autopilot and Steering Issues
Example:Improper rudder control on a commercial ship due to mechanical problem with steering hydraulics
Additional annual fuel cost: $300,000 per ship

N7
Vessel Trim: T-AKE Study
T-AKE propulsion consumes 24,000,000 kWh = $6,000,000 in fuel per ship
If trim can be optimized to save 2%: Theoretical savings = $120,000 per ship
Source: T-AKE CEPEx Trial Report, NSWC Carderock Division
Trim Optimization software module implementation ongoing for T-AKE class.
N7
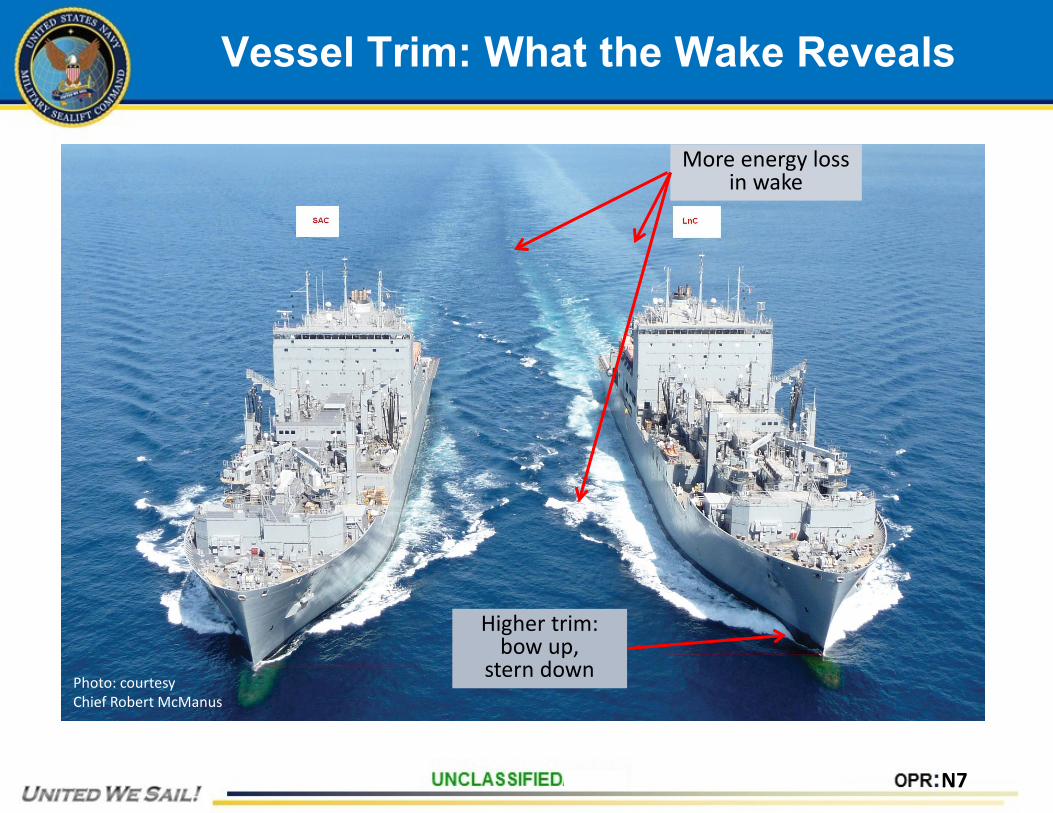
Vessel Trim: What the Wake Reveals
More energy loss in wake
Higher trim: bow up,
stern downPhoto: courtesyChief Robert McManus
N7
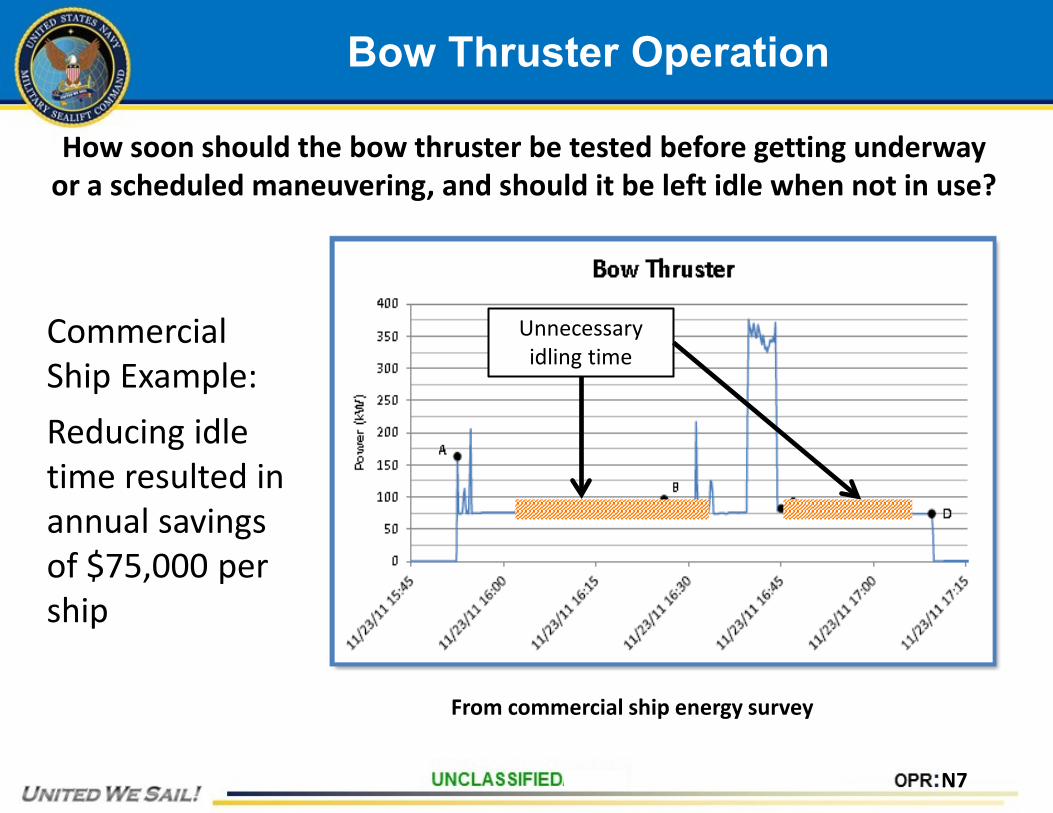
Bow Thruster Operation
Unnecessary idling time
From commercial ship energy survey
Commercial Ship Example:Reducing idle time resulted in annual savingsof $75,000 per ship
How soon should the bow thruster be tested before getting underway or a scheduled maneuvering, and should it be left idle when not in use?
N7
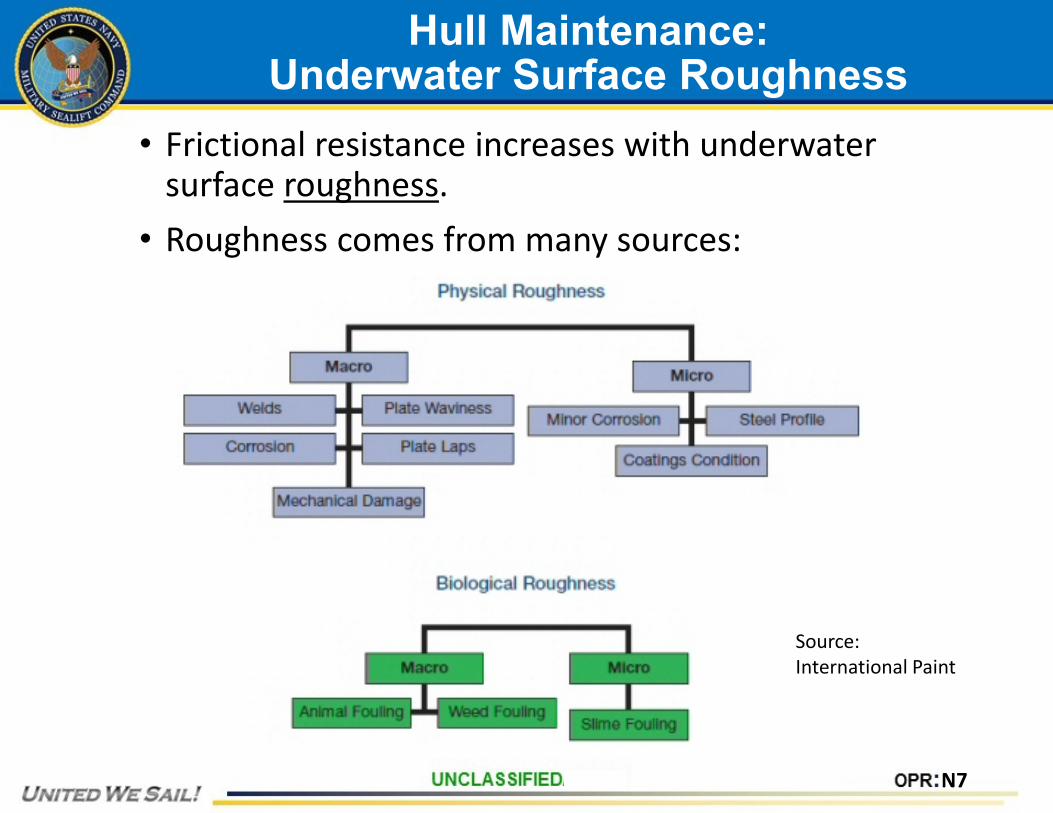
Hull Maintenance:Underwater Surface Roughness
Source:International Paint
• Frictional resistance increases with underwater surface roughness.
• Roughness comes from many sources:
N7
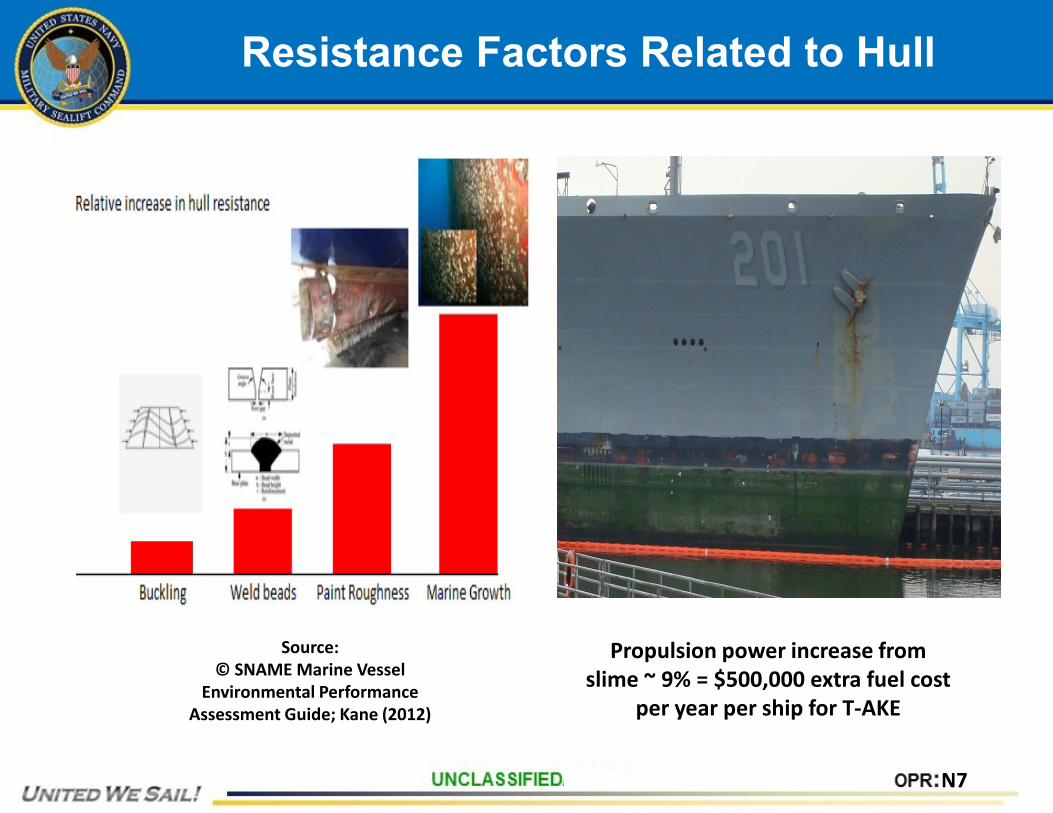
Resistance Factors Related to Hull
Propulsion power increase from slime ~ 9% = $500,000 extra fuel cost
per year per ship for T-AKE
Source:© SNAME Marine Vessel
Environmental PerformanceAssessment Guide; Kane (2012)
N7
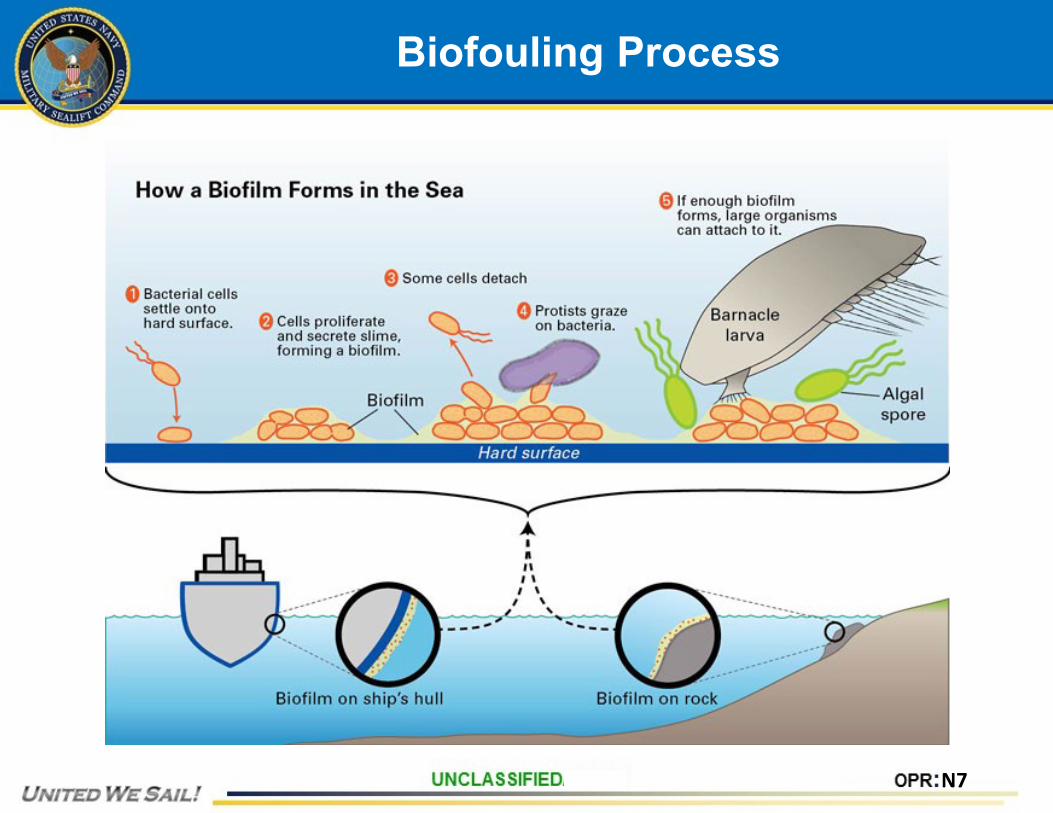
BioFouling
• Microfouling is the attachment of waterborne bacteria to the underwater surface.
• These bacteria form “slime”, which causes a relatively small drag penalty and is relatively easy to remove by scrubbing. (But still can add 5-10% fuel penalty.)
• The slime bacteria also provide a platform for other bio-colonizers to attach to. This eventually leads to growth of macro algae, invertebrates, and calcareous organisms.
• The macro-fouling causes a significantly greater drag penalty and takes much more effort to remove.
N7
Biofouling Process
N7
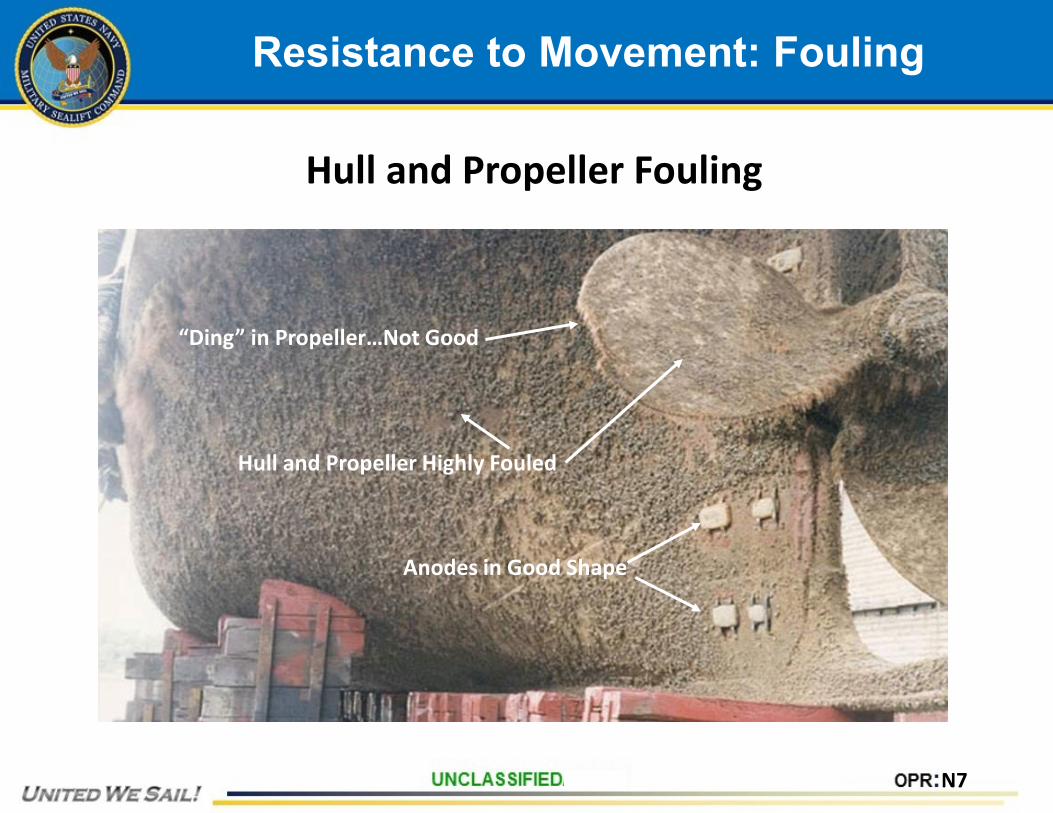
Resistance to Movement: Fouling
Hull and Propeller Fouling
Anodes in Good Shape
Hull and Propeller Highly Fouled
“Ding” in Propeller…Not Good

N7
Resistance Related to Age
Underlying hull roughness increases with ship age due to spot paint repairs, corrosion - increases
frictional resistance
Source:Propulsion Dynamics Inc.
Note: MSC-Navy team is working on updated guidance
N7
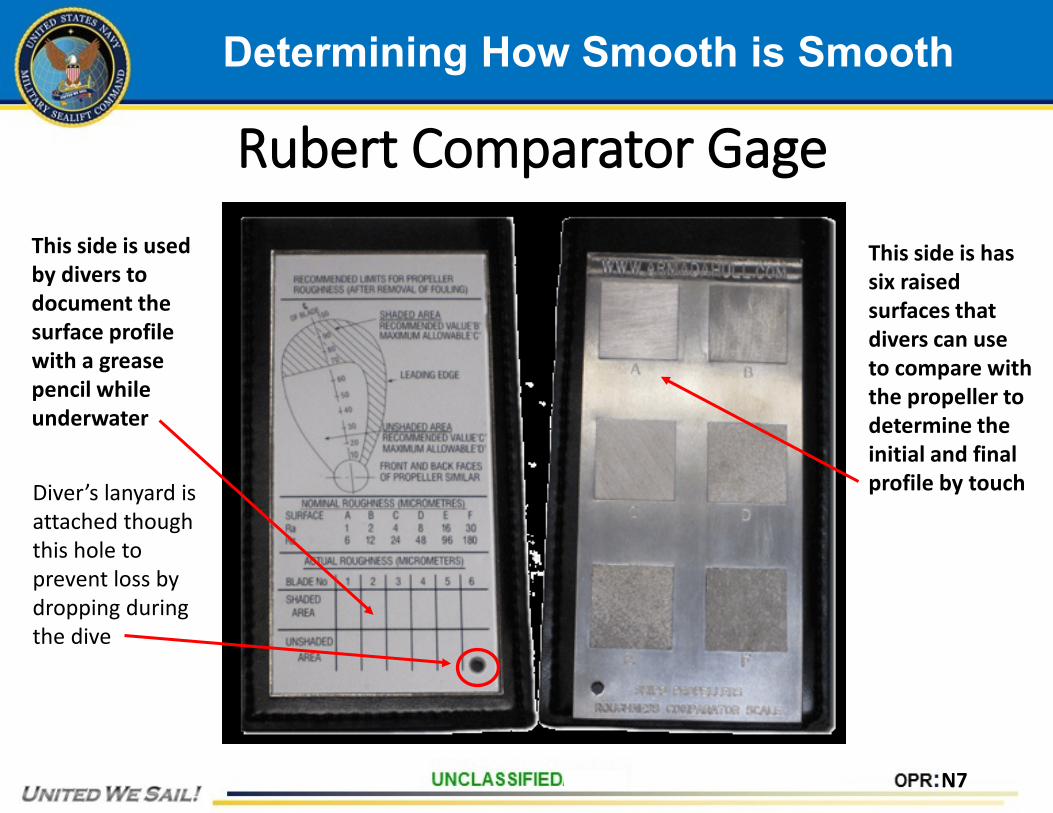
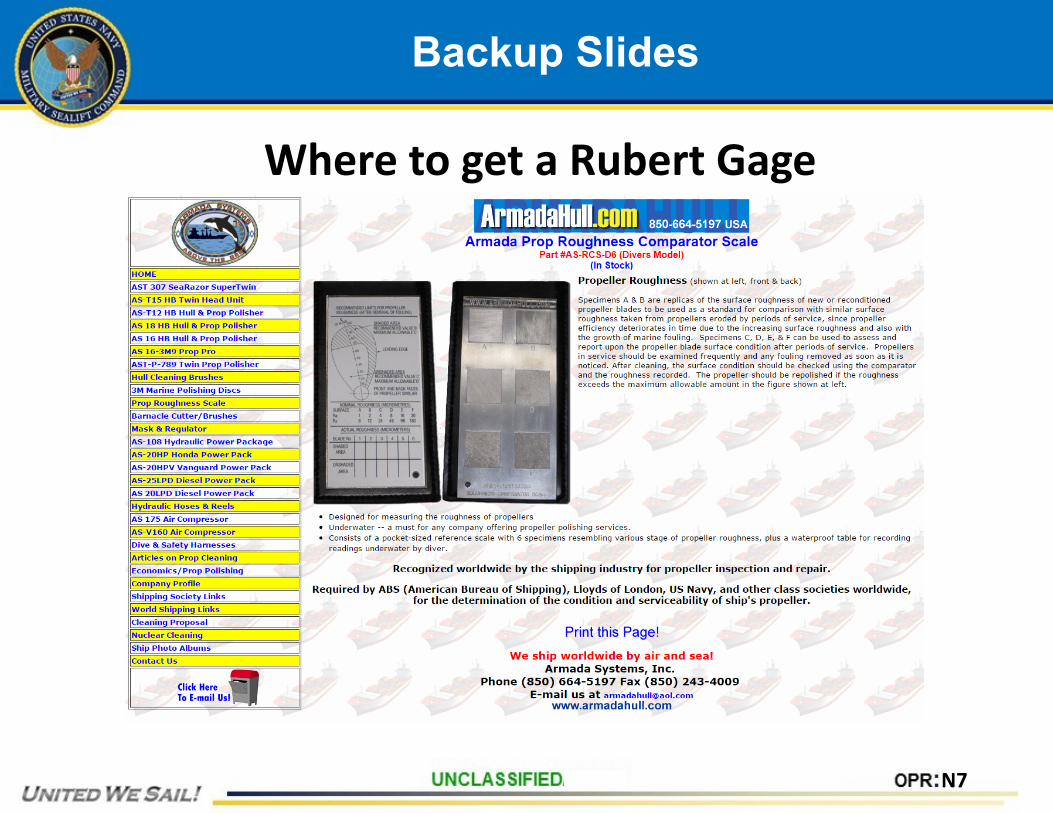
Determining How Smooth is Smooth
Rubert Comparator GageThis side is used by divers to document the surface profile with a grease pencil while underwater
This side is has six raised surfaces that divers can use to compare with the propeller to determine the initial and final profile by touchDiver’s lanyard is
attached though this hole to prevent loss by dropping during the dive

N7
Any Questions So Far?
Any questions before we move on to Auxiliary Systems?
N7
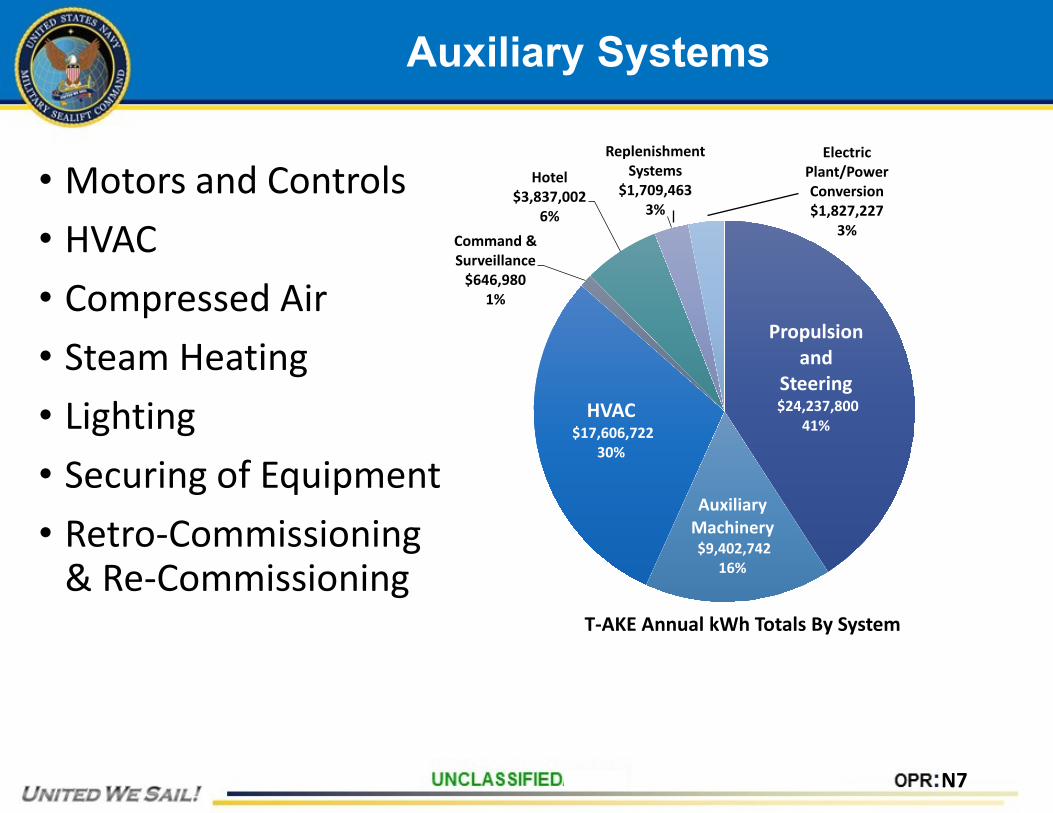
Auxiliary Systems
Propulsion and
Steering$24,237,800
41%
Auxiliary Machinery$9,402,742
16%
HVAC$17,606,722
30%
Command & Surveillance
$646,9801%
Hotel$3,837,002
6%
Replenishment Systems
$1,709,4633%
Electric Plant/Power Conversion$1,827,227
3%
T-AKE Annual kWh Totals By System
• Motors and Controls• HVAC• Compressed Air• Steam Heating• Lighting• Securing of Equipment• Retro-Commissioning
& Re-Commissioning
N7
Motor Efficiency
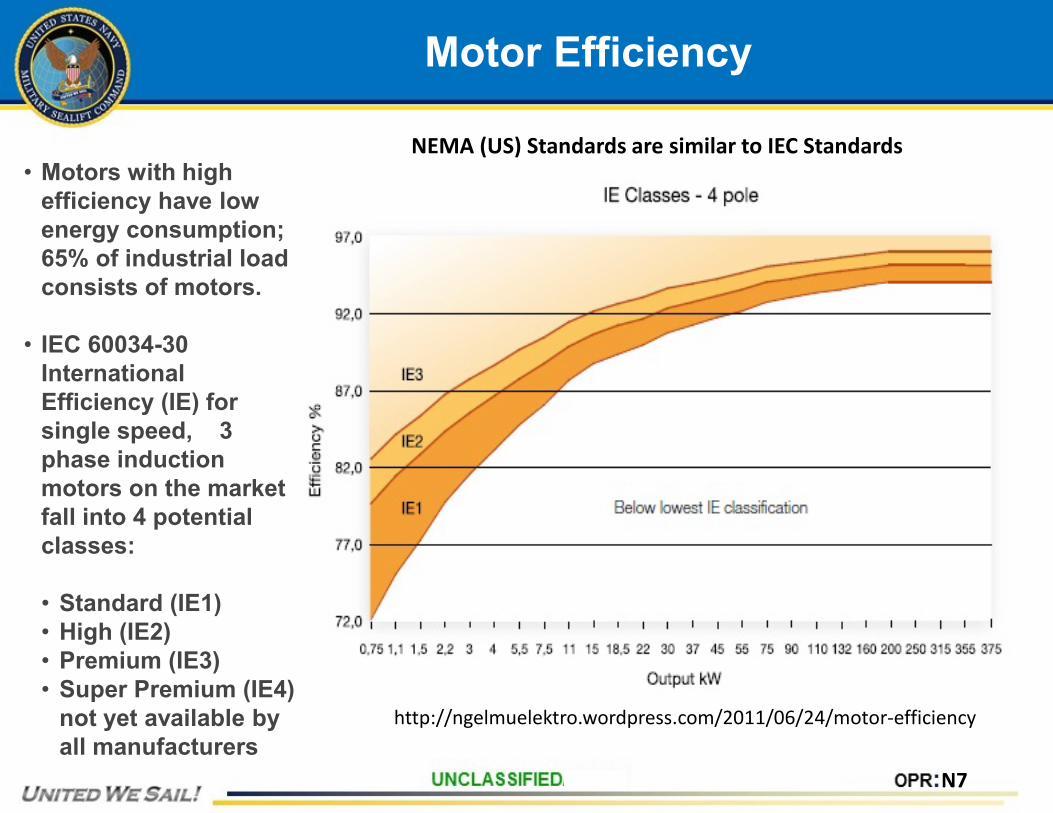
• Motors with high efficiency have low energy consumption; 65% of industrial load consists of motors.
• IEC 60034-30 International Efficiency (IE) for single speed, 3 phase induction motors on the market fall into 4 potential classes:
• Standard (IE1)• High (IE2)• Premium (IE3)• Super Premium (IE4)
not yet available by all manufacturers
http://ngelmuelektro.wordpress.com/2011/06/24/motor-efficiency
NEMA (US) Standards are similar to IEC Standards
N7
Motor Upgrade vs Rewinding
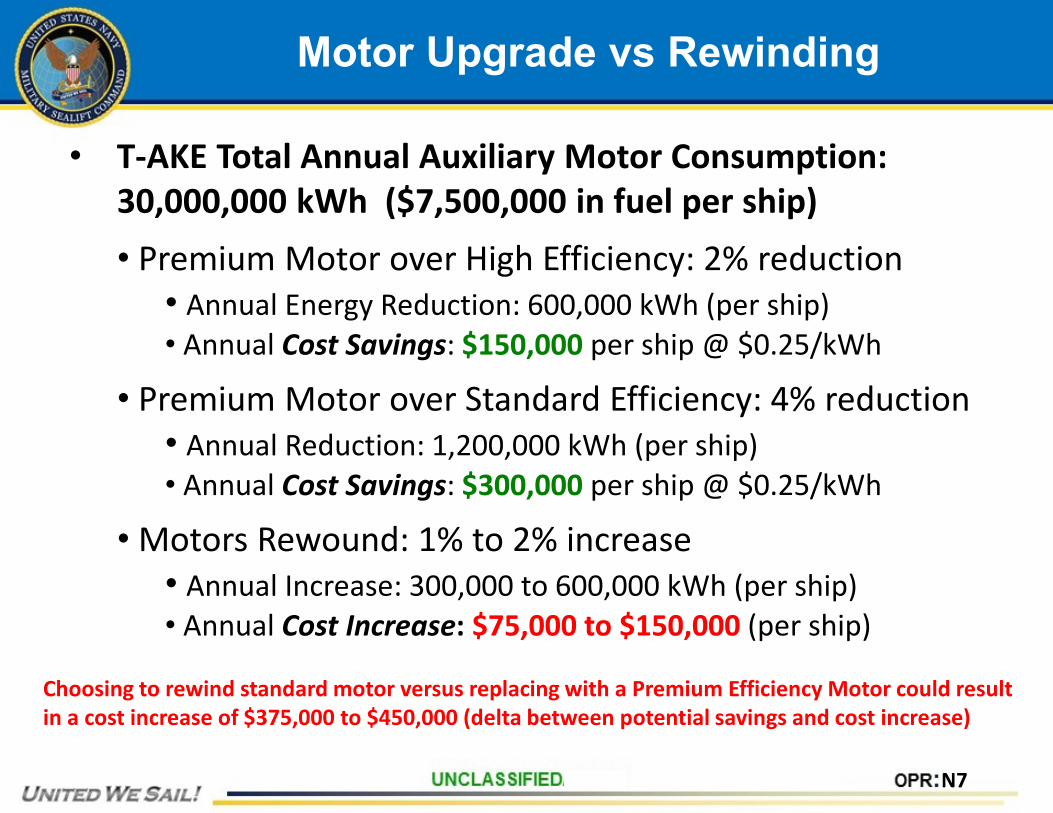
• T-AKE Total Annual Auxiliary Motor Consumption: 30,000,000 kWh ($7,500,000 in fuel per ship)• Premium Motor over High Efficiency: 2% reduction
• Annual Energy Reduction: 600,000 kWh (per ship)• Annual Cost Savings: $150,000 per ship @ $0.25/kWh
• Premium Motor over Standard Efficiency: 4% reduction• Annual Reduction: 1,200,000 kWh (per ship)• Annual Cost Savings: $300,000 per ship @ $0.25/kWh
• Motors Rewound: 1% to 2% increase• Annual Increase: 300,000 to 600,000 kWh (per ship)• Annual Cost Increase: $75,000 to $150,000 (per ship)
Choosing to rewind standard motor versus replacing with a Premium Efficiency Motor could result in a cost increase of $375,000 to $450,000 (delta between potential savings and cost increase)

N7
Motor Life Cycle Cost Breakdown
96%-98% of a motor’s life cycle cost is energy to operate (~64% of US electrical energy use)
97.3%
0.7% 2.0%Motor Life Cycle Cost
EnergyCostOneRewindInitialPurchase
Although the replacement cost is approximately three times the cost of a rewind (2.0% to 0.7%), the potential savings due to the increase in motor efficiency is significant, since 97.3% of the motor’s life cycle cost is associated with the electrical cost of operation
N7
Other Motor Related Costs: Speed
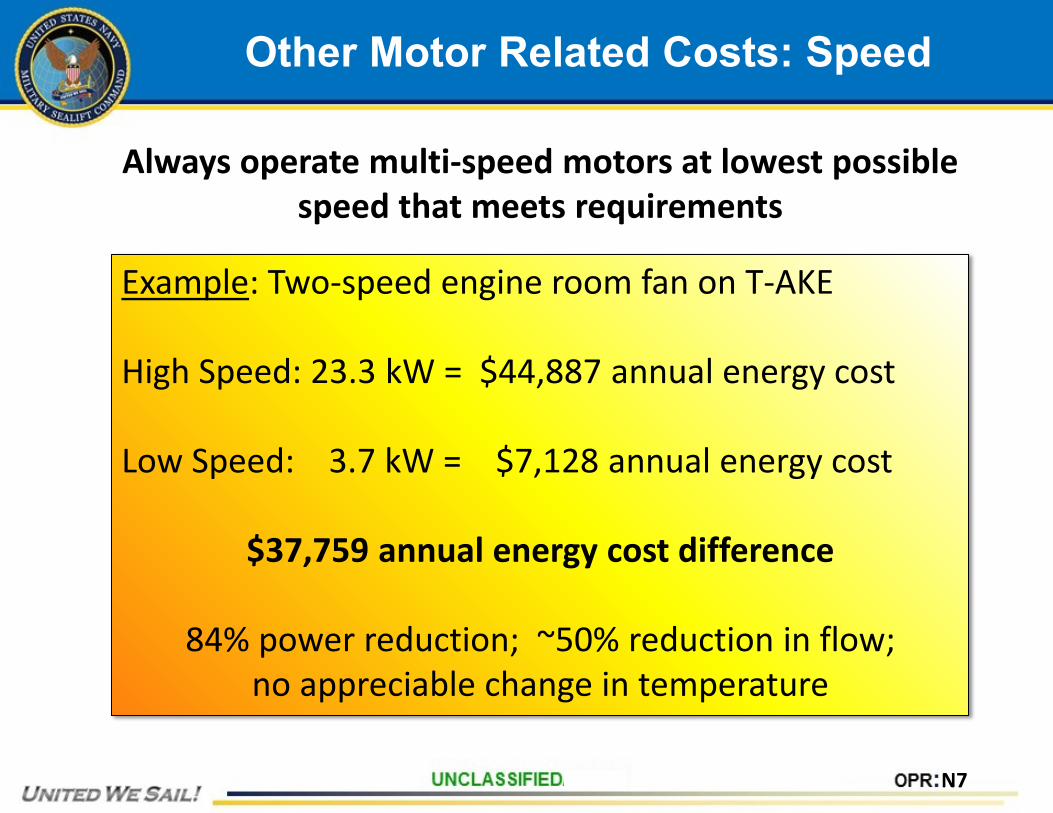
Always operate multi-speed motors at lowest possible speed that meets requirements
Example: Two-speed engine room fan on T-AKE
High Speed: 23.3 kW = $44,887 annual energy cost
Low Speed: 3.7 kW = $7,128 annual energy cost
$37,759 annual energy cost difference
84% power reduction; ~50% reduction in flow;no appreciable change in temperature
N7
Other Motor Related Costs: Drive Belts
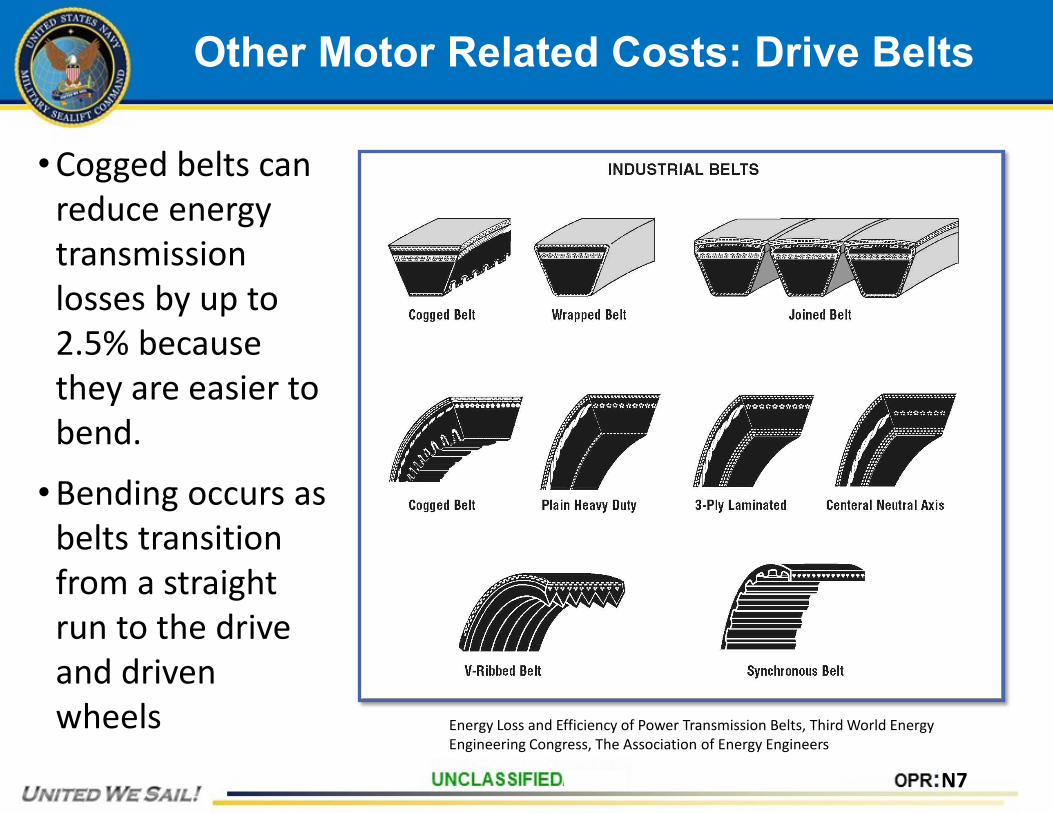
• Cogged belts can reduce energy transmission losses by up to 2.5% because they are easier to bend.
• Bending occurs as belts transition from a straight run to the drive and driven wheels Energy Loss and Efficiency of Power Transmission Belts, Third World Energy
Engineering Congress, The Association of Energy Engineers
N7
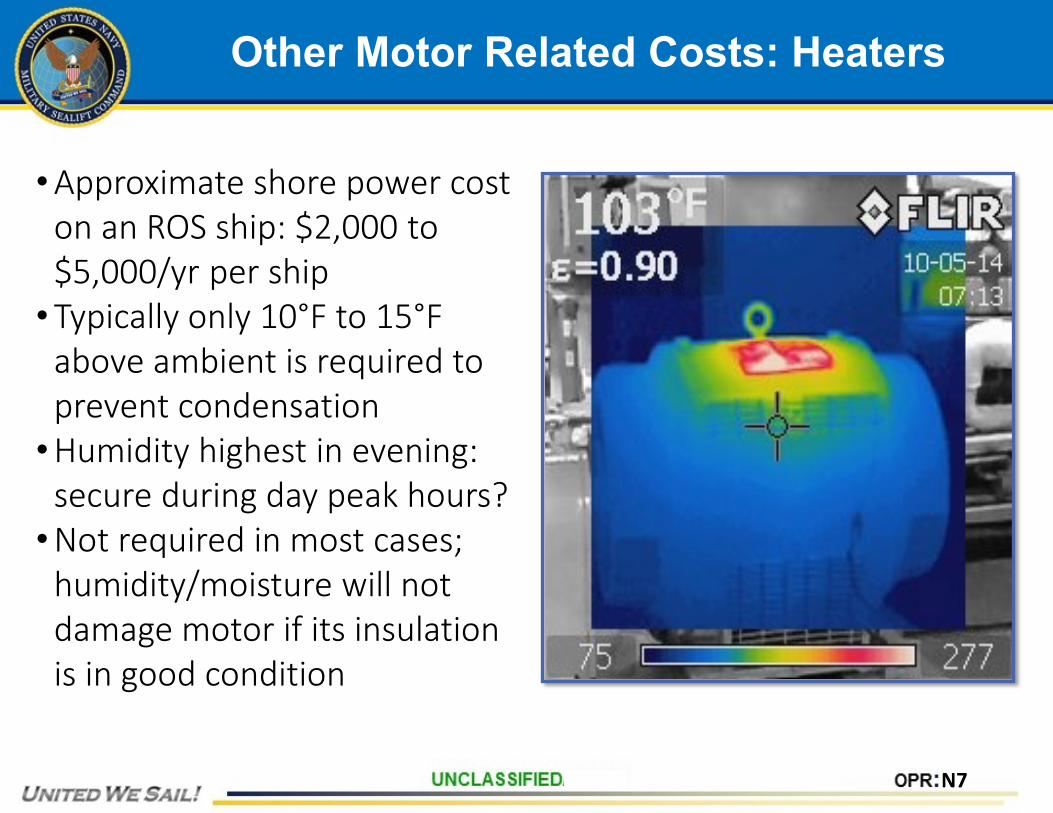
Other Motor Related Costs: Heaters
• Approximate shore power cost on an ROS ship: $2,000 to $5,000/yr per ship
• Typically only 10°F to 15°F above ambient is required to prevent condensation
• Humidity highest in evening: secure during day peak hours?
• Not required in most cases; humidity/moisture will not damage motor if its insulation is in good condition
N7
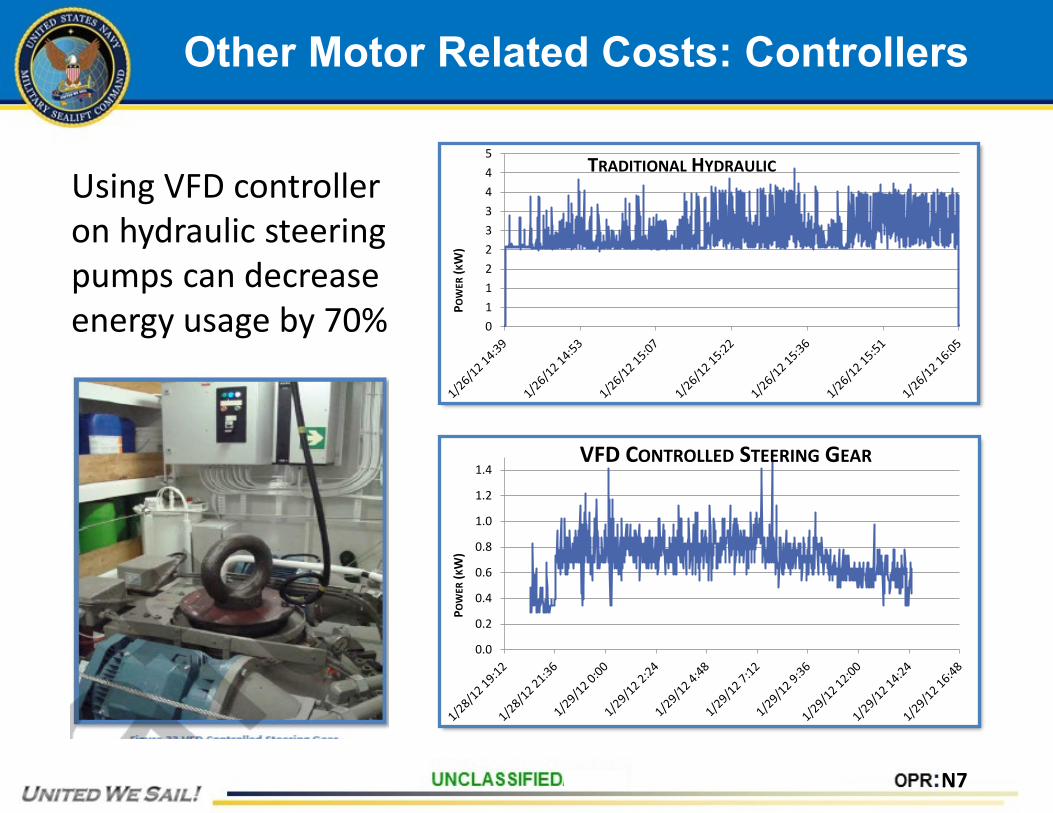
Other Motor Related Costs: Controllers
Using VFD controller on hydraulic steering pumps can decrease energy usage by 70% 0
112233445
POW
ER(K
W)
TRADITIONAL HYDRAULIC
0.0
0.2
0.4
0.6
0.8
1.0
1.2
1.4PO
WER
(KW
)VFD CONTROLLED STEERING GEAR
N7
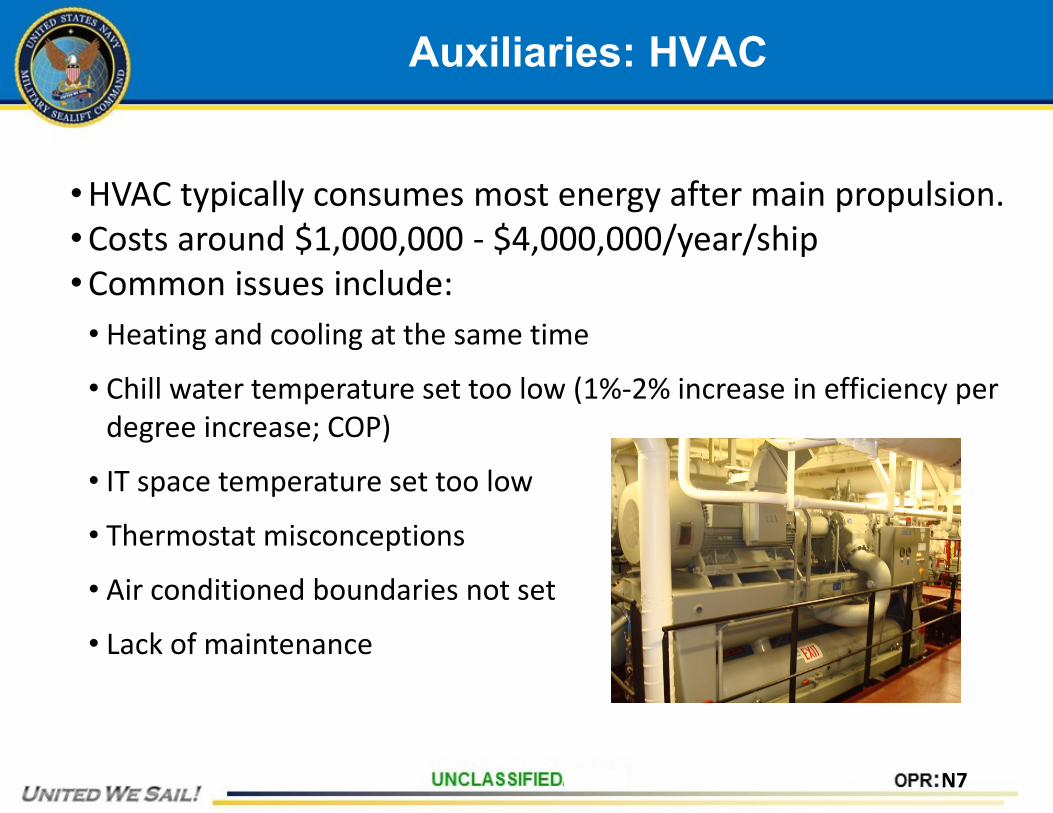
Auxiliaries: HVAC
• HVAC typically consumes most energy after main propulsion.• Costs around $1,000,000 - $4,000,000/year/ship• Common issues include:
• Heating and cooling at the same time
• Chill water temperature set too low (1%-2% increase in efficiency per degree increase; COP)
• IT space temperature set too low
• Thermostat misconceptions
• Air conditioned boundaries not set
• Lack of maintenance
N7
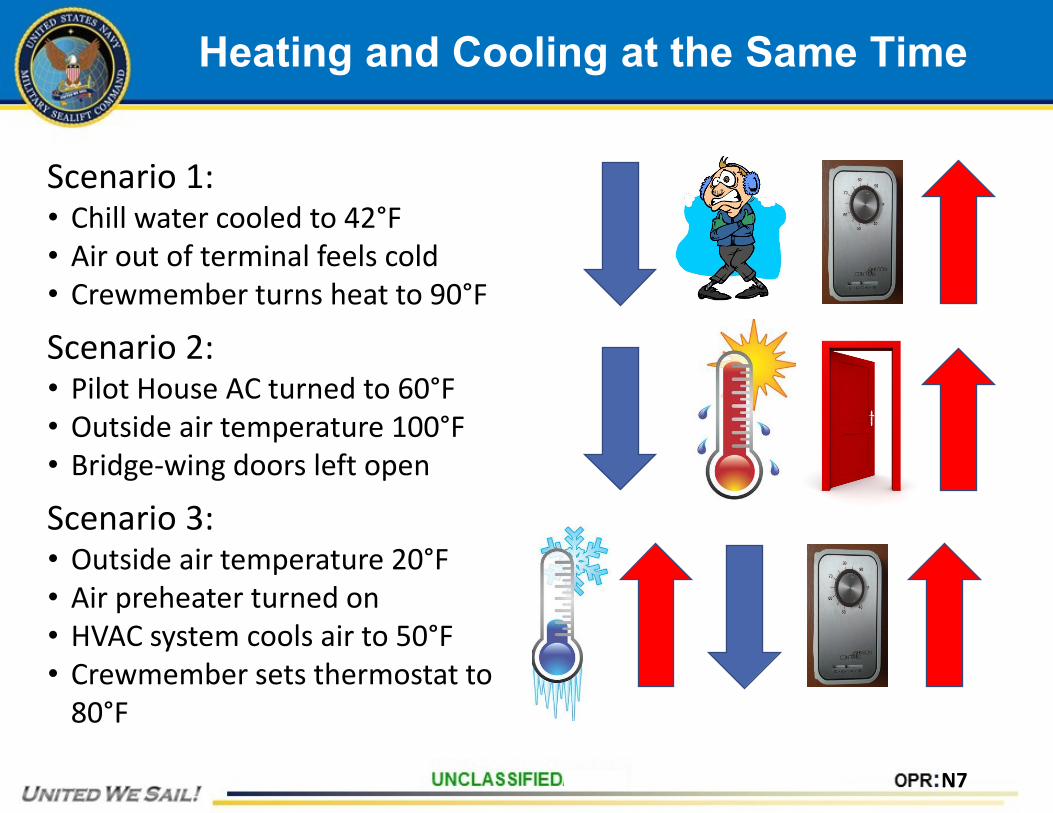
Heating and Cooling at the Same Time
Scenario 1: • Chill water cooled to 42°F• Air out of terminal feels cold• Crewmember turns heat to 90°F
Scenario 2: • Pilot House AC turned to 60°F• Outside air temperature 100°F• Bridge-wing doors left open
Scenario 3: • Outside air temperature 20°F• Air preheater turned on• HVAC system cools air to 50°F• Crewmember sets thermostat to
80°F
N7
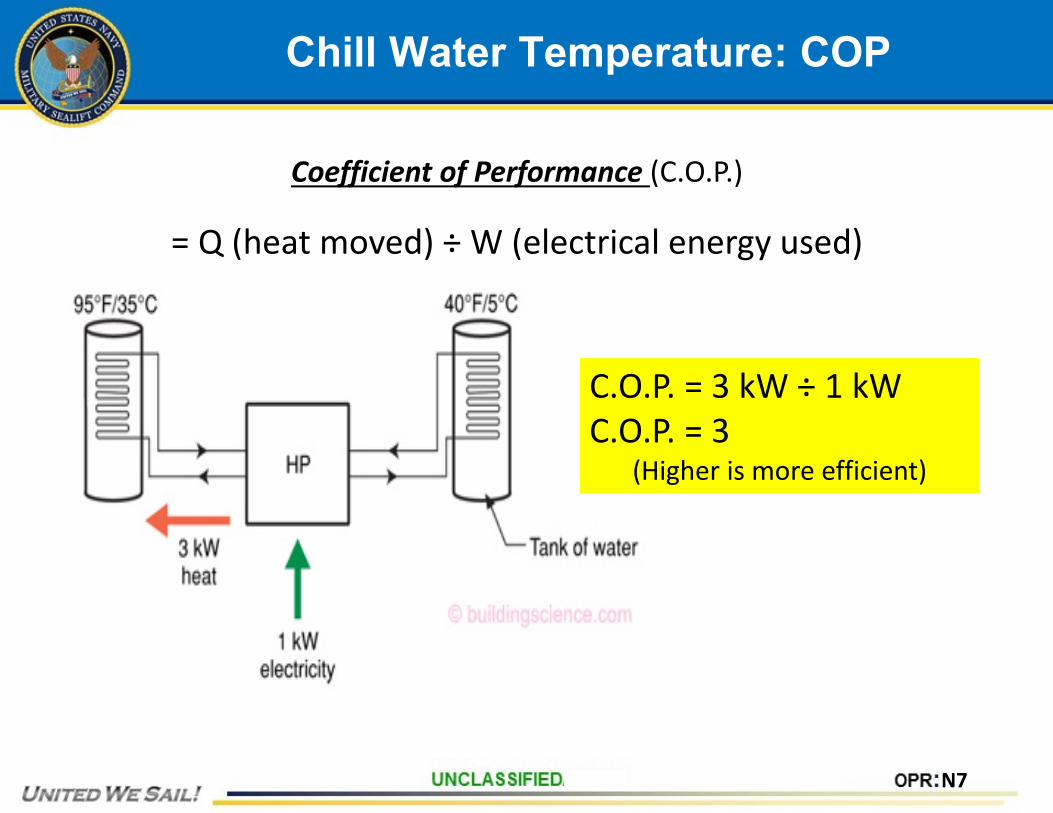
Chill Water Temperature: COP
Coefficient of Performance (C.O.P.)
= Q (heat moved) ÷ W (electrical energy used)
C.O.P. = 3 kW ÷ 1 kWC.O.P. = 3
(Higher is more efficient)
N7
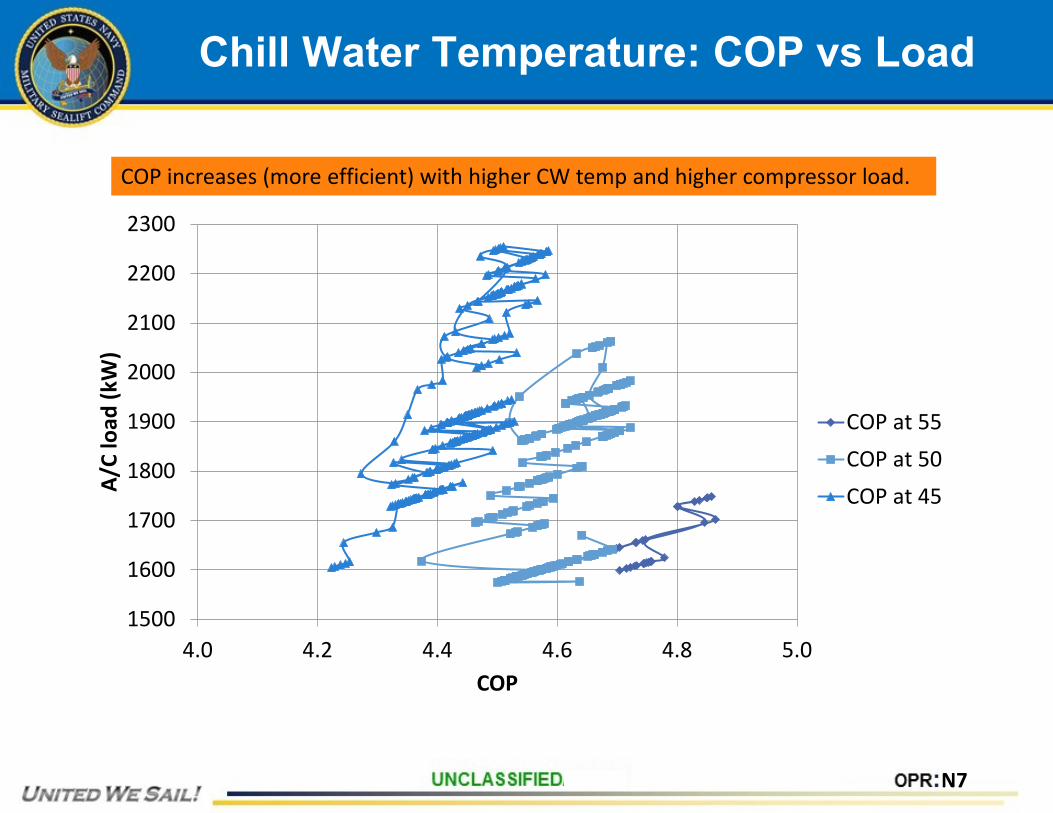
Chill Water Temperature: COP vs Load
1500
1600
1700
1800
1900
2000
2100
2200
2300
4.0 4.2 4.4 4.6 4.8 5.0
A/C
load
(kW
)
COP
COP at 55COP at 50COP at 45
COP increases (more efficient) with higher CW temp and higher compressor load.
N7
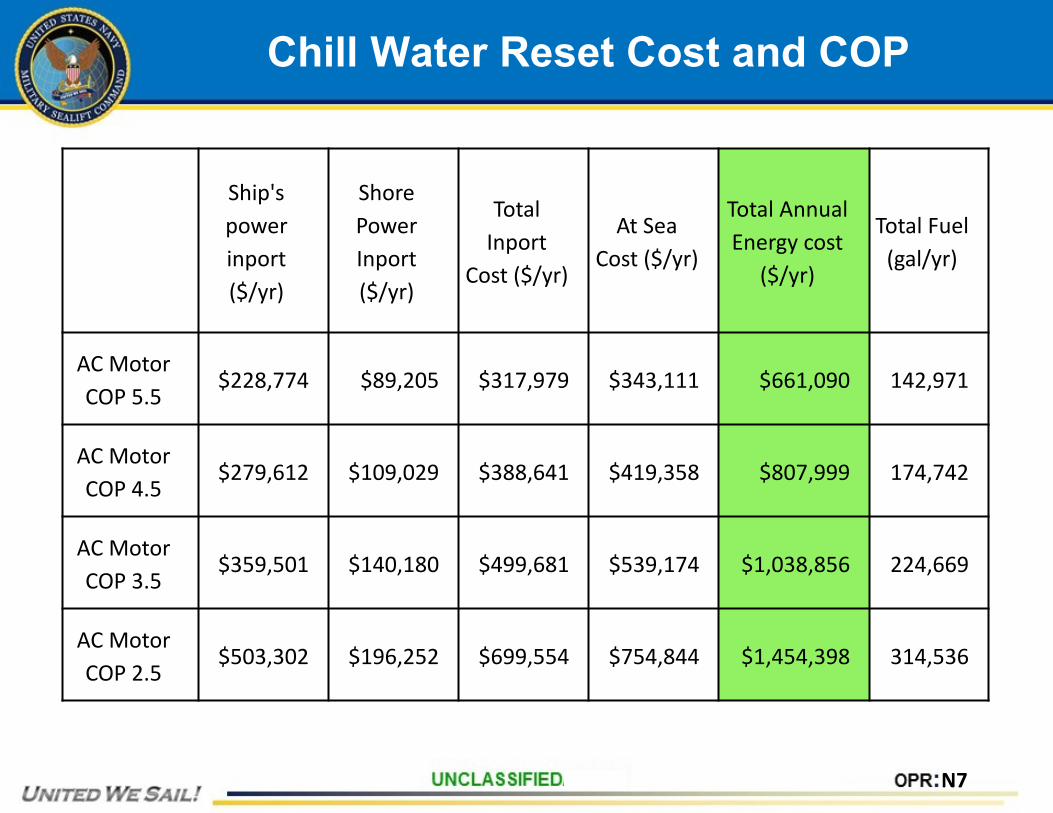
Chill Water Reset Cost and COP
Ship's power inport ($/yr)
Shore Power Inport ($/yr)
Total Inport
Cost ($/yr)
At Sea Cost ($/yr)
Total Annual Energy cost
($/yr)
Total Fuel (gal/yr)
AC Motor COP 5.5
$228,774 $89,205 $317,979 $343,111 $661,090 142,971
AC Motor COP 4.5
$279,612 $109,029 $388,641 $419,358 $807,999 174,742
AC Motor COP 3.5
$359,501 $140,180 $499,681 $539,174 $1,038,856 224,669
AC Motor COP 2.5
$503,302 $196,252 $699,554 $754,844 $1,454,398 314,536
N7
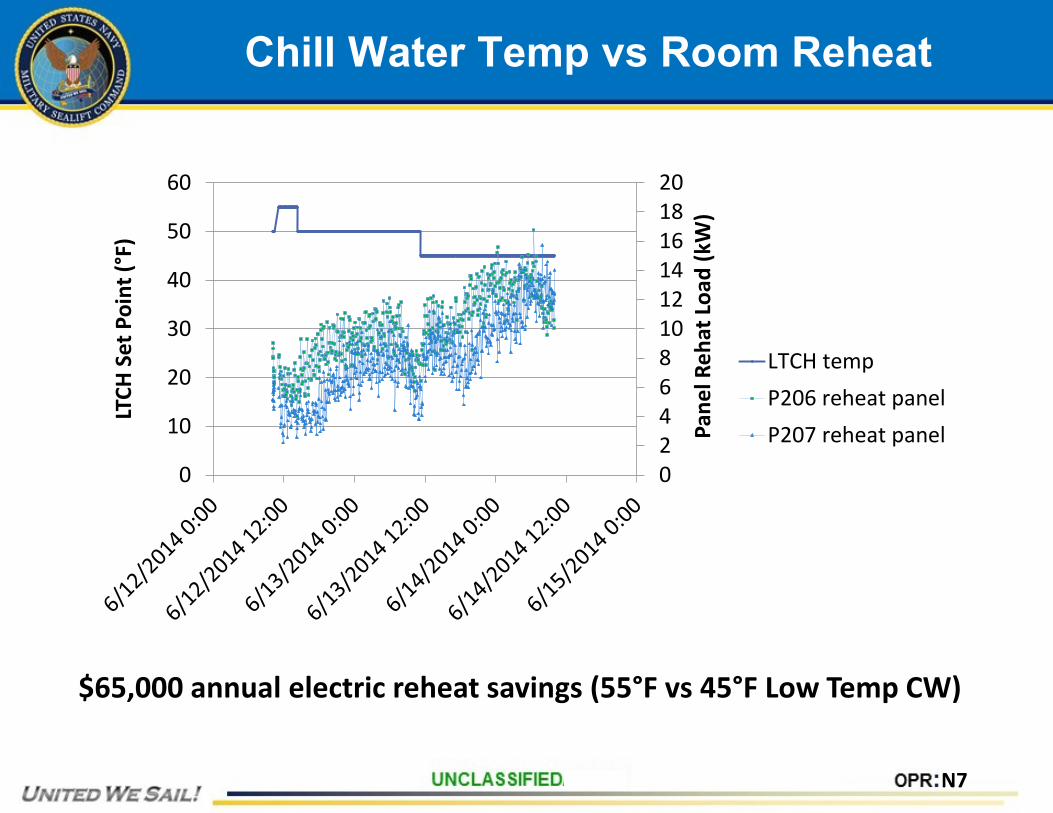
Chill Water Temp vs Room Reheat
02468101214161820
0
10
20
30
40
50
60
Pane
l Reh
at L
oad
(kW
)
LTCH
Set
Poi
nt (°
F)
LTCH tempP206 reheat panelP207 reheat panel
$65,000 annual electric reheat savings (55°F vs 45°F Low Temp CW)
N7
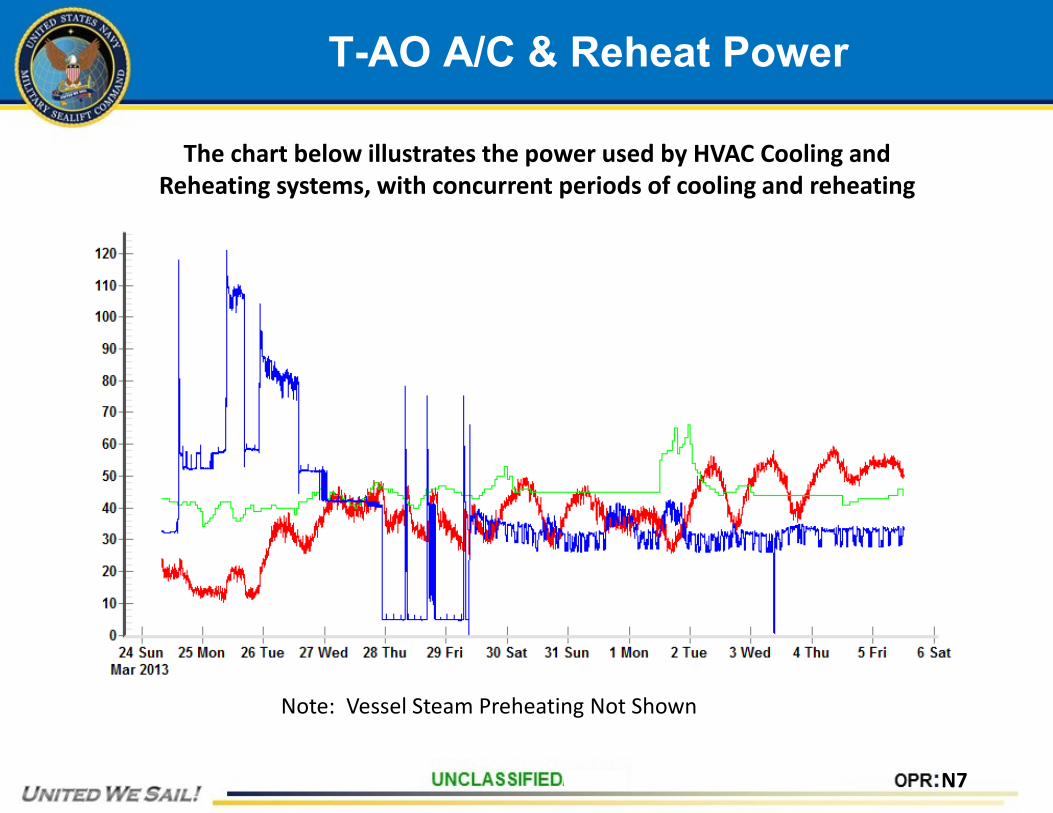
T-AO A/C & Reheat Power
Note: Vessel Steam Preheating Not Shown
The chart below illustrates the power used by HVAC Cooling and Reheating systems, with concurrent periods of cooling and reheating
N7
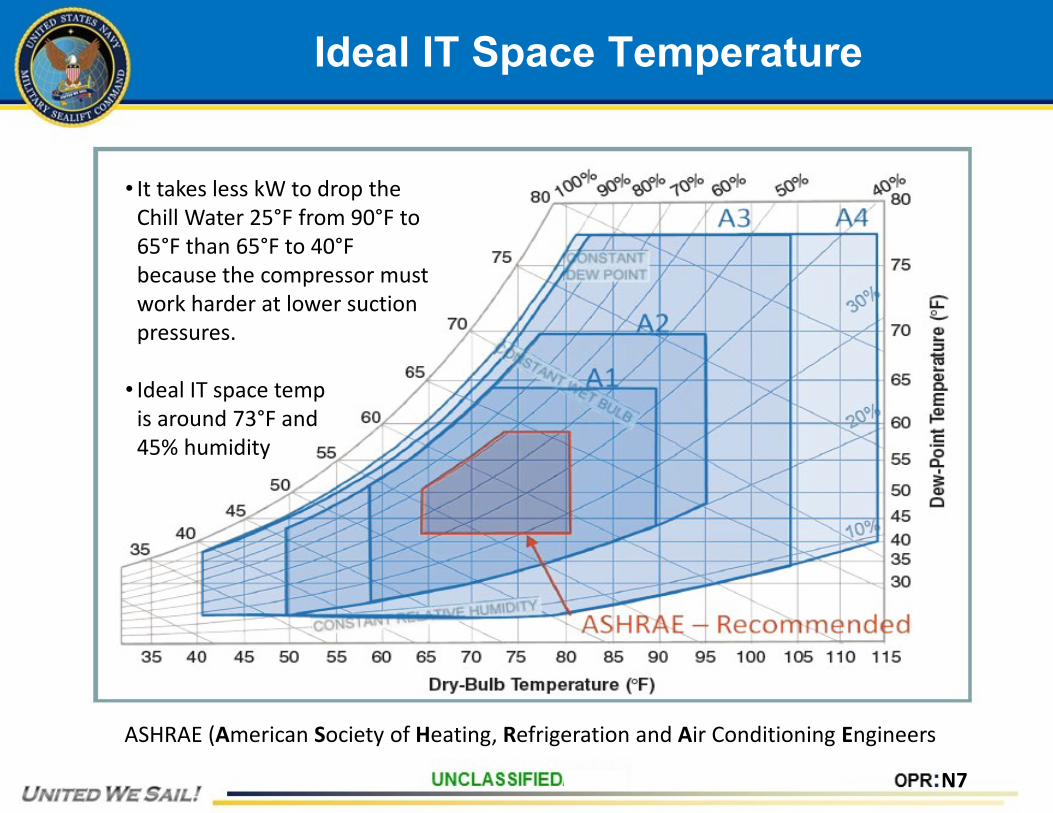
Ideal IT Space Temperature
• It takes less kW to drop the Chill Water 25°F from 90°F to 65°F than 65°F to 40°F because the compressor must work harder at lower suction pressures.
• Ideal IT space temp is around 73°F and 45% humidity
ASHRAE (American Society of Heating, Refrigeration and Air Conditioning Engineers
N7
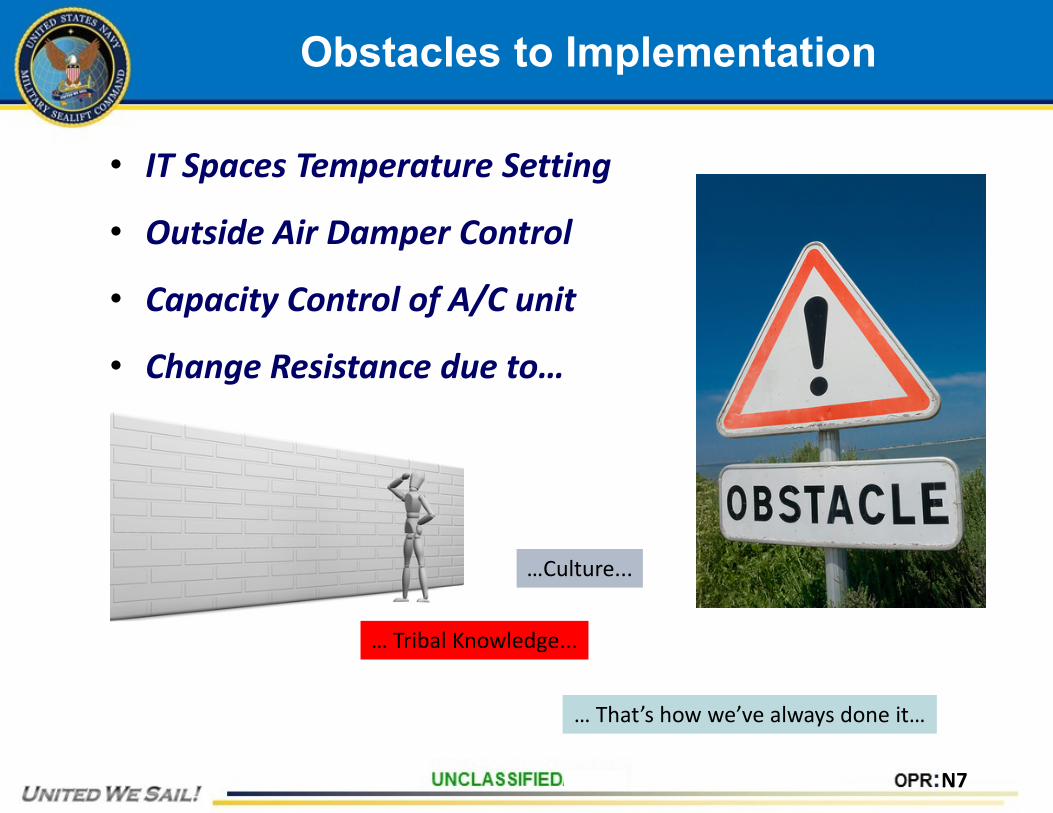
Obstacles to Implementation
• IT Spaces Temperature Setting
• Outside Air Damper Control
• Capacity Control of A/C unit
• Change Resistance due to…
…Culture...
… That’s how we’ve always done it…
… Tribal Knowledge...
N7
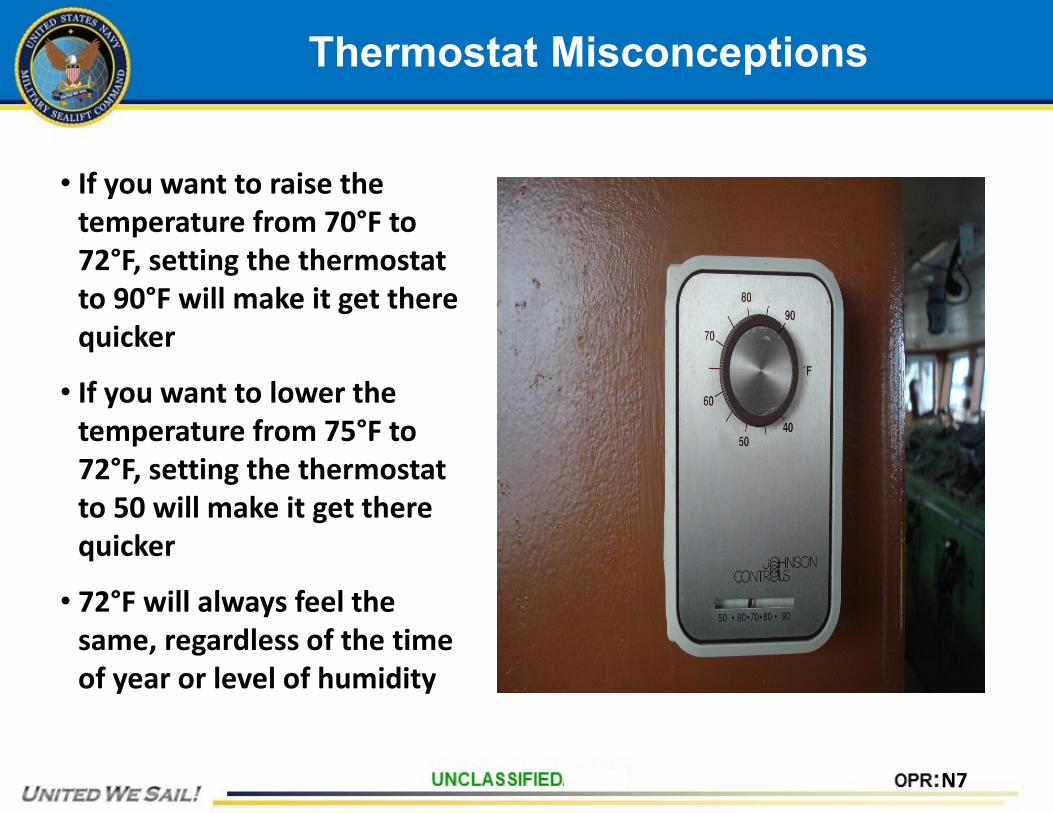
Thermostat Misconceptions
• If you want to raise the temperature from 70°F to 72°F, setting the thermostat to 90°F will make it get there quicker
• If you want to lower the temperature from 75°F to 72°F, setting the thermostat to 50 will make it get there quicker
• 72°F will always feel the same, regardless of the time of year or level of humidity

N7
HVAC: Air Conditioned Boundaries
• Air Conditioned boundaries include:• HVAC Zones• Interior spaces and doorways• Exterior doorways and vestibules• Refrigerated spaces• Cargo boxes and holds• Refrigerated cargo vans
N7
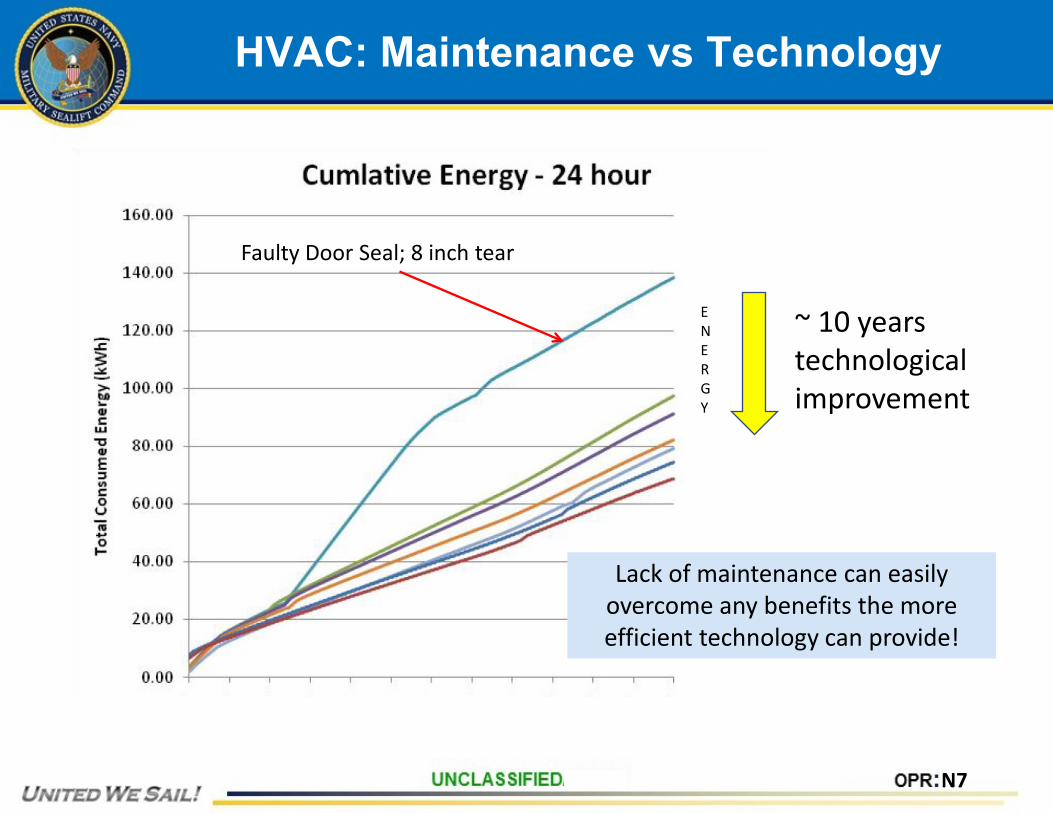
HVAC: Maintenance vs Technology
~ 10 years technological improvement
Lack of maintenance can easily overcome any benefits the more efficient technology can provide!
ENERGY
Faulty Door Seal; 8 inch tear

N7
Part 1 Outline
Questions?
N7
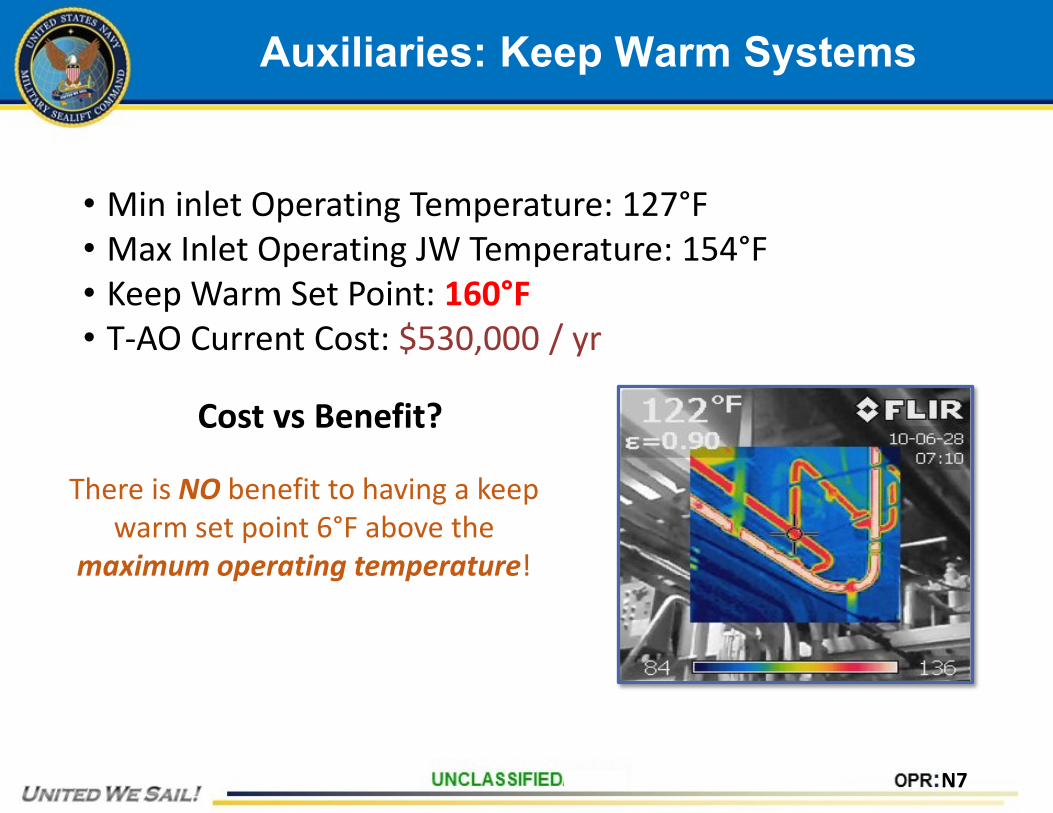
Auxiliaries: Keep Warm Systems
• Min inlet Operating Temperature: 127°F• Max Inlet Operating JW Temperature: 154°F• Keep Warm Set Point: 160°F• T-AO Current Cost: $530,000 / yr
There is NO benefit to having a keep warm set point 6°F above the
maximum operating temperature!
Cost vs Benefit?
N7
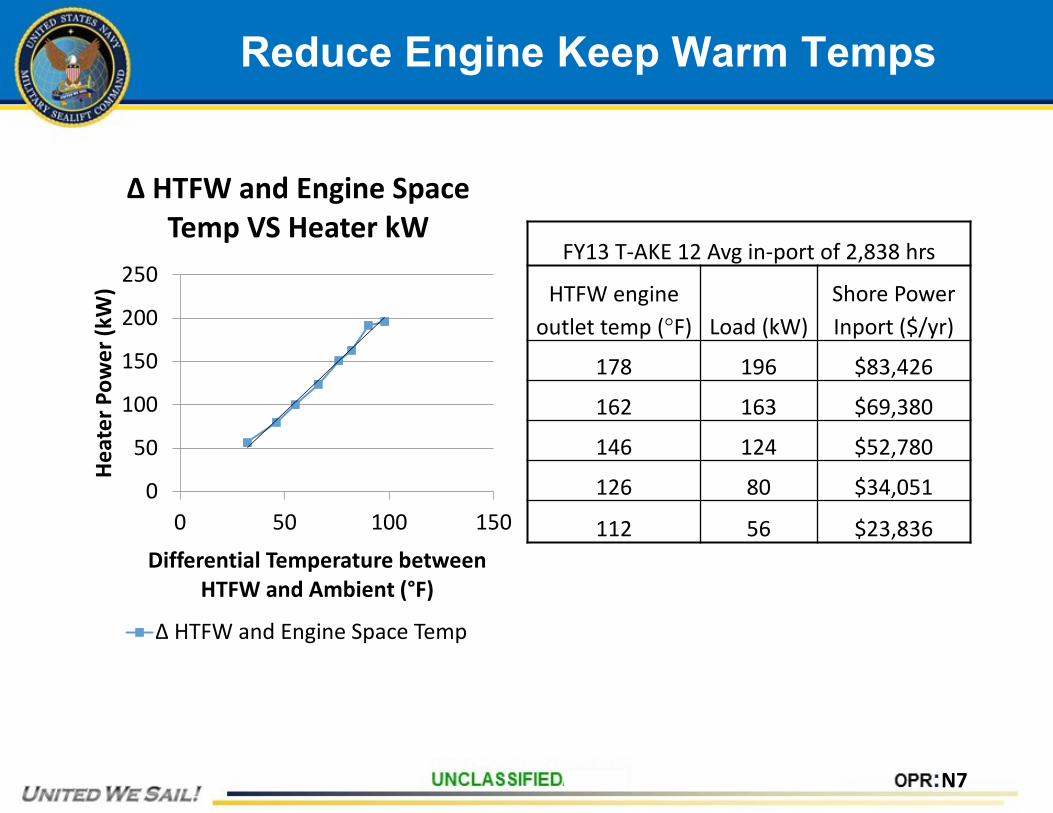
Reduce Engine Keep Warm Temps
0
50
100
150
200
250
0 50 100 150
Hea
ter P
ower
(kW
)
Differential Temperature between HTFW and Ambient (°F)
∆ HTFW and Engine Space Temp VS Heater kW
∆ HTFW and Engine Space Temp
FY13 T-AKE 12 Avg in-port of 2,838 hrs
HTFW engine outlet temp (°F) Load (kW)
Shore Power Inport ($/yr)
178 196 $83,426
162 163 $69,380
146 124 $52,780
126 80 $34,051
112 56 $23,836
N7
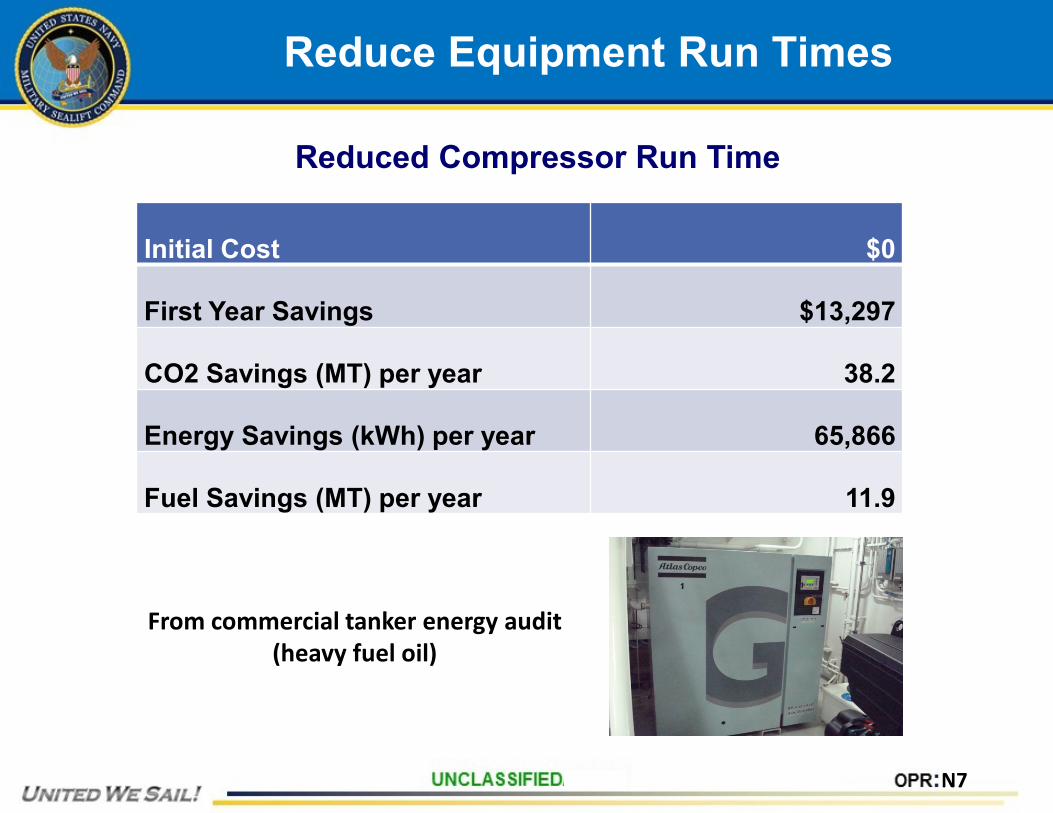
Reduce Equipment Run Times
Initial Cost $0
First Year Savings $13,297
CO2 Savings (MT) per year 38.2
Energy Savings (kWh) per year 65,866
Fuel Savings (MT) per year 11.9
From commercial tanker energy audit (heavy fuel oil)
Reduced Compressor Run Time
N7
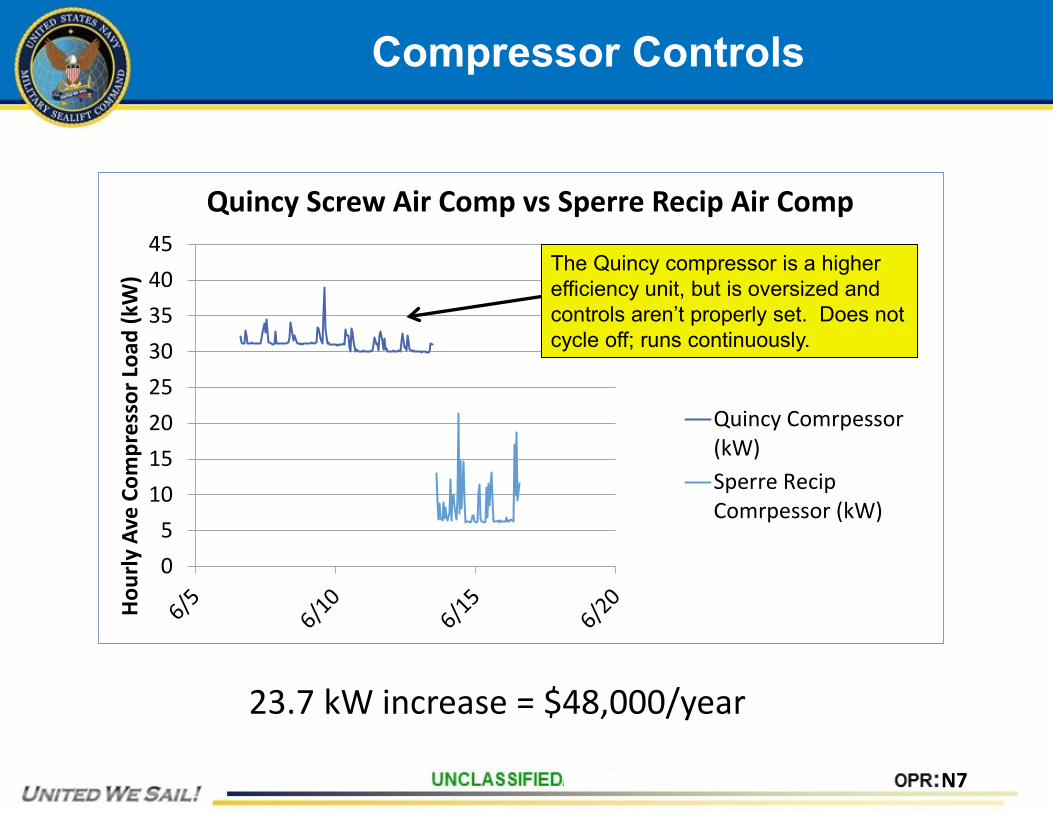
Compressor Controls
05
1015202530354045
Hou
rly A
ve C
ompr
esso
r Loa
d (k
W)
Quincy Screw Air Comp vs Sperre Recip Air Comp
Quincy Comrpessor(kW)Sperre RecipComrpessor (kW)
The Quincy compressor is a higher efficiency unit, but is oversized and controls aren’t properly set. Does not cycle off; runs continuously.
23.7 kW increase = $48,000/year
N7
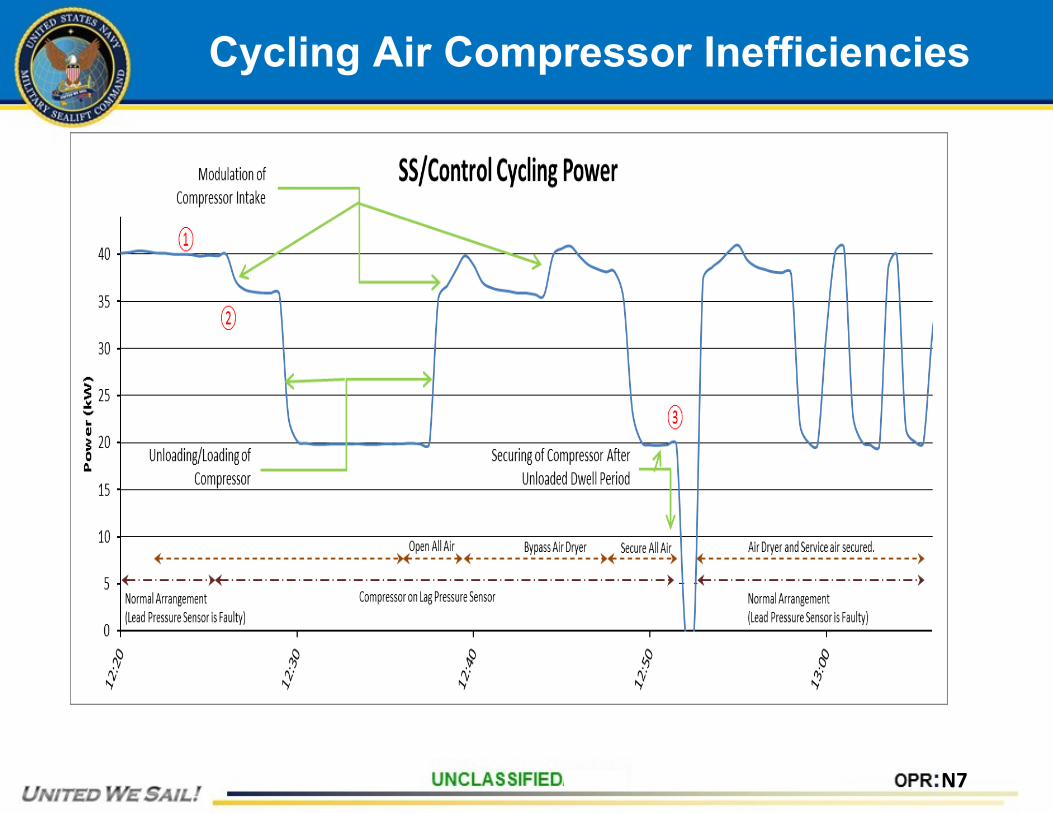
Cycling Air Compressor Inefficiencies
N7
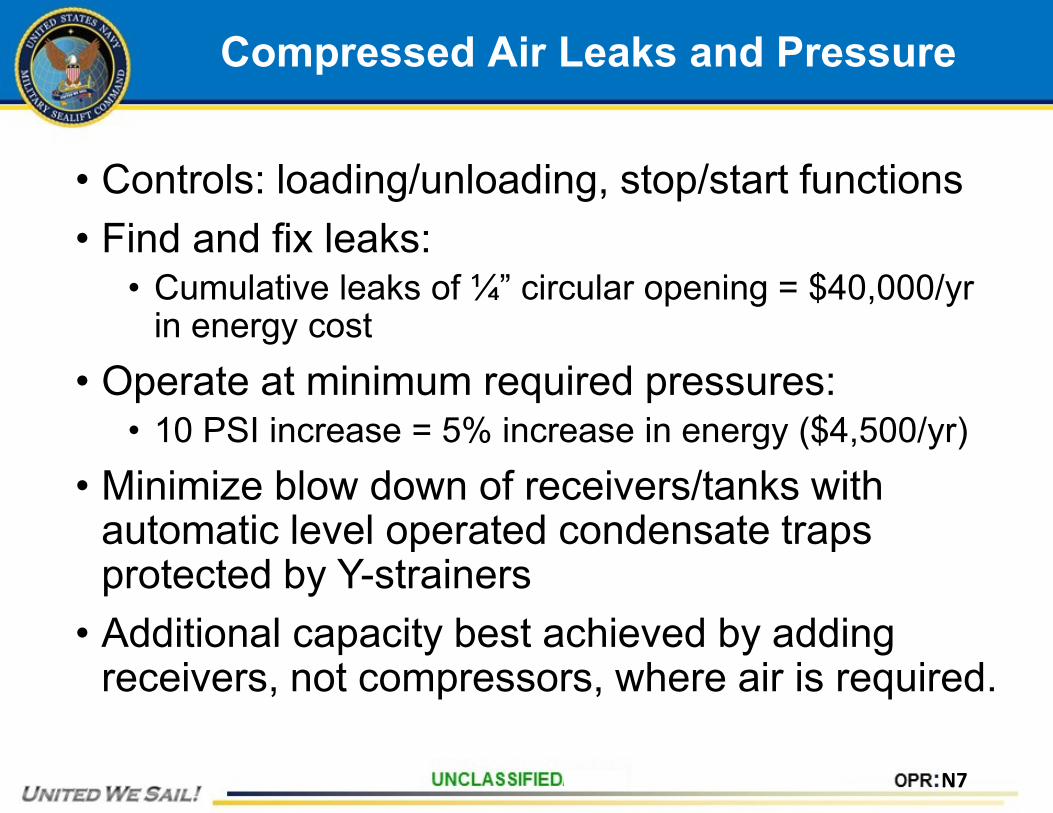
Compressed Air Leaks and Pressure
• Controls: loading/unloading, stop/start functions• Find and fix leaks:
• Cumulative leaks of ¼” circular opening = $40,000/yrin energy cost
• Operate at minimum required pressures: • 10 PSI increase = 5% increase in energy ($4,500/yr)
• Minimize blow down of receivers/tanks with automatic level operated condensate traps protected by Y-strainers
• Additional capacity best achieved by adding receivers, not compressors, where air is required.
N7
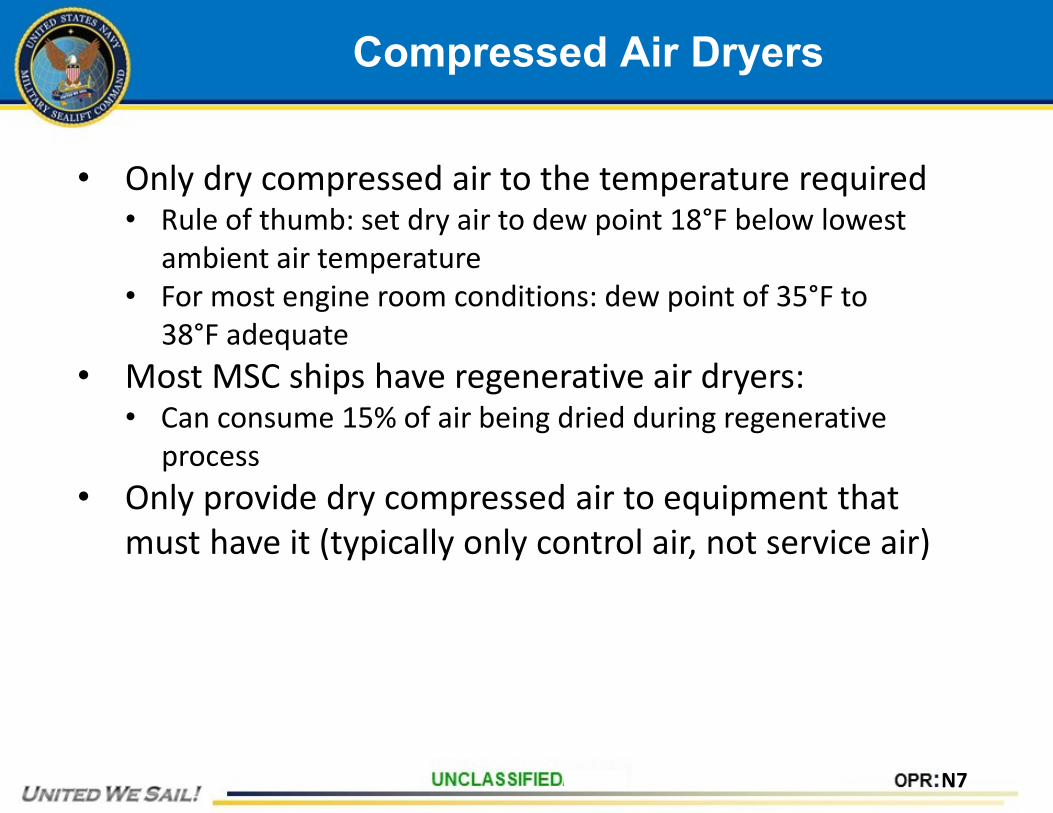
Compressed Air Dryers
• Only dry compressed air to the temperature required• Rule of thumb: set dry air to dew point 18°F below lowest
ambient air temperature• For most engine room conditions: dew point of 35°F to
38°F adequate• Most MSC ships have regenerative air dryers:
• Can consume 15% of air being dried during regenerativeprocess
• Only provide dry compressed air to equipment that must have it (typically only control air, not service air)
N7
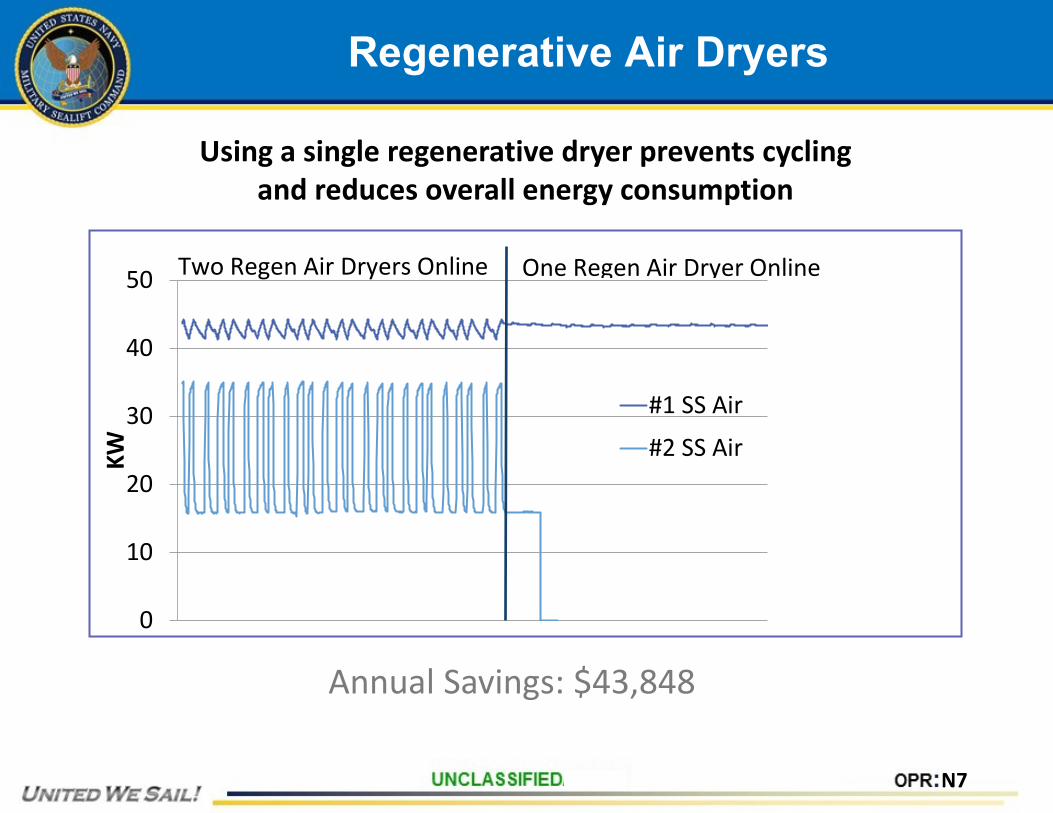
Regenerative Air Dryers
0
10
20
30
40
50
KW
#1 SS Air
#2 SS Air
Two Regen Air Dryers Online One Regen Air Dryer Online
Annual Savings: $43,848
Using a single regenerative dryer prevents cycling and reduces overall energy consumption
N7
Auxiliary Steam Systems
• Condensate temperature• Avoid excessive condensate subcooling
• Steam traps• Correct or replace leaking traps
• Controls:• Excess air penalty• Keep boiler clean and water treated• Maintain steam control valves
N7
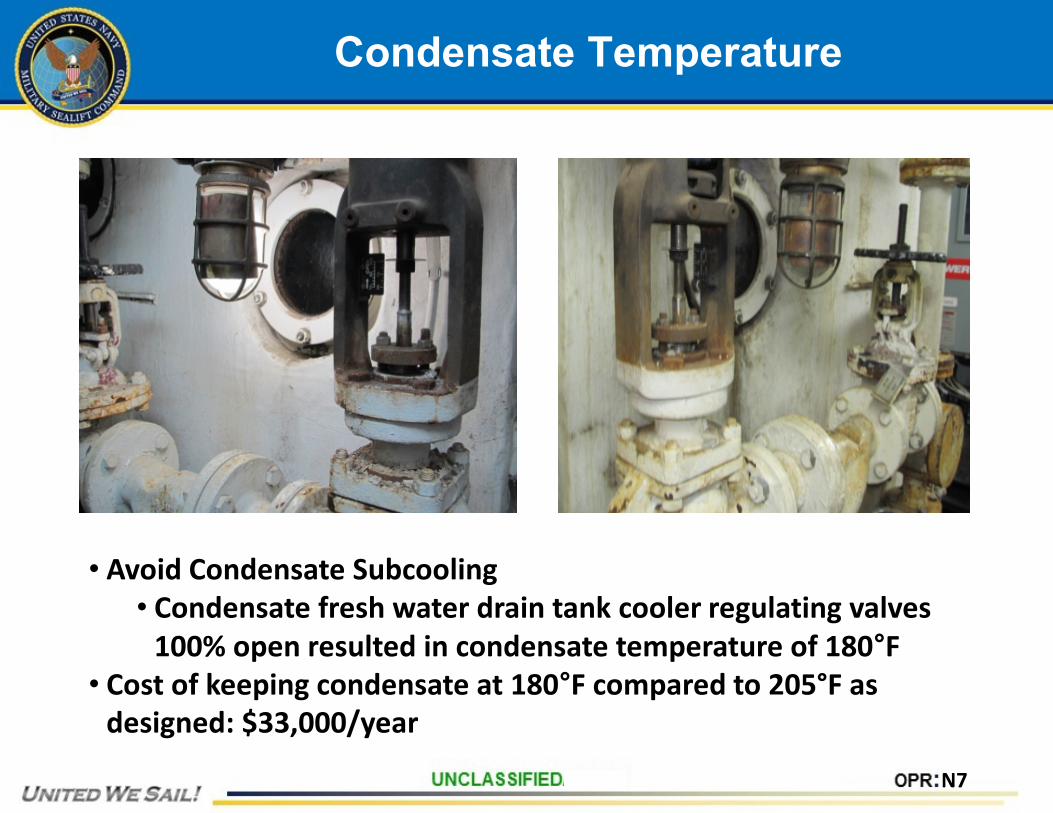
Condensate Temperature
• Avoid Condensate Subcooling• Condensate fresh water drain tank cooler regulating valves
100% open resulted in condensate temperature of 180°F• Cost of keeping condensate at 180°F compared to 205°F as
designed: $33,000/year
N7
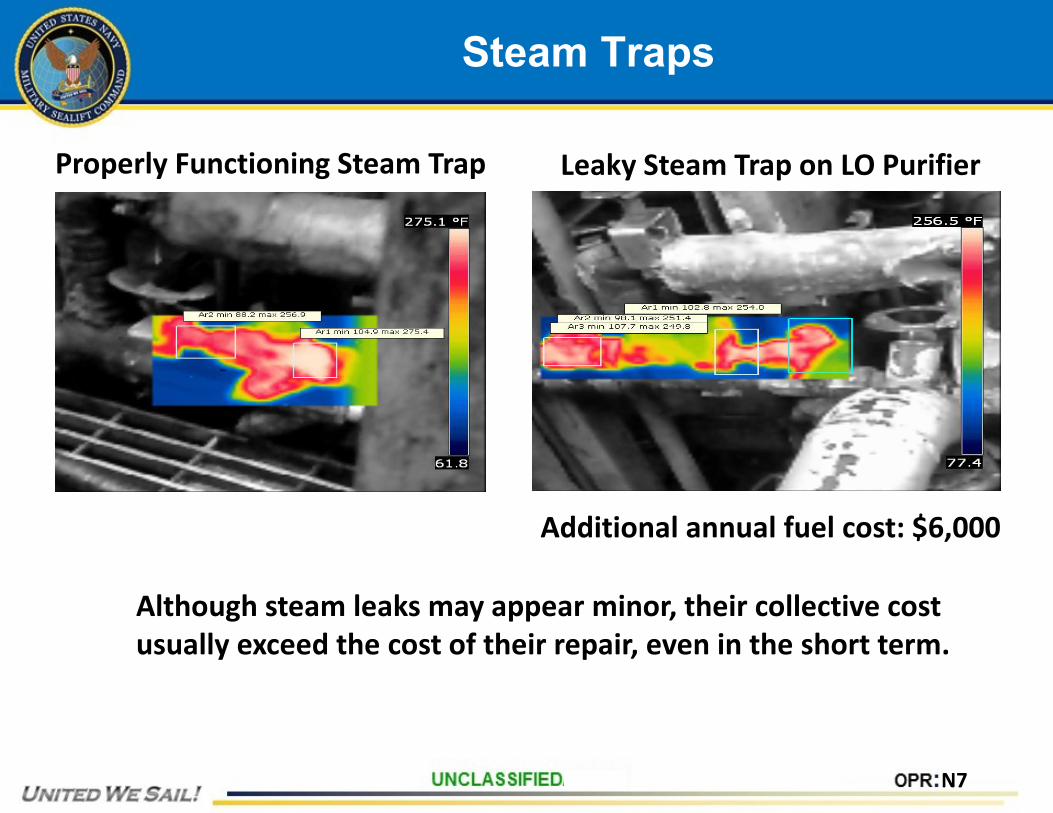
Steam Traps
Properly Functioning Steam Trap
Additional annual fuel cost: $6,000
Leaky Steam Trap on LO Purifier
Although steam leaks may appear minor, their collective cost usually exceed the cost of their repair, even in the short term.
N7
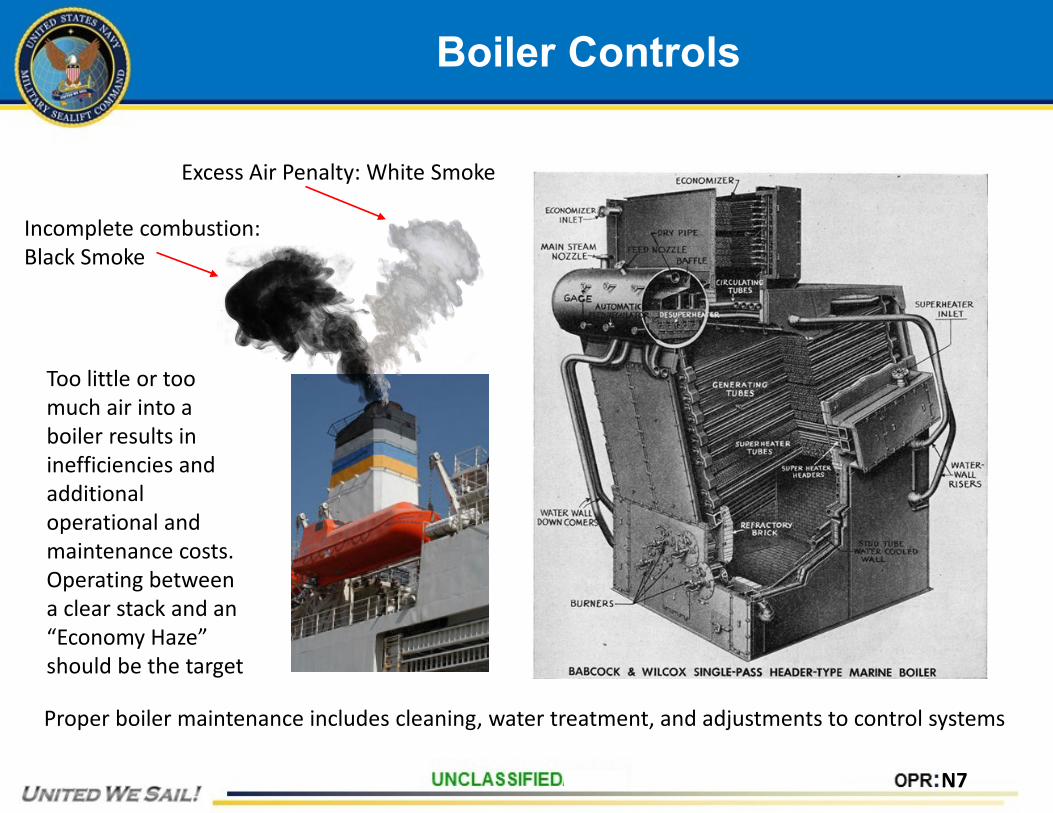
Boiler Controls
Excess Air Penalty: White Smoke
Incomplete combustion: Black Smoke
Too little or too much air into a boiler results in inefficiencies and additional operational and maintenance costs. Operating between a clear stack and an “Economy Haze” should be the target
Proper boiler maintenance includes cleaning, water treatment, and adjustments to control systems

N7
Questions?
N7
Lighting Energy Savings
The most important and easiest way to save energy in lighting systems is to TURN THEM OFF.
• Cargo Hold Lighting• Adding local switches• Splitting lighting circuits
• Motion Activated Lighting• Good for small, infrequently
visited spaces• Splitting Existing Lighting Circuits
• Allows reducing number of active lights in a single space
• Changing Culture• Becoming accustomed to
turning off lights
N7
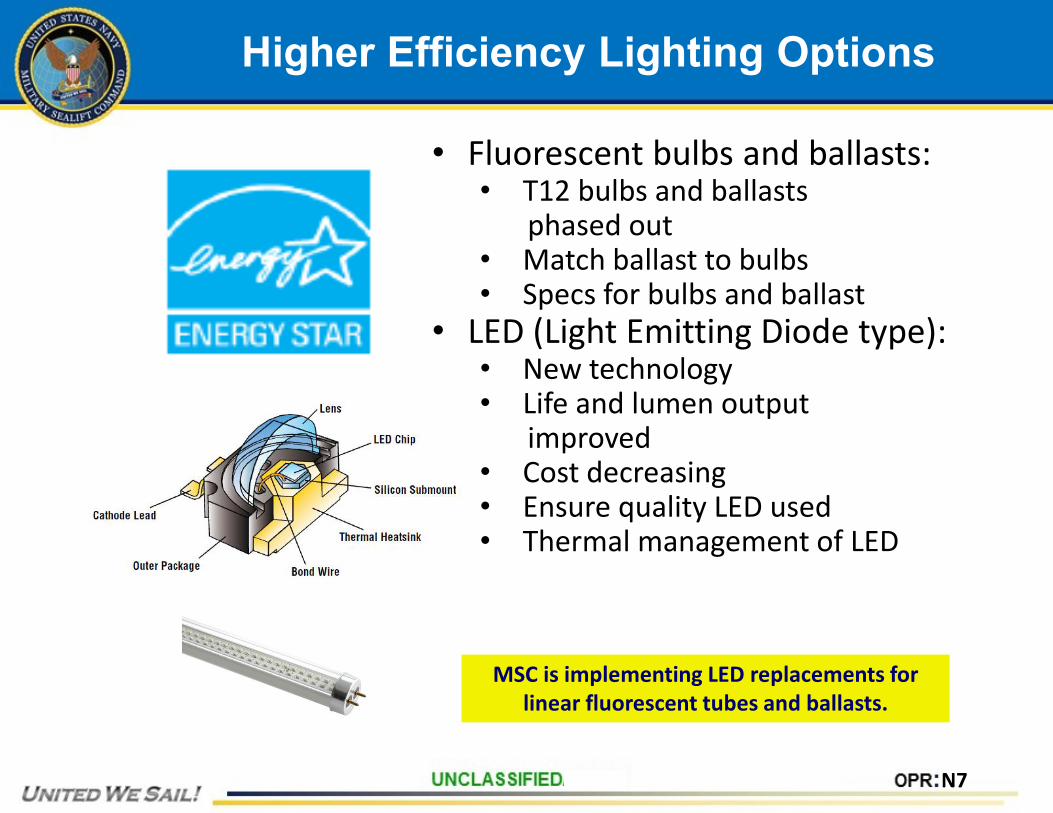
Higher Efficiency Lighting Options
• Fluorescent bulbs and ballasts:• T12 bulbs and ballasts
phased out• Match ballast to bulbs• Specs for bulbs and ballast
• LED (Light Emitting Diode type):• New technology• Life and lumen output
improved• Cost decreasing• Ensure quality LED used• Thermal management of LED
MSC is implementing LED replacements for linear fluorescent tubes and ballasts.

N7
Lighting Spectrum
• SCOTOPIC VISION - The scientific term for human visual perception in low light (night vision). Directed by rod cells in the human eye.
• PHOTOPIC VISION - The scientific term for human color vision under normal conditions during the day. Directed by cone cells in the human eye.
• MESOPIC VISION - The scientific term for the combination between Photopic and Scotopic vision, taking into account the total sensitivity of the rod cells in the eye for the blue range, with the color perception of the cone cells.
Less energy, better vision
N7
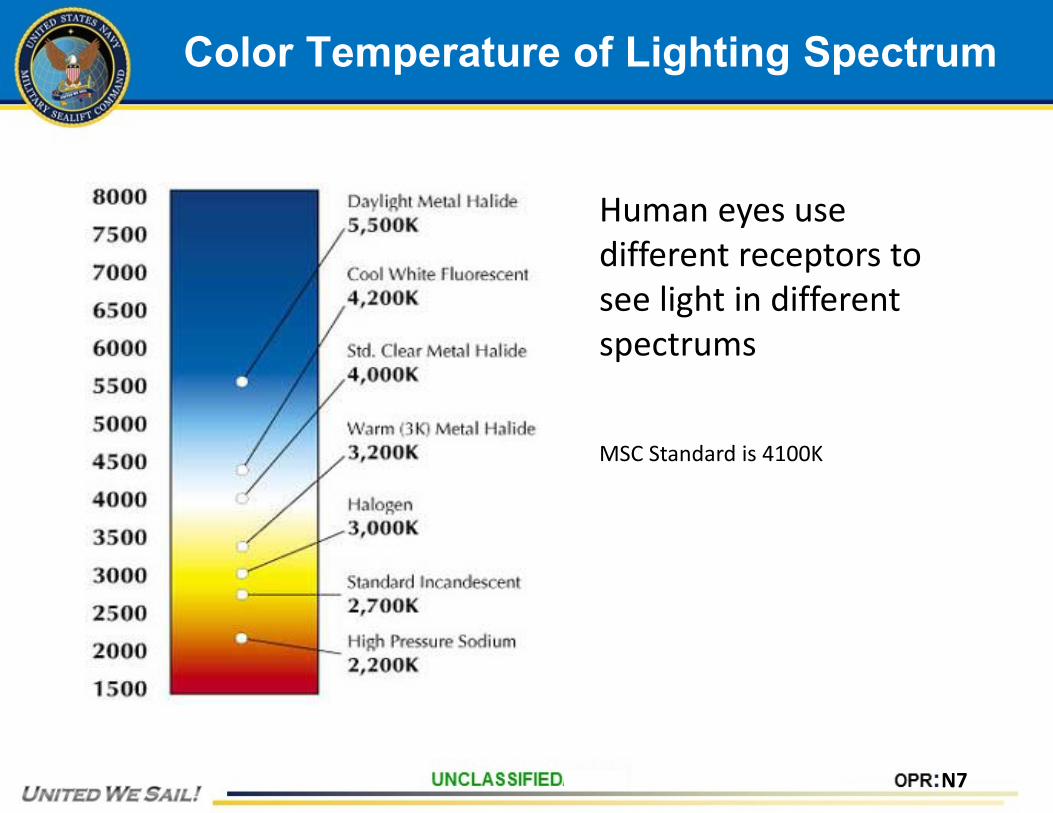
Color Temperature of Lighting Spectrum
Human eyes use different receptors to see light in different spectrums
MSC Standard is 4100K
N7
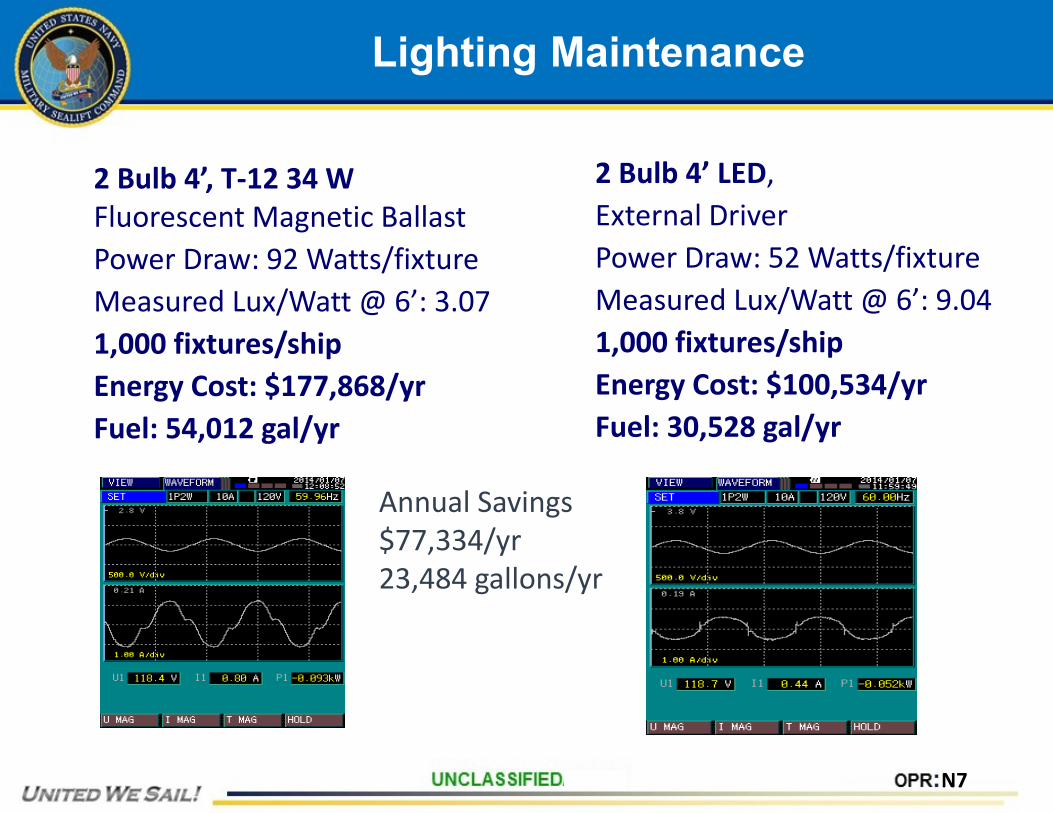
Lighting Maintenance
2 Bulb 4’, T-12 34 W Fluorescent Magnetic BallastPower Draw: 92 Watts/fixtureMeasured Lux/Watt @ 6’: 3.071,000 fixtures/shipEnergy Cost: $177,868/yrFuel: 54,012 gal/yr
2 Bulb 4’ LED,External Driver Power Draw: 52 Watts/fixtureMeasured Lux/Watt @ 6’: 9.041,000 fixtures/shipEnergy Cost: $100,534/yrFuel: 30,528 gal/yr
Annual Savings$77,334/yr23,484 gallons/yr
N7
Retrocommissioning
• Retrocommissioning: A systematic process to improve an existing system's performance by identifying operational improvements that will increase comfort and save energy
• Includes a review of ship operating policy and procedures, checkoff sheets, standing orders etc. for efficiency considerations
• Process requires review of performance metrics, ECC applicability to other systems, and staying abreast of technological and operational advancements in related industries
N7
Retrocommissioning: Aux Boiler
0
2
4
6
8
10
12
14
Ampe
rage
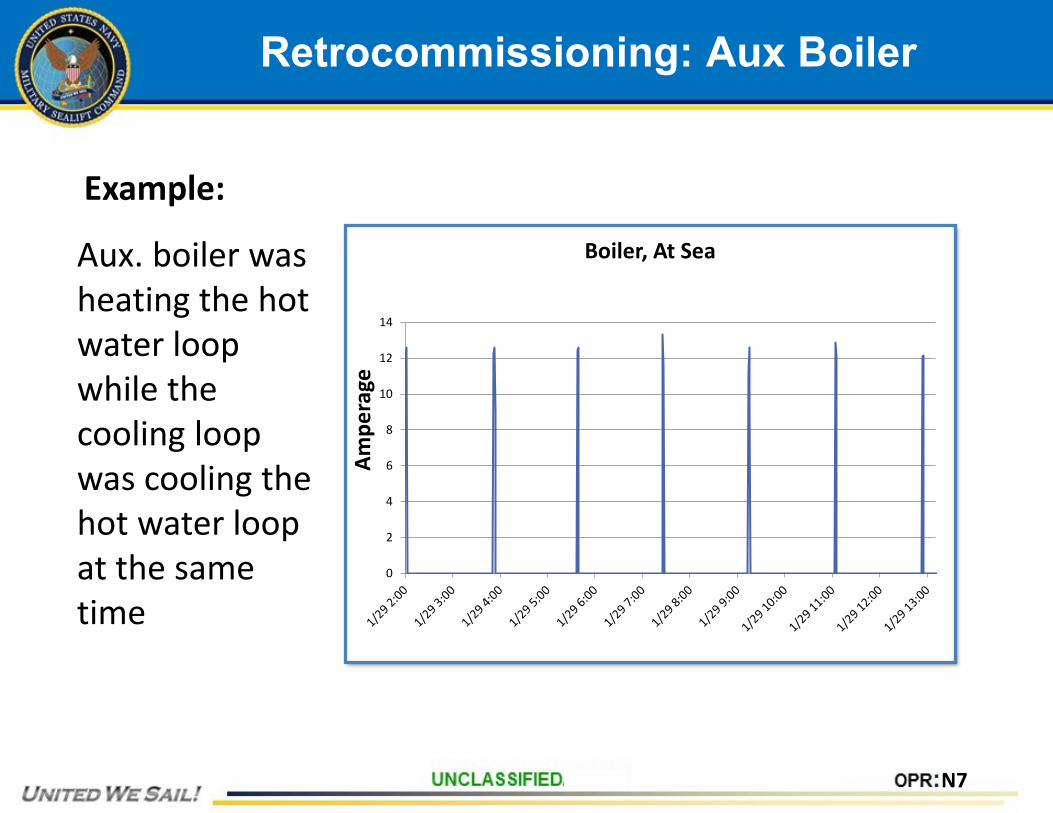
Boiler, At SeaAux. boiler was heating the hot water loop while the cooling loop was cooling the hot water loop at the same time
Example:
N7
Retrocommissioning: SS Air Compressor
0
5
10
15
20
25
30
35
40
45
Pow
er (k
W)
Elapsed Time
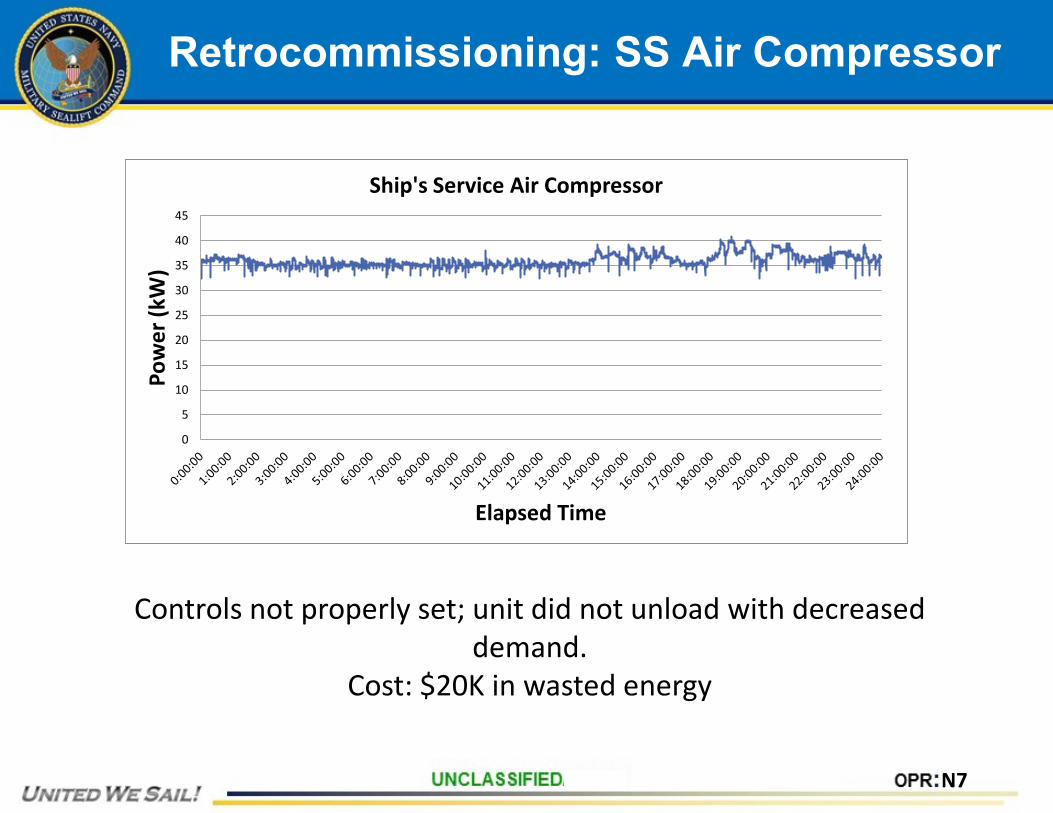
Ship's Service Air Compressor
Controls not properly set; unit did not unload with decreased demand.
Cost: $20K in wasted energy
N7
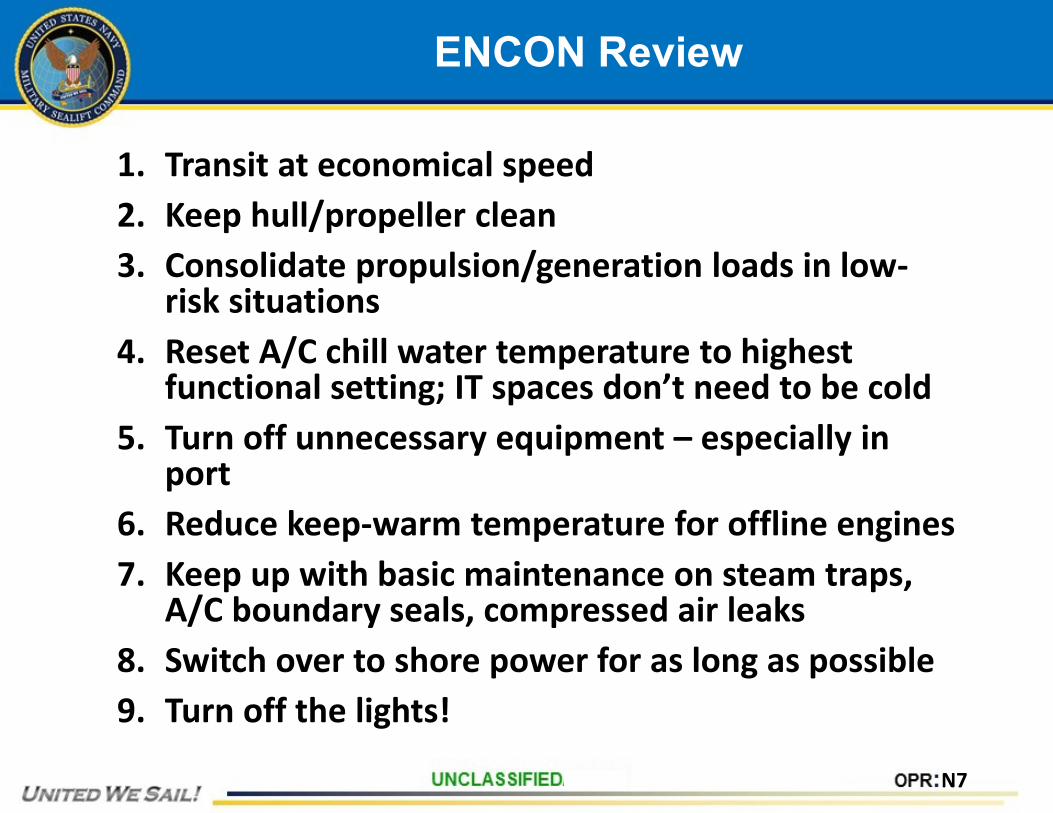
ENCON Review
1. Transit at economical speed2. Keep hull/propeller clean3. Consolidate propulsion/generation loads in low-
risk situations4. Reset A/C chill water temperature to highest
functional setting; IT spaces don’t need to be cold5. Turn off unnecessary equipment – especially in
port6. Reduce keep-warm temperature for offline engines7. Keep up with basic maintenance on steam traps,
A/C boundary seals, compressed air leaks8. Switch over to shore power for as long as possible 9. Turn off the lights!
N7
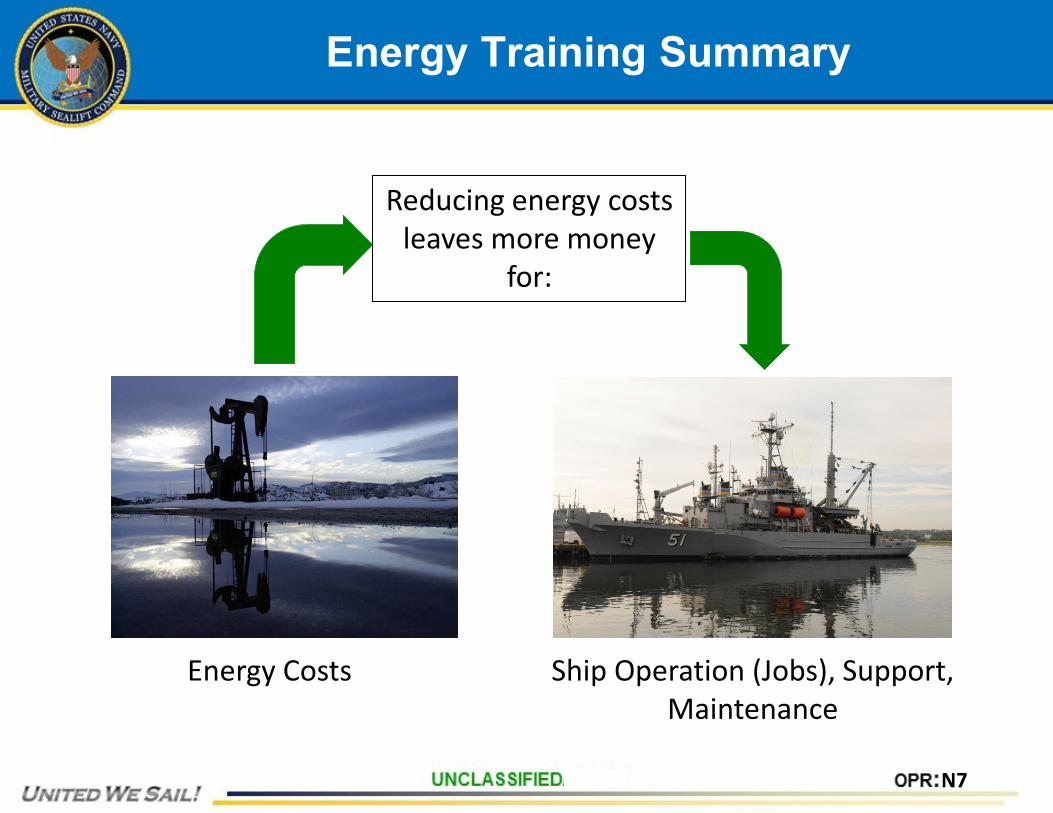
Energy Training Summary
Reducing energy costs leaves more money
for:
Energy Costs Ship Operation (Jobs), Support, Maintenance

N7
Thank You!
Any Questions?

N7
Backup Slides
Fluorescent lighting circuit VFD-driven motor
Harmonic Distortion
N7
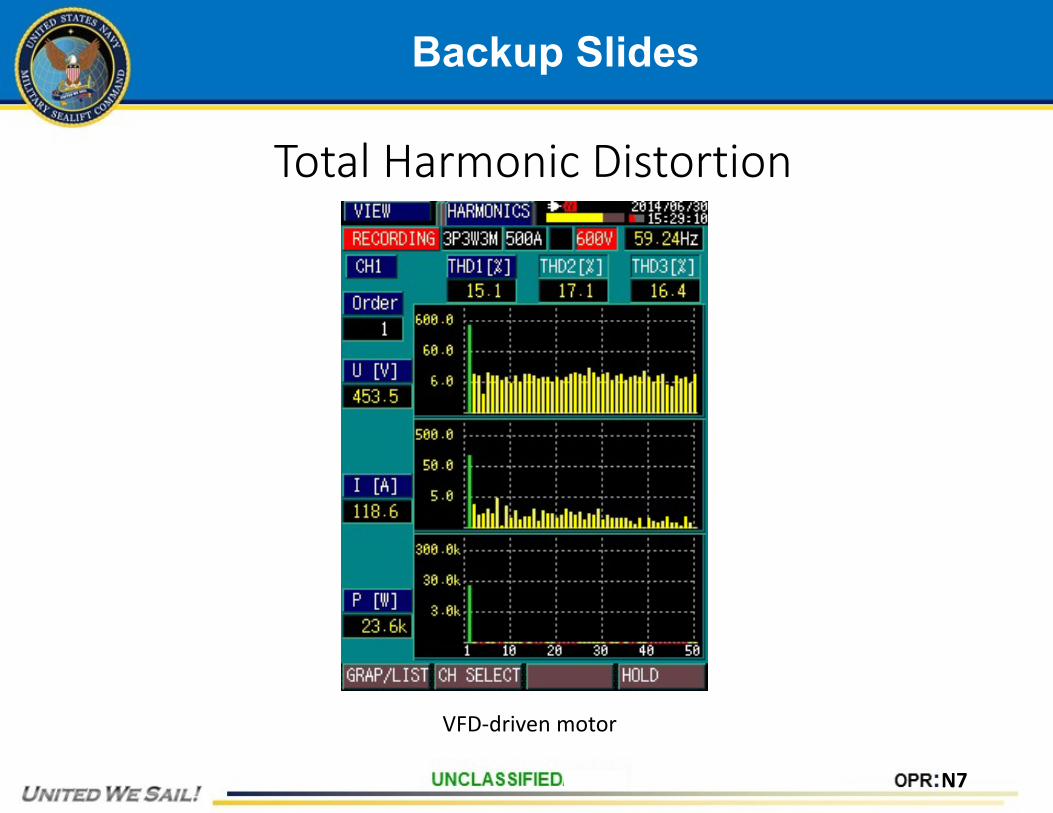
Backup Slides
Total Harmonic Distortion
VFD-driven motor
N7
Backup Slides
Where to get a Rubert Gage
N7
Backup Slides
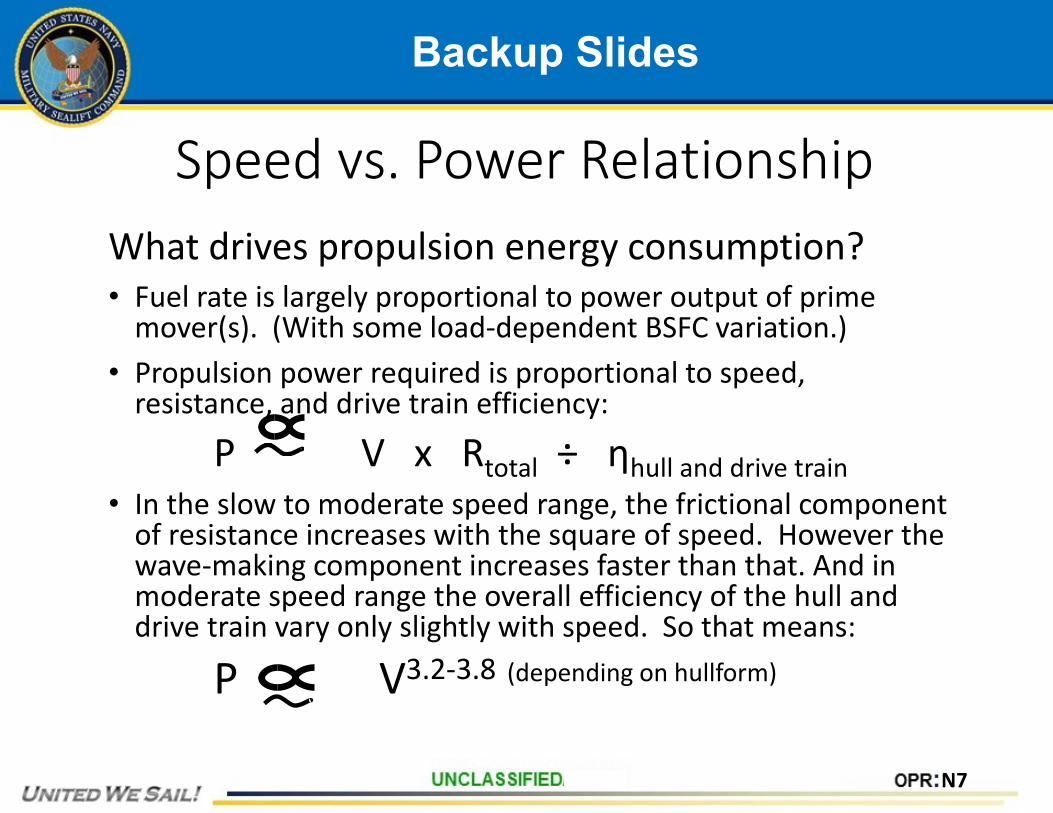
What drives propulsion energy consumption?• Fuel rate is largely proportional to power output of prime
mover(s). (With some load-dependent BSFC variation.)• Propulsion power required is proportional to speed,
resistance, and drive train efficiency:
P V x Rtotal ÷ ηhull and drive train• In the slow to moderate speed range, the frictional component
of resistance increases with the square of speed. However the wave-making component increases faster than that. And in moderate speed range the overall efficiency of the hull and drive train vary only slightly with speed. So that means:
P V3.2-3.8 (depending on hullform)
Speed vs. Power Relationship
N7
Backup Slides
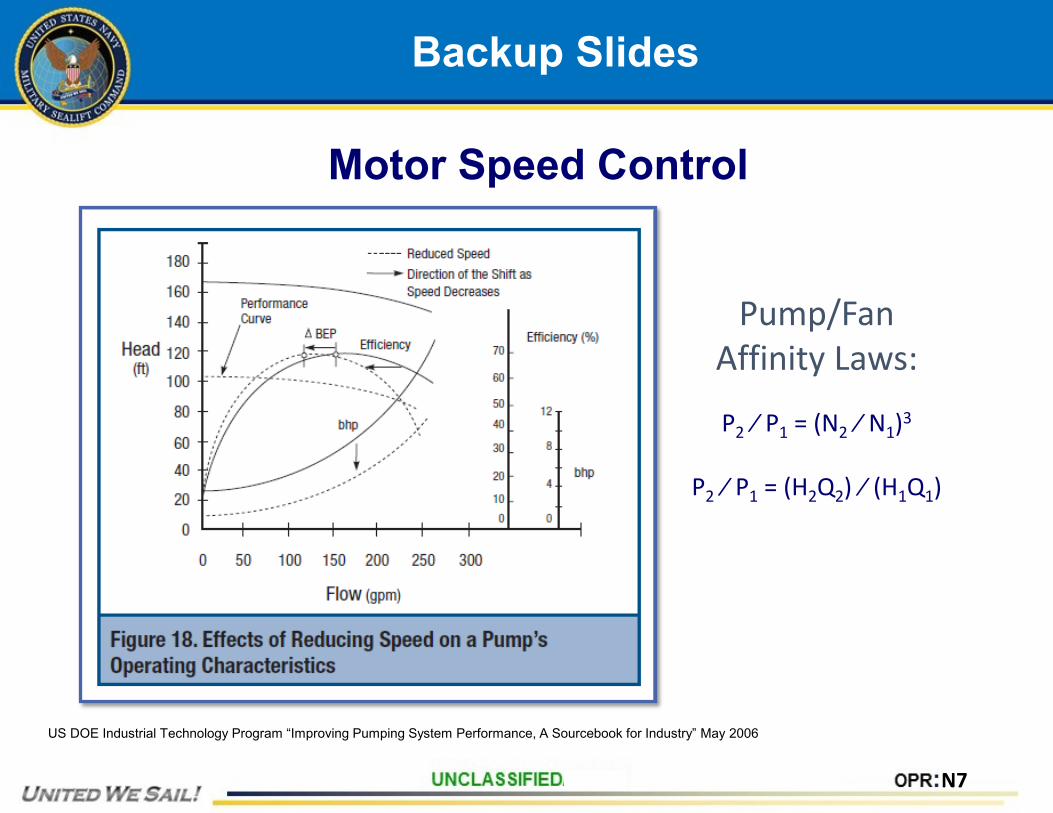
Motor Speed Control
US DOE Industrial Technology Program “Improving Pumping System Performance, A Sourcebook for Industry” May 2006
Pump/Fan Affinity Laws:
P2 ⁄ P1 = (N2 ⁄ N1)3
P2 ⁄ P1 = (H2Q2) ⁄ (H1Q1)

N7
Backup Slides
Motor Speed Control
US DOE Industrial Technology Program “Improving Pumping System Performance, A Sourcebook for Industry” May 2006
Pump/Fan Affinity Laws:
P2 ⁄ P1 = (N2 ⁄ N1)3
P2 ⁄ P1 = (H2Q2) ⁄ (H1Q1)

N7
Backup Slides
HVAC Chill Water Reset and C.O.P.
Suction Pressure (Ps)Chill Water Temp
Total Lift(Pd - Ps)
Reduced Lift = Increased C.O.P.
N7
Backup Slides
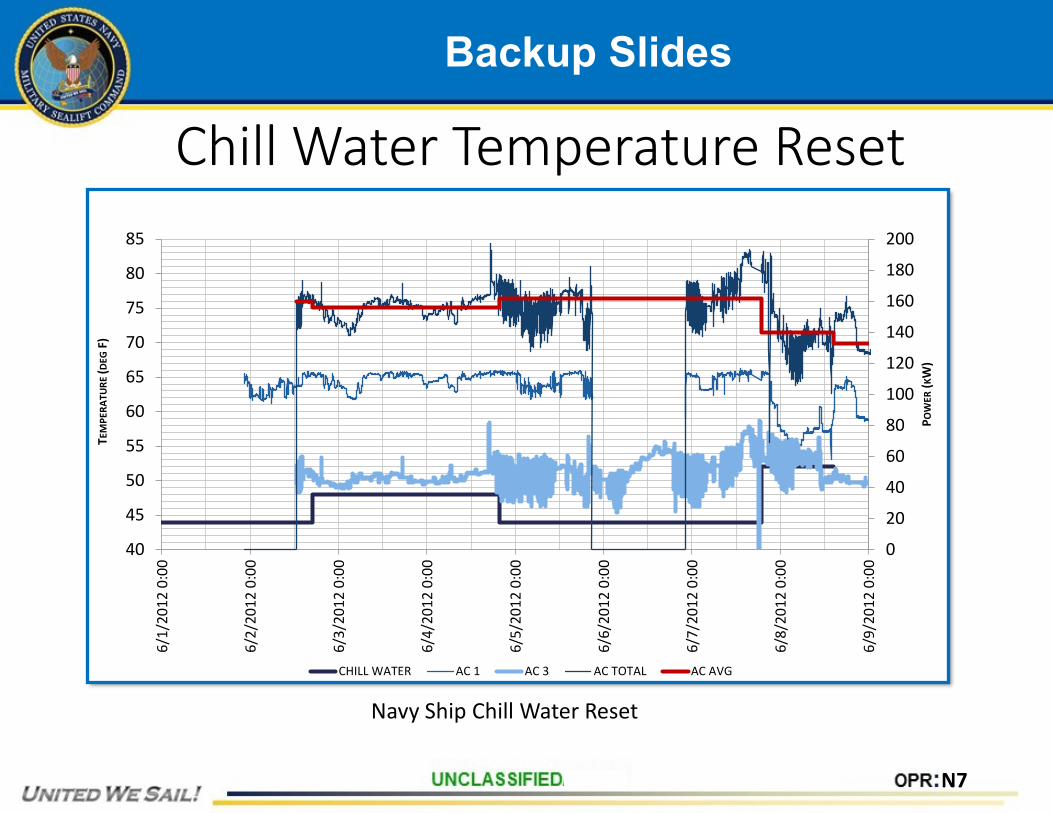
Chill Water Temperature Reset
0
20
40
60
80
100
120
140
160
180
200
40
45
50
55
60
65
70
75
80
85
6/1/
2012
0:0
0
6/2/
2012
0:0
0
6/3/
2012
0:0
0
6/4/
2012
0:0
0
6/5/
2012
0:0
0
6/6/
2012
0:0
0
6/7/
2012
0:0
0
6/8/
2012
0:0
0
6/9/
2012
0:0
0
POW
ER(K
W)
T EM
PERA
TURE
(DEG
F)
CHILL WATER AC 1 AC 3 AC TOTAL AC AVG
Navy Ship Chill Water Reset
N7
Backup Slides
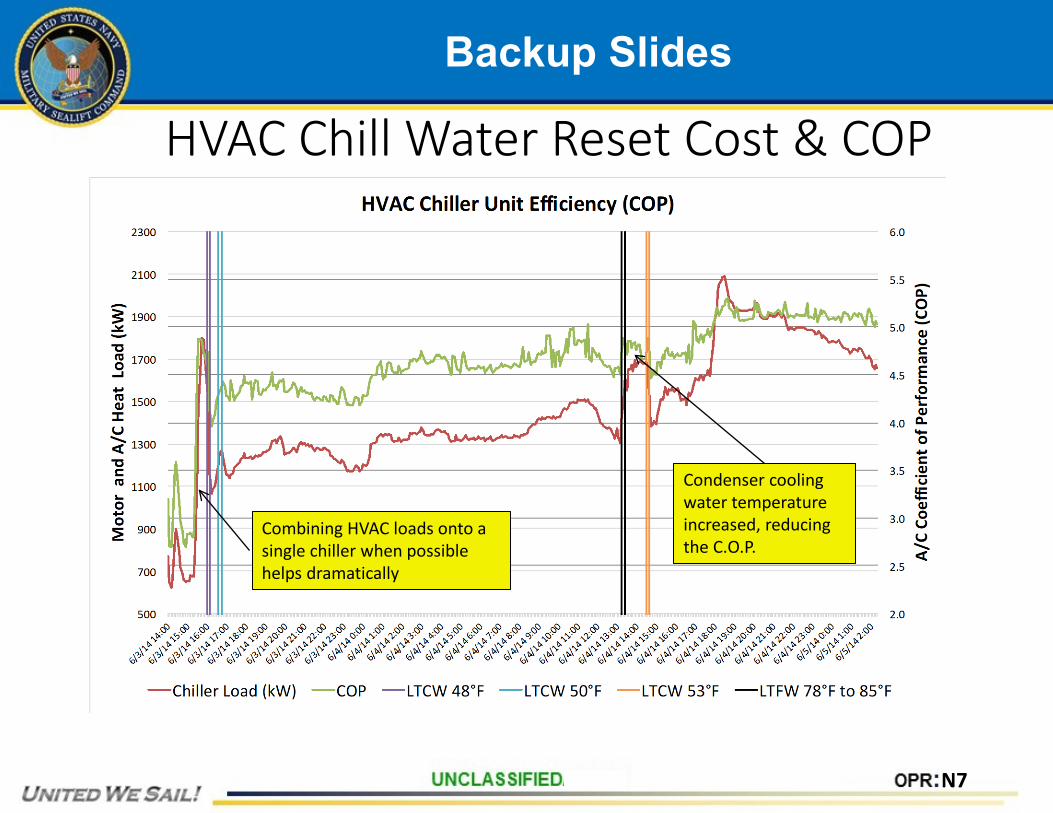
HVAC Chill Water Reset Cost & COP
Combining HVAC loads onto a single chiller when possible helps dramatically
Condenser cooling water temperature increased, reducing the C.O.P.
N7
Backup Slides
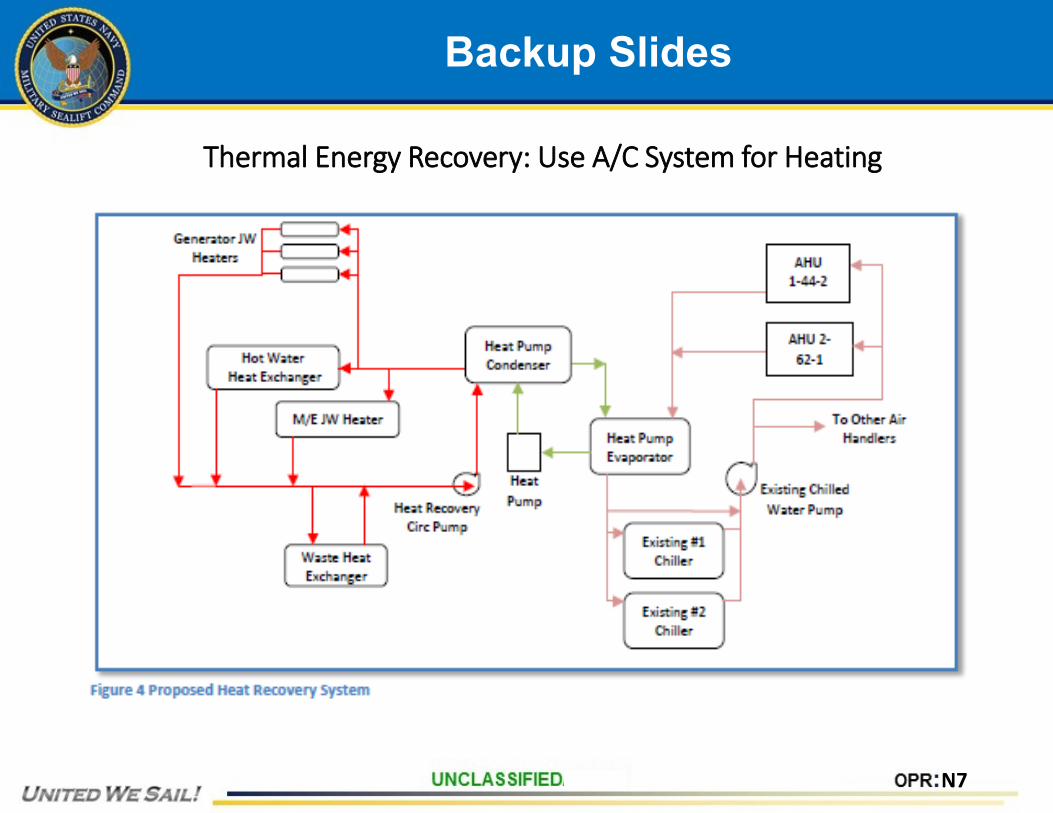
Thermal Energy Recovery: Use A/C System for Heating
N7
Backup Slides
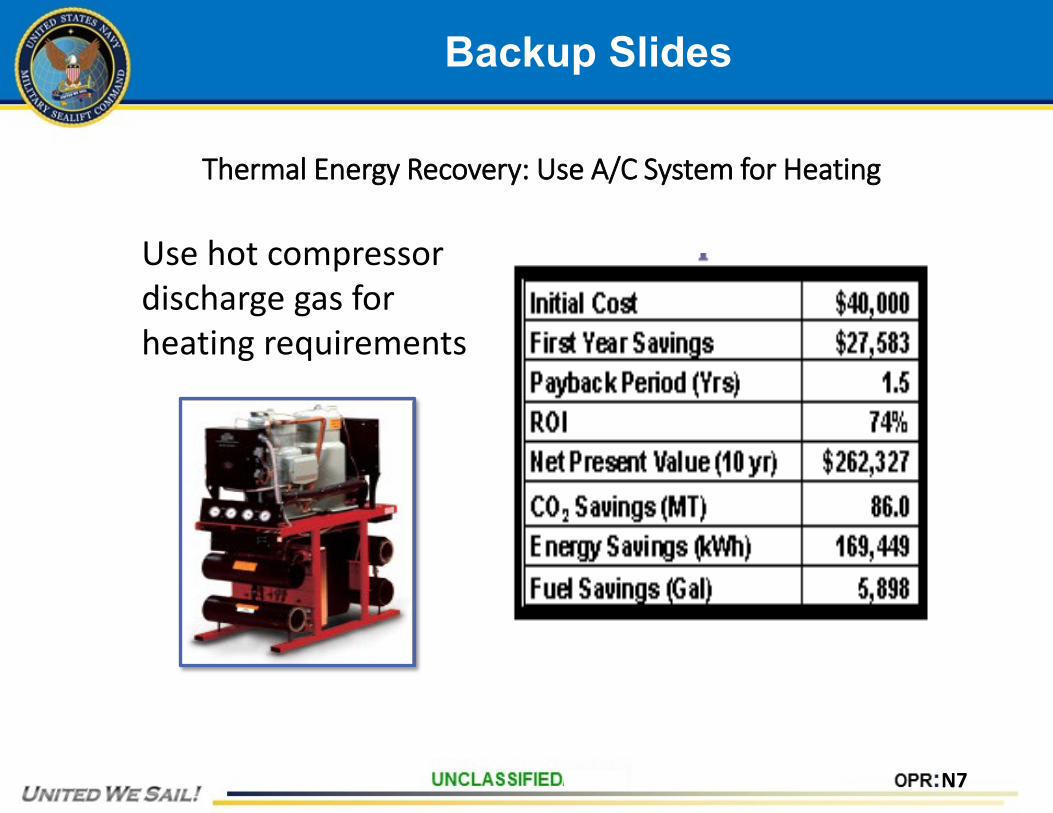
Thermal Energy Recovery: Use A/C System for Heating
Use hot compressor discharge gas for heating requirements
N7
Backup Slides
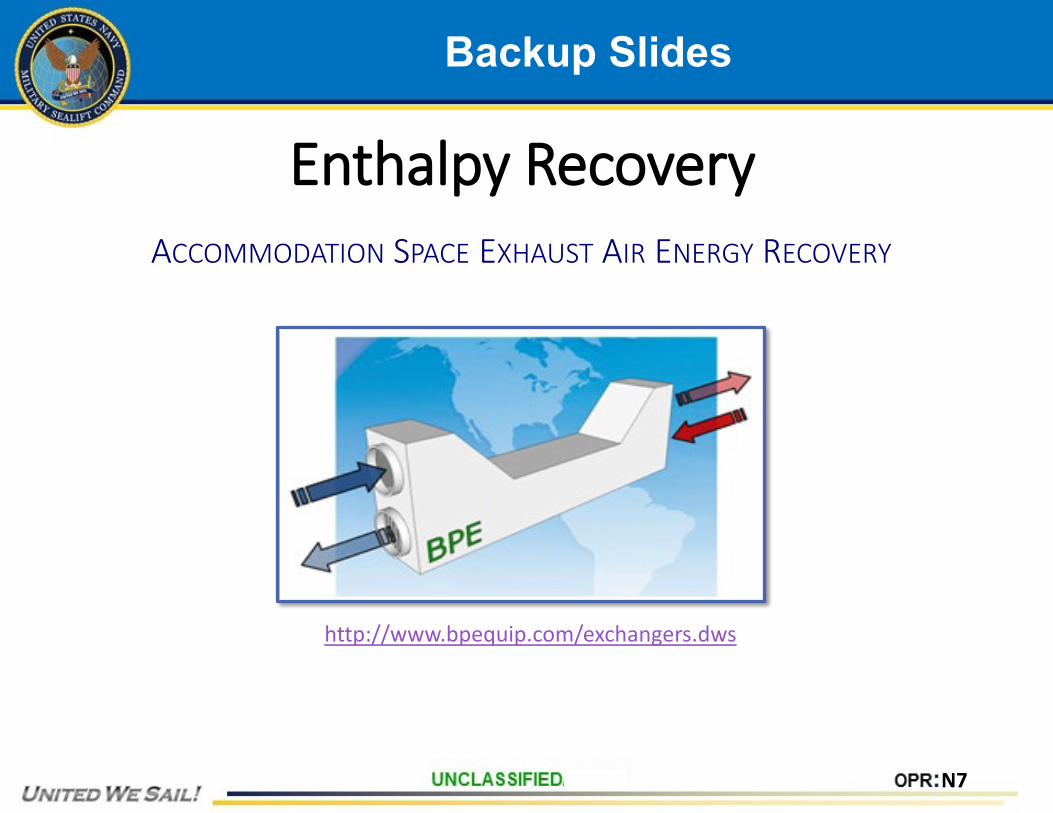
Enthalpy RecoveryACCOMMODATION SPACE EXHAUST AIR ENERGY RECOVERY
http://www.bpequip.com/exchangers.dws
N7
Backup Slides
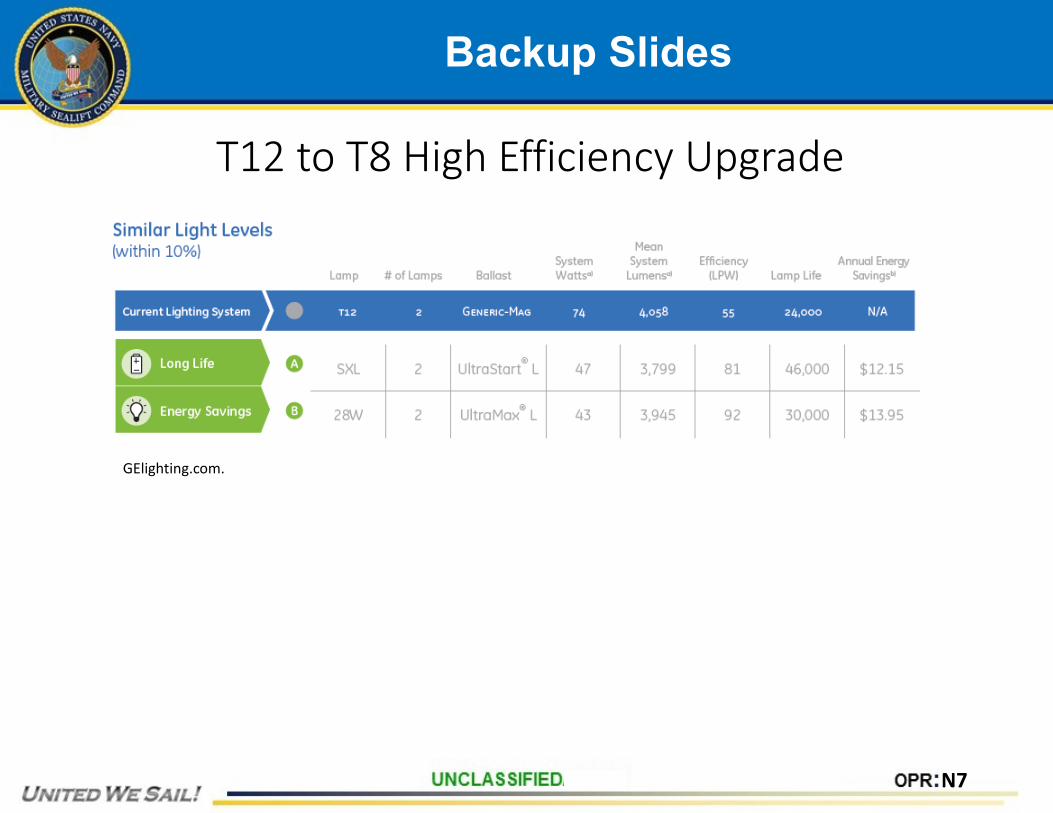
T12 to T8 High Efficiency Upgrade
GElighting.com.
N7
Backup Slides
Waste Energy Recovery• Use central fresh water as heating source
• HP air compressors (secure electric heat)• Reduction gear• Main engine lube oil
• Reduce requirement• Secure AC plant during cold weather• Fix steam traps and raise condensate temp
• Use air cooled air compressor

N7
Backup Slides
Hot Water System
Three hot water heaters lined up, one element on versusone hot water heater lined up and one element on
Extra annual energy cost: $12,000
Three Hot Water Heaters
One Hot Water Heater