Encana Corporation Barclays Capital 2011 CEO Energy … · Encana Corporation Barclays Capital 2011...
33
Encana Corporation Barclays Capital 2011 CEO Energy-Power Conference Randy Eresman | President & CEO New York | September 2011 take a closer look
-
Upload
nguyennguyet -
Category
Documents
-
view
217 -
download
0
Transcript of Encana Corporation Barclays Capital 2011 CEO Energy … · Encana Corporation Barclays Capital 2011...
Encana CorporationBarclays Capital 2011 CEO Energy-Power Conference
Randy Eresman | President & CEO
New York | September 2011
take a closer look

1
Take a Closer LookStrategically Positioned to Excel
We are – The leading North American resource
play company– Pursuing the greatest long-term value
creation for shareholders– Committed to responsible financial
stewardship
We have – High quality, low cost assets– An innovative, value-driven culture– A clear vision of the future
Encana Corporation Vast Land Position
Greater SierraGreater Sierra
Cutbank RidgeCutbank Ridge
BighornBighorn
CBMCBM
Deep PanukeDeep Panuke
JonahJonah
PiceancePiceance
HaynesvilleHaynesville
Land as at December 31, 2010
Major Established Plays: 11.7 million net acresHorn RiverHorn River
TexasTexas
Total Production – MMcfe/d• 2010 Actual 3,321
• 2011 Forecast 3,475 – 3,525

2
Encana CorporationLarge, Diversified Portfolio & Production Base
0
100
200
300
400
500
600
Ha
yne
svill
e
Cu
tba
nk
Rid
ge
*
Jon
ah
CB
M
Pic
ea
nce
Te
xas*
Gre
ate
rS
ierr
a*
Big
ho
rn
Oth
er
MMcfe/d
Guidance as at June 21, 2011; Total company 2011F production of 3,475 – 3,525 MMcfe/d.*Cutbank Ridge includes Montney; Greater Sierra includes Horn River; Texas includes Barnett and East Texas.
5 – 7 percent per share growth for 2011F
Range
0
20
40
60
80
100
Peak Rate (%)
Harvest AssetsCommercial AssetsNew Plays
Cutbank Ridge - MontneyCutbank Ridge - Montney
Horseshoe Canyon CBMHorseshoe Canyon CBM
BighornBighorn
Horn River – Two Island LakeHorn River – Two Island Lake
Greater Sierra - Jean MarieGreater Sierra - Jean Marie
Horn River - KiwiganaHorn River - KiwiganaWest Cutbank - MontneyWest Cutbank - Montney
East TexasEast Texas
North TexasNorth Texas
Piceance – Williams ForkPiceance – Williams Fork
Haynesville / Mid Bossier LAHaynesville / Mid Bossier LA
JonahJonahUSAUSA
CanadaCanada
Michigan CollingwoodMichigan Collingwood
DuvernayDuvernay
Liquid RichLiquid Rich
Dry GasDry Gas
DJ NiobraraDJ Niobrara
Piceance NiobraraPiceance Niobrara Wind River BasinWind River Basin
Encana CorporationResource Play Life Cycle – Asset Categories
Tuscaloosa Marine ShaleTuscaloosa Marine Shale
OilOil
3
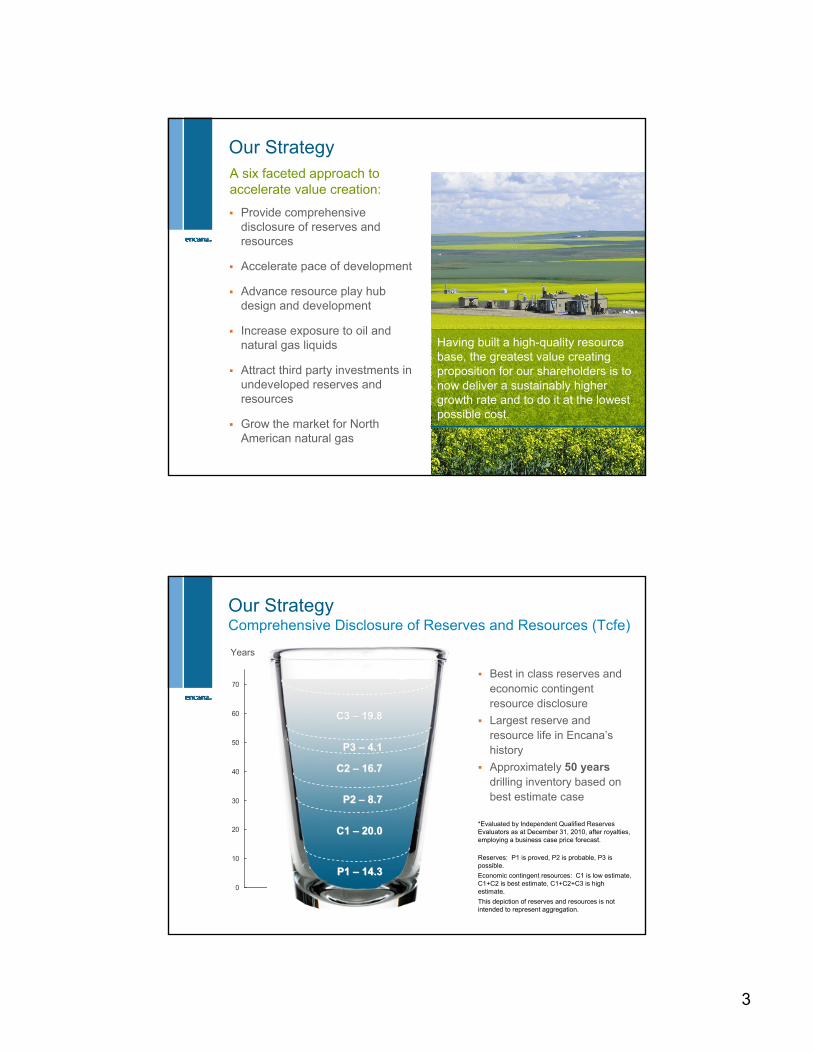
Our Strategy
Having built a high-quality resource base, the greatest value creating proposition for our shareholders is to now deliver a sustainably higher growth rate and to do it at the lowest possible cost.
A six faceted approach to accelerate value creation:
Provide comprehensive disclosure of reserves and resources
Accelerate pace of development
Advance resource play hub design and development
Increase exposure to oil and natural gas liquids
Attract third party investments in undeveloped reserves and resources
Grow the market for North American natural gas
0
10
20
30
40
50
60
70
Annualized 2010 Production 2010 Reserves Res & ECR
P1 P1 –– 14.314.3
P2 P2 –– 8.78.7
P3 P3 –– 4.14.1
C1 C1 –– 20.020.0
C2 C2 –– 16.716.7
C3 C3 –– 19.819.8
Our StrategyComprehensive Disclosure of Reserves and Resources (Tcfe)
Best in class reserves and economic contingent resource disclosure
Largest reserve and resource life in Encana’s history
Approximately 50 yearsdrilling inventory based on best estimate case
Years
*Evaluated by Independent Qualified Reserves Evaluators as at December 31, 2010, after royalties, employing a business case price forecast.
Reserves: P1 is proved, P2 is probable, P3 is possible.
Economic contingent resources: C1 is low estimate, C1+C2 is best estimate, C1+C2+C3 is high estimate.
This depiction of reserves and resources is not intended to represent aggregation.

4
Huge inventory provides basis for developing resource at a quicker pace– Brings value forward sooner
– Growth rate limited by manpower, infrastructure, services and investment capital
Assets capable of a very high growth rate– Higher growth rate is not prudent in current price
environment
– A moderated growth rate of 5 – 10% per year balances available resources in current market
Our StrategyAccelerate Growth Rate Over the Long Term
2.0
2.5
3.0
3.5
4.0
4.5
5.0
5.5
6.0
6.5
7.0
$6 NYMEX: ~
15% CAGR
$4 NYMEX: ~5% CAGR
Accelerated Pace of DevelopmentManaging the Gas Price Reality: $4 - $6+ NYMEX Natural Gas
* Based on 2011 cost structures, price range of $4 - $6+ NYMEX natural gas.
Time
In a stronger price environment, Encana’s asset base is capable of supporting higher growth
Lower natural gas prices are not the right environment to pursue higher growth
Encana’s growth rate is dependent on
– Current commodity price, forward strip and internal forecast
– Aligning capital investment with cash flow and net divestitures
– Maintaining investment grade credit ratings
Bcf/d

5
Our StrategyAdvancing Resource Play Hub Design and Development
Concentrated resource
+ Pad drilling
+ Manufacturing process
= Resource play hubRepresents 4-6 square miles of reservoir accessed from a single surface location.
Our StrategyAdvancing Resource Play Hub Design and Development
Pad drilling
Minimal surface impact
Highly efficient
Potential for even lower future costs
Concurrent drilling and completions operations

6
$0
$1
$2
$3
$4
$5
$6
$7
$8
2008 2009 2010 2011F 3-5 yr target
Encana Historical Supply CostProven Track Record of Lowering Cost Structures
$/MMBtu
Including $0.30 G&A. 2011F represent initial projections
Upper Quartile Lower Quartile Capital Weighted
Demonstrated reduction in capital weighted portfolio average supply cost of 25% over three year period
Narrowing of range between upper and lower project quartile highlights high-grading of portfolio
Target further reduction in average supply cost to approximately $3.00 over next 3-5 years through further efficiency gains and continued high-grading.
25% decline
Encana Portfolio Supply Cost
$3.00
Our StrategyIncreasing Exposure to Oil and Natural Gas Liquids
Focusing more capital into higher liquids areas of existing developments
Extracting more natural gas liquids from higher Btu streams
Expanding dry gas developments into liquids rich window
Exploring existing land base for higher liquids rich fairways
Acquiring and exploring new lands focused on expected liquids rich fairways
Expecting to significantly increase oil and natural gas liquids exposure in the next few years

7
Our StrategyIncreasing Exposure to Oil and Natural Gas Liquids
Responding to a shift in oil and gas pricing and the successful application of new technologies
Pursuing a full cycle, organic approach to shifting portfolio weighting
Leveraging our core competency of horizontal drilling and completions
About $1 billion of 2011F capital investment directed toward oil and natural gas liquids
Hold more than 2.1 million net acres of land with oil and natural gas liquids
Our StrategyIncreasing Exposure to Oil and Natural Gas Liquids
DuvernayDuvernay
Alberta BakkenAlberta Bakken
NiobraraNiobrara
More than 2.1 million acres with liquids rich drilling opportunities
DJ BasinDJ Basin
CollingwoodCollingwood
Deep BasinDeep Basin
As at June 30, 2011.
MontneyMontney
TuscaloosaTuscaloosa

8
Increasing Exposure to Oil and NGLsLiquids - Then & Now
CurrentPre-split (Cenovus assets)
Technology:
Liquids:
Horizontal drilling
Large, multi-stage completions Water flood
Polymer flood
CO2 injection
SAGD
Propane, butane
Condensate
Light oil
35-50 API
Bitumen
8-10 API
Heavy/medium oil
15-25 API
Our StrategyAttracting Third Party Investments
Immediate recognition of hidden value
Achieves targeted reduction in resource inventory
Enhances financial flexibility
Creates strategic partnerships
Aligns with goal to expand market Accelerating value recognition of
our undeveloped resources
9
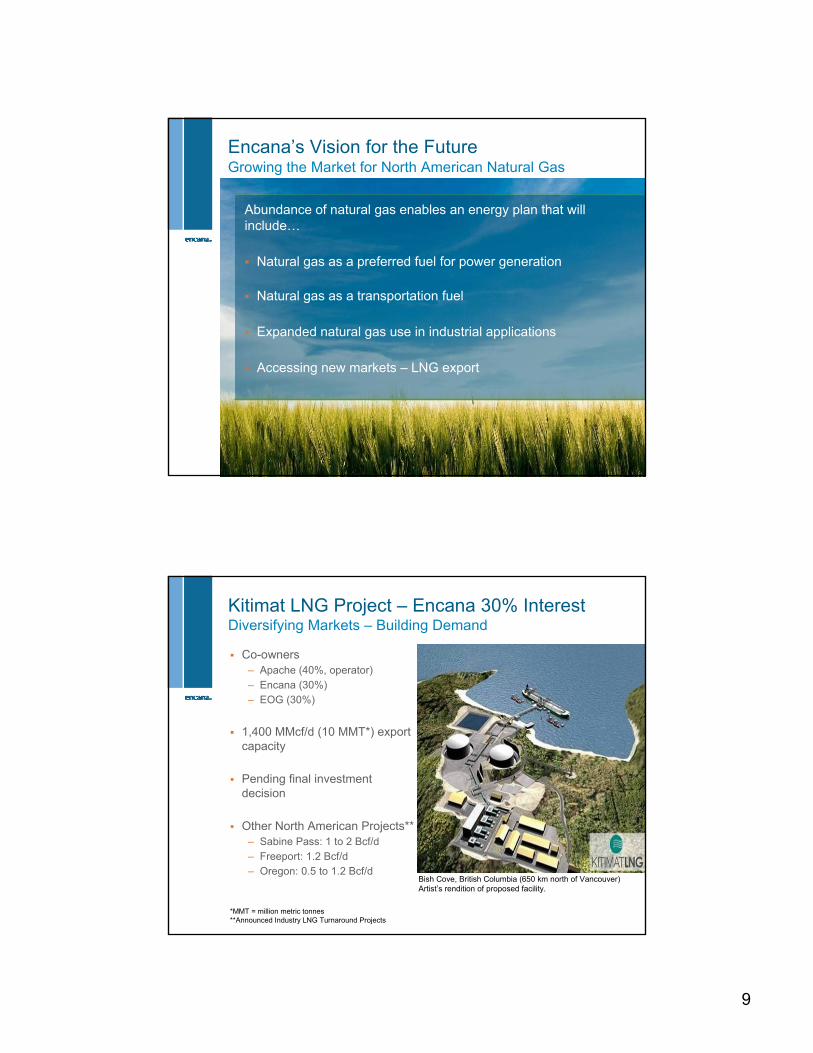
Abundance of natural gas enables an energy plan that will include…
Natural gas as a preferred fuel for power generation
Natural gas as a transportation fuel
Expanded natural gas use in industrial applications
Accessing new markets – LNG export
Encana’s Vision for the FutureGrowing the Market for North American Natural Gas
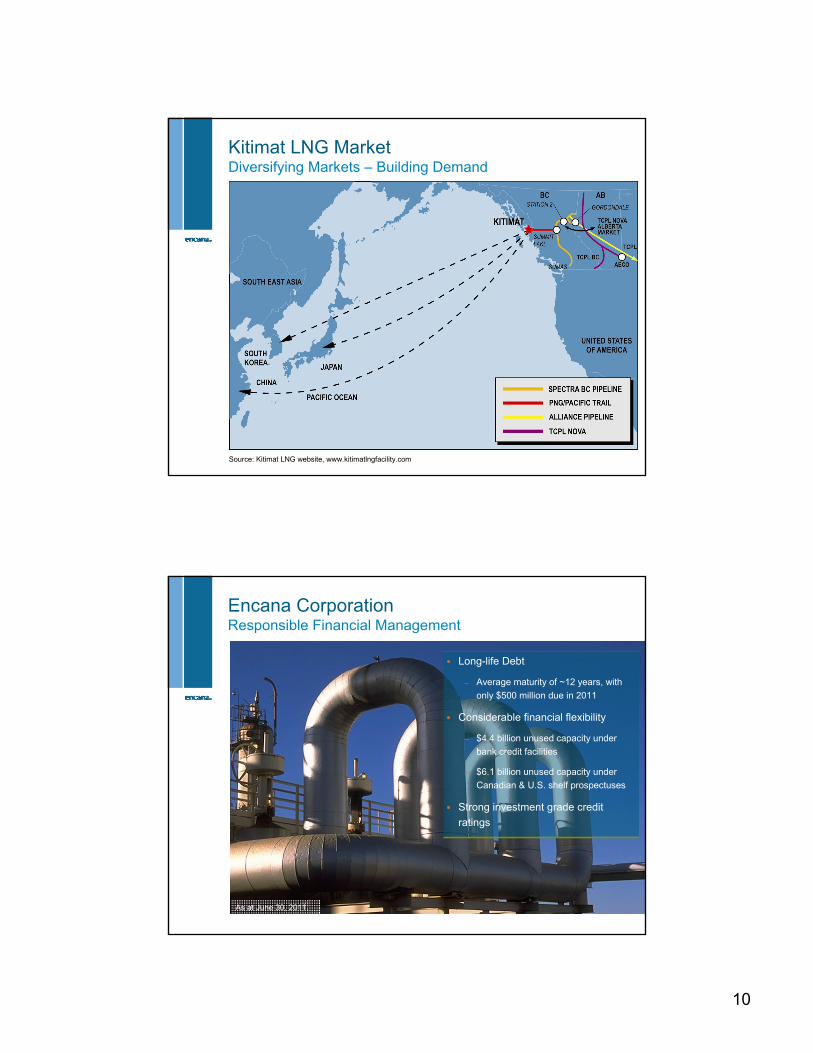
Kitimat LNG Project – Encana 30% InterestDiversifying Markets – Building Demand
Co-owners– Apache (40%, operator)
– Encana (30%)– EOG (30%)
1,400 MMcf/d (10 MMT*) export capacity
Pending final investment decision
Other North American Projects**– Sabine Pass: 1 to 2 Bcf/d
– Freeport: 1.2 Bcf/d– Oregon: 0.5 to 1.2 Bcf/d
Bish Cove, British Columbia (650 km north of Vancouver)Artist’s rendition of proposed facility.
*MMT = million metric tonnes**Announced Industry LNG Turnaround Projects
10
Source: Kitimat LNG website, www.kitimatlngfacility.com
Kitimat LNG MarketDiversifying Markets – Building Demand
Encana CorporationResponsible Financial Management
Long-life Debt
– Average maturity of ~12 years, with
only $500 million due in 2011
Considerable financial flexibility
– $4.4 billion unused capacity under
bank credit facilities
– $6.1 billion unused capacity under
Canadian & U.S. shelf prospectuses
Strong investment grade credit
ratings
As at June 30, 2011.

11
Encana Corporation Continuous Portfolio Highgrading
2009– ~50 deals for total value of ~$1.3 billion
– ~10 active joint ventures
– Divestitures of ~$1,075 million
– Acquisitions of ~$260 million
2010– ~70 deals for total value of ~$1.6 billion
– ~15 active joint ventures
– Divestitures of ~$883 million
– Acquisitions of ~$733 million
2011– Forecast net divestitures of ~$1.0 billion – 2.0 billion
– Forecast JV capital of ~$500 million
0
500
1,000
1,500
2,000
2,500
3,000
3,500
4,000
4,500
5,000
2006 2007 2008 2009 2010
Share Purchases*($Millions)
0
250
500
750
1,000
1,250
1,500
2006 2007 2008 2009* 2010*
Annual Dividend ($Millions)
Encana CorporationStrong Return of Cash to Shareholders
*Adjusted for shares purchased under Long Term Incentive programs.
*2009 and 2010 dividend payments adjusted to reflect split transaction and spin off of Cenovus.
Q2 2011 dividend: $0.20 per share

12
*2006 – 2009 are Encana consolidated results. Hedging gains (losses) are net realized before tax. Forecast NYMEX natural gas price and NYMEX price adjusted for realized hedges based on strip prices and hedge positions as at June 30, 2011.
-$2
$0
$2
$4
$6
$8
$10
$12
Q1 06
Q2 06
Q3 06
Q4 06
Q1 07
Q2 07
Q3 07
Q4 07
Q1 08
Q2 08
Q3 08
Q4 08
Q1 09
Q2 09
Q3 09
Q4 09
Q1 10
Q2 10
Q3 10
Q4 10
Q1 11
Q2 11
Q3 11F
Q4 11F
Q1 12F
Q2 12F
Q3 12F
Q4 12F
-$800
-$100
$600
$1,300
$2,000
$2,700
$3,400
$4,100
$4,800
Realized Gains (Losses)NYMEX $/MMBtuNYMEX price adjusted for realized hedges
$ millions$/MMBtu
Encana CorporationDisciplined Risk Management
Actual Forecast
2006 2007 2008 2009 2010 2011F 2012F
NY
ME
X
Hed
ging G
ain
s/Losse
s
NYMEX
NYMEX adjusted for realized hedges
Disciplined Risk ManagementNatural Gas Price Hedging* - Increased Cash Flow Certainty
0.4
2.0
1.8
$5.75 $5.80
$5.29
0.0
0.5
1.0
1.5
2.0
2.5
2011 2012 2013
$0.00
$1.00
$2.00
$3.00
$4.00
$5.00
$6.00
$7.00
Volume Fixed Price Swap
Bcf/d $/Mcf
*As at June 30, 2011. Based on expected production volumes.

13
Take a Closer LookStrategically Positioned to Excel
We are – The leading North American resource
play company– Pursuing the greatest long-term value
creation for shareholders– Committed to responsible financial
stewardship
We have – High quality, low cost assets– An innovative, value-driven culture– A clear vision of the future
Supplemental

14
Encana CorporationThe Leading North American Resource Play Company
ECA listing on Toronto and New York stock exchanges
Outstanding shares: 736 million
Market capitalization: $23 billion
Total debt: $8.5 billion
Dividend yield: 2.5%
*As at June 30, 2011
Leading North American Resource Play CompanyOur Strong Foundation
Vast North American focused land position
Large, low cost, diversified production base
Huge inventory of reserves and resources
Highly economic development portfolio
Strong financial stewardship
Trustworthy, reliable contributor in the communities where we operate

15
High Quality Asset BaseReserves and Economic Contingent Resources (ECR) (Tcfe)
Reserves: P1 is proved, P2 is probable, P3 is possibleEconomic contingent resources: C1 is low estimate, C1+C2 is best estimate, C1+C2+C3 is high estimate
*Evaluated by Independent Qualified Reserves Evaluators as at December 31, 2010, after royalties, employing a business case price forecast.
This depiction of reserves and ECR is not intended to represent aggregation.
Both reserves and ECR are 100% evaluated by IQREs*
Chart illustrates implied reserve life index based on combination of reserves and ECR
Approximately 30 years of inventory based on P1+C1; approximately 50 years based on best estimate case
Technical certainty represents probability that the quantities actually recovered will equal or exceed estimate
Years
14.3 14.3
8.7
20.04.1
8.7
1.2 Tcfe
16.7
4.1
19.8
0
10
20
30
40
50
60
70
80
90
Annualized 2010Production
2010 Reserves 2010 Reserves &ECR
0
10
20
30
40
50
60
70
P1
P2
P3
P1
P2
P3
C1
C2
C3
90%
50%
10%
Technical Certainty
C319.8
C216.7
C120.0
P3Possible
4.1
P2Probable
8.7
P1Proved
14.3
Growing Proved ReservesIncreasing Certainty & Decreasing Risk
2010 Reserves & Economic Contingent Resources (Tcfe)
Technical: 90% 50% 10%Certainty*
Increasing certainty & decreasing risk
*Technical Certainty – Probability that the quantities actually recovered will equal or exceed the estimate
16
0 5 10 15 20
Other
Greater Sierra**
Jonah
Bighorn
CBM
Texas
Horn River
Piceance
Cutbank Ridge*
Haynesville
P1 (Proved)
P2 (Probable)
P3 (Possible)
Reserves
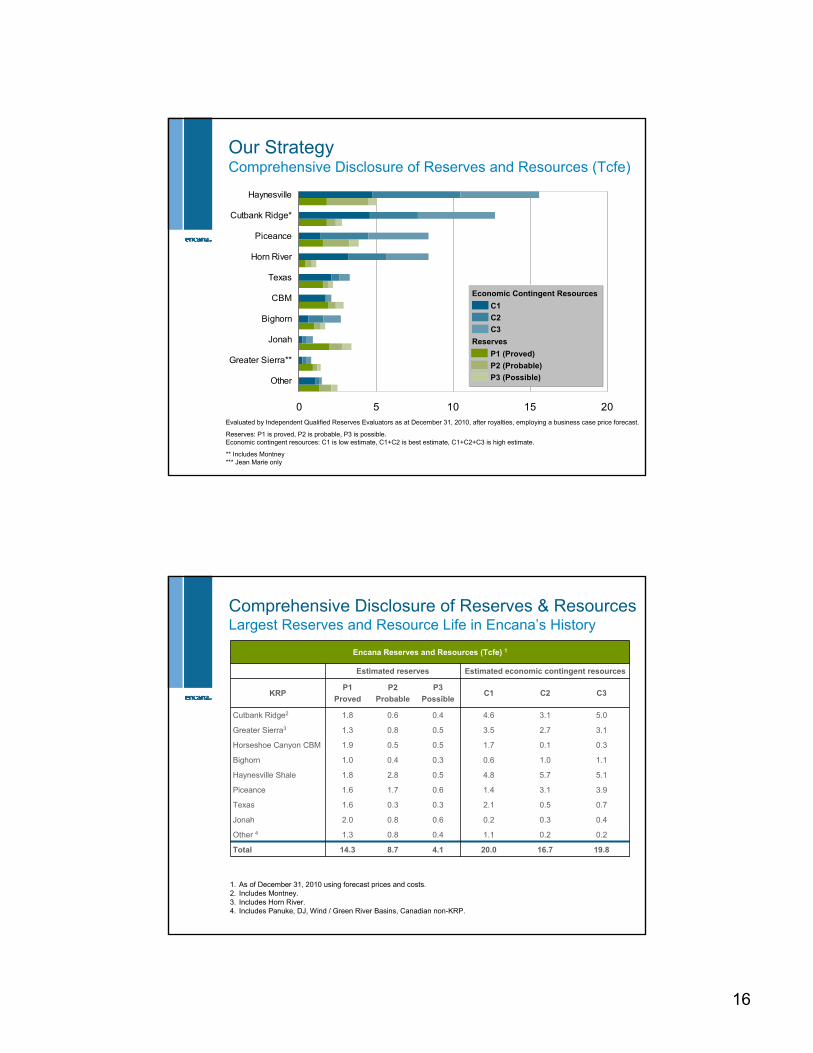
Our StrategyComprehensive Disclosure of Reserves and Resources (Tcfe)
Evaluated by Independent Qualified Reserves Evaluators as at December 31, 2010, after royalties, employing a business case price forecast.
Reserves: P1 is proved, P2 is probable, P3 is possible.Economic contingent resources: C1 is low estimate, C1+C2 is best estimate, C1+C2+C3 is high estimate.
** Includes Montney *** Jean Marie only
C1
C2
C3
Economic Contingent Resources
Comprehensive Disclosure of Reserves & ResourcesLargest Reserves and Resource Life in Encana’s History
19.816.720.04.18.714.3Total
0.20.21.10.40.81.3Other 4
0.40.30.20.60.82.0Jonah
0.70.52.10.30.31.6Texas
3.93.11.40.61.71.6Piceance
5.15.74.80.52.81.8Haynesville Shale
1.11.00.60.30.41.0Bighorn
0.30.11.70.50.51.9Horseshoe Canyon CBM
3.12.73.50.50.81.3Greater Sierra3
5.03.14.60.40.61.8Cutbank Ridge2
C3C2C1P3
Possible
P2
Probable
P1
ProvedKRP
Estimated economic contingent resourcesEstimated reserves
Encana Reserves and Resources (Tcfe) 1
1. As of December 31, 2010 using forecast prices and costs. 2. Includes Montney.3. Includes Horn River.4. Includes Panuke, DJ, Wind / Green River Basins, Canadian non-KRP.
17
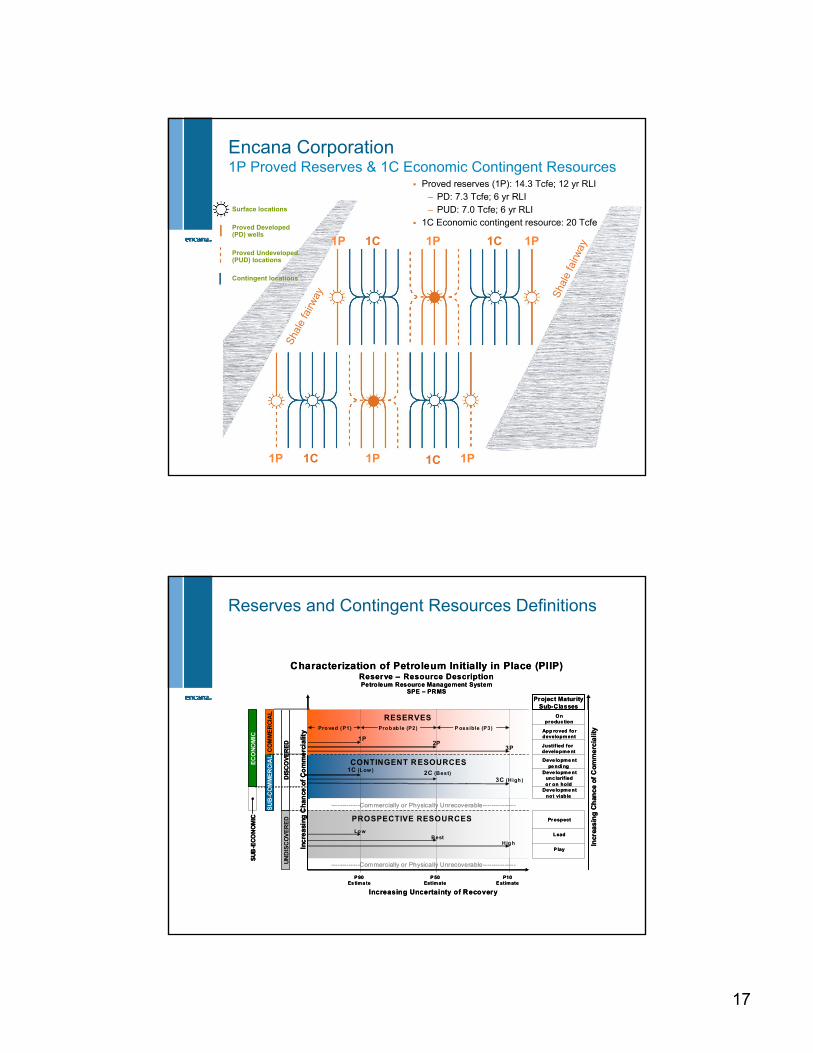
Encana Corporation 1P Proved Reserves & 1C Economic Contingent Resources
Surface locations
Proved Developed (PD) wells
Proved Undeveloped (PUD) locations
Contingent locations
Sha
le fa
irway S
hale
fairw
ay
1P 1P 1P
1P1P1P
1C 1C
1C 1C
Proved reserves (1P): 14.3 Tcfe; 12 yr RLI– PD: 7.3 Tcfe; 6 yr RLI– PUD: 7.0 Tcfe; 6 yr RLI
1C Economic contingent resource: 20 Tcfe
Reserves and Contingent Resources Definitions
Characterization of Petroleum Initially in Place (PIIP)Reserve – Resource DescriptionPetroleum Resource Management System
SPE – PRMS
Deve lopme ntnot viable
Onproduc tion
P lay
Prospect
Lead
Deve lopme ntunc larifiedor on hold
Deve lopme ntpe nding
Justified fordevelopme nt
App roved fordevelopment
Project MaturitySub-Classes
Inc
rea
sing
Ch
an
ce o
f C
om
me
rcia
lity
Increasing Uncertainty of Recovery
PROSPECTIVE RESOURCES
-------------Commercially or Physically Unrecoverable---------------
CONTINGENT R ESOURCES1C (Low ) 2C (Best)
3C (High)
P 90Es tima te
P 50Estimate
P10E stimate
UN
DIS
CO
VE
RE
DD
ISC
OV
ER
ED
SU
B-C
OM
ME
RC
IAL
CO
MM
ER
CIA
L
LowBest
High
SU
B-E
CO
NO
MIC
EC
ON
OM
IC
-------------Commercially or Physically Unrecoverable---------------
Incr
eas
ing
Ch
anc
e o
f C
om
me
rcia
lityP ossible (P3)Probab le (P2)Proved (P1)
RESERVES
1P2P
3P
18
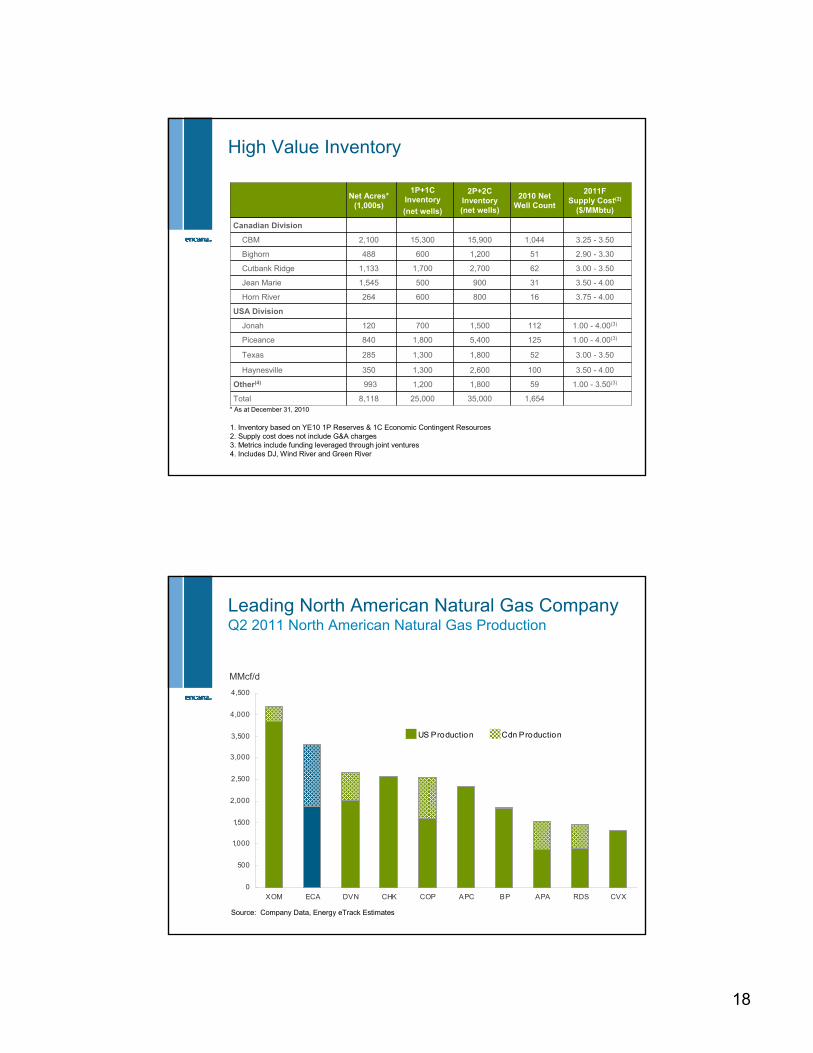
High Value Inventory
35,000
1,800
2,600
1,800
5,400
1,500
800
900
2,700
1,200
15,900
2P+2C Inventory (net wells)
USA Division
Canadian Division
1.00 - 3.50(3)591,200993Other(4)
3.50 - 4.001001,300350Haynesville
3.00 - 3.50521,300285Texas
1.00 - 4.00(3)1251,800840Piceance
1.00 - 4.00(3)112700120Jonah
3.75 - 4.00
3.50 - 4.00
3.00 - 3.50
2.90 - 3.30
3.25 - 3.50
2011FSupply Cost(2)
($/MMbtu)
16600264Horn River
1,65425,0008,118Total
1,545
1,133
488
2,100
Net Acres* (1,000s)
500
1,700
600
15,300
1P+1C Inventory
(net wells)
31Jean Marie
62Cutbank Ridge
51Bighorn
1,044CBM
2010 Net Well Count
1. Inventory based on YE10 1P Reserves & 1C Economic Contingent Resources2. Supply cost does not include G&A charges3. Metrics include funding leveraged through joint ventures4. Includes DJ, Wind River and Green River
* As at December 31, 2010
Source: Company Data, Energy eTrack Estimates
MMcf/d
Leading North American Natural Gas CompanyQ2 2011 North American Natural Gas Production
0
500
1,000
1,500
2,000
2,500
3,000
3,500
4,000
4,500
XOM ECA DVN CHK COP APC BP APA RDS CVX
US Production Cdn Production

19
$0.30
$1.00
$0.50 to 2.00
0
1
2
3
4
5
6
7
9% IRR After Tax incl. G&A Increment from 9% to 15% Land costs
First Mover Advantage Encana Point Forward vs. Industry Full Cycle Supply Costs
$US/MMBtu
Encana Point Forward Supply Cost*
Industry Full Cycle Supply
Cost
*Includes $0.30 G&A; based on weighted average of 2011 forecast portfolio
Encana point forward supply cost
– The flat NYMEX natural gas price
that yields a risked IRR of 9% after
tax; does not include sunk costs,
including land
Encana full cycle land costs typically
< $0.25/MMBtu
Targeting 20-25% improvement
over the next five years
– Implementing resource play hubs
– Achieving economies of scale across
our portfolio
– High-grading portfolio
– Increased capital efficiency
– Expand margins
$3.40
Encana CorporationHighly Economic Development Portfolio
2011F Development Program
Illustrative, based on capital weighted average of development portfolio. Including $0.30 G&A.*Based on March 31, 2011 NYMEX forward strip, excludes hedging.
Exposed to a weighted average NYMEX price of $6.00/MMBtu*
Generates a rate of return of approximately 35%
$/MMBtu
$6.00*
$2
$3
$4
$5
$6
$7
$8
0% 10% 20% 30% 40% 50%
After-Tax Rate of Return
20
PlanningRange
90% Confidence Range
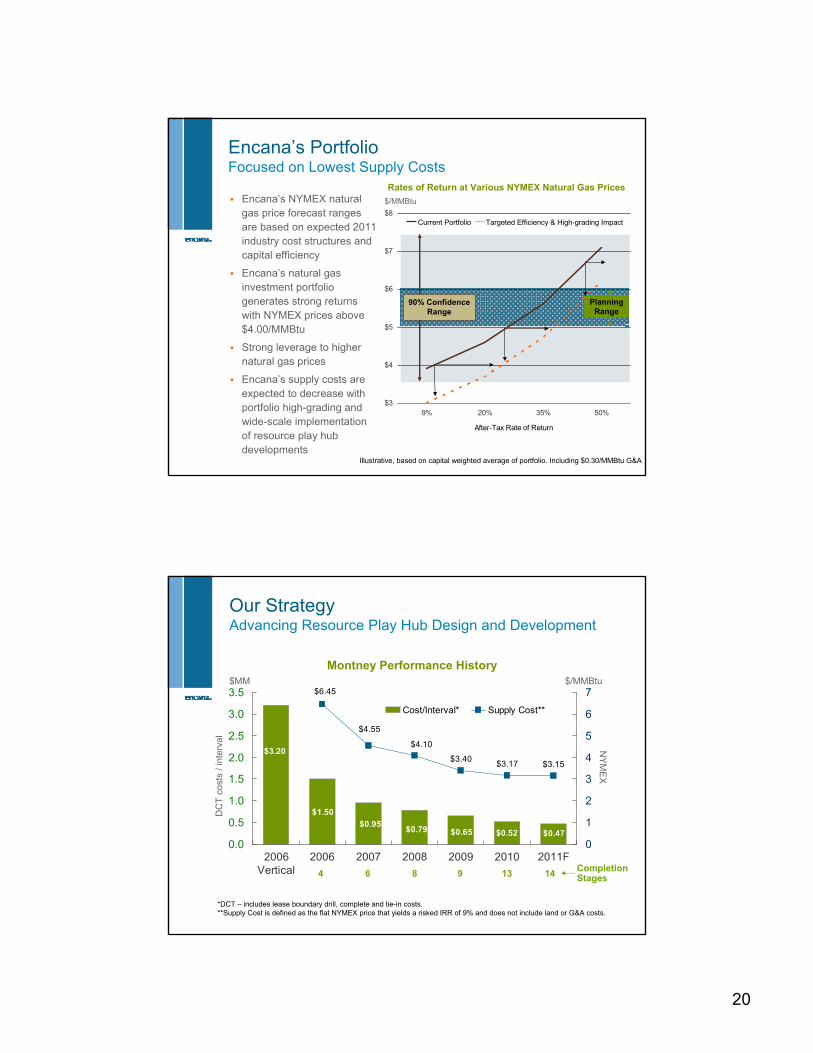
Encana’s PortfolioFocused on Lowest Supply Costs
Rates of Return at Various NYMEX Natural Gas Prices
Illustrative, based on capital weighted average of portfolio. Including $0.30/MMBtu G&A
Encana’s NYMEX natural gas price forecast ranges are based on expected 2011 industry cost structures and capital efficiency
Encana’s natural gas investment portfolio generates strong returns with NYMEX prices above $4.00/MMBtu
Strong leverage to higher natural gas prices
Encana’s supply costs are expected to decrease with portfolio high-grading and wide-scale implementation of resource play hub developments
$/MMBtu
Current Portfolio Targeted Efficiency & High-grading Impact
$3
$4
$5
$6
$7
$8
9% 20% 35% 50%
After-Tax Rate of Return
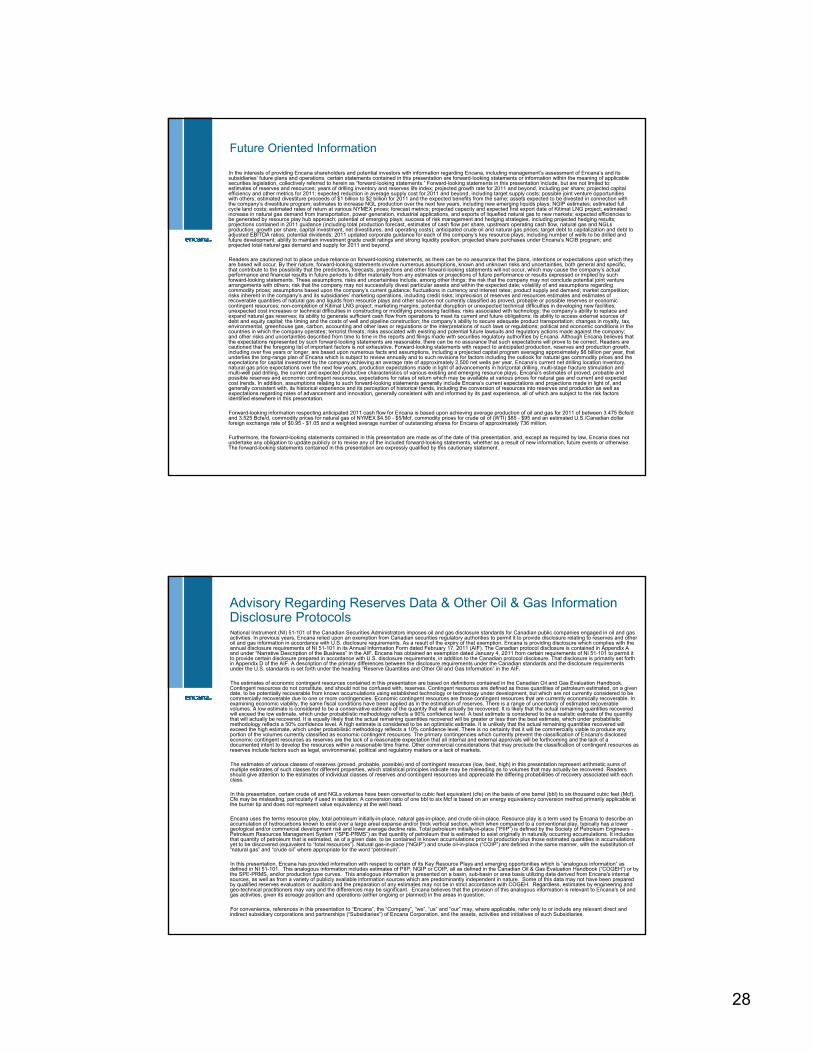
$0.47
$3.20
$0.65 $0.52
$1.50
$0.95$0.79
$3.17 $3.15
$4.10
$6.45
$4.55
$3.40
0.0
0.5
1.0
1.5
2.0
2.5
3.0
3.5
2006Vertical
2006 2007 2008 2009 2010 2011F0
1
2
3
4
5
6
7
Cost/Interval* Supply Cost**
Our StrategyAdvancing Resource Play Hub Design and Development
$/MMBtu$MM
*DCT – includes lease boundary drill, complete and tie-in costs.**Supply Cost is defined as the flat NYMEX price that yields a risked IRR of 9% and does not include land or G&A costs.
4 6 8 9 13Completion Stages14
Montney Performance History
DC
T c
osts
/ in
terv
alN
YM
EX

21
*Supply Cost is defined as the flat NYMEX natural gas price that yields a risked IRR of 9% after tax and does not include land costs.
Operating Efficiency2011 Development Program – Forecast Metrics
~3.70Supply Cost* ($/MMBtu)
~5,000Production Efficiency ($/Mcfe/d)
>0.3Profit to Investment Ratio (PIR) @ 9%
>1.0Profit to Investment Ratio (PIR) @ 0%
>20%Internal Rate of Return (IRR, %)
TargetMetric
0%
1%
2%
3%
ECA TLM CHK DVN EOG APA APC0%
1%
2%
3%
4%
5%
ECA S&P/TSXUtilities
S&P/TSXEnergy
S&P/TSXComp
S&P/TSX60
CAD 5-yrbond
CAD 1-mth T-Bill
Attractive Dividend, Strong YieldQ2 2011 Quarterly Dividend of $0.20/Share
Yields at July 26, 2011Source: Bloomberg

22
APA EOG DVN ECA TLM NXY APC SWN CHK HK
S&P Moody’s
Indicates ratings below investment gradeAAA Aaa
AA+ Aa1
AA Aa2
AA- Aa3
A+ A1
A A2
A- A3
BBB+ Baa1
BBB Baa2
BBB- Baa3
BB+ Ba1
BB Ba2
BB- Ba3
B+ B1
B B2
Credit Rating ComparisonAs at June 30, 2011
Source: company reports.
0%
10%
20%
30%
40%
50%
60%
APA SWN DVN TLM EOG ECA NXY APC CHK HK .0x
1.0x
2.0x
3.0x
4.0x
SWN APA TLM NXY EOG DVN APC ECA CHK HK
Total Debt to Adjusted EBITDA
Capital Discipline – Q2, 2011
Total Debt to Capitalization
*All debt & 12 month trailing EBITDA as at June 30, 2011
Source: company reports
Encana Target Ratio: less than 40%
Encana Target Ratio: less than 2.0x

23
Encana DD&A & ROCECanadian and U.S. GAAP Reconciliation*
1.75
2.65
3%
7%
(232)
8
(24)
366
(582)
(232)
254
22
YTDJune 30, 2011
16%-22%17%U.S. GAAP
6%8%20%Canadian GAAP/IFRS
Return on average capital employed (ROCE)
Resulting DD&A ($/Mcfe) Difference
-3,378695Tax rate changes and effect of items above (related to ceiling test)
(81)134(74)Other
$2.66DD&A - Canadian GAAP/IFRS
1,173(7,414)(1,134)Difference
88317213Lower DD&A rates under U.S. GAAP from accumulated impairments
371(11,098)(1,768)Impairment on PP&E from ceiling test
Differences Explained
1,173(7,414)(1,134)Difference
$1.58DD&A - U.S. GAAP
1,1701,8625,944Canadian GAAP/IFRS
2,343(5,552)4,810U.S. GAAP
201020092008Net Earnings ($ millions)
2008 & 2009 are Encana consolidated results. 2010 DD&A rates based on 2010 annualized production of 1.2 Tcfe.*2008 & 2009 are based on Canadian GAAP; 2010 and 2011 YTD are based on International Financial Reporting Standards (IFRS)
Strong ExecutionQ2 2011 Results
Total production of 3.5Bcfe/d
Natural gas production of 3.3 Bcf/d
Cash flow of $1.1 billion ($1.47/share diluted)
Operating earnings of $166million ($0.22/share diluted)
Annual dividend of $0.80/share*
*Dividends are paid at the discretion of the Board.

24
Committed to Responsible Development
Encana’s commitment– People
– Safety
– Environment
– Engagement
– Community Investment
Encana actively working with regulators to:
– Increase transparency
– Improve public education
– Achieve higher safety standards
– Reduce surface footprint
– Lower carbon footprint
Safe operations
Maintain license to operate
Advance oil plays
Accelerate development through third party funding
Advance innovation and technology
Establish long-term strategic partnerships with service providers
USA Division
Strategic Focus
Encana Land (Dec. 31, 2010)
Total USA Division Net Acres: 2.6 MM
Jonah
Piceance
NiobraraDJ Basin
Texas Haynesville Shale
Collingwood Shale
Resource Play
Emerging Play
Jonah2011F 500 MMcfe/d
Texas 2011F 375 MMcfe/d
Piceance 2011F 450 MMcfe/d Haynesville
2011F 505 MMcfe/d
Tuscaloosa

25
Strategic Focus Operate safely with minimal
environmental impact
Deliver high return growth
Leverage technology advancements and operational efficiencies to lower capital costs
Actively manage portfolio to maximize value
Secure license to operate
Fully integrated supply management strategy
Create/accelerate value through JV activity
Canadian Division
Encana Land (Dec. 31, 2010)
Total Canadian Division Net Acres: 9.1 MM
Horn River Greater Sierra
Montney Cutbank Ridge
Bighorn
CBM
Resource Play
Emerging Play
Duvernay
Greater Sierra 2011F 260 MMcfe/d
Bighorn 2011F 255 MMcfe/d
Cutbank Ridge2011F 510 MMcfe/d
CBM 2011F 455 MMcfe/d
Electric Power41%
Industrial20%
Residential7%
Transportation28%
Commercial4%
80 Bcfe/d
117 Bcfe/d
Electric Power31%
Industrial31%
Residential22% Transportation
1%
Commercial15%
*U.S. data is as of 2010; Canadian data is as of 2008. Source: EIA, Natural Resources Canada, Encana.
Natural gas accounts for 25% of total Bcfe/d North American energy consumption
Natural Gas Consumption ~72 Bcfe/d
Total Input Energy Consumption ~288 Bcfe/d
Encana’s Vision for the Future Vast Displacement Potential for Natural Gas

26
0
50
100
150
200
250
300
350
Current Energy Use Current Natural GasConsumption
2020F Consumption 2030F Consumption
Residential Commercial Industrial Electric Power Transportation
*U.S. data is as of 2010; Canadian data is as of 2008. Assumes 1% CAGR in energy growth.Source: EIA, Natural Resources Canada, Encana. Assumes 55 GW of coal displacement by 2020 (high case).
Bcfe/d288 Bcfe/d
72 Bcfe/d
88 Bcfe/d
110 Bcfe/d
Plus ~16 Bcfe/d
Plus ~22 Bcfe/d
Natural gas grows to 110 Bcfe/d or ~30% to 35% of total North American energy consumption by 2030F
Encana’s Vision for the Future Incremental Canada and U.S. Consumption of 38 Bcfe/d
Natural Gas OpportunityAbundant, Affordable & Beneficial Attributes
North American natural gas supply (& demand) could increase by approximately 25 Bcf/d
64 70
62
57
2
0
20
40
60
80
100
120
Coal Natural Gas Oil
LNG
Bcfe/d
Sources of daily energy production in North America
Emissions level by fuel type (lbs/BBtu)
CO2
CO2
CO2
SO2
SO2
SO2
0
50,000
100,000
150,000
200,000
250,000
Coal Oil Natural Gas0
500
1,000
1,500
2,000
2,500
3,000
CO2 SO2
Source: EIA, Statistics Canada
OffContinent
Continental
Over 20% less expensive than current North American gasoline or diesel

27
Natural Gas Demand Advocacy in Canada & USAEconomic and Environmental Benefits of Natural Gas
Trade Organization Leadership– Member of ANGA, CNGI, NGVA, CNGVA,
CNGVC, WNGIC
– Formed Clean American Transportation Alliance (ANGA & AGA)
Government Relations– Working with federal, provincial and state
governments to develop policy that will promote increased use of natural gas for power generation and transportation markets
LNG & CNG Projects – Two mini-liquefaction projects (Alberta &
Colorado)
Up to 13,000 LNG gallons/day – fuel for ~ 150 Class 8 trucks
– CNG for Encana operations
Five stations commenced & 53 trucks converted in 2010
Nine drilling rigs fueled by natural gas
Natural Gas Challenges & Opportunities
The natural gas industry must be advocates for increased usage of clean natural gas in North America
– Expanded use for power generation
– Develop a natural gas for transportation fuel strategy
– Remove barriers to expanded natural gas usage, and prevent new barriers from being put in place
28
In the interests of providing Encana shareholders and potential investors with information regarding Encana, including management’s assessment of Encana’s and its subsidiaries’ future plans and operations, certain statements contained in this presentation are forward-looking statements or information within the meaning of applicable securities legislation, collectively referred to herein as “forward-looking statements.” Forward-looking statements in this presentation include, but are not limited to: estimates of reserves and resources; years of drilling inventory and reserves life index; projected growth rate for 2011 and beyond, including per share; projected capital efficiency and other metrics for 2011; expected reduction in average supply cost for 2011 and beyond, including target supply costs; possible joint venture opportunities with others; estimated divestiture proceeds of $1 billion to $2 billion for 2011 and the expected benefits from the same; assets expected to be divested in connection with the company’s divestiture program; estimates to increase NGL production over the next few years, including new emerging liquids plays; NGIP estimates; estimated full cycle land costs; estimated rates of return at various NYMEX prices; forecast metrics; projected capacity and expected first export date of Kitimat LNG project; estimated increase in natural gas demand from transportation, power generation, industrial applications, and exports of liquefied natural gas to new markets; expected efficiencies to be generated by resource play hub approach; potential of emerging plays; success of risk management and hedging strategies, including projected hedging results; projections contained in 2011 guidance (including total production forecast, estimates of cash flow per share, upstream operating cash flow, natural gas and NGLs production, growth per share, capital investment, net divestitures, and operating costs); anticipated crude oil and natural gas prices; target debt to capitalization and debt to adjusted EBITDA ratios; potential dividends; 2011 updated corporate guidance for each of the company’s key resource plays, including number of wells to be drilled and future development; ability to maintain investment grade credit ratings and strong liquidity position; projected share purchases under Encana’s NCIB program; and projected total natural gas demand and supply for 2011 and beyond.
Readers are cautioned not to place undue reliance on forward-looking statements, as there can be no assurance that the plans, intentions or expectations upon which they are based will occur. By their nature, forward-looking statements involve numerous assumptions, known and unknown risks and uncertainties, both general and specific, that contribute to the possibility that the predictions, forecasts, projections and other forward-looking statements will not occur, which may cause the company’s actual performance and financial results in future periods to differ materially from any estimates or projections of future performance or results expressed or implied by such forward-looking statements. These assumptions, risks and uncertainties include, among other things: the risk that the company may not conclude potential joint venture arrangements with others; risk that the company may not successfully divest particular assets and within the expected date; volatility of and assumptions regarding commodity prices; assumptions based upon the company’s current guidance; fluctuations in currency and interest rates; product supply and demand; market competition; risks inherent in the company’s and its subsidiaries’ marketing operations, including credit risks; imprecision of reserves and resources estimates and estimates of recoverable quantities of natural gas and liquids from resource plays and other sources not currently classified as proved, probable or possible reserves or economic contingent resources; non-completion of Kitimat LNG project; marketing margins; potential disruption or unexpected technical difficulties in developing new facilities; unexpected cost increases or technical difficulties in constructing or modifying processing facilities; risks associated with technology; the company’s ability to replace and expand natural gas reserves; its ability to generate sufficient cash flow from operations to meet its current and future obligations; its ability to access external sources of debt and equity capital; the timing and the costs of well and pipeline construction; the company’s ability to secure adequate product transportation; changes in royalty, tax, environmental, greenhouse gas, carbon, accounting and other laws or regulations or the interpretations of such laws or regulations; political and economic conditions in the countries in which the company operates; terrorist threats; risks associated with existing and potential future lawsuits and regulatory actions made against the company; and other risks and uncertainties described from time to time in the reports and filings made with securities regulatory authorities by Encana. Although Encana believes that the expectations represented by such forward-looking statements are reasonable, there can be no assurance that such expectations will prove to be correct. Readers are cautioned that the foregoing list of important factors is not exhaustive. Forward-looking statements with respect to anticipated production, reserves and production growth, including over five years or longer, are based upon numerous facts and assumptions, including a projected capital program averaging approximately $6 billion per year, that underlies the long-range plan of Encana which is subject to review annually and to such revisions for factors including the outlook for natural gas commodity prices and the expectations for capital investment by the company achieving an average rate of approximately 2,500 net wells per year, Encana’s current net drilling location inventory, natural gas price expectations over the next few years, production expectations made in light of advancements in horizontal drilling, multi-stage fracture stimulation and multi-well pad drilling, the current and expected productive characteristics of various existing and emerging resource plays, Encana’s estimates of proved, probable and possible reserves and economic contingent resources, expectations for rates of return which may be available at various prices for natural gas and current and expected cost trends. In addition, assumptions relating to such forward-looking statements generally include Encana’s current expectations and projections made in light of, and generally consistent with, its historical experience and its perception of historical trends, including the conversion of resources into reserves and production as well as expectations regarding rates of advancement and innovation, generally consistent with and informed by its past experience, all of which are subject to the risk factors identified elsewhere in this presentation.
Forward-looking information respecting anticipated 2011 cash flow for Encana is based upon achieving average production of oil and gas for 2011 of between 3.475 Bcfe/d and 3.525 Bcfe/d, commodity prices for natural gas of NYMEX $4.50 - $5/Mcf, commodity prices for crude oil of (WTI) $85 - $95 and an estimated U.S./Canadian dollar foreign exchange rate of $0.95 - $1.05 and a weighted average number of outstanding shares for Encana of approximately 736 million.
Furthermore, the forward-looking statements contained in this presentation are made as of the date of this presentation, and, except as required by law, Encana does not undertake any obligation to update publicly or to revise any of the included forward-looking statements, whether as a result of new information, future events or otherwise. The forward-looking statements contained in this presentation are expressly qualified by this cautionary statement.
Future Oriented Information
National Instrument (NI) 51-101 of the Canadian Securities Administrators imposes oil and gas disclosure standards for Canadian public companies engaged in oil and gas activities. In previous years, Encana relied upon an exemption from Canadian securities regulatory authorities to permit it to provide disclosure relating to reserves and other oil and gas information in accordance with U.S. disclosure requirements. As a result of the expiry of that exemption, Encana is providing disclosure which complies with the annual disclosure requirements of NI 51-101 in its Annual Information Form dated February 17, 2011 (AIF). The Canadian protocol disclosure is contained in Appendix A and under “Narrative Description of the Business” in the AIF. Encana has obtained an exemption dated January 4, 2011 from certain requirements of NI 51-101 to permit it to provide certain disclosure prepared in accordance with U.S. disclosure requirements, in addition to the Canadian protocol disclosure. That disclosure is primarily set forth in Appendix D of the AIF. A description of the primary differences between the disclosure requirements under the Canadian standards and the disclosure requirements under the U.S. standards is set forth under the heading “Reserve Quantities and Other Oil and Gas Information” in the AIF.
The estimates of economic contingent resources contained in this presentation are based on definitions contained in the Canadian Oil and Gas Evaluation Handbook. Contingent resources do not constitute, and should not be confused with, reserves. Contingent resources are defined as those quantities of petroleum estimated, on a given date, to be potentially recoverable from known accumulations using established technology or technology under development, but which are not currently considered to be commercially recoverable due to one or more contingencies. Economic contingent resources are those contingent resources that are currently economically recoverable. In examining economic viability, the same fiscal conditions have been applied as in the estimation of reserves. There is a range of uncertainty of estimated recoverable volumes. A low estimate is considered to be a conservative estimate of the quantity that will actually be recovered. It is likely that the actual remaining quantities recovered will exceed the low estimate, which under probabilistic methodology reflects a 90% confidence level. A best estimate is considered to be a realistic estimate of the quantity that will actually be recovered. It is equally likely that the actual remaining quantities recovered will be greater or less than the best estimate, which under probabilistic methodology reflects a 50% confidence level. A high estimate is considered to be an optimistic estimate. It is unlikely that the actual remaining quantities recovered will exceed the high estimate, which under probabilistic methodology reflects a 10% confidence level. There is no certainty that it will be commercially viable to produce any portion of the volumes currently classified as economic contingent resources. The primary contingencies which currently prevent the classification of Encana's disclosed economic contingent resources as reserves are the lack of a reasonable expectation that all internal and external approvals will be forthcoming and the lack of a documented intent to develop the resources within a reasonable time frame. Other commercial considerations that may preclude the classification of contingent resources as reserves include factors such as legal, environmental, political and regulatory matters or a lack of markets.
The estimates of various classes of reserves (proved, probable, possible) and of contingent resources (low, best, high) in this presentation represent arithmetic sums of multiple estimates of such classes for different properties, which statistical principles indicate may be misleading as to volumes that may actually be recovered. Readers should give attention to the estimates of individual classes of reserves and contingent resources and appreciate the differing probabilities of recovery associated with each class.
In this presentation, certain crude oil and NGLs volumes have been converted to cubic feet equivalent (cfe) on the basis of one barrel (bbl) to six thousand cubic feet (Mcf). Cfe may be misleading, particularly if used in isolation. A conversion ratio of one bbl to six Mcf is based on an energy equivalency conversion method primarily applicable at the burner tip and does not represent value equivalency at the well head.
Encana uses the terms resource play, total petroleum initially-in-place, natural gas-in-place, and crude oil-in-place. Resource play is a term used by Encana to describe an accumulation of hydrocarbons known to exist over a large areal expanse and/or thick vertical section, which when compared to a conventional play, typically has a lower geological and/or commercial development risk and lower average decline rate. Total petroleum initially-in-place (“PIIP”) is defined by the Society of Petroleum Engineers -Petroleum Resources Management System (“SPE-PRMS”) as that quantity of petroleum that is estimated to exist originally in naturally occurring accumulations. It includes that quantity of petroleum that is estimated, as of a given date, to be contained in known accumulations prior to production plus those estimated quantities in accumulations yet to be discovered (equivalent to “total resources”). Natural gas-in-place (“NGIP”) and crude oil-in-place (“COIP”) are defined in the same manner, with the substitution of “natural gas” and “crude oil” where appropriate for the word “petroleum”.
In this presentation, Encana has provided information with respect to certain of its Key Resource Plays and emerging opportunities which is “analogous information” as defined in NI 51-101. This analogous information includes estimates of PIIP, NGIP or COIP, all as defined in the Canadian Oil & Gas Evaluation Handbook (“COGEH”) or by the SPE-PRMS, and/or production type curves. This analogous information is presented on a basin, sub-basin or area basis utilizing data derived from Encana's internal sources, as well as from a variety of publicly available information sources which are predominantly independent in nature. Some of this data may not have been prepared by qualified reserves evaluators or auditors and the preparation of any estimates may not be in strict accordance with COGEH. Regardless, estimates by engineering and geo-technical practitioners may vary and the differences may be significant. Encana believes that the provision of this analogous information is relevant to Encana's oil and gas activities, given its acreage position and operations (either ongoing or planned) in the areas in question.
For convenience, references in this presentation to “Encana”, the “Company”, “we”, “us” and “our” may, where applicable, refer only to or include any relevant direct and indirect subsidiary corporations and partnerships (“Subsidiaries”) of Encana Corporation, and the assets, activities and initiatives of such Subsidiaries.
Advisory Regarding Reserves Data & Other Oil & Gas InformationDisclosure Protocols

2011F ENCANA CORPORATE GUIDANCEUS$, US Protocols
June 21, 2011
2011F
Cash Flow ($ billions, except per share amounts)
Total Cash Flow(1)(2)(3) 4.0 - 4.3- per common share, diluted ($/share) 5.40 - 5.90
Upstream Operating Cash Flow (1)(4) 4.6 - 4.9
Production (after royalties)
Natural Gas (MMcf/d) 3,350 - 3,400
Oil and NGLs (Mbbls/d) 21
Total (MMcfe/d, 6:1) 3,475 - 3,525
Annual Percentage Growth Per Share(5) 5% - 7%
Weighted Average Common Shares Outstanding - Basic (millions) 736
Capital Investment ($ billions)
Upstream 4.4
Market Optimization & Corporate 0.3
Capital Investment 4.6 - 4.8
Net Divestitures 1.0 - 2.0
(2) Forecast includes an allowance for a modest cash tax recovery. Further information on income tax can be found in Note 9 of the Annual Consolidated Financial Statements
dated December 31, 2010.
(3) Cash flow is a non-GAAP measure defined as Cash from Operating Activities excluding net change in other assets and liabilities and net change in non-cash working capital.(4) Operating Cash Flow is a non-GAAP measure and is defined as Gross Revenues less; Royalties, Production and Mineral Taxes, Transportation, Operating Expenses and costs of Product Purchased. This measure has been described and presented in this guidance in order to provide shareholders and potential investors with additional information regarding Encana's liquidity and its ability to generate funds to finance its operations.(5) Based on forecast production per day divided by Weighted Average Outstanding Basic Common Shares versus prior year.
(1) 2011 guidance based on NYMEX of $4.50/Mcf to $5.00/Mcf, WTI of $85.00/bbl to $95.00/bbl and a U.S./Canadian dollar exchange rate of $0.95 to $1.05.
2011F Corporate GuidanceJune 2011, Page 1

2011F Encana Corporate Guidance cont'd….
2011F
Operating Costs (annual average)
Total Operating and Administrative Costs ($/Mcfe) 1.15 - 1.20
OtherDD&A, Upstream ($/Mcfe) 2.60 - 2.65
Sensitivities(3) ($ millions)
$0.50/Mcf increase in the NYMEX natural gas price 220 170 $0.50/Mcf decrease in the NYMEX natural gas price (220) (170) $0.05 decrease in the U.S./Canadian dollar exchange rate 10 100
(1) Operating earnings is a non-GAAP measure. Operating Earnings is defined as Net Earnings excluding non-recurring or non-cash items that Management believes reduces the comparability of the Company's financial performance between periods. These after-tax items may include, but are not limited to, unrealized hedging gains/losses, exploration and evaluation expenses, impairments and impairment reversals, gains/losses on divestitures, foreign exchange gains/losses and the effect of changes in statutory income tax rates. (2) Cash Flow is a non-GAAP measure. Please refer to footnote 3 on page 1 of this guidance.(3) Full year 2011 sensitivities based on approximated hedge positions as at January 31, 2011.
Operating Earnings(1)Cash Flow(2)
ADVISORY: In the interests of providing Encana Corporation (“Encana” or the “Company”) shareholders and potential investors with information regarding Encana, including Management’sassessment of future plans and operations relating to Encana, this document contains certain statements and information that are forward-looking statements or information within themeaning of applicable securities legislation, and which are collectively referred to herein as “forward-looking statements". Forward-looking statements in this document include, but are notlimited to, statements and tables (collectively “statements”) with respect to projected 2011 production and capital expenditures.
Readers are cautioned not to place undue reliance on forward-looking statements, as there can be no assurance that the plans, intentions or expectations upon which they are based willoccur. By their nature, forward-looking statements involve numerous assumptions, known and unknown risks and uncertainties, both general and specific, that contribute to the possibilitythat the predictions, forecasts, projections and other forward-looking statements will not occur, which may cause the Company’s actual performance and financial results in future periods todiffer materially from any estimates or projections of future performance or results expressed or implied by such forward-looking statements. These assumptions, risks and uncertaintiesinclude, among other things: volatility of and assumptions regarding commodity prices; assumptions based upon the Company’s current guidance; fluctuations in currency and interest rates;product supply and demand; market competition; risks inherent in the Company’s and its subsidiaries’ marketing operations, including credit risks; imprecision of reserves and resourcesestimates and estimates of recoverable quantities of natural gas and liquids from resource plays and other sources not currently classified as proved, probable or possible reserves oreconomic contingent resources; marketing margins; potential disruption or unexpected technical difficulties in developing new facilities; unexpected cost increases or technical difficulties inconstructing or modifying processing facilities; risks associated with technology; the Company’s ability to replace and expand natural gas reserves; its ability to generate sufficient cash flowfrom operations to meet its current and future obligations; its ability to access external sources of debt and equity capital; the timing and the costs of well and pipeline construction; theCompany’s ability to secure adequate product transportation; changes in royalty, tax, environmental, greenhouse gas, carbon, accounting and other laws or regulations or the interpretationsof such laws or regulations; political and economic conditions in the countries in which the Company operates; terrorist threats; risks associated with existing and potential future lawsuits andregulatory actions made against the Company; and other risks and uncertainties described from time to time in the reports and filings made with securities regulatory authorities by Encana.Although Encana believes that the expectations represented by such forward-looking statements are reasonable, there can be no assurance that such expectations will prove to be correct.Readers are cautioned that the foregoing list of important factors is not exhaustive. In addition, assumptions relating to such forward-looking statements generally include Encana’s currentexpectations and projections made in light of, and generally consistent with, its historical experience and its perception of historical trends, including the conversion of resources intoreserves and production as well as expectations regarding rates of advancement and innovation, generally consistent with and informed by its past experience, all of which are subject to therisk factors identified elsewhere in this document.
Furthermore, the forward-looking statements contained in this document are made as of the date of this document, and, except as required by law, Encana does not undertake any obligationto update publicly or to revise any of the included forward-looking statements, whether as a result of new information, future events or otherwise. The forward-looking statements contained inthis document are expressly qualified by this cautionary statement.
2011F Corporate GuidanceJune 2011, Page 2

2011F Key Resource Play InformationApril 20, 2011
Production CapitalWells
Planned
(MMcfe/d) ($MM) (#) Jonah 500 280 70 Piceance 450 525 165 Texas 375 340 60 Haynesville 505 980 85 Greater Sierra(1) 260 350 30 Cutbank Ridge(1) 510 610 70 Bighorn 255 435 70 CBM 455 340 450 Key Resource Play Total 3,310 3,860 1,000
USA Division Emerging Resource Plays 115 140 70 Canadian Division Emerging Resource Plays - 90 5 Deep Panuke 35 100 -
Other (2) 15 - 65 410 - 610 - Total Company 3,475 - 3,525 4,600 - 4,800 1,075
(1) Greater Sierra includes Horn River and Cutbank Ridge includes Montney.
(2) Other capital includes non-KRP producing and non-producing properties as well as Market Optimization and Corporate.
ADVISORY: In the interests of providing Encana Corporation (“Encana” or the “Company”) shareholders and potential investors with information regarding Encana, including Management’sassessment of future plans and operations relating to Encana, this document contains certain statements and information that are forward-looking statements or information within the meaning ofapplicable securities legislation, and which are collectively referred to herein as “forward-looking statements". Forward-looking statements in this document include, but are not limited to,statements and tables (collectively “statements”) with respect to: projected 2011 production, capital expenditures and wells planned and allocations thereof by key resource play.
Readers are cautioned not to place undue reliance on forward-looking statements, as there can be no assurance that the plans, intentions or expectations upon which they are based will occur. Bytheir nature, forward-looking statements involve numerous assumptions, known and unknown risks and uncertainties, both general and specific, that contribute to the possibility that the predictions,forecasts, projections and other forward-looking statements will not occur, which may cause the Company’s actual performance and financial results in future periods to differ materially from anyestimates or projections of future performance or results expressed or implied by such forward-looking statements. These assumptions, risks and uncertainties include, among other things: the riskthat the Company may not conclude potential joint venture arrangements with PetroChina, their affiliates or others; volatility of and assumptions regarding commodity prices; assumptions basedupon the Company’s current guidance; fluctuations in currency and interest rates; product supply and demand; market competition; risks inherent in the Company’s and its subsidiaries’ marketingoperations, including credit risks; imprecision of reserves and resources estimates and estimates of recoverable quantities of natural gas and liquids from resource plays and other sources notcurrently classified as proved, probable or possible reserves or economic contingent resources; marketing margins; potential disruption or unexpected technical difficulties in developing newfacilities; unexpected cost increases or technical difficulties in constructing or modifying processing facilities; risks associated with technology; the Company’s ability to replace and expand naturalgas reserves; its ability to generate sufficient cash flow from operations to meet its current and future obligations; its ability to access external sources of debt and equity capital; the timing and thecosts of well and pipeline construction; the Company’s ability to secure adequate product transportation; changes in royalty, tax, environmental, greenhouse gas, carbon, accounting and other lawsor regulations or the interpretations of such laws or regulations; political and economic conditions in the countries in which the Company operates; terrorist threats; risks associated with existingand potential future lawsuits and regulatory actions made against the Company; and other risks and uncertainties described from time to time in the reports and filings made with securitiesregulatory authorities by Encana. Although Encana believes that the expectations represented by such forward-looking statements are reasonable, there can be no assurance that suchexpectations will prove to be correct. Readers are cautioned that the foregoing list of important factors is not exhaustive. In addition, assumptions relating to such forward-looking statementsgenerally include Encana’s current expectations and projections made in light of, and generally consistent with, its historical experience and its perception of historical trends, including theconversion of resources into reserves and production as well as expectations regarding rates of advancement and innovation, generally consistent with and informed by its past experience, all ofwhich are subject to the risk factors identified elsewhere in this document.
Furthermore, the forward-looking statements contained in this document are made as of the date of this document, and, except as required by law, Encana does not undertake any obligation toupdate publicly or to revise any of the included forward-looking statements, whether as a result of new information, future events or otherwise. The forward-looking statements contained in thisdocument are expressly qualified by this cautionary statement.
2011F Key Resource Play InformationApril 2011, Page 1

Investor Relations Contacts
Ryder McRitchie | Vice-President, Investor Relations403.645.2007 | [email protected]
Lorna Klose | Manager, Investor Relations403.645.6977 | [email protected]