Enabling communications that empower your enterprise.BLAC ...
98
Black Box Corporation 2013 Annual Report 2013 Annual Report Enabling communications that empower your enterprise.
Transcript of Enabling communications that empower your enterprise.BLAC ...

Black Box Corporation (NASDAQ Global Select: BBOX)Complete life cycle services for today’s integrated communications.
1000 Park Drive l Lawrence, PA 15055 l 724-746-5500 l blackbox.com
© Copyright 2013. Black Box Corporation. All rights reserved.
Bla
ck
Bo
x C
orp
ora
tion
20
13
An
nu
al R
ep
ort
BLACK BOX®
2013 Annual Report
Enabling communications that empower your enterprise.

Innovative solutions for today’s complex communications challenges.
Black Box Corporation (NASDAQ Global Select: BBOX)
Comprehensive Communications System Integration
Black Box is a leading communications system integrator dedicated to designing, sourcing,
implementing and maintaining today’s complex communications solutions.
4,000 Team Members in approximately 200 offices serve more than 175,000 clients in
approximately 150 countries around the world. Black Box operates on five continents
and is headquartered near Pittsburgh in Lawrence, Pennsylvania.
© Copyright 2013. Black Box Corporation. All rights reserved. Printed in U.S.A. Black Box® and the Double Diamond logo are registered trademarks of BB Technologies, Inc. iCOMPEL™, EncrypTight™ and ServSwitch™ are trademarks of BB Technologies, Inc. Any third-party trademarks appearing in this publication are acknowledged to be the property of their respective owners.

(Dollars in Millions, Except Per Share Amounts) 2013 2012 2011
Revenues $ 998 $ 1,088 $ 1,068
Year-over-year change (8%) 2% 11%
Adjusted operating income(1) $ 78 $ 91 $ 103
Adjusted operating income8% 8% 10%
as a % of revenue(1)
Net income (loss) $ 29 $ (248) $ 53
Diluted earnings (loss) per common share $ 1.73 $ (13.98) $ 2.97
Operating net income(1) $ 45 $ 54 $ 59
Operating net income as a % of revenue(1) 5% 5% 5%
Year-over-year change (17%) (8%) 12%
Operating earnings per common share(1) $ 2.67 $ 3.03 $ 3.29
Year-over-year change (12%) (8%) 10%
Cash provided by operating activities $ 47 $ 66 $ 55
Financial Highlights 2013
YEAR AMOUNT
2011 $1,068
2012 $1,088
2013 $998
Revenues (M)
YEAR AMOUNT
2011 $55
2012 $66
2013 $47
Cash Provided by Operating Activities (M)
YEAR AMOUNT
2011 $3.29
2012 $3.03
2013 $2.67
Operating Earnings Per Share (1)
1
(1) Excludes Reconciling Items in Fiscal 2013, Fiscal 2012 and Fiscal 2011. See Non-GAAP Reconciliations.

Dear Fellow Shareholders:I am excited to assume the role of Chief Executive Officer, which was effective on April 1, 2013. I have been with Black Box for nearly 25 years, with roles in business analysis, sales, finance and operations. For 10 years I served as Chief Financial Officer and most recently as President and Chief Operating Officer. It is an honor to be associated with and now to lead a talented organization in an important and growing market. I’d like to use my first CEO letter as an opportunity to share with you my perspectives on our business and my reasons for enthusiasm about our future.
We know that the enterprise communications market is changing rapidly; technology is evolving and competition is fierce. With this in mind, our clients look to Black Box as a partner to solve their complex communications challenges. We have shown that we can be competitive in this market because of the breadth and depth of our product and service platforms that identify, develop and deploy the solutions that our clients need. Our platforms have been built through the vision and hard work of our team over many years. They represent a significant barrier to entry in our markets and serve as the foundation for great change and growth ahead.
FoundationOur business is built based on the following core beliefs about our clients and the markets we serve:
• Enablement: Communication is an organization’s most important process. When we enable it, we create value.
• Independence: Client-focused solutions are better than channel-focused solutions.
• Interoperability: Business leaders will choose best-of-breed solutions and require operational integration.
• Innovation: A dynamic communications market requires partners and processes to adapt and transform.
Our product and service platforms introduce scale, flexibility and leverage to the business, and contain the following key differentiators:
• A diversified client base: We have a diversified client base that ranges from small organizations to many of the world’s largest corporations and institutions. We strive to develop extensive and long-term relationships with high-quality clients because we believe that satisfied clients will demand quality services and product offerings regardless of the economic environment. Also, we believe that our distinctive portfolio of products and services will allow us to introduce additional offerings to satisfied clients. Our clients provide us with new opportunities to create innovative solutions delivered on aggressive timetables at competitive prices. Their business issues make us stronger and provide us with experiences that we can share with others. Our clients’ high expectations are a sign of the respect that we have earned and create opportunities for us to distinguish Black Box from our competitors.
• Key relationships with leading technology partners: We have built long-term relationships with all major communications equipment manufacturers and we are a top partner with the market leaders, including Avaya®, Cisco®, CommScope®, GENBAND™, Mitel®, NEC®, ShoreTel® and Siemens®, among
others. Our job is to challenge them for their best as we work together to solve today’s communications challenges. While we cannot solve these challenges alone, we balance our relationships with our commitment to a client-focused, technology-independent approach. It is one of our greatest strengths.
• Broad geographic footprint: We have built a global footprint of approximately 200 offices serving more than 175,000 clients in approximately 150 countries throughout the world. Our reach is an important attribute of our business, especially for our clients with geographically dispersed facilities.
• Deep organic talent: We have approximately 4,000 team members worldwide, including approximately 300 direct salespeople and 3,000 technicians and engineers who provide our clients with on-site and remote services. Above all else, our team differentiates us from our competition and sets the standard for excellence in customer service. Our level of commitment to the client is fierce and is deeply embedded in the fabric of our organization.
• Strong financial position: We have a stable balance sheet and have generated operating profitability and positive cash flow for 37 consecutive years.
ChangeIn Fiscal 2013, we successfully implemented a management transition. Our new management team undertook a strategic planning initiative that led to the establishment of priorities and programs for growth. The team concluded that the Black Box foundation is strong and gives us great flexibility to attack the market. Our beliefs and differentiators create a solid base upon which we have built our strategy. Our overall business growth strategy includes the following four areas of focus:
• Strengthen and expand our portfolio of high-value communication solutions.
2

Michael McAndrew President and Chief Executive Officer
• Leverage centralized expertise with local skills and relationships.
• Realign organizational structure and incentives.
• Implement a consistent, comprehensive market penetration approach.
These areas of focus have enabled us to look at our business differently. Implementation of our strategy will change our go-to-market approach with our products and services, and change how we manage and deliver them. Our approach will fully utilize the platforms that we have built to provide our core offerings and to introduce additional solutions in higher growth markets that are critical to solving our clients’ evolving communications challenges. We are actively operating programs that reflect these changes and our commitment to this strategy, and they are yielding results.
For example, the in-building wireless market presents an opportunity to drive higher growth. Industry analysts forecast double-digit annual growth rates for solutions that improve access and increase connectivity in wireless environments. Our previous investment in a premier distributed antenna business provides us with the base to expand our position in this fast growing market.
In addition, our portfolio of product and unified communications solutions provide unique opportunities to increase our client penetration and better align our revenue with the market. We are making additional investments in sales and engineering talent to grow these businesses.
Finally, we have identified new, emerging opportunities in the communications space which we believe will generate future growth. You can expect to hear more from us regarding Unified Communications as a Service (UCaaS) and private cloud offerings in Fiscal 2014.
GrowthThe platforms and programs that I have discussed are designed and operated to generate growth—growth in our offerings, opportunities, revenue, profits and cash flow.
Our team understands that the path to creating value for our clients and shareholders is through growth. Our goal is to win market share through differentiation and execution. The four areas of focus in our strategy are a guide for our actions, and will strengthen our organization’s ability to adapt to the rapid changes in our market.
Financial HighlightsAll of our efforts are grounded in financial stewardship. Our financial performance in Fiscal 2013 strengthened our business, and allowed us to invest in our platforms and programs while returning value to our shareholders. For the year, our global team delivered:
• Revenues of $998 million.• Adjusted operating income of $78M.• Net cash provided by operating activities of $47M.
3
We returned $42 million to our shareholders during the year through our dividend and stock repurchase programs. In addition, I am pleased to report that our Board of Directors increased our quarterly dividend by 12.5% in Fiscal 2014. This represents the third consecutive year that the board has increased the dividend by a double-digit percentage.
Looking ForwardI’m very proud of the platforms we have built and I’m excited about the changes and growth ahead. I believe all of the pieces are in place for us to further position Black Box as an indispensable partner to our clients. All that is left is our personal commitment and execution. My team and I are committed to our success, and we know that no one on the planet executes like Black Box. Great success is within our reach and we look forward to driving Black Box to greater and greater heights.
Thank you all for your support and dedication. I am looking forward to a strong performance by our team in Fiscal 2014.

Facts and Figures
Revenues by industryBlack Box serves a diversified client base in both the public and private sectors.
Black Box is committed to
remaining profitable by
running a well-balanced
business, generating
significant positive cash
flow and strategically
investing to expand
market share.
revenuesFiscal Year 2013
4
Government 25%
Financial 6%
Retail 9%
Manufacturing 10%
Business Services 12%
Distribution 4%
Technology 6% Healthcare
13%
Education 4%
Other 6%H
ospitality 2%
Construction 3%

Revenues by client type
Revenues by service type
Revenues by size of client
Revenues by geography
5
North America 86%
Europe 10%
Other 4%
Voice Communications
58%
Data Infrastructure
24%
Technology Products
18%
Large 60%
Small 20%
Medium 20%
End-User 80%
Indirect 20%

Complete Life Cycle Services
At Black Box, we embrace the role of being your indispensable communications partner. We’ll take you from planning through design and implementation to monitoring, management and support.
CompLete Life CyCLe ServiCeS
CompLete Life
CyC
Le S
erv
iCeS
A
sses
s And PlAn desig
n
OPer
Ate A
nd M
AintAin iMPleMent And s
ecu
re
Comprehensive Communications System Integration
empower your communications and your organization with solutions designed to help you succeed.
Whether you’re part of a global enterprise or are a small business owner, Black Box can transform your
organization with innovative communications systems, technologies and services optimized for you.
No matter where you are in your communications life cycle, Black Box can help. We offer complete services and can help you adopt best-of-breed technologies, maintain a hybrid environment and move to unified communications.
Think of Black Box as your indispensible communications partner. We’re dedicated to identifying and bringing new technologies to the forefront. We can guide you through the complex challenges of transitioning from traditional communications to new and dynamic technologies. We’ll help you improve your organization by weaving these technologies into the fabric of your everyday operations.
As a true communications system integrator, we’ll work with you to objectively assess your communications goals and develop a plan on how to achieve the best and most cost-effective system for your environment. Whether your needs involve migrating to unified communications, managing a call center, upgrading infrastructure, deploying enterprise video or sourcing superior technology products, Black Box offers you complete communications solutions, services, products and support.
6
Enabling communications that empower your enterprise.

7
Comprehensive communications solutions. Count on Black Box to help you solve all your communications challenges—large and small—
from enterprise-wide systems to deploying customized technology products and solutions.
• Cabinets and racks• Cabling and infrastructure• Cooling solutions• Data centers• Data communications• Enterprise video communications
• Environmental monitoring• High-performance KVM• Infrastructure hardware• Messaging• Networking • Multimedia communications
• Remanufactured phones• Remote monitoring• Repair and replacement services• Security• Structured cabling• Technology deployments
And more, including:
Digital signage and multimedia
Traditional telephony
Videoconferencing
Wired infrastructure
Network security
Unified communications/UCaaS
Managed services
Contact centers
Mobility
DAS & High-capacity Wi-Fi
” We developed a great relationship with the Black Box team beginning with the preparation of their thorough and complete response to our RFP, and continuing through the current support they provide. We could not have found a better team to work with us through the deployment at six different locations across Oregon and Idaho.”
Gene Thomas, The Amalgamated Sugar Company LLC

Black Box offers you advantages you won’t find anywhere else in the industry: the broadest portfolio
of solutions, a global footprint and deep technical resources.
Comprehensive Communications System Integration
8
Any system: Technology-independent portfolio of solutions.
• Elite partner relationships.• Independent, objective advice. • Interoperable, best-of-breed technologies. With the broadest portfolio of manufacturer partnerships in the industry, we’ll find the solution that’s right for you, not us.
Black Box represents all major manufacturers and is a top partner with the market leaders, including Avaya®, Cisco®, CommScope®, GENBAND™, Mitel®, NEC®, ShoreTel®, Siemens® and more.
Black Box recognizes that your communication needs are dynamic and rapidly changing. That’s why we constantly add new capabilities. Whether your plans include BYOD, cloud computing or other best-of-breed technologies, our technical team works with our clients and partners to design and engineer a communications system that meets your exact requirements. It could be a single-site, single-manufacturer solution or a complex, multi-site, cross-platform solution from multiple manufacturers. In addition, we can support your legacy system(s) during your communications transition.
Why Black Box? Any system. Anywhere. Anytime.
Anywhere: Global footprint.
• Centralized management, local expertise. • Local deployment, operations and maintenance.• 90 U.S. offices; 200 offices worldwide.
Whether you have one office, a campus, a nationwide operation or a global enterprise, Black Box is where you are. Need help? With approximately 200 offices serving approximately 150 countries, including 90 offices across the U.S., we’re there. Why risk working with multiple vendors in multiple locations with multiple results? The solution for worry-free services is Black Box Network Services.
“The Black Box team worked well within our criteria to find a solution which not only modernized our outdated system, but offered a cost-effective solution that can evolve as our firm continues to grow.”
Deborah Bittle, Senior Help Desk Analyst and Telecom Analyst, Gunster Law Firm

9
Featured partners
Aastra®
Amcom® Aspect®
Avaya® AVST® BridgeWaveCisco® CommScope® ComviewConvergys™ GENBAND™
Mitel® Mutare
NEC® PathSolutions™ Polycom® SATMAP ShoreTel® Siemens Enterprise Communications Star2Star® Status SolutionsSunGard®
Symmetrics Toshiba Telecom® Verint®
Black Box partners.
Anytime: 3,000+ technical Black Box team members.
• 24/7 remote and field-deployable support. • Extensive remote and on-site support, management
and monitoring services.• Six Centers of Excellence.• Eight Network Operations Centers.• Maintain 4,000,000+ communications ports. With our 37 years of experience in communications and networking solutions, you can be assured of working with the best trained and most knowledgeable technical people in the business. You’ll work with professional Black Box project managers who oversee and manage every aspect of your job from start to finish and from site to site.
Black Box also boasts 3,000+ technical personnel, including engineers, RF engineers, Registered Communications Distribution Designers (RCCDs) and certified technicians. Our technical personnel can help you with engineering and design, remote system monitoring and on-site technical assistance with one system or multiple systems.
In addition, Black Box has also attained ISO/IEC 20000-1:2011 (IT Service Management Standard) certification and ISO 9001:2008 certification.
Network Operations Centers — 24/7 support. When you need help, you’ll get it, either on the phone or in person. The personnel in our eight Network Operations Centers (NOCs) answer approximately 34,000 calls a month, resolve more than 97% of calls without manufacturer assistance and remotely resolve 72% of trouble calls. In addition, we have the centralized management to quickly coordinate and deploy experts for on-site problem resolution.
NOCs are located in: Amherst, VA Minneapolis, MN Amityville, NY Murfreesboro, TN Brecksville, OH Nashville, TN Houston, TX Pittsburgh, PA
Centers of Excellence — 24/7 support.Black Box boasts six Technology Partner Centers of Excellence (COEs) to better support our customers. They are staffed with partner-certified engineers and technicians and provide our clients with access to advanced communications system engineering, design and training resources. They also support our NOCs with partner-specific issue resolution capabilities.
” Black Box understands both the customer needs as well as the in-building requirements for delivering cellular services. Although VCU Health System had wireless engineers on staff, it relied on Black Box’s expertise of in-building wireless design and deployment.”
Greg Johnson, CTO and Director of Technology and Engineering Services, VCU Health System

Comprehensive Communications System Integration
10
Government Solutions: Serving those who serve.
GSA GSA Schedule 70 # GS-35F-0158J GSA Schedule 70 # GS-35F-0087L GSA Schedule 70 # GS-35F-0905R GSA Schedule 84 # GS-07F-0736X Avaya GSA Schedule # GS-35F-4366G Avaya GSA Schedule # GS-35F-0156V
Prime ContractsGSA Connections II GS00Q12NSD0016GSA Region 3NASA (SEWP IV)NC3A NATO BOAUS Army IMOD W91QUZ06D0027US Army LTLCS W91QUZ-12-D-0011US Army SWA BPAUS Navy SPAWAR COTSUS Navy SeaPort-e
Subcontracts GSA Alliant NETCENTSGTACS SPAWAR TCI PillarITES-2H US Army R2-3GITES-2S VA T4 SPAWAR PAC LANT HQ Global C4ISR (Sea Enterprise II) SPAWAR Telephony & Telecom Maintenance Support Services Black Box GSA listed Technology Products are also available on: NASA (SEWP IV) FAA SAVES NETCENTS DHS FirstSource ARMY CHESS DOD EMALL
Black Box accepts all government purchasing cards. WAWF invoicing.
Communications solutions designed to make government more efficient.
Black Box Network Services delivers complete communications solutions to federal, state and local government agencies. We offer
our government customers the ability to manage large enterprise projects with the agility to be responsive to your special needs.
Whether your mission is to serve the citizenry, protect our borders or defend our country from threats, both foreign and domestic,
we serve those who serve.
Government solutions.•TDM,VoIPandunifiedcommunicationsandcollaborationfor
facility,campus,base,metropolitanandenterprisenetworks.•Communicationsfacilitiesdesignandimplementation.•Completenetworksolutions,includingplanning,design,
installationandmaintenanceofsmall(<1,000nodes) tolarge(>100,000nodes)campus-basednetworks.
•Transport:SONETandDenseWaveDivisionMultiplexing.•PassiveOpticalNetworks(PON/GPON).•VoiceasaService(VaaS)/SoftwareasaService(SaaS).
•Remotevoiceanddatamonitoringservices(RMON).•BusinessContinuityPlan/DisasterRecoveryservices(BCP/DR).•Physicallayer,insideandoutsideplantsystems.•Morethan18,000productsontheGSASchedule.•Same-dayresponsetoGSApricingrequests.•MILspecpackaging.•SmartBundle™servicesforstaging.•Customproducts.

“ Your tech support is the best I’ve ever encountered. Less than five minutes elapsed from the time I requested a call to the time my problem was solved.”
Steven Strouse Engineer/Scientist 5
The Boeing Company
11
Technology Product Solutions for better IT.
Solve today’s complex IT challenges.Improve your IT environment, manage communications and take your network into the future with differentiated, value-added technology solutions for IT and AV communications. Black Box specializes in solutions for:
IT infrastructure.Make data centers greener, workspaces quieter, and networks faster with IT infrastructure from Black Box. Solutions include everything needed to support all types of networks: large and small, corporate and government. Improve infrastructure with standardized and custom-designed equipment including cabinets, carts and racks; copper and fiber cables; panels and connecting hardware; and cooling solutions for data closets, data centers, and harsh environments.
Specialty networking.Extend the reach of your network with the latest hardened, PoE, security and switch technologies. Black Box provides a full range of networking equipment designed for the special requirements of industrial and military networks. Other networking solutions include media conversion, Ethernet extension, and multi-site WAN encryption.
AV, multimedia and digital signage.Distribute and extend video over long distances with professional AV technologies and solutions. Improve communications with visitors, customers and employees with digital signage. Distribute high-quality video over IP networks with Black Box’s unique technology and expertise. For special and unique applications, Black Box’s technical experts can design a one-of-a-kind solution.
High-performance KVM/HD video switching.Manage and control technology with high-performance KVM and HD video and peripheral switching and extension. Typically used in control rooms, broadcasting, and command centers, KVM and HD video switching solutions enable efficient sharing of video signals to screens over short distances and over IP networks for longer distances. Black Box’s strong technical expertise and deep product portfolio can help you transition as technology moves from analog to digital systems. Black Box also has the resources to custom-design complex video solutions.
Extra value services.In addition to specialized and unique technology products, Black Box adds value to your customer experience with custom-product design services, 45-day risk-free purchasing, nearly 100% same-day shipping of in-stock products, and free, 24x7 technical support with U.S.-based experts.

12
Washington Metropolitan Area Transit Authority: IP Camera Network. Five-year IDIQ contract for the design and installation of a complex IP camera network consisting of 7,000 cameras across 90 rail stations in Washington, D.C.
WINN Army Community Hospital, Ft. Stewart/Hunter Army Airfield, GA: Multiple Communications Systems. Upgrade consisting of outside plant, SONET, DWDM, UC-capable voice switch, voice mail, telecommunications management system and site preparation for power upgrades.
Scripps Health System, CA: Wireless. Deployment of Black Box’s InnerWireless 4G distributed antenna system in several new buildings and InnerWireless HD3 high-density wireless LAN in six main hospital facilities.
Marine Corps Base, Camp Pendleton, CA: DWDM and Unified Communications. Black Box received a firm fixed-price contract through GSA Connections II to install and integrate a new Dense Wave Division Multiplexing (DWDM) transport node and an IP-based Unified Capabilities (UC) voice solution for the new Naval Hospital.
Ft. Buchanan, Puerto Rico: VoIP/UC. The U.S. Army awarded Black Box an IMOD I3MP contract to provide a turnkey solution to upgrade the existing voice and data infrastructure. This upgrade will deliver state-of-the-art technologies to transition Ft. Buchanan to VoIP/UC capabilities.
Gunster Law Firm, FL: New Voice Communications. New voice system at 11 offices across the state of Florida.
The Amalgamated Sugar Company, LLC, ID: VoIP System. New VoIP system at six facilities across Idaho, Oregon and Washington state.
University of Texas, Austin: VoIP System. New VoIP system and deployment of approximately 23,000 VoIP phones and related infrastructure.
Black Box Awarded Contract for Korea Yongsan Relocation Plan$97.3 million project to modernize communications and technologies for the U.S. Army.
Black Box is responsible for providing, relocating and implementing a multitude of state-of-the-art communications systems without mission interruptions.
LTLCS Area I and II/Seoul, Korea: Network Operation. Black Box was awarded a Long Term Life Cycle Support Service task order for the sustainment of Area I and Area II network operations throughout the Republic of Korea.
Department of Energy, NM: Managed Services. 24/7, on-site operations and maintenance telecommunications support at Sandia National Laboratories.
Packard Children’s Hospital, CA: Wireless. The Black Box InnerWireless 4G Distributed Antenna System and WLAN solutions supports the hospital’s multiple wireless services: 3G/4G, Wi-Fi, two-way radio, public safety communications, and Wireless Medical Telemetry Services.
w
Major contracts awarded to Black Box.
Major Contracts and Awards
Some of Black Box’s largest engagements are in
Southeast Asia, Europe and the Pacific Rim where
Black Box maintains permanent personnel to
support multiple implementation and maintenance
contracts. One of the largest deployments is in
South Korea where U.S. forces are being relocated
from other sites, including USAG-Yongsan, to
USAG-Humphreys. As the prime contractor
managing and deploying the modernization of
communications technology and communications
infrastructure, Black Box is proud to play a key
role in this transformation.

13
Awards and Accolades
Cisco Recognizes Black Box for Customer Satisfaction ExcellenceBlack Box achieved a Customer Satisfaction Excellence Gold Star from Cisco® for delivering outstanding customer service to customers in the U.S. Black Box is also a Cisco Gold Certified partner.
ShoreTel Honors Black Box for Outstanding Achievement in Customer Satisfaction Only the top 10 percent of ShoreTel® resellers receive this recognition.
Black Box Named 2012 Supplier of the Year by Day & ZimmermannThis is the highest honor Day & Zimmermann bestows on its suppliers and it recognized Black Box for delivering outstanding service. Black Box provides voice and infrastructure to Day & Zimmermann on a global basis.
Black Box Secures 31st Spot in Prestigious CRN Solution Provider 500 ListThe annual list, previously called the VAR 500, includes the largest integrators, service providers, and IT consultants in North America. Black Box has been recognized by CRN for the 11th year in a row.
Black Box Wins Channel Partners 360° AwardThis award recognizes communications systems providers who deliver best-in-class solutions for the indirect sales channel.
Black Box Wins Two Stevie® Awards for Customer ServiceBlack Box was voted the favorite customer service provider in the Computer Hardware category in the 2013 People’s Choice Stevie® Awards. Black Box also won a Bronze award in the Customer Service Department of the Year, Computer Hardware category.
Black Box Achieves Cisco Master Managed Services Certification and Advanced Data Center Architecture Specialization
This distinguishes Black Box as having the highest level of expertise in managed services and recognizes its investment in the ITIL® (IT Infrastructure Library) processes, practices and tools. Black Box also achieved Advanced Data Center Architecture Specialization, which recognizes the fulfillment of training requirements and program prerequisites to sell, design and deploy comprehensive Cisco Data Center solutions.
Black Box Receives 5-Star Rating from CRNBlack Box was recognized by CRN’s 5-Star Partner Program Guide as an elite Partner Program Guide Vendor offering the best resources and elements through their partner channel program.
EncrypTight™ Named a Silver Award Winner in 2013 Global Excellence AwardsInfo Security Products Guide, the industry’s leading information security research and advisory guide, has named the Black Box EncrypTight appliance a silver award winner.
Black Box Wins Multichannel Merchant Gold AwardMultichannel Merchant honored Black Box for excellence in cross-channel marketing in the business-to-business, large company category. This is the 17th year Black Box has been honored by MCM.
iCOMPEL™ WDS Named TMC Product of the YearTechnology Marketing Corporation (TMC) named the Black Box® iCOMPEL WDS wearable digital signage system its Communications Solutions Product of the Year. This is the 4th consecutive year a member of the Black Box iCOMPEL product family has won this award. Black Box ServSwitch™ Secure the Product of the MonthGovernment Contracting News (GCN) recognized the ServSwitch Secure KVM Switch for going far beyond the required levels to keep government data secure.
Digital Signage Association Industrial Excellence Awards Honors iCOMPEL DeploymentThe iCOMPEL digital signage installation for Joy Mining Company was named Best Corporate Digital Signage Deployment.
Black Box Named to InformationWeek 500 List of Top Technology Innovators
Black Box was recognized for innovative technology for the consolidation and relocation of our own data center through virtualization and centralization.

What Our Clients are Saying
14
The background.Marlins Park, the new home of the Miami Marlins Major League
Baseball team in Miami, opened in March 2012. The park is located on the historic Orange Bowl site in the Little Havana section of Miami. The baseball-only 37,000-seat park features a natural grass playing field and was the the first professional sports facility to achieve LEED Gold Certification.
Top priorities.In planning the construction of the park, the Marlins’ IT team led
by David Enriquez, Senior Director of IT, knew the Marlins needed a state-of-the-art unified communications system to match the new state-of-the-art ballpark. Top priorities included a collaborative unified communications solution, a highly responsive and reliable contact center, audio and web conferencing, and enterprise mobility.
Mr. Enriquez, working with Miami-based Trien & Associates and Hunt/Moss, A Joint Venture, put out an RFP for the communications system for the new park, and Black Box responded. The Black Box
team met with the IT construction team to learn what features and functions were important and how the Marlins wanted to manage the system. ”We met with them; listened to what their priorities and needs were; and then we put together a total package based on their priorities,” said the Black Box Manager.
After reviewing a number of proposals from different vendors, Hunt/Moss, A Joint Venture, awarded the project to Black Box.
The Black Box solution.The comprehensive solution proposed by Black Box included
the ShoreTel® IP PBX, ShoreTel Enterprise Contact Center, ShoreTel Conferencing and ShoreTel Mobility. It enables the Marlins to take advantage of the latest innovations in unified communications, collaboration and mobility.
“I think once Mr. Enriquez and his team saw how easy it was to manage the system, and how it could increase productivity and reduce expenses, they chose the Black Box solution,” the Black Box Manager explained.
Project: ShoreTel unified communications
Miami Marlins
The system includes 500 stations with IP, analog and mobility capabilities.
”One important factor in the decision was the lower total cost of ownership,” commented Mr. Enriquez. The new system gave the Marlins a simpler, less expensive licensing model than other manufacturers. Other important factors in choosing the ShoreTel system are ease of use, simplified management and redundancy. Enterprise collaboration can be completed in less than 10 minutes. Redundancy is also critical to the park’s operations. The system comes with N+1 redundancy, which provides seamless recovery in case of a failure. And with the mobility option, users can now communicate on their own smartphones, tablets and other personal devices, aligning with the Marlins’ BYOD (Bring Your Own Device) initiatives.
Black Box was awarded the project because of its strong knowledge and successful deployment track record and its
unyielding commitment to customer support and service. The Miami Marlins knew Black Box would effectively manage the implementation and provide ongoing support and maintenance.
Overall, this project was a home run!
“ We were impressed by the expansive functionality and ease of use of the ShoreTel solution along with the capabilities of Black Box to deploy the system and help us get the most out of our investment. We expect our users to experience increased productivity with the collaboration of voice, video, data and cell services.”
David Enriquez, Senior Director of IT, Miami Marlins

15
The background.Newtek provides business services, such as payroll, Web site
design, insurance, merchant processing and more, to the SMB market under The Small Business Authority™ and Newtek™ brands.Established in 1998, Newtek provides 24/7 customer and technical support. The company is headquartered in New York, NY, and maintains five sites nationwide, including two large contact centers.
The communications wish list.If any company knows how important excellent customer
service is to its bottom line, it’s Newtek. When the company’s voice services lease was coming to an end, Bob Cichon, Newtek CTO, decided to explore all options. It was critical that he maintain 24/7 communications, especially in the contact centers.
One of the major problems Mr. Cichon saw was the reliability and stability of his current system. Newtek has multiple locations and each had a standalone voice system; there was no centrally
connected system. This proved to be difficult to manage and maintain.
Mr. Cichon explained what he wanted in a new system. ”I wanted to, one, connect remote staff in the future outside of a server-based geography. Two, keep phone lines coming into a central location even if we move outside of the area code. Three, eliminate geography problems, particularly with disaster recovery. Four, give our remote staff more communications flexibility.”
Choosing a Cisco system.When Mr. Cichon looked into upgrading to a new system from
his current vendor, the cost would be higher. ”But cost wasn’t everything,” he explained. ”It was a matter of what I wanted in a feature set.” So he decided to explore other options.
He met with Black Box and explained what he wanted. Because Black Box has a broad portfolio of solutions from all the leading communications manufacturers, two different solutions were presented side-by-side. This way the Newtek team could make an informed, objective decision. In the end, they chose a Cisco unified communications system.
Project: Cisco unified communications
Newtek
”Black Box did a great job working with us to help us determine benefits and costs,” Mr. Cichon explained.
“Going through a phone system turnover is very dramatic, especially for a company that does business on the phone,” he explained. ”I don’t want to do this again in five years.” Black Box helped demonstrate how the Cisco system gave him the ability to grow and add on as his company grows.
”The Black Box team was there.”Within six months of signing on with Black Box, all of Newtek’s
sites were on the new system. Black Box managed all the cutovers after hours so as not to disturb communications.
“Migrating four geographies and 400 people to a new phone system is quite dramatic,” said Mr. Cichon.
In describing how the installation went, Mr. Cichon had nothing but praise for the Black Box and Cisco teams.
“We anticipated there would be issues. The interaction between Black Box and Cisco through those issues is what mattered. No one left me alone during this. Nobody dropped the ball—whether it was the middle of the night, weekends, etc. The Black Box team was there working through it.” Overall, the implementation went very well. The issues were very few and were cleared up within 24 hours.
Once again, Black Box definitely answered the call!
“ Black Box was very responsive working through issues, even outside issues. Nobody dropped the ball—whether it was the middle of the night, weekends, etc. It didn’t matter. The Black Box team was there working through it.”
Bob Cichon, Chief Technology Officer, Newtek

16
Carilion Clinic is a not-for-profit healthcare organization based in Roanoke, Va. It serves nearly 1 million residents in western Virginia and southern West Virginia. Carilion has won a National Mobility Award for its integration of mobile devices and was named in the Top 100 Annual Most Wired and Wireless Hospital Systems ten times.
”A number of years ago, we determined wireless was going to be a key enabling technology for efficient and quality patient care,” said Kendall White, Senior Director IT, Carilion Clinic. ”Like most hospitals, we initially installed traditional wireless systems, meaning a separate infrastructure for each wireless service, such as 802.11, 3G/4G, two- way radios, etc. We weren’t happy with the results. We were unable to provide the consistent wireless coverage our customers required without significant IT support.”
”This led us to research new solutions that would provide ubiquitous wireless coverage throughout our facility and, if possible, deliver all our wireless services. Our research led us to decide on implementing the distributed antenna system (DAS) and WLAN solutions from Black Box Network Services.”
The Black Box system provides 100% wireless coverage for all wireless services, which previously had been disparate systems requiring a lot of IT attention and support. After extensive site surveys, Black Box planned and installed the system to ensure all wireless systems worked everywhere. In addition, having Black Box DAS and WLAN solutions provided other benefits to Carilion: much easier management and the need for less IT support. Because there is 100% coverage, the IT staff isn’t spending time troubleshooting wireless issues.
Project: Ubiquitous wireless network
Carilion Clinic
Thomas College, a private liberal arts and business education institution in Waterville, Maine, prides itself on providing the most current technology for its 1,100-plus students. The college wanted to replace its existing video signage system, ThomasTV, a video-over-IP system for broadcasting campus information over three “channels” to its various buildings. ThomasTV had its advantages, but bandwidth issues complicated the distribution of content through this IP data channel. The college went looking for a new digital signage platform.
The college evaluated different systems from various vendors and, in the end, selected Black Box’s iCOMPEL™, an integrated hardware/software platform for networked content distribution.
The school has 14 iCOMPEL subscriber units and digital screens located in residence halls, the administrative/classroom building, the library, dining centers, the athletics center, and other locations.
“We like the flexibility,” says Chris Rhoda, VP for Information Services and CIO. On the old ThomasTV system, the college was limited to displaying the exact same information on each channel, no matter where it was delivered. Now, the college can customize content for
the intended audience. The IT Services Department goes in and builds an iCOMPEL channel, and various staff members add their content for their departments. ”Different people can be in charge of different parts of the screen,” Rhoda explains.
Thomas CollegeProject: New digital signage system
” The biggest advantage of our wireless system is its 100% coverage and high availability for all our wireless services. This has enabled our IT staff to focus on end-user needs instead of troubleshooting wireless issues.”
Kendall White, Senior Director IT, Carilion Clinic
“ iCOMPEL gives us an easy way to communicate on strategically placed monitors in the least amount of time. Using the integrated software, an IT staff person builds a channel and other staff members add content for screens in their departments. The process is very straightforward and enables us to have the most up-to-date information on all of our displays. The extra bonus is the low amount of bandwidth used compared to typical video-over-IP technologies.”
Chris Rhoda, VP for Information Services and CIO, Thomas College

UNITED STATESSECURITIES AND EXCHANGE COMMISSION
Washington, D.C. 20549
FORM 10-K
(Mark One)
ANNUAL REPORT PURSUANT TO SECTION 13 OR 15(d) OF THE SECURITIES EXCHANGE ACT OF 1934
For the fiscal year ended March 31, 2013OR
TRANSITION REPORT PURSUANT TO SECTION 13 OR 15(d) OF THE SECURITIES EXCHANGE ACT OF 1934
For the transition period from to
Commission File Number: 0-18706
Black Box Corporation(Exact name of registrant as specified in its charter)
Delaware 95-3086563(State or other jurisdiction of incorporation or organization) (I.R.S. Employer Identification No.)
1000 Park Drive, Lawrence, Pennsylvania 15055(Address of principal executive offices) (Zip Code)
Registrant’s telephone number, including area code: 724-746-5500
Securities registered pursuant to Section 12(b) of the Act:
(Title of each class) (Name of each exchange on which registered)Common Stock, $.001 par value The NASDAQ Global Market
Securities registered pursuant to Section 12(g) of the Act: None
Indicate by check mark if the registrant is a well-known seasoned issuer, as defined in Rule 405 of the Securities Act. Yes No
Indicate by check mark if the registrant is not required to file reports pursuant to Section 13 or Section 15(d) of the Act. Yes No
Indicate by check mark whether the registrant (1) has filed all reports required to be filed by Section 13 or 15(d) of the Securities Exchange Act of 1934 during the preceding 12 months (or for such shorter period that the registrant was required to file such reports), and (2) has been subject to such filing requirements for the past 90 days. Yes No
Indicate by check mark whether the registrant has submitted electronically and posted on its corporate Web site, if any, every Interactive Data File required to be submitted and posted pursuant to Rule 405 of Regulation S-T (§ 229.405 of this chapter) during the preceding 12 months (or for such shorter period that the registrant was required to submit and post such files). Yes No
Indicate by check mark if disclosure of delinquent filers pursuant to Item 405 of Regulation S-K (§ 229.405 of this chapter) is not contained herein, and will not be contained, to the best of registrant’s knowledge, in definitive proxy or information statements incorporated by reference in Part III of this Form 10-K or any amendment to this Form 10-K.
Indicate by check mark whether the registrant is a large accelerated filer, an accelerated filer, a non-accelerated filer, or a smaller reporting company. See the definitions of "large accelerated filer," "accelerated filer" and "smaller reporting company" in Rule 12b-2 of the Exchange Act. (Check One):
Large accelerated filer Accelerated filer Non-accelerated filer Smaller reporting company (Do not check if a smaller reporting company)
Indicate by check mark whether the registrant is a shell company (as defined in Rule 12b-2 of the Exchange Act). Yes NoThe aggregate market value of the voting stock held by non-affiliates of the registrant as of September 28, 2012 (based on closing price of such stock as reported by NASDAQ on such date) was $417,165,079. For purposes of this calculation only, directors and executive officers of the registrant and their affiliates are deemed to be affiliates of the registrant.As of May 10, 2013, there were 16,132,572 shares of common stock, par value $.001 (the "common stock"), outstanding.
DOCUMENTS INCORPORATED BY REFERENCEProxy Statement for 2013 Annual Meeting of Stockholders (the "Proxy Statement") – Part III
Table of Contents

2
BLACK BOX CORPORATIONFOR THE FISCAL YEAR ENDED MARCH 31, 2013
INDEX
Page
Mine Safety Disclosures
PART IItem 1. Business 3Item 1A. Risk Factors 5Item 1B. Unresolved Staff Comments 7Item 2. Properties 7Item 3. Legal Proceedings 7Item 4. 8PART II
Item 5. Market for Registrant's Common Equity, Related Stockholder Matters and Issuer Purchases of Equity Securities 9
Item 6. Selected Financial Data 11Item 7. Management's Discussion and Analysis of Financial Condition and Results of Operations 11Item 7A. Quantitative and Qualitative Disclosures about Market Risk 27Item 8. Financial Statements and Supplementary Data 29Item 9. Changes in and Disagreements with Accountants on Accounting and Financial Disclosure 58Item 9A. Controls and Procedures 58Item 9B. Other Information 59PART IIIItem 10. Directors, Executive Officers and Corporate Governance 59Item 11. Executive Compensation 59Item 12. Security Ownership of Certain Beneficial Owners and Management and Related Stockholder Matters 59Item 13. Certain Relationships and Related Transactions, and Director Independence 59Item 14. Principal Accounting Fees and Services 59PART IVItem 15. Exhibits and Financial Statement Schedules 60
Signatures 63Exhibit Index 64

3
PART I
Item 1. Business.
Overview
Black Box Corporation ("Black Box," "we," the "Company," "our" or “us”) is a leading communications system integrator dedicated to designing, sourcing, implementing and maintaining today's complex communications solutions. Our primary service offering is voice communications solutions ("Voice Communications"); We also offer premise cabling and other data-related services solutions ("Data Infrastructure") and technology product solutions (“Technology Products”). Voice Communications and Data Infrastructure may collectively be referred to as “On-Site services.” We employed 3,900 and 4,302 employees as of March 31, 2013 and March 31, 2012, respectively.
We participate in the worldwide communications and network infrastructure markets. Voice Communications and Data Infrastructure products and services are distributed to these markets primarily through value-added resellers, manufacturers, large system integrators and other technical services companies. Technology products similar to those sold by us are distributed through direct marketing manufacturers, mass merchandisers, "big box" retailers, web retailers and others. We believe that we compete well in both markets on the basis of our solution features, technical capabilities, service levels and price.
We conduct our business globally and, as of March 31, 2013, manage our business by geography under the following three reporting segments: North America, Europe and All Other. For revenues and other information (including large customers) regarding these reporting segments, see Note 17 of the Notes to the Consolidated Financial Statements. For information regarding backlog, see Item 7. Management's Discussion and Analysis of Financial Condition and Results of Operations.
In connection with a transition in executive management and a refinement of business strategy, we have realigned our organizational structure which will result in new reporting segments (North America Services, North America Products, International Services and International Products) for the purpose of making operational decisions and assessing financial performance. The new reporting segments will be effective, on a prospective basis, beginning on April 1, 2013. This is consistent with the proliferation of voice-over-internet-protocol (VOIP) solutions and the adoption of unified communication technologies which has resulted in a trend toward convergence of voice and data networks. We believe that, in the near future, the distinction between our voice and data solution offerings will not be significant and, increasingly, these services are bundled together. As such, those historical Voice Communications and Data Infrastructure offerings will be aggregated into Services in their respective geography. We will report financial information (revenue through operating income) for these new reporting segments which should provide enhanced visibility and transparency into our operations, our business drivers and the value of our enterprise.
Products and Services Platforms
Since our founding in 1976, we have built robust communications-based platforms that allow us to identify customer needs, and then design, source, implement and support the appropriate communications solutions. Our two platforms for serving customers and generating growth are as follows:
Products PlatformOur Products Platform is comprised of global sales and distribution, free 24/7/365 technical support, custom solutions, same-day delivery, lifetime warranties, quality control, global product management and sourcing. The current products offered through the platform include but are not limited to switches & routers, cabling infrastructure, cabinets and racks, wireless networking and digital signage.
The Company generates Technology Products revenues from the sale of data networking products through its catalog, Internet Web site and direct sales. In order to meet client demand, we keep a moderate level of inventory which consumes part of our working capital. The market for these products is a highly fragmented and competitive. The Company has participated in this market for 37-years and has earned a reputation for providing high quality products, rapid order fulfillment and free 24/7/365 technical support. With an average order size of less than one thousand dollars, the Company's Technology Products revenue is primarily driven by general information technology spending rather than capital spending.
Table of Contents

4
We utilize a network of original equipment manufacturers ("OEMs") and suppliers throughout the world. Each supplier is monitored for quality, delivery performance and cost through a well-established certification program. This network has manufacturing and engineering capabilities to customize products for specialized applications. Black Box operates its own manufacturing and assembly operation at its Lawrence, Pennsylvania location. The Company chooses to manufacture certain products in-house when outside sourcing is not economical. Sourcing decisions of in-house versus third-party suppliers are based upon a balance of quality, performance, delivery and cost factors.
Services PlatformOur Services Platform is comprised of our Voice Communications and Data Infrastructure offerings including engineering and design, network operations centers, technical certifications, local and national sales teams, remote monitoring, on-site service teams and technology partner centers of excellence which includes specific sales and engineering resources around the technology. The primary services offered through this platform include but are not limited to communications lifecycle services, structured cabling, unified communications, video/AV services, in-building wireless and data center services.
For Voice Communications, the Company's revenues are primarily generated from the sale and/or installation of new voice communications systems, the support of voice communications systems and moves, adds and changes ("MAC work"). We periodically generate revenues from contracts performed over time that may result in an asset on our balance sheet for multiple periods constituting part of our working capital. We have not experienced significant collectability issues related to such contracts. Sales of new voice communications systems and, to a lesser extent, MAC work, are dependent upon general economic growth and our clients' capital spending. Installed voice communications systems may be updated to provide users with increased unified communications functionality and integration with traditional data network applications such as email or messaging. Revenues from support contracts generally are not directly dependent on the economy as clients may seek to extend the life of their existing equipment and delay capital spending on new voice communications systems.
Similarly, the Company's revenues for Data Infrastructure are generated from the installation or upgrade of data networks and MAC work. The installation of new data networks is also dependent upon general economic growth and our clients' capital spending. Installed data networks may also need to be upgraded in order to accommodate the growing use of network technology. Similar to Voice Communications, Data Infrastructure projects can include MAC work which is dependent on economic factors that are the same as those factors discussed above in relation to the Voice Communications business.
The Company routinely competes against original equipment manufacturers, local or regional manufacturer-specific channel partners in the Voice Communications and Data Infrastructure markets for enterprise clients. The Company believes that it favorably differentiates against this competition through its technology independent approach which draws the appropriate product from our portfolio of different partner solutions, broad geographic footprint and deep industry and technical expertise. Through its network of local offices and network operations centers, the company can provide clients with both on-site and remote services.
Management has initiated programs that it believes will leverage these platforms, introduce the Company into new markets and increase the number of offerings that it can provide to its existing clients.
Key DifferentiatorsOur platforms introduce scale, flexibility and leverage to the business, and provide the following competitive advantages:
• A diversified client base: We have built a diversified client base that ranges from small organizations to many of the world's largest corporations and institutions. Black Box clients participate in many industries, including government, healthcare, business services, manufacturing, retail, technology and banking, among others. Revenues from our clients are segmented with approximately 60% from large companies (i.e., revenues greater than $1 billion, including federal governments), approximately 20% from medium-sized companies (i.e., revenues between $50 million and $1 billion, including state governments) and approximately 20% from small companies (i.e., revenues less than $50 million, including local governments). We strive to develop extensive and long-term relationships with high-quality clients as we believe that satisfied clients will demand quality services and product offerings even in economic downturns. Also, we believe that our distinctive portfolio of products and services will allow us to introduce additional offerings to satisfied clients.
• Key relationships with leading technology partners: We have built long-term relationships with all major communications equipment manufacturers and we are a top partner with the market leaders, including Avaya®, Cisco®, CommScope®, Genband®, Mitel®, NEC®, ShoreTel® and Siemens ®, among others.
• Broad geographic footprint: We have built a global footprint of approximately 200 offices serving more than 175,000 clients in approximately 150 countries throughout the world.
Table of Contents

5
• Deep organic resources: We have approximately 4,000 team members world-wide, approximately 3,000 of whom are technical and engineering talent who provide our clients with on-site and remote capabilities.
• Dedicated sales force: We have a team of over 300 direct sales people world-wide.
• Strong financial position: We have a stable balance sheet and have generated positive cash flow for 37 consecutive years.
Strategic Focus
We believe that the services and products that we provide enable our clients to fully optimize their communications investment. Our strategy is based on the following core beliefs about our clients and the markets we serve:
• Enablement: Communication is an organization's most important process. When we enable it, we create value.
• Independence: Client focused solutions are better than channel focused solutions.
• Interoperability: Business leaders will choose best of breed solutions and require operational integration.
• Innovation: A dynamic communications market requires partners and process to adapt and transform.
Our overall business growth strategy includes the following four areas of focus:
• Strengthen and expand our portfolio of high-value communication solutions.
• Leverage centralized expertise with local skills and relationships.
• Realign organizational structure and incentives.
• Implement a consistent, comprehensive market penetration approach.
We are actively operating programs that reflect our commitment to this strategy. These programs will continue to diversify our offerings and will reflect client demand in the rapidly changing communications market.
Our fiscal year ends on March 31. References to "Fiscal Year" or "Fiscal" mean our fiscal year ended March 31 for the year referenced. All dollar amounts are in thousands except for per share amounts or unless otherwise noted. We were incorporated in Delaware in 1976, and our headquarters is near Pittsburgh in Lawrence, Pennsylvania. Our mailing address is 1000 Park Drive, Lawrence, Pennsylvania 15055 and our phone number is (724) 746-5500. Our website is http://www.blackbox.com. Through the Investor Relations section of our website, we make available the following filings as soon as practicable after they are electronically filed with the Securities and Exchange Commission ("SEC"): our Annual Report on Form 10-K, Quarterly Reports on Form 10-Q, Current Reports on Form 8-K and any amendments to those reports filed or furnished pursuant to Section 13(a) or 15(d) of the Exchange Act. All such filings are available free of charge. Also available on our website under the About Us section, is the Company's Standards of Business Conduct, Code of Ethics and the charter of each committee of the Company's Board of Directors (the "Board") each of which is available free of charge.
Item 1A. Risk Factors.
The following are some of the potential risk factors that could cause our actual results to differ materially from those projected in any forward-looking statements. You should carefully consider these factors, as well as the other information contained in this document, when evaluating your investment in our securities. The following list of important factors is not all-inclusive.
We are dependent upon certain key supply chain and distribution agreements. We have significant arrangements with a small number of technology suppliers. If we experience disruptions in our supply chain with these manufacturers for any reason or lose our distribution rights, we may not be able to fulfill client commitments with an acceptable alternative or we may not be able to obtain alternative solutions at similar costs.
Table of Contents

6
We are dependent upon the demand for our products and services. We and our competitors in the industry are dependent on the demand for the products and services that we deliver. Changes in technology or other unforeseen developments within our industry could result in decreased demand for our products and services. We cannot guarantee that historical levels of demand will continue or increase in the future.
We face intense competition. We operate in a highly competitive industry. Our competitors, who include our technology suppliers and certain clients, may be able to deliver products and services at better prices or more quickly due to factors beyond our control. New competitors may also emerge in the future, which may threaten our ability to sustain or grow our market share. We cannot guarantee that we can continue to compete effectively in the future and still be able to sustain our historical levels of profit margin.
Our financial results are dependent on our economic environments. We, our clients or our vendors may experience economic hardships due to inflation or recession, changes in laws and regulations, business disruptions due to natural disasters, acts of terrorism or war or other factors that are beyond our control and that could negatively impact our financial condition or our ability to meet our future financial goals.
Our revenue is dependent upon repeat client business and generally is not subject to long-term contracts. A majority of our revenue is generated through individual sales of products and services and less than twenty (20%) of our revenue is generated from long-term maintenance contracts. We depend on repeat client business as well as our ability to develop new client business to sustain and grow our revenue. Although our focus on delivering high-quality sales and service has proven to be successful in the past, we cannot guarantee that we will be able to grow or even sustain our current level of revenue in the future.
A significant part of our business involves public sector clients which provides unique risks. Approximately 25% of our revenues is derived from sales to agencies and departments of federal, state and local governments. Legislatures typically appropriate funds for a given program annually. These appropriations may be influenced by, among other things, the state of the economy, competing priorities for appropriation, changes in administration or control of legislatures, the timing and amount of tax receipts and the overall level of government expenditures. A decrease in appropriations for certain programs could have a material adverse effect on our business.
In addition, our revenues from sales to these public sector clients are made through various direct contracts, through reseller agreements with government contractors and through open market sales. Government contracting is a highly-regulated area. Failure to comply with regulations or contracts could subject us to fines, penalties, suspension or debarment from doing business with such clients, which could have a material adverse effect on our business.
Our ability to experience organic growth is dependent upon successful execution of new initiatives. We have recently experienced a change in management, including a new Chief Executive Officer. In connection therewith, we have re-aligned our organizational structure and have introduced new programs in order to better capitalize on internal assets and expertise, which we believe will enable us to introduce new product and service offerings as well as to support additional offerings for our clients resulting in increased revenues (including organic growth) and profitability. The failure of these programs could have a material adverse effect on our ability to increase revenues and profitability.
We are dependent upon the successful integration of acquired businesses. Our future financial results are dependent on the successful integration of acquisitions within the projected timeframes and cost parameters. We also face pressure to adequately conduct our ongoing operations while working toward the integration of acquired businesses. We cannot guarantee that we will successfully integrate our acquisitions as projected or without disruption to other areas of our business which could have a negative impact on our financial results.
We are dependent upon the retention of our key personnel. The success of our business depends on our ability to attract and retain quality employees, executives and directors. We offer comprehensive salary and benefit packages including long-term incentives as a means of attracting and retaining personnel. We face pressure to maintain our profit margins and remain competitive in our industry while we compete for personnel in our local markets with a variety of different businesses that may be able to offer more attractive incentives due to their individual financial situations. We cannot guarantee that we will continue to attract and retain personnel with our current incentives and at costs that are consistent with our projected profit margins.
We are dependent upon future mergers and acquisitions for a portion of our growth. A key component of our growth strategy is through strategic mergers and acquisitions. We may not continue to be successful in our search for potential acquisition candidates that are acceptable for our business model, or we may not be successful in our attempts to acquire new businesses that we have identified as attractive acquisition candidates. We cannot guarantee that we will meet our projected growth targets in the future if we are unsuccessful in our efforts to acquire additional businesses.
Table of Contents

7
Our business operations could be disrupted if our information technology systems fail to perform adequately. The efficient operation of our business depends on our information technology systems. We rely on our information technology systems to effectively manage our business data, communications, order entry and fulfillment and other business processes. The failure of our information technology systems to perform as we anticipate could disrupt our business and could result in transaction errors, processing inefficiencies and the loss of sales and customers, causing our business and results of operations to suffer. In addition, our information technology systems may be vulnerable to damage or interruption from circumstances beyond our control, including fire, natural disasters, power outages, systems failures, security breaches and viruses. Any such damage or interruption could have a material adverse effect on our business.
We can provide no assurance that we will continue to have adequate liquidity. Although we generate positive cash flow and have access to a significant amount of additional credit, we cannot be certain that our current liquidity situation will be adequate in future periods. We cannot guarantee that we will be able to maintain our positive cash flow position or to obtain additional credit or raise additional capital which may restrict our ability to operate or to pursue new business opportunities in the future.
We are subject to the risks of international operations. We operate in countries outside of the United States. Our operations or our financial condition may be negatively affected by events surrounding our international operations such as changes in laws and regulations, political or economic instability, currency fluctuations, supply chain disruptions, acts of terrorism, natural disasters or other political, economic or environmental factors. We cannot rely on the past results of our international operations as an indicator of future results or assure you that we will not be adversely affected by those factors inherent with international operations.
Our stock price fluctuates. Our stock price is affected by a number of factors, including quarterly variations in our financial results. As a result, our stock price is subject to volatility.
We have a significant amount of goodwill and could accumulate additional goodwill that could be subject to impairment. As a result of our past acquisition program and given the service nature of our business, we have accumulated goodwill. Part of our current growth strategy is to acquire strategic companies in high growth markets and given the service nature of those future acquisitions, we will accumulate additional goodwill. We conduct an impairment assessment of the carrying value of our goodwill at least annually and we monitor market conditions to determine if any additional interim review of goodwill is warranted. Deterioration in the market or actual results as compared to our projections or any reorganization of our business segments or under performance of future acquisitions could ultimately result in a future impairment. In the event that we determine that our goodwill is impaired in the future, we would need to recognize a non-cash impairment charge, which could have a material adverse effect on our consolidated balance sheet and results of operations. The information set forth under the caption “Goodwill” in “Management's Discussion and Analysis of Financial Condition and Results of Operations” in Part II, Item 7 of this Annual Report is incorporated herein by reference in order to supplement this information including the discussions of new operating segments effective on April 1, 2013.
Item 1B. Unresolved Staff Comments.
None.
Item 2. Properties.
The Company’s worldwide headquarters and certain U.S. operations are located in Lawrence, Pennsylvania (located 20 miles south of Pittsburgh) in a 352,000 square foot owned facility on 84 acres.
The Company owns or leases additional offices or facilities throughout the world, none of which are material in nature to Black Box.
The Company believes that its properties are adequate for its present and foreseeable needs.
Item 3. Legal Proceedings.
The Company is involved in, or has pending, various legal proceedings, claims, suits and complaints arising out of the normal course of business. Based on the facts currently available to the Company, Company management ("Management") believes these matters are adequately provided for, covered by insurance, without merit or not probable that an unfavorable material outcome will result.
Table of Contents

8
Item 4. Mine Safety Disclosures.
Not applicable.
Executive Officers of the Registrant
The executive officers of the Company and their respective ages and positions are as follows:
Name Age Position with the CompanyMichael McAndrew 53 President and Chief Executive OfficerTimothy C. Huffmyer 39 Vice President, Chief Financial Officer and Treasurer (Principal Accounting Officer)Kenneth P. Davis 49 Executive Vice President of North America Commercial ServicesRonald Basso 53 Executive Vice President of Business Development, General Counsel & Secretary
The following is a biographical summary of the experience of the executive officers of the Company:
MICHAEL MCANDREW, 53, was selected as a member of the Board on April 1, 2013 and was named Chief Executive Officer effective that same date. On October 2, 2012, he was promoted to President and Chief Operating Officer. On May 11, 2010, he was promoted to Executive Vice President. He had previously been promoted to the position of Vice President and Chief Financial Officer on December 13, 2002. He became Secretary and Treasurer on January 31, 2003. He was Manager of Corporate Planning and Analysis with the Company prior to December 13, 2002. Mr. McAndrew has been with the Company for 23 years.
TIMOTHY C. HUFFMYER, 39, was named Vice President, Chief Financial Officer and Treasurer (and, in those roles, he serves as the Company's principal financial officer and principal accounting officer) on October 2, 2012. In connection with Mr. Huffmyer's appointment, Mr. McAndrew ceased to serve as Executive Vice President, Chief Financial Officer, Treasurer and Secretary (and, in those roles, as principal financial officer and principal accounting officer) as of such date. Mr. Huffmyer was promoted to Director of Finance in February, 2008. He served as Corporate Controller from June, 2004 and in other finance roles prior thereto. Mr. Huffmyer has been with the Company for 9 years.
KENNETH P. DAVIS, 49, was named as Executive Vice President of North America Commercial Services on October 2, 2012. Mr. Davis was previously named Vice President - Voice Communications North, Europe and Latin America on November 1, 2010. Mr. Davis has served in a number of operating roles within the Company, including as Vice President and General Manager of the Northeast Region, Europe and Latin America. Mr. Davis has been with the Company for 13 years.
RONALD BASSO, 53, was named Executive Vice President of Business Development, General Counsel and Secretary on January 28, 2013. Mr. Basso was a shareholder of the law firm of Buchanan Ingersoll & Rooney PC from 1985 where he served as the Company's lead engagement partner.
Directors of the Registrant
The following sets forth certain information concerning the members of the Board:
WILLIAM F. ANDREWS, 81, was elected as a director on May 18, 1992. Mr. Andrews currently is Chairman of the Executive Committee of Corrections Corporation of America (private prisons) and Chairman of Katy Industries, Inc. (diversified manufacturing company). He has been a principal with Kohlberg & Co., a private investment company, since 1995. He is also a director of Corrections Corporation of America and Katy Industries, Inc., publicly-held companies, and SVP Holdings Limited.
R. TERRY BLAKEMORE, 56, was selected to be a director on October 13, 2007 and was named President and Chief Executive Officer of the Company on the same date. He held the position of President until October 2, 2012 and the position of Chief Executive Officer until March 31, 2013. He was elected as a director by our stockholders on August 12, 2008. He had served in the capacity of Interim President and Chief Executive Officer of the Company from May 21, 2007. Previously, on May 15, 2007, the Board had named Mr. Blakemore a Senior Vice President of the Company. Prior to becoming a Senior Vice President, Mr. Blakemore served as a manager of business development and, prior thereto, as a manager of the Company's Voice Communications business unit.
Table of Contents

9
RICHARD L. CROUCH, 66, was elected as a director on August 10, 2004. Mr. Crouch was a General Partner with the firm of PricewaterhouseCoopers LLP from 1979 to 2004, having served as an Audit Partner principally assigned to public companies. He served in various capacities for the firm, including service as a regional accounting, auditing and SEC services consultant. He retired from the firm on July 2, 2004.
THOMAS W. GOLONSKI, 70, was selected to be a director on February 11, 2003 and was elected by our stockholders on August 12, 2003. Mr. Golonski served as Chairman, President and Chief Executive Officer of National City Bank of Pennsylvania and Executive Vice President of National City Corporation from 1996 to 2005. He retired from National City in 2005. He is a director of several educational and health care organizations and active in other charitable organizations.
THOMAS G. GREIG, 65, was elected as a director on August 10, 1999 and appointed as non-executive Chairman of the Board in May 2004. Mr. Greig has been a Senior Managing Director of Liberty Capital Partners, a private equity partnership, since 1998. He is also a director of publicly-held Rudolph Technologies, Inc. and a number of privately-held companies.
JOHN S. HELLER, 59, was selected to be a director on March 27, 2013. Mr. Heller retired from Caterpillar Inc. (manufacturer of construction and mining equipment, diesel and natural gas engines, industrial gas turbines and diesel-electric locomotives) in February 2012. He held a number of positions of increasing responsibility at Caterpillar during a 38-year career, last serving as Vice President and Chief Information Officer for more than the last 5 years.
WILLIAM H. HERNANDEZ, 65, was selected to be a director on December 3, 2009 and was elected by our stockholders on August 10, 2010. Mr. Hernandez was the Senior Vice President, Finance and Chief Financial Officer of PPG Industries, Inc. (“PPG”), a global supplier of paints, coatings, optical products, specialty materials, chemicals, glass and fiber glass, from 1995 until October 15, 2009. Prior to assuming those duties in 1995, he served as PPG's Controller from 1990 to 1994 and as Vice President and Controller from 1994. From 1974 until 1990, he held a number of positions at Borg-Warner Corporation, a supplier of motor vehicle parts and systems. He is a Certified Management Accountant. He is a director of USG Corporation, Eastman Kodak Company and Albemarle Corporation, all publicly-held companies.
MICHAEL MCANDREW, 53, was selected to be a director effective April 1, 2013 in connection with his appointment as the Chief Executive Officer of the Company, which became effective on the same date. Mr. McAndrew has been with the Company for 23 years. In October 2012, he was named President and Chief Operating Officer of the Company. Prior to that, he served as Executive Vice President and Chief Financial Officer from May 2010 to October 2012, and Vice President and Chief Financial Officer, from December 2002 to May 2010. He also served as Secretary and Treasurer from January 2003 to October 2012. Prior to 2002, he held the position of Manager of Corporate Planning and Analysis.
EDWARD A. NICHOLSON, PH.D., 73, was elected as a director on August 10, 2004. Dr. Nicholson served as President of Robert Morris University from 1989 to 2005 and is presently a Professor of Management at Robert Morris University. He is also a director of Brentwood Bank and several regional economic, charitable and cultural organizations. He has served a number of businesses and government agencies as a consultant in the areas of long-range planning, organization design and labor relations.
JOEL T. TRAMMELL, 48, was selected to be a director on March 27, 2013. Mr. Trammell has been a Managing Partner of Lone Rock Technology Group (private equity) since 2011. He was a founder and the CEO of CacheIQ, Inc. (network computing) from June 2010 until it was acquired by NetApp, Inc. in November 2012. Previously, he was a founder and served as the CEO of NetQoS, Inc. (network management software and services) from June 2000 to November 2009.
PART II
Item 5. Market for Registrant’s Common Equity, Related Stockholder Matters and Issuer Purchases of Equity Securities.
Common Stock InformationThe common stock is traded on NASDAQ under the symbol "BBOX" and has been assigned to the NASDAQ Global Select tier. As of March 31, 2013, 25,897,762 shares of the common stock were issued, of which 9,765,190 shares were held in treasury.
Table of Contents

10
The following table sets forth the quarterly high and low sale prices of the common stock as reported by the NASDAQ Global Select Market during each of the Company’s fiscal quarters indicated below.
High LowFiscal 2013
1st Quarter $ 28.87 $ 20.262nd Quarter 28.80 21.283rd Quarter 26.57 19.314th Quarter 26.85 21.63
Fiscal 2012 1st Quarter $ 36.20 $ 28.872nd Quarter 32.78 20.843rd Quarter 29.96 19.804th Quarter 31.94 24.34
On May 10, 2013, the last reported sale price of the common stock was $24.64 per share.
Dividend PolicyCash dividends of $0.08 per share of common stock declared during Fiscal 2013 were paid on July 13, 2012, October 12, 2012, January 11, 2013 and April 12, 2013. Cash dividends of $0.07 per share of common stock declared during Fiscal 2012 were paid on July 14, 2011, October 13, 2011, January 12, 2012 and April 13, 2012. While the Company expects to continue to declare quarterly dividends, the payment of future dividends is at the discretion of the Board and the timing and amount of any future dividends will depend upon earnings, cash requirements and the financial condition of the Company.
Under the Company’s Credit Agreement dated as of March 23, 2012 (the " Credit Agreement"), the Company is permitted to make any distribution or dividend or repurchase its common stock as long as no Event of Default or Potential Default (each as defined in the Credit Agreement) shall have occurred and is continuing or shall occur as a result thereof. In addition, no distribution or dividend on or repurchase of common stock is permitted under the Credit Agreement if such event would violate a consolidated leverage ratio other than regular quarterly dividends not exceeding $15,000 per year.
StockholdersAs of March 31, 2013, there were 1,026 holders of record of the common stock.
Equity Plan Compensation Information:See the information set forth under the caption "Equity Plan Compensation Information" in the Proxy Statement, which is incorporated by reference into Item 12 of Part III of this Annual Report.
Issuance of Unregistered Securities:There were no issuances of unregistered securities by the Company during the three-year period ended March 31, 2013.
Issuer Purchases of Equity Securities:
Period
Total Numberof Shares
PurchasedAverage Price
Paid per Share
Total Number of Shares Purchased
as Part of Publicly Announced Plans
or Programs
Maximum Number of Shares that May
Yet Be Purchased Under the Plans
or ProgramsDecember 30, 2012 to January 27, 2013 — $ — — 1,008,960January 28, 2013 to February 24, 2013 167,187 $ 25.08 167,187 841,773February 25, 2013 to March 31, 2013 — $ — — 841,773Total 167,187 $ 25.08 167,187 841,773
As of March 31, 2013, 841,773 shares were available under repurchase programs approved by the Board. This includes 1,000,000 shares approved for repurchase by the Board on each of May 4, 2012 and October 2, 2012.
Table of Contents

11
The repurchase programs have no expiration date and no programs were terminated prior to the full repurchase of the authorized amount.
Additional repurchases of common stock may occur from time to time depending upon factors such as the Company's cash flows and general market conditions. While the Company expects to continue to repurchase shares of common stock for the foreseeable future, there can be no assurance as to the timing or amount of such repurchases.
Item 6. Selected Financial Data.
The following tables set forth certain selected historical financial data for the Company (in thousands, except for per share amounts). This information should be read in conjunction with the Company’s consolidated financial statements, "Management’s Discussion and Analysis of Financial Condition and Results of Operations" and the Notes to the Consolidated Financial Statements included elsewhere in this Annual Report.
Fiscal2013 2012 2011 2010 2009
Statements of OperationsRevenues $ 997,786 $1,087,528 $ 1,068,229 $ 961,393 $ 999,548Gross profit 319,930 346,496 357,110 335,381 357,180Operating income (loss) 56,269 (239,673) 91,058 63,043 80,003Net income (loss) 28,806 (247,734) 52,862 34,503 45,309Basic earnings (loss) per share 1.73 (13.98) 2.99 1.97 2.59Diluted earnings (loss) per share 1.73 (13.98) 2.97 1.97 2.59Dividends per share 0.32 0.28 0.24 0.24 0.24
Balance Sheet Data (at end of period)Working capital * 184,229 166,167 164,595 126,585 130,209Total assets 878,001 888,023 1,171,983 1,125,364 1,136,488Long-term debt 187,648 179,621 181,127 210,873 249,260Stockholders’ equity 482,247 494,384 766,259 689,994 647,299
* Working capital is computed as current assets minus current liabilities.
Item 7. Management’s Discussion and Analysis of Financial Condition and Results of Operations ("MD&A").
The discussion and analysis for the fiscal years ended March 31, 2013, 2012 and 2011 as set forth below in this Item 7 should be read in conjunction with the consolidated financial statements of Black Box, including the related notes. The Company’s fiscal year ends on March 31. References to "Fiscal Year" or "Fiscal" mean the Company’s fiscal year ended March 31 for the year referenced. All dollar amounts are presented in thousands except for per share amounts or unless otherwise noted.
The CompanyBlack Box is a leading communications system integrator dedicated to designing, sourcing, implementing and maintaining today's complex communications solutions. The Company's primary service offering is Voice Communications; the Company also offers Data Infrastructure and Technology Products. As of March 31, 2013, the Company had more than 3,000 professional technical experts in approximately 200 offices serving more than 175,000 clients in approximately 150 countries throughout the world. Founded in 1976, Black Box operates subsidiaries on five continents and is headquartered near Pittsburgh in Lawrence, Pennsylvania.
Table of Contents

12
With respect to Voice Communications, the Company's revenues are primarily generated from the sale and/or installation of new voice communications systems, the support of voice communications systems and moves, adds and changes ("MAC work") as clients' employees change locations or as clients move or remodel their physical space. The Company's diverse portfolio of product offerings allows it to service the needs of its clients independently of the manufacturer that they choose, which it believes is a unique competitive advantage. For the sale of new voice communications systems, most significant orders are subject to competitive bidding processes and, generally, competition can be significant for such new orders. The Company is continually bidding on new projects to replace projects that are completed. New voice communications systems orders often generate an agreement to support the voice communications system, which generally ranges from 1-3 years for commercial clients and 3-5 years for government clients. Historically, such an agreement would result in a fixed fee model over a period of time; however, some of our clients are migrating toward a variable fee model based on time and materials over a period of time. While this shift decreases our contractually obligated revenues and corresponding profits, the Company believes the variable model, which is dependent on the clients need for our services, will generate revenues with similar profitability to the fixed-fee model. Sales of new voice communications systems and, to a lesser extent, MAC work, are dependent upon general economic growth and the Company's clients' capital spending. On the other hand, revenues from support agreements (fixed and variable) contracts generally are not dependent on the economy as clients seek to extend the life of their existing equipment and delay capital spending on new voice communications systems. The Company also has government contracts that generate significant revenues and are not as dependent on the overall economic environment as commercial clients. Maintenance and MAC work revenues are also dependent upon the Company's history and relationship with its clients and its long track record of providing high-quality service.
Similarly, the Company’s revenues for Data Infrastructure are generated from the installation or upgrade of data networks and MAC work. The installation of new data networks is also dependent upon general economic growth and our clients' capital spending. Installed data networks, however, may need to be upgraded in order to accommodate the growing use of network technology. Additionally, Data Infrastructure projects can include MAC work, similar to Voice Communications, which is dependent on economic factors that are the same as those factors discussed above in relation to the Voice Communications business.
There is and has been a trend toward convergence of voice and data networks, in each of which the Company has technical expertise which the Company believes is a competitive advantage. Both the Voice Communications and Data Infrastructure businesses generate backlog which is defined by the Company as orders and contracts considered to be firm. At March 31, 2013, the Company’s total backlog, which relates primarily to Voice Communications and Data Infrastructure, was $369,711 of which $264,027 is expected to be completed within the next twelve months.
The Company generates Technology Products revenues from the sale of technology products such as cables, switches and media infrastructure products through its catalog, Internet Web site and direct sales. The sale of these products is a highly fragmented and competitive business. The Company has been in this business for over 30-years and has developed a reputation for providing high quality products, free 24/7/365 technical support, comprehensive warranties and rapid order fulfillment. With an average order size of less than one thousand dollars, the Company’s Technology Products is less impacted by capital spending and more so by general information technology spending. The Company’s Technology Products business provides additional distribution and support capabilities along with access to Black Box branded products to both the Voice Communications and Data Infrastructure businesses which provide cost benefits.
The Company services a variety of clients within most major industries, with the highest concentration in government, healthcare, business services, manufacturing, retail, technology and banking. Factors that impact those verticals, therefore, could have an impact on the Company. While the Company generates most of its revenues in North America, the Company also generates revenues from around the world, primarily Europe, such that factors that impact European markets could impact the Company.
The Company strives to develop extensive and long-term relationships with high-quality clients as Management believes that satisfied clients will demand quality services and product offerings even in economic downturns.
Table of Contents

13
The Company targets strategic acquisitions which it believes will deepen its capabilities and expand market opportunity. The Company has completed several acquisitions from April 1, 2010 through March 31, 2013 that have had an impact on the Company’s consolidated financial statements and, more specifically, North America Voice Communications and North America Data Infrastructure for the periods under review. There were no acquisitions during Fiscal 2013. Fiscal 2012 acquisitions include (i) InnerWireless, Inc. ("Innerwireless"), a privately-held company headquartered in Richardson, TX, services clients in every industry from healthcare to Fortune 500 enterprises and was the first Black Box acquisition in the rapidly-growing in-building wireless market and (ii) PS Technologies, LLC, a privately-held company headquartered in Dayton, OH, services clients in the healthcare and government verticals and was the first Black Box acquisition in the rapidly-growing enterprise video communications market. The only Fiscal 2011 acquisition was LOGOS Communications Systems, Inc., a privately-held company headquartered in Westlake, OH, with an active client base which includes commercial, education and various local government agency accounts. These acquisitions are collectively referred to as the "Acquired Companies." References to the Acquired Companies within our comparison of Fiscal 2013 and Fiscal 2012 are intended to describe the Acquired Companies from April 1, 2011 through March 31, 2013. References to the Acquired Companies within our comparison of Fiscal 2012 and Fiscal 2011 are intended to describe the Acquired Companies from April 1, 2010 through March 31, 2012. The results of operations of the Acquired Companies are included within the Company’s Consolidated Statements of Operations beginning on their respective acquisition dates.
The Company incurs certain expenses such as the amortization of intangible assets on acquisitions, restructuring expense, the goodwill impairment loss, the change in fair value of the interest-rate swaps and the joint venture investment loss that it excludes when evaluating the continuing operations of the Company. The following table summarizes those expenses and their impact on Operating income (loss) and Income (loss) before provision (benefit) for income taxes for the periods presented:
Fiscal2013 2012 2011
Amortization of intangible assets on acquisitions 13,713 12,980 12,111Restructuring expense 8,445 1,866 1,793Goodwill impairment loss — 317,797 —Impact on Operating income (loss) $ (22,158) $ (332,643) $ (13,904)Change in fair value of interest-rate swaps 606 (530) (2,968)Joint venture investment loss $ 2,670 $ — $ —Impact on Income (loss) before provision (benefit) for income taxes $ (25,434) $ (332,113) $ (10,936)
Fiscal 2013 vs Fiscal 2012 Summary
In Fiscal 2013, revenues decreased by 8% which, on a geographic segment basis, included decreases of 9% in North America, 8% in Europe and 2% in All Other. From a service-type perspective, the 8% total decrease included decreases of 1% for Data Infrastructure, which includes a full year of revenues during Fiscal 2013 from Innerwireless whereas the prior year would have only included a partial year of revenues, 11% for Voice Communications and 9% for Technology Products. Our government (primarily federal) revenue vertical was down 15% as a result of delays in funding as well as project and task order initiation and our commercial revenue vertical was down 10% as a result of slower than expected economic recovery and sluggish client adoption of the rapidly changing communications technology for Voice Communications and lower IT infrastructure spend and investment levels by our end customers for Data Infrastructure which is highly dependent on project-oriented revenues.
We operate in the rapidly changing communication technology market which has inherent market risk. Economic recovery has not been as strong or as consistent in our markets as we had expected. The changes in communications technology have been rapid, and client adoption has been weak. Our management team has responded by providing technology independent solutions to meet our clients' evolving needs. However, in recent years, we have not been able to create or sustain organic growth.
Our response to the changes in our market needs to be decisive. We occupy a unique position in the market and our relationship with our partners and clients provides Black Box with valuable insight into the future of enterprise communications. We believe that communications is an organization's most important process and that our clients are best served with a technology-independent approach to meeting their communications challenges. We also believe that enterprises will adopt best of breed solutions. In response, our strategy includes four areas of focus:
• Strengthen and expand our portfolio of high-value communications solutions. As enterprise communications become more complex, we must be prepared to offer our clients the very latest solution alternatives.
Table of Contents

14
• Leverage our centralized expertise with our local skills and relationships. Over time, we have built the most competitive footprint of local technical resources in the industry. We can drive additional products and services through that platform by investing in centralized engineering and project management resources.
• Realign our organizational structure and incentive programs. During the year, we announced leadership changes within our executive and operating teams. These changes add focus and accountability to our business.
• Implement a consistent, comprehensive market penetration approach. Just as we can leverage our product and service platforms to serve our clients, we can also leverage our local resources more efficiently with focused centralized sales and marketing programs.
Successful implementation of this strategy begins with a transition of our business to a more flexible organization that can adapt to the rapid changes in communications technology. As such, the Company has realigned its organizational structure which will result in new reporting segments (North America Services, North America Products, International Services and International Products) for the purpose of making operational decisions and assessing financial performance which will be effective, on a prospective basis, beginning on April 1, 2013. This is consistent with the proliferation of voice-over-internet-protocol (VOIP) solutions and the adoption of unified communication technologies which has resulted in a trend toward convergence of voice and data networks. We believe that, in the near future, the distinction between our voice and data solution offerings will not be significant. As such, those historical Voice Communications and Data Infrastructure offerings have been aggregated into Services in their respective geography. We will report financial information (revenue through operating income) for these new reporting segments which should provide enhanced visibility and transparency into our operations, our business drivers and the value of our enterprise. We believe that a successful transition will better position Black Box as a comprehensive communications system integrator where we can support our clients with multiple offerings.
As a first step in this transition, we are focused on leveraging our technology-independent service model. We continue to believe that our best of breed, client-focused offering is a competitive advantage for Black Box. With the broad service platform that we have built, we have the opportunity to enable all of our offices with access to a comprehensive portfolio of products and services. The transition of our service model will include more client-focused resources in the field, supported by centralized expertise.
During Fiscal 2013, we worked to align our organizational structure to enable our field with better access to technical expertise and partner resources. Also, we are realigning sales and account management incentives to promote new product penetration, in effect, driving focus and action to cross-selling our portfolio of communications solutions. We believe that these changes will enable us to efficiently and effectively introduce additional new product and service offerings over time and allow us to support multiple offerings for each of our clients which, in turn, should grow our revenues organically and could increase profitability as a result of new product offerings and efficiencies in the delivery model.
The transition that we are implementing is in response to a dynamic market. Although our voice-centric approach has served us well, we recognize that the future of enterprise communications requires a more robust offering. We expect our clients to continue to look to us for creative solutions and we, in turn, expect to deliver them. As we transition, we will continue to be responsive to our clients' evolving views on enterprise communications.
The changes that we have made during Fiscal 2013 did not require significant additional investments. However, we intend to make investments in sales and marketing efforts which could have an impact on our profitability in the near term.
While we have implemented a strategy to profitably grow our revenues in this rapidly changing communication technology market, the success of that strategy and our ability to grow revenues is dependent on a reasonable level of government spending, economic recovery along with IT infrastructure spend and investments by our end customers and client adoption of rapidly-changing communications technology. There is no assurance that this strategy will be successful and any failure could impact our financial condition.
Gross profit margins increased by 0.2% to 32.1% primarily as a result of competitive market conditions for Voice Communications and Technology Products. The Company believes that the addition of new services and products to its existing technology independent service model should result in stable gross profit margins.
Operating income increased 123% which was due to the goodwill impairment loss of $317,797 incurred in the prior year partially offset by a decrease in Revenues. Operating income included $8,445 of restructuring expense which was incurred as a response to the continued weakness in our end markets to better align our costs with revenues in the form of headcount reductions and back office and real estate consolidation initiatives; we expect these actions to result in annualized savings of approximately $12 million. We will continue to evaluate all of our operating costs and investments to ensure an efficient and effective use of our resources.
Table of Contents
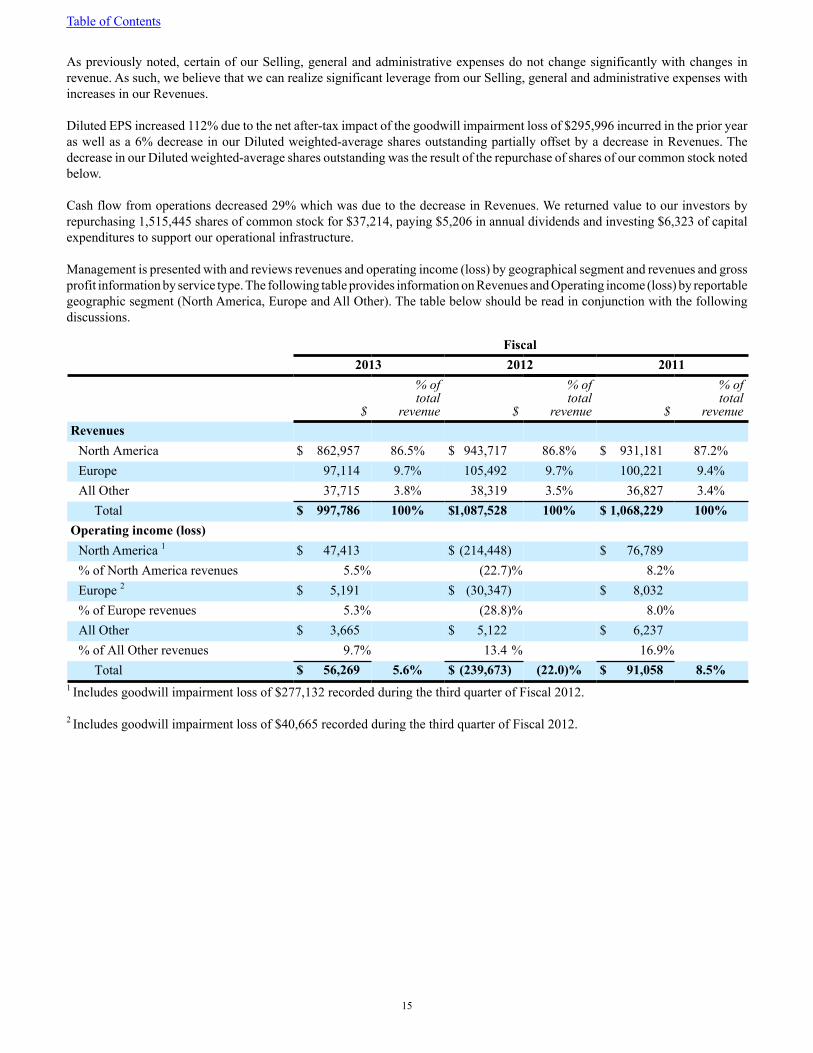
15
As previously noted, certain of our Selling, general and administrative expenses do not change significantly with changes in revenue. As such, we believe that we can realize significant leverage from our Selling, general and administrative expenses with increases in our Revenues.
Diluted EPS increased 112% due to the net after-tax impact of the goodwill impairment loss of $295,996 incurred in the prior year as well as a 6% decrease in our Diluted weighted-average shares outstanding partially offset by a decrease in Revenues. The decrease in our Diluted weighted-average shares outstanding was the result of the repurchase of shares of our common stock noted below.
Cash flow from operations decreased 29% which was due to the decrease in Revenues. We returned value to our investors by repurchasing 1,515,445 shares of common stock for $37,214, paying $5,206 in annual dividends and investing $6,323 of capital expenditures to support our operational infrastructure.
Management is presented with and reviews revenues and operating income (loss) by geographical segment and revenues and gross profit information by service type. The following table provides information on Revenues and Operating income (loss) by reportable geographic segment (North America, Europe and All Other). The table below should be read in conjunction with the following discussions.
Fiscal 2013 2012 2011
$
% oftotal
revenue $
% oftotal
revenue $
% oftotal
revenueRevenues
North America $ 862,957 86.5% $ 943,717 86.8% $ 931,181 87.2%Europe 97,114 9.7% 105,492 9.7% 100,221 9.4%All Other 37,715 3.8% 38,319 3.5% 36,827 3.4%
Total $ 997,786 100% $1,087,528 100% $ 1,068,229 100%Operating income (loss)
North America 1 $ 47,413 $ (214,448) $ 76,789% of North America revenues 5.5% (22.7)% 8.2%Europe 2 $ 5,191 $ (30,347) $ 8,032% of Europe revenues 5.3% (28.8)% 8.0%All Other $ 3,665 $ 5,122 $ 6,237% of All Other revenues 9.7% 13.4 % 16.9%
Total $ 56,269 5.6% $ (239,673) (22.0)% $ 91,058 8.5%1
Includes goodwill impairment loss of $277,132 recorded during the third quarter of Fiscal 2012.
2 Includes goodwill impairment loss of $40,665 recorded during the third quarter of Fiscal 2012.
Table of Contents

16
The following table provides information on Revenues and Gross profit by service type (Data Infrastructure, Voice Communications and Technology Products). The table below should be read in conjunction with the following discussions.
Fiscal 2013 2012 2011
$
% oftotal
revenue $
% oftotal
revenue $
% oftotal
revenueRevenues
Data Infrastructure $ 243,711 24.4% $ 247,157 22.7% $ 230,719 21.6%Voice Communications 572,371 57.4% 641,731 59.0% 648,512 60.7%Technology Products 181,704 18.2% 198,640 18.3% 188,998 17.7%
Total $ 997,786 100% $ 1,087,528 100% $ 1,068,229 100%Gross profit
Data Infrastructure $ 63,370 $ 62,032 $ 59,287% of Data Infrastructure revenues 26.0% 25.1% 25.7%Voice Communications $ 176,057 $ 196,279 $ 210,558% of Voice Communications revenues 30.8% 30.6% 32.5%Technology Products $ 80,503 $ 88,185 $ 87,265% of Technology Products revenues 44.3% 44.4% 46.2%
Total $ 319,930 32.1% $ 346,496 31.9% $ 357,110 33.4%
Fiscal 2013 Compared To Fiscal 2012
Total RevenuesTotal revenues for Fiscal 2013 were $997,786, a decrease of 8% compared to total revenues for Fiscal 2012 of $1,087,528. The Acquired Companies contributed incremental revenue of $56,647 and $31,453 for Fiscal 2013 and Fiscal 2012, respectively. Excluding the effects of the acquisitions and the negative exchange rate impact of $5,088 in Fiscal 2013 relative to the U.S. dollar, total revenues would have decreased 10% from $1,056,075 in Fiscal 2012 to $946,227 in Fiscal 2013 for the reasons discussed below.
Revenues by Geography
North AmericaRevenues in North America for Fiscal 2013 were $862,957, a decrease of 9% compared to revenues for Fiscal 2012 of $943,717. The Acquired Companies contributed incremental revenue of $56,647 and $31,453 for Fiscal 2013 and Fiscal 2012, respectively. Excluding the effects of the acquisitions and the negative exchange rate impact of $144 in Fiscal 2013 relative to the U.S. dollar, North American revenues would have decreased 12% from $912,264 in Fiscal 2012 to $806,454 in Fiscal 2013. This decrease was primarily due to a decrease for Voice Communications within the government revenue vertical, primarily caused by delays in funding as well as project and task order initiation and within the financial services, retail services, education and healthcare revenue verticals primarily as a result of slower than expected economic recovery and sluggish client adoption of the rapidly changing communications technology; for Data Infrastructure within the business services, financial services and retail services revenue verticals, primarily as a result of lower IT infrastructure spend and investment levels by our end customers; and for Technology Products within the government and business services revenue verticals, primarily as a result of slower than expected economic recovery and lower IT infrastructure spend and investment levels by our end customers.
EuropeRevenues in Europe for Fiscal 2013 were $97,114, a decrease of 8% compared to revenues for Fiscal 2012 of $105,492. Excluding the negative exchange rate impact of $4,249 in Fiscal 2013 relative to the U.S. dollar, revenues in Europe would have decreased 4% from $105,492 in Fiscal 2012 to $101,363 in Fiscal 2013. This decrease was primarily due to sluggish economic recovery that has affected demand for Data Infrastructure and Technology Products.
Table of Contents

17
All Other Revenues for All Other for Fiscal 2013 were $37,715, a decrease of 2% compared to revenues for Fiscal 2012 of $38,319. Excluding the negative exchange rate impact of $695 in Fiscal 2013 relative to the U.S. dollar, All Other revenues would have been relatively consistent at $38,319 in Fiscal 2012 and $38,410 in Fiscal 2013.
Revenue by Service Type
Data InfrastructureRevenues from Data Infrastructure for Fiscal 2013 were $243,711, a decrease of 1% compared to revenues for Fiscal 2012 of $247,157. The Acquired Companies contributed incremental revenue of $30,107 and $6,025 for Fiscal 2013 and Fiscal 2012, respectively. Excluding the effects of the acquisitions and the negative exchange rate impact of $1,263 in Fiscal 2013 relative to the U.S. dollar for international Data Infrastructure, Data Infrastructure revenues would have decreased 11% from $241,132 in Fiscal 2012 to $214,867 in Fiscal 2013. This decrease was primarily due to lower IT infrastructure spend and investment levels by our end customers in North America within the business services, financial services and retail services revenue verticals and a sluggish economic recovery that has affected demand in Europe.
Voice CommunicationsRevenues from Voice Communications for Fiscal 2013 were $572,371, a decrease of 11% compared to revenues for Fiscal 2012 of $641,731. The Acquired Companies contributed incremental revenue of $26,540 and $25,428 for Fiscal 2013 and Fiscal 2012, respectively. Excluding the effects of the acquisitions and the negative exchange rate impact of $79 in Fiscal 2013 relative to the U.S. dollar for international Voice Communications,Voice Communications revenues would have decreased 11% from $616,303 in Fiscal 2012 to $545,910 in Fiscal 2013. This decrease was primarily due to delays in funding as well as project and task order initiation in the government revenue vertical and slower than expected economic recovery and sluggish client adoption of the rapidly changing communications technology within business services, retail services, education and healthcare revenue verticals.
Technology ProductsRevenues from Technology Products for Fiscal 2013 were $181,704, a decrease of 9% compared to revenues for Fiscal 2012 of $198,640. Excluding the negative exchange rate impact of $3,746 in Fiscal 2013 relative to the U.S. dollar for international Technology Products, Technology Products revenues would have decreased 7% from $198,640 in Fiscal 2012 to $185,450 in Fiscal 2013. This decrease was primarily due to slower than expected economic recovery and lower IT infrastructure spend and investment levels by our end customers in North America within the government and business services revenue verticals and a sluggish economic recovery that has affected demand in Europe.
Gross profitGross profit for Fiscal 2013 was $319,930, a decrease of 8% compared to gross profit for Fiscal 2012 of $346,496. Gross profit as a percent of revenues for Fiscal 2013 was 32.1%, an increase of 0.2% compared to gross profit as a percentage of revenues for Fiscal 2012 of 31.9%. The decrease in gross profit was primarily due to the decrease in revenues. The increase in gross profit as a percent of revenue was the result of a percentage increase in Data Infrastructure primarily due to project mix and the completion, in Fiscal 2012, of several lower margin projects. Voice Communications and Technology Products had comparable margins period over period as a result of continued competitive market conditions.
Gross profit for Data Infrastructure for Fiscal 2013 was $63,370, or 26.0% of revenues, compared to gross profit for Fiscal 2012 of $62,032, or 25.1% of revenues. Gross profit for Voice Communications for Fiscal 2013 was $176,057, or 30.8% of revenues, compared to gross profit for Fiscal 2012 of $196,279, or 30.6% of revenues. Gross profit for Technology Products for Fiscal 2013 was $80,503, or 44.3% of revenues, compared to gross profit for Fiscal 2012 of $88,185, or 44.4% of revenues. Please see the preceding paragraph for the analysis of gross profit variances by segment.
Selling, general & administrative expensesSelling, general & administrative expenses for Fiscal 2013 were $249,924, a decrease of 2% compared to Selling, general & administrative expenses for Fiscal 2012 of $255,347. Selling, general & administrative expenses as a percent of revenues for Fiscal 2013 were 25.0%, an increase of 1.5% compared to Selling, general & administrative expenses as a percent of revenues for Fiscal 2012 of 23.5%. The decrease in Selling, general & administrative expenses, which included $8,445 of restructuring expense, was due primarily to cost savings from headcount reductions, back office and real estate consolidation initiatives to better align our costs with revenues in response to continued weakness in certain of our end markets as well as streamline certain functions. The increase in Selling, general & administrative expenses as a percent of revenue over the prior year was primarily due to decreased Revenues partially offset by the decrease in Selling, general & administrative expenses.
Table of Contents

18
Selling, general & administrative expenses generally include expenses for sales and marketing, engineering, product management, centers of excellence and corporate expenses. Certain of these expenses do not change significantly with changes in revenue.
Goodwill impairment lossThere was no Goodwill impairment loss for Fiscal 2013 compared to Goodwill impairment loss of $317,797 for Fiscal 2012. See "Goodwill" below for additional information.
Intangibles amortizationIntangibles amortization for Fiscal 2013 was $13,737, an increase of 6% compared to Intangible amortization for Fiscal 2012 of $13,025. The increase was primarily attributable to a full year of amortization during Fiscal 2013 compared to a partial year of amortization during Fiscal 2012 for acquisitions completed during Fiscal 2012.
Operating income (loss)As a result of the foregoing, Operating income for Fiscal 2013 was $56,269 compared to Operating loss for Fiscal 2012 of $239,673.
Interest expense (income), netInterest expense for Fiscal 2013 was $6,090, an increase of 18% compared to Interest expense for Fiscal 2012 of $5,148. Interest expense as a percent of revenues for Fiscal 2013 was 0.6%, an increase of 0.1% compared to Interest expense as a percent of revenues for Fiscal 2012 of 0.5%. The Company’s interest-rate swaps contributed a loss of $606 and a gain of $530 for Fiscal 2013 and Fiscal 2012, respectively, due to the change in fair value.
Excluding the Company's interest-rate swaps, the decrease in Interest expense is primarily due to a decrease in fixed settlements on the interest rate swaps caused by a reduction in the weighted-average swap rate partially offset by increases in the weighted-average interest rate from 1.1% for Fiscal 2012 to 1.5% for Fiscal 2013 and in the weighted-average outstanding debt from $194,055 for Fiscal 2012 to $203,072 for Fiscal 2013. The increase in the weighted-average interest rate is due primarily to the Credit Agreement (see below) entered into by the Company on March 23, 2012 that has slightly less favorable terms than did its predecessor.
Other expenses (income), netOther expense for Fiscal 2013 was $3,716, an increase of 198% compared to Other expense for Fiscal 2012 of $1,245. The increase was primarily due to a loss of $2,670 during the third quarter of Fiscal 2013 due to the probable divestiture of our non-controlling interest in Genesis Networks Integration Services, LLC ("GNIS"), a joint venture company which was formed in conjunction with Genesis Networks Enterprises, LLC. The GNIS divestiture was not material to the Company's consolidated financial statements and is not expected to have a material impact on future operations.
Provision (benefit) for income taxesThe tax provision for Fiscal 2013 was $17,657, an effective tax rate of 38.0%. This compared to the tax provision for Fiscal 2012 of $1,668, an effective tax rate of (0.7)%. The tax rate for Fiscal 2013 was higher than the tax rate for Fiscal 2012 primarily due to $262,703 of non-deductible goodwill impairment loss resulting from the goodwill impairment in the third quarter of Fiscal 2012 and a reduction in reserves of $1,579 during second quarter of Fiscal 2012 related to the settlement of an Internal Revenue Service audit for Fiscal 2007 through Fiscal 2010. The Company anticipates that its deferred tax asset is realizable in the foreseeable future.
Net income (loss) As a result of the foregoing, Net income for Fiscal 2013 was $28,806 compared to Net loss for Fiscal 2012 of $247,734.
Table of Contents

19
Fiscal 2012 Compared To Fiscal 2011
Total RevenuesTotal revenues for Fiscal 2012 were $1,087,528, an increase of 2% compared to total revenues for Fiscal 2011 of $1,068,229. The Acquired Companies contributed incremental revenue of $77,336 and $8,973 for Fiscal 2012 and Fiscal 2011, respectively. Excluding the effects of the acquisitions and the positive exchange rate impact of $6,725 in Fiscal 2012 relative to the U.S. dollar, total revenues would have decreased 5% from $1,059,256 in Fiscal 2011 to $1,003,467 in Fiscal 2012 for the reasons discussed below.
Revenues by Geography
North AmericaRevenues in North America for Fiscal 2012 were $943,717, an increase of 1% compared to revenues for Fiscal 2011 of $931,181. The Acquired Companies contributed incremental revenue of $77,336 and $8,973 for Fiscal 2012 and Fiscal 2011, respectively. Excluding the effects of the acquisitions and the positive exchange rate impact of $697 in Fiscal 2012 relative to the U.S. dollar, North American revenues would have decreased 6% from $922,208 in Fiscal 2011 to $865,684 in Fiscal 2012. This decrease was primarily due to decreased activity for Voice Communications within the government revenue vertical primarily caused by delays in funding as well as project and task order initiation partially offset by increased activity for both end-user and indirect sales of Data Infrastructure within the business services, financial services, retail and manufacturing revenue verticals which was a result of strategic pricing initiatives designed to grow revenues and further penetrate these markets and a general increase in activity for Technology Products primarily due to strategic pricing initiatives.
EuropeRevenues in Europe for Fiscal 2012 were $105,492, an increase of 5% compared to revenues for Fiscal 2011 of $100,221. Excluding the positive exchange rate impact of $4,382 in Fiscal 2012 relative to the U.S. dollar, revenues in Europe would have increased 1% from $100,221 in Fiscal 2011 to $101,110 in Fiscal 2012. Data Infrastructure and Technology Products activity was relatively comparable period over period.
All OtherRevenues for All Other for Fiscal 2012 were $38,319, an increase of 4% compared to revenues for Fiscal 2011 of $36,827. Excluding the positive exchange rate impact of $1,646 in Fiscal 2012 relative to the U.S. dollar, All Other revenues would have been relatively consistent at $36,827 in Fiscal 2011 and $36,673 in Fiscal 2012.
Revenue by Service Type
Data InfrastructureRevenues from Data Infrastructure for Fiscal 2012 were $247,157, an increase of 7% compared to revenues for Fiscal 2011 of $230,719. The Acquired Companies contributed incremental revenue of $6,025 and $0 for Fiscal 2012 and Fiscal 2011, respectively. Excluding the effects of the acquisitions and the positive exchange rate impact of $2,042 in Fiscal 2012 relative to the U.S. dollar for international Data Infrastructure, Data Infrastructure revenues would have increased 4% from $230,719 in Fiscal 2011 to $239,090 in Fiscal 2012. This increase was primarily due to increased activity for both end-user and indirect sales in North America within the business services, financial services, retail and manufacturing revenue verticals which was a result of strategic pricing initiatives designed to grow revenues and further penetrate this market as well as a general increase in activity in Europe.
Voice Communications Revenues from Voice Communications for Fiscal 2012 were $641,731, a decrease of 1% compared to revenues for Fiscal 2011 of $648,512. The Acquired Companies contributed incremental revenue of $71,311 and $8,973 for Fiscal 2012 and Fiscal 2011, respectively. Excluding the effects of the acquisitions, Voice Communications revenues would have decreased 11% from $639,539 in Fiscal 2011 to $570,420 in Fiscal 2012. This decrease was primarily due to decreased activity within the government revenue vertical primarily caused by delays in funding as well as project and task order initiation. There was no exchange rate impact on Voice Communications revenues as all of the Company's Voice Communications revenues are denominated in U.S. dollars.
Table of Contents

20
Technology ProductsRevenues from Technology Products for Fiscal 2012 were $198,640, an increase of 5% compared to revenues for Fiscal 2011 of $188,998. Excluding the positive exchange rate impact of $4,683 in Fiscal 2012 relative to the U.S. dollar for international Technology Products, Technology Products revenues would have increased 3% from $188,998 in Fiscal 2011 to $193,957 in Fiscal 2012. The Company believes this increase was primarily due to a general increase in activity in North America primarily due to strategic pricing initiatives along with relatively comparable activity in Europe.
Gross profitGross profit for Fiscal 2012 was $346,496, a decrease of 3% compared to gross profit for Fiscal 2011 of $357,110. Gross profit as a percent of revenues for Fiscal 2012 was 31.9%, a decrease of 1.5% compared to gross profit as a percentage of revenues for Fiscal 2011 of 33.4%. The percent decrease was due primarily to overall service type mix, strategic pricing initiatives for Voice Communications, Data Infrastructure and Technology Products and product mix and increased product costs for Technology Products. The dollar decrease was primarily due to a decrease in gross profit as a percentage of revenues.
Gross profit for Data Infrastructure for Fiscal 2012 was $62,032, or 25.1% of revenues, compared to gross profit for Fiscal 2011 of $59,287, or 25.7% of revenues. Gross profit for Voice Communications for Fiscal 2012 was $196,279, or 30.6% of revenues, compared to gross profit for Fiscal 2011 of $210,558, or 32.5% of revenues. Gross profit for Technology Products for Fiscal 2012 was $88,185, or 44.4% of revenues, compared to gross profit for Fiscal 2011 of $87,265, or 46.2% of revenues. Please see the preceding paragraph for the analysis of gross profit variances by segment.
Selling, general & administrative expensesSelling, general & administrative expenses for Fiscal 2012 were $255,347, an increase of 1% compared to Selling, general & administrative expenses for Fiscal 2011 of $253,896. Selling, general & administrative expenses as a percent of revenues for Fiscal 2012 were 23.5%, a decrease of 0.3% compared to Selling, general & administrative expenses as a percent of revenues for Fiscal 2011 of 23.8%. The increase in Selling, general & administrative expenses was primarily due to additional operating expenses for the Acquired Companies of approximately $8,645. Excluding the Acquired Companies' Selling, general & administrative expenses of $10,651 and $2,006 for Fiscal 2012 and Fiscal 2011, respectively, and the revenues of the Acquired Companies noted above, Selling, general & administrative expenses as a percent of revenues increased over the prior year primarily due to additional operating expenses related to expected higher revenues levels.
Selling, general & administrative expenses generally include expenses for sales and marketing, engineering, product management, centers of excellence and corporate expenses. Certain of these expenses do not change significantly with changes in revenue.
Goodwill impairment lossGoodwill impairment loss for Fiscal 2012 was $317,797. There was no goodwill impairment loss for Fiscal 2011. See "Goodwill" below for additional information.
Intangibles amortizationIntangibles amortization for Fiscal 2012 was $13,025, an increase of 7% compared to Intangible amortization for Fiscal 2011 of $12,156. The increase was primarily attributable to the addition of intangible assets from acquisitions completed subsequent to the fourth quarter of Fiscal 2011 partially offset by the amortization run-out for certain intangible assets.
Operating income (loss)As a result of the foregoing, Operating loss for Fiscal 2012 was $239,673 compared to Operating income for Fiscal 2011 of $91,058.
Interest expense (income), netInterest expense for Fiscal 2012 was $5,148, a decrease of 5% compared to Interest expense for Fiscal 2011 of $5,430. Interest expense as a percent of revenues was 0.5% for each of Fiscal 2012 and Fiscal 2011. The Company’s interest-rate swaps contributed gains of $530 and $2,968 for Fiscal 2012 and Fiscal 2011, respectively, due to the change in fair value.
Table of Contents

21
Excluding the Company's interest-rate swaps, the decrease in interest expense was due to decreases in the weighted-average interest rate from 1.2% for Fiscal 2011 to 1.1% for Fiscal 2012 and in the weighted-average outstanding debt from $213,124 for Fiscal 2011 to $194,055 for Fiscal 2012. The decrease in the weighted-average interest rate was due primarily to the overall decline in short-term interest rates.
Provision (benefit) for income taxesThe tax provision for Fiscal 2012 was $1,668, an effective tax rate of (0.7)%. This compared to the tax provision for Fiscal 2011 of $32,418, an effective tax rate of 38.0%. The tax rate for Fiscal 2012 was lower than the tax rate for Fiscal 2011 primarily due to $262,703 of non-deductible goodwill impairment loss resulting from the goodwill impairment in the third quarter of Fiscal 2012 and a reduction in reserves of $1,579 during second quarter of Fiscal 2012 related to the settlement of an Internal Revenue Service audit for Fiscal 2007 through Fiscal 2010 and a state audit for Fiscal 2005 through Fiscal 2011. The Company anticipates that its deferred tax asset is realizable in the foreseeable future.
Net income (loss) As a result of the foregoing, Net loss for Fiscal 2012 was $247,734 compared to Net income for Fiscal 2011 of $52,862.
Liquidity and Capital Resources
Operating ActivitiesNet cash provided by operating activities during Fiscal 2013 was $46,701. Significant factors contributing to the source of cash were: net income of $28,806 inclusive of non-cash charges of $19,123 and $7,712 for amortization/depreciation expense and stock compensation expense, respectively, as well as a decrease in trade accounts receivable of $10,047. Significant factors contributing to the use of cash include an increase in costs in excess of billings of $13,928 (primarily due to large contracts with government clients where contract billing terms do not necessarily coincide with percentage-of-completion revenue recognition) and a decrease in accrued compensation of $5,801. Changes in the above accounts are based on average Fiscal 2013 exchange rates.
Net cash provided by operating activities during Fiscal 2012 was $65,821. Significant factors contributing to the source of cash were: net loss of $247,734 inclusive of non-cash charges of $18,459, $9,296 and $317,797 for amortization/depreciation expense, stock compensation expense and goodwill impairment loss, respectively, as well as a decrease in costs in excess of billings of $19,133. Significant factors contributing to a use of cash were: increases in deferred taxes of $23,328 (primarily related to the tax deductible portion of the goodwill impairment loss) and inventory of $3,540 and decreases in accrued compensation, trade accounts payable, billings in excess of costs and accrued taxes of $3,963, $3,460, $6,603 and $9,238, respectively. Changes in the above accounts are based on average Fiscal 2012 exchange rates.
Net cash provided by operating activities during Fiscal 2011 was $54,865. Significant factors contributing to the source of cash were: net income of $52,862 inclusive of non-cash charges of $18,222, $10,270 and $7,806 for amortization/depreciation expense, stock compensation expense and deferred taxes, respectively, as well as increases in billings in excess of costs of $2,146 and accrued taxes of $2,292. Significant factors contributing to a use of cash were: increases in trade accounts receivable and costs in excess of billings of $10,393 and $17,537, respectively, as well as decreases in restructuring reserves of $3,458 and accrued expenses of $6,439. Changes in the above accounts are based on average Fiscal 2011 exchange rates.
As of March 31, 2013, 2012 and 2011, the Company had Cash and cash equivalents of $30,720, $22,444 and $31,212, respectively, working capital of $184,229, $166,167 and $164,595, respectively, and a current ratio of 2.0, 1.9 and 1.8, respectively.
The Company believes that its cash provided by operating activities and availability under its credit facility will be sufficient to fund the Company’s working capital requirements, capital expenditures, dividend program, potential stock repurchases, potential future acquisitions or strategic investments and other cash needs for the foreseeable future.
Investing ActivitiesNet cash used by investing activities during Fiscal 2013 was $8,305. Significant factors contributing to the use of cash were: $6,323 for gross capital expenditures and $2,371 for acquisitions.
Net cash used by investing activities during Fiscal 2012 was $48,418. Significant factors contributing to the use of cash were: $41,065 for acquisitions and $7,633 for gross capital expenditures.
Table of Contents

22
Net cash used by investing activities during Fiscal 2011 was $19,670. Significant factors contributing to the use of cash were: $14,640 for acquisitions and $5,149 for gross capital expenditures.
See Note 11 of the Notes to the Consolidated Financial Statements in Part II, Item 8 of this Annual Report for additional details regarding these acquisitions.
Financing ActivitiesNet cash used for financing activities during Fiscal 2013 was $29,463. Significant factors contributing to the cash outflow were: $37,214 for the purchase of common stock (including $983 for the purchase of common stock related to the vesting in May 2012 of certain restricted stock units) and $5,206 for the payment of dividends.
Net cash used for financing activities during Fiscal 2012 was $23,744. Significant factors contributing to the cash outflow were: $15,292 for the purchase of common stock (including $1,521 for the purchase of common stock related to the vesting in May 2011 of certain restricted stock units and performance shares), $4,798 for the payment of dividends, $1,911 of net payments on long-term debt and $1,743 for the payment of deferred financing costs related to the Credit Agreement.
Net cash used for financing activities during Fiscal 2011 was $26,462. Significant factors contributing to the use of cash were:$30,284 of net payments on long-term debt and $4,232 for the payment of dividends. A significant factor contributing to the source of cash was $9,239 of proceeds from the exercise of stock options.
Total DebtOn March 23, 2012, the Company entered into a Credit Agreement with Citizens Bank of Pennsylvania, as administrative agent, and certain other lender parties. The Credit Agreement expires on March 23, 2017. Borrowings under the Credit Agreement are permitted up to a maximum amount of $400,000, which includes up to $25,000 of swing-line loans and $25,000 of letters of credit. The Credit Agreement may be increased by the Company up to an additional $100,000 with the approval of the lenders and may be unilaterally and permanently reduced by the Company to not less than the then outstanding amount of all borrowings. Interest on outstanding indebtedness under the Credit Agreement accrues, at the Company’s option, at a rate based on either: (a) the greater of (i) the prime rate per annum of the agent then in effect and (ii) 0.50% plus the rate per annum announced by the Federal Reserve Bank of New York as being the weighted-average of the rates on overnight Federal funds transactions arranged by Federal funds brokers on the previous trading day, in each case plus 0% to 0.75% (determined by a leverage ratio based on the Company’s consolidated Earnings Before Interest, Taxes, Depreciation and Amortization ("EBITDA")) or (b) a rate per annum equal to the LIBOR rate plus 0.875% to 1.750% (determined by a leverage ratio based on the Company’s consolidated EBITDA). The Credit Agreement requires the Company to maintain compliance with certain non-financial and financial covenants such as leverage and fixed-charge coverage ratios. As of March 31, 2013, the Company was in compliance with all covenants under the Credit Agreement.
As of March 31, 2013, the Company had total debt outstanding of $187,752. Total debt was comprised of $187,610 outstanding under the Credit Agreement and $142 of obligations under capital leases and various other third-party, non-employee loans. The maximum amount of debt outstanding under the Credit Agreement, the weighted-average balance outstanding under the Credit Agreement and the weighted-average interest rate on all outstanding debt for Fiscal 2013 was $220,470, $203,072 and 1.5%, respectively, compared to $216,180, $194,055 and 1.1%, respectively, for Fiscal 2012, and $237,255, $213,124 and 1.2%, respectively, for Fiscal 2011.
As of March 31, 2013, the Company had $4,050 outstanding in letters of credit and $208,340 in unused commitments under the Credit Agreement.
Table of Contents
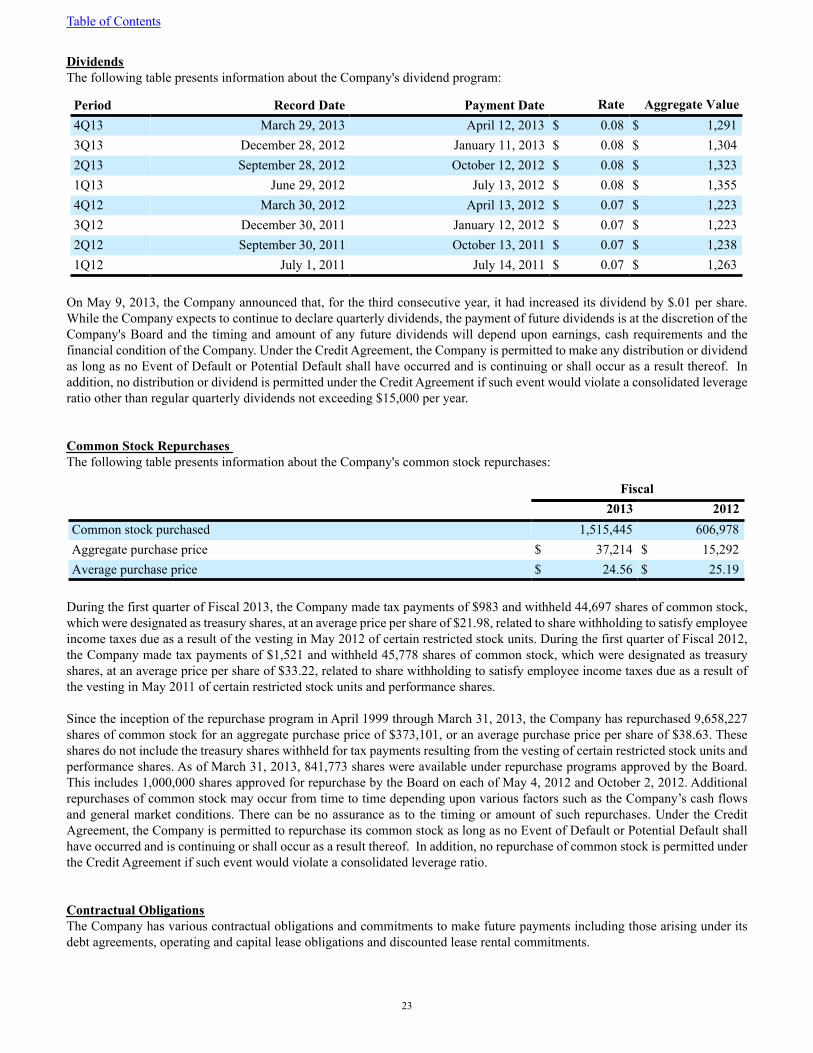
23
DividendsThe following table presents information about the Company's dividend program:
Period Record Date Payment Date Rate Aggregate Value4Q13 March 29, 2013 April 12, 2013 $ 0.08 $ 1,2913Q13 December 28, 2012 January 11, 2013 $ 0.08 $ 1,3042Q13 September 28, 2012 October 12, 2012 $ 0.08 $ 1,3231Q13 June 29, 2012 July 13, 2012 $ 0.08 $ 1,3554Q12 March 30, 2012 April 13, 2012 $ 0.07 $ 1,2233Q12 December 30, 2011 January 12, 2012 $ 0.07 $ 1,2232Q12 September 30, 2011 October 13, 2011 $ 0.07 $ 1,2381Q12 July 1, 2011 July 14, 2011 $ 0.07 $ 1,263
On May 9, 2013, the Company announced that, for the third consecutive year, it had increased its dividend by $.01 per share. While the Company expects to continue to declare quarterly dividends, the payment of future dividends is at the discretion of the Company's Board and the timing and amount of any future dividends will depend upon earnings, cash requirements and the financial condition of the Company. Under the Credit Agreement, the Company is permitted to make any distribution or dividend as long as no Event of Default or Potential Default shall have occurred and is continuing or shall occur as a result thereof. In addition, no distribution or dividend is permitted under the Credit Agreement if such event would violate a consolidated leverage ratio other than regular quarterly dividends not exceeding $15,000 per year.
Common Stock Repurchases The following table presents information about the Company's common stock repurchases:
Fiscal 2013 2012Common stock purchased 1,515,445 606,978Aggregate purchase price $ 37,214 $ 15,292Average purchase price $ 24.56 $ 25.19
During the first quarter of Fiscal 2013, the Company made tax payments of $983 and withheld 44,697 shares of common stock, which were designated as treasury shares, at an average price per share of $21.98, related to share withholding to satisfy employee income taxes due as a result of the vesting in May 2012 of certain restricted stock units. During the first quarter of Fiscal 2012, the Company made tax payments of $1,521 and withheld 45,778 shares of common stock, which were designated as treasury shares, at an average price per share of $33.22, related to share withholding to satisfy employee income taxes due as a result of the vesting in May 2011 of certain restricted stock units and performance shares.
Since the inception of the repurchase program in April 1999 through March 31, 2013, the Company has repurchased 9,658,227 shares of common stock for an aggregate purchase price of $373,101, or an average purchase price per share of $38.63. These shares do not include the treasury shares withheld for tax payments resulting from the vesting of certain restricted stock units and performance shares. As of March 31, 2013, 841,773 shares were available under repurchase programs approved by the Board. This includes 1,000,000 shares approved for repurchase by the Board on each of May 4, 2012 and October 2, 2012. Additional repurchases of common stock may occur from time to time depending upon various factors such as the Company’s cash flows and general market conditions. There can be no assurance as to the timing or amount of such repurchases. Under the Credit Agreement, the Company is permitted to repurchase its common stock as long as no Event of Default or Potential Default shall have occurred and is continuing or shall occur as a result thereof. In addition, no repurchase of common stock is permitted under the Credit Agreement if such event would violate a consolidated leverage ratio.
Contractual ObligationsThe Company has various contractual obligations and commitments to make future payments including those arising under its debt agreements, operating and capital lease obligations and discounted lease rental commitments.
Table of Contents

24
The following table summarizes significant contractual obligations and commitments of the Company as of March 31, 2013. Except as set forth in the following table, the Company does not have any material long-term purchase obligations or other long-term liabilities that are reflected on its balance sheet as of March 31, 2013:
Payments Due by Period 1
Less than 1year 1-3 years 3-5 years
More than5 years Total
Long-term debt obligations $ — $ — $ 187,610 $ — $ 187,610Interest expense on long-term debt 2,933 5,866 2,861 — 11,660Capital lease obligations 104 32 6 — 142Operating lease obligations 11,721 14,005 6,173 3,555 35,454Total contractual obligations $ 14,758 $ 19,903 $ 196,650 $ 3,555 $ 234,866
1 Not included in the above table are potential cash obligations of $18,132 associated with an unfunded pension liability due to the high degree of uncertainty regarding the timing of future cash outflows associated with such obligation.
The estimated interest expense payments on long-term debt reflected in the table above are based on both the amount outstanding under the Company's credit facility and the weighted-average interest rate in effect as of March 31, 2013.
As of March 31, 2013, the Company had commercial commitments of $4,050, which are generally due within the next twelve-months.
Off-Balance Sheet ArrangementsThe Company has no off-balance sheet arrangements that have or are reasonably likely to have a current or future effect on its financial condition, changes in its financial condition, revenues or expenses, results of operations, liquidity, capital expenditures or capital resources, other than those disclosed above, that are material to investors.
InflationThe overall effects of inflation on the Company have been nominal. Although long-term inflation rates are difficult to predict, the Company continues to strive to minimize the effect of inflation through improved productivity and cost reduction programs as well as price adjustments within the constraints of market competition.
Legal ProceedingsPlease see the matters discussed in Part I, Item 3, "Legal Proceedings" of this Annual Report, which information is incorporated herein by reference.
Critical Accounting PoliciesThe Company’s consolidated financial statements are prepared in accordance with accounting principles generally accepted in the United States, which require the Company to make estimates and assumptions that affect the reported financial condition and results of operations. Such estimates and assumptions may differ from actual results. The Company bases its estimates and assumptions on the best available information and believes them to be reasonable for the circumstances. The Company’s significant accounting policies are described in Note 2 of the Notes to the Consolidated Financial Statements. The Company believes that of its significant accounting policies, the following may involve a higher degree of judgment and complexity.
Allowance for doubtful accounts receivableThe Company records an allowance for doubtful accounts receivable as an offset to accounts receivable in order to present the net balance that the Company believes will be collected. This allowance is based on both recent trends in certain accounts receivable ("specific reserve") estimated to be a greater credit risk as well as general trends in the entire accounts receivable pool ("general reserve"). The Company computes a specific reserve by identifying specifically at-risk accounts receivable and applying historic reserve factors to the outstanding balance. The Company computes a general reserve by reviewing the accounts receivable aging and applying reserve factors based upon the age of the account receivable. If the estimate of uncollectible accounts receivable should prove inaccurate at some future date, the results of operations reported for the period could be materially affected by any necessary correction to the allowance for doubtful accounts.
Table of Contents

25
InventoriesThe Company’s inventory is valued at the lower of cost or market value and has been reduced by an allowance for excess and obsolete inventories. The Company records an estimate for slow moving and obsolete inventory ("inventory reserve") based upon our product knowledge, physical inventory observation, future demand, market conditions and an aging analysis of the inventory on hand. For “convenience,” we reduce inventory cost through a contra asset rather than through a new cost basis. If actual market conditions are less favorable than those projected by Management at some future date, the results of operations reported for the period could be materially affected by any necessary correction to the inventory reserve.
Deferred Income TaxesThe Company records deferred income tax assets and liabilities in its Consolidated Balance Sheets related to events that impact the Company’s financial statements and tax returns in different periods. Deferred tax asset and liability balances are computed by identifying differences between the book basis and tax basis of assets and liabilities ("temporary differences") which are multiplied by the current tax rate. A valuation allowance is provided on deferred tax assets if it is determined that it is more likely than not that the asset will not be realized. If the Company’s estimate of the realizable deferred tax assets should prove inaccurate at some future date, the results of operations reported for the period could be materially affected by any necessary correction to the deferred tax asset allowance.
GoodwillThe Company conducts its annual goodwill impairment assessment during the third quarter of its fiscal year, using data as of the end of the second quarter of its fiscal year. Goodwill is tested using a two-step process. The first step of the goodwill impairment assessment, used to identify potential impairment, compares the fair value of a reporting unit with its carrying amount, including goodwill ("net book value"). If the fair value of a reporting unit exceeds its net book value, goodwill of the reporting unit is considered not impaired, thus the second step of the impairment test is unnecessary. If net book value of a reporting unit exceeds its fair value, the second step of the goodwill impairment test will be performed to measure the amount of impairment loss, if any. The second step of the goodwill impairment assessment, used to measure the amount of impairment loss, if any, compares the implied fair value of reporting unit goodwill, which is determined in the same manner as the amount of goodwill recognized in a business combination, with the carrying amount of that goodwill. If the carrying amount of reporting unit goodwill exceeds the implied fair value of that goodwill, an impairment loss shall be recognized in an amount equal to that excess.
In the first step of the goodwill impairment assessment, the Company uses an income approach to derive a present value of the reporting unit’s projected future annual cash flows and the present residual value of the reporting unit. The Company uses the income approach because it believes that the discounted future cash flows provide greater detail and opportunity to reflect facts, circumstances and economic conditions for each reporting unit. In addition, the Company believes that this valuation approach is a proven valuation technique and methodology for its industry and is widely accepted by investors. The Company uses a variety of underlying assumptions to estimate these future cash flows, which vary for each of the reporting units and include (i) future revenue growth rates, (ii) future operating profitability, (iii) the weighted-average cost of capital and (iv) a terminal growth rate. If the Company’s estimates and assumptions used in the discounted future cash flows should change at some future date, the Company could incur an impairment charge which could have a material adverse effect on the results of operations reported for the period in which the impairment occurs.
In addition to estimating fair value of the Company’s reporting units using the income approach, the Company also estimates fair value using a market-based approach which relies on values based on market multiples derived from comparable public companies. The Company uses the estimated fair value of the reporting units under the market approach to validate the estimated fair value of the reporting units under the income approach.
Fiscal 2013The Company conducted its annual goodwill impairment assessment during the third quarter of Fiscal 2013 using data as of September 29, 2012. The first step of the goodwill impairment assessment, used to identify potential impairment, resulted in a surplus of fair value over carrying amount for each of our reporting units, thus the reporting units are considered not impaired and the second step of the impairment test is not necessary.
At March 31, 2013, the Company's stock market capitalization was below its net book value. However, each of the Company's reporting units continues to operate profitably and generate cash flow from operations, and the Company expects that each will continue to do so in Fiscal 2014 and beyond. The Company also believes that a reasonable potential buyer would offer a control premium for the business that would adequately cover any difference between the recent stock trading prices and the book value.
Table of Contents

26
Future events that could result in an interim assessment of goodwill impairment and/or a potential impairment loss include, but are not limited to, (i) significant underperformance relative to historical or projected future operating results, (ii) significant changes in the manner of or use of the assets or the Company's overall business strategy, (iii) significant negative industry or economic trends, (iv) a further decline in market capitalization below book value and (v) a modification to the Company's operating segments.
In connection with a new management team and a renewed business strategy, the Company has realigned its organizational structure which will result in new operating segments for the purpose of making operational decisions and assessing financial performance which changes will be effective, on a prospective basis, beginning on April 1, 2013. This change in operating segments will affect the reporting units currently being used in the Company's annual goodwill impairment assessment. Although, at the present time, we do not expect a material charge as a result of the segment change, we provide no assurance that such a charge will not occur.
Fiscal 2012Beginning in 1998 and continuing through the present time, the Company has pursued a strategy to expand its technical capabilities and geographic footprint to include Data Infrastructure and Voice Communications in North America and Data Infrastructure in Europe by acquiring over one hundred companies that resulted in recording goodwill on its balance sheet. The North America and Europe reporting units continue to operate profitably and generate positive cash flow from operations. However, the fair value as of October 1, 2011, derived from a discounted cash flow model, of the North America and Europe reporting units did not support the book value of goodwill recorded from those acquisitions. The primary factors contributing to the difference in fair value to book value were an increased weighted-average cost of capital for North America (primarily driven by an increase in the risk premium associated with the Company's industry segment relative to a control group) and lower profitability as a result of competitive market conditions for both North America and Europe.
As previously disclosed, as a result of its annual goodwill assessment conducted as of October 1, 2011, the Company, after consultation by Management with the Audit Committee (the "Audit Committee") of the Board, recorded a non-cash, pre-tax goodwill impairment charge of $317,797 during the third quarter of Fiscal 2012. The impairment charge did not impact the Company's business operations, compliance with debt covenants or future cash flows, or result in any cash expenditures.
In determining the impairment charge, the implied fair value of the reporting unit goodwill was compared to the carrying amount of the goodwill. The implied fair value of reporting unit goodwill was determined as the residual between the fair value of the reporting unit and the fair value of its assets (including any unrecognized intangible assets) and liabilities as of the annual goodwill assessment date.
Long-Lived Assets other than GoodwillThe Company reviews long-lived assets including property, plant and equipment for impairment whenever events or changes in circumstances indicate that the carrying amount of an asset may not be recoverable. If the sum of the estimated future cash flows (undiscounted) expected to result from the use and eventual disposition of an asset is less than the carrying amount of the asset, an impairment loss is recognized. Measurement of an impairment loss is based on the fair value of the asset. No impairments of long-lived assets have been identified during any of the periods presented.
Loss ContingenciesThe Company incurs contingencies as a normal part of its business operations, such as future warranty obligations and potential liabilities relating to legal or regulatory matters. The Company accrues for contingent obligations when a loss is probable and the amount can be reasonably estimated.
Revenue RecognitionWithin the Company’s Technology Products service segment, revenues are recognized when title to products sold passes to the client, which generally occurs upon shipment from the Company’s location.
Within the Company’s Data Infrastructure and Voice Communications service segments, revenues are recognized from maintenance service contracts, MAC work and network integration services when the services are provided. Service contracts are generally pre-billed, recorded in Deferred revenue within the Company’s Consolidated Balance Sheets and are generally recognized over the service period on a straight-line basis. Revenues from the sale and installation of products and systems are recognized using the percentage-of-completion method based upon the proportion of actual costs incurred to estimated total costs. At the time a loss on a contract becomes known, the entire amount of the estimated loss is recognized immediately in the financial statements. The Company has historically made reasonably accurate estimates of the extent of progress towards completion, contract revenues and contract costs on its long-term contracts. However, due to uncertainties inherent in the estimation process, actual results could differ materially from those estimates.
Table of Contents

27
Impact of Recently Issued Accounting PronouncementsThere have been no accounting pronouncements adopted during Fiscal 2013, Fiscal 2012 or Fiscal 2011 that had a material impact on the Company’s consolidated financial statements. There have been no new accounting pronouncements issued but not yet adopted that are expected to have a material impact on the Company’s consolidated financial statements.
Cautionary Forward Looking StatementsWhen included in this Annual Report or in documents incorporated herein by reference, the words "should," "expects," "intends," "anticipates," "believes," "estimates," "approximates," "targets," "plans" and analogous expressions are intended to identify forward-looking statements. One can also identify forward-looking statements by the fact that they do not relate strictly to historical or current facts. Such statements are inherently subject to a variety of risks and uncertainties that could cause actual results to differ materially from those projected. Although it is not possible to predict or identify all risk factors, such risks and uncertainties may include, among others, levels of business activity and operating expenses, expenses relating to corporate compliance requirements, cash flows, global economic and business conditions, successful integration of acquisitions, the timing and costs of restructuring programs, successful marketing of the Company's product and services offerings, successful implementation of the Company’s M&A program including identifying appropriate targets, consummating transactions and successfully integrating the businesses, successful implementation of the Company’s government contracting programs, competition, changes in foreign, political and economic conditions, fluctuating foreign currencies compared to the U.S. dollar, rapid changes in technologies, client preferences, the Company’s arrangements with suppliers of voice equipment and technology, government budgetary constraints and various other matters, many of which are beyond the Company’s control. Additional risk factors are included in this Annual Report. These forward-looking statements are made pursuant to the safe harbor provisions of the Private Securities Litigation Reform Act of 1995 and speak only as of the date of this Annual Report. The Company expressly disclaims any obligation or undertaking to release publicly any updates or any changes in the Company’s expectations with regard thereto or any change in events, conditions or circumstances on which any statement is based and cautions you not to unduly rely on any such forward-looking statements.
Item 7A. Quantitative and Qualitative Disclosures About Market Risk.
The Company is exposed to market risks in the ordinary course of business that include interest-rate volatility and foreign currency exchange rates volatility. Market risk is measured as the potential negative impact on earnings, cash flows or fair values resulting from a hypothetical change in interest rates or foreign currency exchange rates over the next year. The Company does not hold or issue any financial derivative instruments (other than those specifically noted below) nor does it engage in speculative trading of financial derivatives.
Interest-rate RiskThe Company’s primary interest-rate risk relates to its long-term debt obligations. As of March 31, 2013, the Company had total long-term obligations of $187,610 under the Credit Agreement. Of the outstanding debt, $125,000 was in variable rate debt that was effectively converted to a fixed rate through an interest-rate swap agreement (discussed in more detail below) and $62,610 was in variable rate obligations. As of March 31, 2013, an instantaneous 100 basis point increase in the interest rate of the variable rate debt would reduce the Company’s net income (loss) in the subsequent fiscal year by $154 ($95 net of tax) assuming the Company employed no intervention strategies.
To mitigate the risk of interest-rate fluctuations associated with the Company’s variable rate long-term debt, the Company has implemented an interest-rate risk management strategy that incorporates the use of derivative instruments to minimize significant unplanned fluctuations in earnings caused by interest-rate volatility. The Company’s goal is to manage interest-rate sensitivity by modifying the re-pricing characteristics of certain balance sheet liabilities so that the net-interest margin is not, on a material basis, adversely affected by the movements in interest rates.
Table of Contents

28
On June 15, 2009, the Company entered into a three-year floating-to-fixed interest-rate swap, with an effective date of July 27, 2009, that was based on a three-month LIBOR rate versus a 2.28% fixed rate and had a notional value of $100,000 (which reduced to $50,000 on July 27, 2011 and terminated on July 27, 2012). On May 19, 2011, the Company entered into a one-year floating-to-fixed interest-rate swap, with an effective date of July 26, 2011, that was based on a three-month LIBOR rate versus a 0.58% fixed rate and had a notional value of $75,000 and terminated on July 26, 2012. On November 15, 2011, the Company entered into a three-year floating-to-fixed interest-rate swap, with an effective start date of July 26, 2012, that is based on a three-month LIBOR rate versus a 1.25% fixed rate and has a notional value of $125,000. The foregoing are sometimes referred to herein as the "Company's interest-rate swaps". Changes in the fair market value of the Company's interest-rate swaps are recorded as an asset or liability within the Company's Consolidated Balance Sheets and Interest expense (income) within the Company's Consolidated Statements of Operations.
Foreign Exchange Rate RiskThe Company has operations, clients and suppliers worldwide, thereby exposing the Company’s financial results to foreign currency fluctuations. In an effort to reduce this risk of foreign currency fluctuations, the Company generally sells and purchases inventory based on prices denominated in U.S. dollars. Intercompany sales to subsidiaries are generally denominated in the subsidiaries’ local currency. The Company has entered into and will continue to enter into, on a selective basis, foreign currency contracts to reduce the foreign currency exposure related to certain intercompany transactions, primarily trade receivables and loans. All of the foreign currency contracts have been designated and qualify as cash flow hedges. The effective portion of any changes in the fair value of the derivative instruments is recorded in Accumulated Other Comprehensive Income ("AOCI") until the hedged forecasted transaction occurs or the recognized currency transaction affects earnings. Once the forecasted transaction occurs or the recognized currency transaction affects earnings, the effective portion of any related gains or losses on the cash flow hedge is reclassified from AOCI to the Company’s Consolidated Statements of Operations. In the event it becomes probable that the hedged forecasted transaction will not occur, the ineffective portion of any gain or loss on the related cash flow hedge would be reclassified from AOCI to the Company’s Consolidated Statements of Operations.
As of March 31, 2013, the Company had open foreign currency contracts in Australian and Canadian dollars, Danish krone, Euros, Mexican pesos, Norwegian kroner, British pounds sterling, Swedish krona, Swiss francs and Japanese yen. The open contracts have contract rates ranging from 0.97 to 0.99 Australian dollar, 0.99 to 1.04 Canadian dollar, 5.54 to 6.02 Danish krone, 0.74 to 0.80 Euro, 12.88 to 12.99 Mexican peso, 5.60 to 6.07 Norwegian kroner, 0.62 to 0.66 British pound sterling, 6.35 to 6.76 Swedish krona, 0.93 to 0.95 Swiss franc and 92.98 to 94.83 Japanese yen, all per U.S. dollar. The total open contracts had a notional amount of $57,451 and will expire within eleven months.
Table of Contents

29
Item 8. Financial Statements and Supplementary Data.
INDEX TO CONSOLIDATED FINANCIAL STATEMENTS
Page
Report of Independent Registered Public Accounting Firm on Internal Control over Financial Reporting
Table of Contents
Report of Independent Registered Public Accounting Firm 30
31
Consolidated Balance Sheets 32
Consolidated Statements of Operations 33
Consolidated Statements of Comprehensive Income (Loss) 34
Consolidated Statements of Stockholders’ Equity 35
Consolidated Statements of Cash Flows 36
Notes to the Consolidated Financial Statements 37

30
Report of Independent Registered Public Accounting Firm
Board of Directors and StockholdersBlack Box CorporationLawrence, Pennsylvania
We have audited the accompanying consolidated balance sheets of Black Box Corporation as of March 31, 2013 and 2012 and the related consolidated statements of operations, comprehensive income (loss), stockholders' equity and cash flows for each of the three years in the period ended March 31, 2013. In connection with our audits of the financial statements, we have also audited Schedule II - Valuation and Qualifying Accounts. These financial statements and schedule are the responsibility of the Company's management. Our responsibility is to express an opinion on these financial statements and schedule based on our audits.
We conducted our audits in accordance with the standards of the Public Company Accounting Oversight Board (United States). Those standards require that we plan and perform the audit to obtain reasonable assurance about whether the financial statements are free of material misstatement. An audit includes examining, on a test basis, evidence supporting the amounts and disclosures in the financial statements, assessing the accounting principles used and significant estimates made by management, as well as evaluating the overall presentation of the financial statements and schedule. We believe that our audits provide a reasonable basis for our opinion.
In our opinion, the consolidated financial statements referred to above present fairly, in all material respects, the financial position of Black Box Corporation at March 31, 2013 and 2012, and the results of its operations and its cash flows for each of the three years in the period ended March 31, 2013, in conformity with accounting principles generally accepted in the United States of America.
Also, in our opinion, the financial statement schedule, when considered in relation to the basic consolidated financial statements taken as a whole, presents fairly, in all material respects, the information set forth therein.
We also have audited, in accordance with the standards of the Public Company Accounting Oversight Board (United States), Black Box Corporation's internal control over financial reporting as of March 31, 2013, based on criteria established in Internal Control - Integrated Framework issued by the Committee of Sponsoring Organizations of the Treadway Commission (COSO) and our report dated May 30, 2013, expressed an unqualified opinion thereon.
/s/ BDO USA, LLP
Chicago, IllinoisMay 30, 2013
Table of Contents

31
Report of Independent Registered Public Accounting Firm on Internal Control over Financial Reporting
Board of Directors and StockholdersBlack Box CorporationLawrence, Pennsylvania
We have audited Black Box Corporation's internal control over financial reporting as of March 31, 2013, based on criteria established in Internal Control - Integrated Framework issued by the Committee of Sponsoring Organizations of the Treadway Commission (the COSO criteria). The Company's management is responsible for maintaining effective internal control over financial reporting and for its assessment of the effectiveness of internal control over financial reporting, included in the accompanying “Item 9A, Management's Report on Internal Control Over Financial Reporting.” Our responsibility is to express an opinion on the company's internal control over financial reporting based on our audit.
We conducted our audit in accordance with the standards of the Public Company Accounting Oversight Board (United States). Those standards require that we plan and perform the audit to obtain reasonable assurance about whether effective internal control over financial reporting was maintained in all material respects. Our audit included obtaining an understanding of internal control over financial reporting, assessing the risk that a material weakness exists, and testing and evaluating the design and operating effectiveness of internal control based on the assessed risk. Our audit also included performing such other procedures as we considered necessary in the circumstances. We believe that our audit provides a reasonable basis for our opinion.
A company's internal control over financial reporting is a process designed to provide reasonable assurance regarding the reliability of financial reporting and the preparation of financial statements for external purposes in accordance with generally accepted accounting principles. A company's internal control over financial reporting includes those policies and procedures that (1) pertain to the maintenance of records that, in reasonable detail, accurately and fairly reflect the transactions and dispositions of the assets of the company; (2) provide reasonable assurance that transactions are recorded as necessary to permit preparation of financial statements in accordance with generally accepted accounting principles, and that receipts and expenditures of the company are being made only in accordance with authorizations of management and directors of the company; and (3) provide reasonable assurance regarding prevention or timely detection of unauthorized acquisition, use, or disposition of the company's assets that could have a material effect on the financial statements.
Because of its inherent limitations, internal control over financial reporting may not prevent or detect misstatements. Also, projections of any evaluation of effectiveness to future periods are subject to the risk that controls may become inadequate because of changes in conditions, or that the degree of compliance with the policies or procedures may deteriorate.
In our opinion, the Company maintained, in all material respects, effective internal control over financial reporting as of March 31, 2013, based on the COSO criteria.
We have also audited, in accordance with the standards of the Public Company Accounting Oversight Board (United States), the consolidated balance sheets of Black Box Corporation as of March 31, 2013 and 2012, and the related consolidated statements of operations, comprehensive income (loss), stockholders' equity, and cash flows for each of the three years in the period ended March 31, 2013 and our report dated May 30, 2013 expressed an unqualified opinion thereon.
/s/ BDO USA, LLP
Chicago, IllinoisMay 30, 2013
Table of Contents

32
BLACK BOX CORPORATIONCONSOLIDATED BALANCE SHEETS
March 31,In thousands, except par value 2013 2012Assets
Cash and cash equivalents $ 30,720 $ 22,444Accounts receivable, net of allowance for doubtful accounts of $6,300 and $6,273 152,967 163,888Inventories, net 55,469 56,956Costs/estimated earnings in excess of billings on uncompleted contracts 101,458 87,634Other assets 26,068 22,678
Total current assets 366,682 353,600Property, plant and equipment, net 27,720 27,109Goodwill, net 345,397 346,438Intangibles, net 110,668 126,541Other assets 27,534 34,335
Total assets $ 878,001 $ 888,023Liabilities
Accounts payable $ 66,236 $ 71,095Accrued compensation and benefits 25,186 31,151Deferred revenue 33,869 35,601Billings in excess of costs/estimated earnings on uncompleted contracts 13,386 14,315Income taxes 6,650 2,574Other liabilities 37,126 32,697
Total current liabilities 182,453 187,433Long-term debt 187,648 179,621Other liabilities 25,653 26,585
Total liabilities 395,754 393,639Stockholders’ equity
Preferred stock authorized 5,000, par value $1.00, none issued — —Common stock authorized 100,000, par value $.001, 16,133 and 17,480 shares outstanding,25,898 and 25,730 issued 26 26
Additional paid-in capital 486,075 478,726Retained earnings 370,775 347,242Accumulated other comprehensive income 1,457 7,262Treasury stock, at cost 9,765 and 8,250 shares (376,086) (338,872)
Total stockholders’ equity 482,247 494,384Total liabilities and stockholders’ equity $ 878,001 $ 888,023
See Notes to the Consolidated Financial Statements
Table of Contents

33
BLACK BOX CORPORATIONCONSOLIDATED STATEMENTS OF OPERATIONS
Year Ended March 31,In thousands, except per share amounts 2013 2012 2011Revenues
Products $ 181,704 $ 198,640 $ 188,998On-Site services 816,082 888,888 879,231
Total 997,786 1,087,528 1,068,229Cost of sales *
Products 101,201 110,455 101,733On-Site services 576,655 630,577 609,386
Total 677,856 741,032 711,119Gross profit 319,930 346,496 357,110Selling, general & administrative expenses 249,924 255,347 253,896Goodwill impairment loss — 317,797 —Intangibles amortization 13,737 13,025 12,156Operating income (loss) 56,269 (239,673) 91,058Interest expense (income), net 6,090 5,148 5,430Other expenses (income), net 3,716 1,245 348Income (loss) before provision for income taxes 46,463 (246,066) 85,280Provision for income taxes 17,657 1,668 32,418Net income (loss) $ 28,806 $ (247,734) $ 52,862Earnings (loss) per common share
Basic $ 1.73 $ (13.98) $ 2.99Diluted $ 1.73 $ (13.98) $ 2.97
Weighted-average common shares outstanding Basic 16,627 17,725 17,680Diluted 16,689 17,725 17,795
Dividends per share $ 0.32 $ 0.28 $ 0.24
* Exclusive of depreciation and intangibles amortization.
See Notes to the Consolidated Financial Statements
Table of Contents

34
BLACK BOX CORPORATIONCONSOLIDATED STATEMENTS OF COMPREHENSIVE INCOME (LOSS)
Year Ended March 31,In thousands 2013 2012 2011Net income (loss) $ 28,806 $ (247,734) $ 52,862Other comprehensive income (loss)
Foreign currency translation adjustment (4,237) (6,868) 10,616Pension
Actuarial gain (loss), net of taxes of ($692), ($2,091) and ($516) (1,823) (5,503) (1,360)Amounts reclassified into results of operations, net of taxes of $104,$39 and $52 273 99 140
Derivative instrumentsNet change in fair value of cash flow hedges, net of taxes of ($142),($54) and ($111) (375) (143) (291)
Amounts reclassified into results of operations, net of taxes of $136,$59 and $170 357 154 447
Other comprehensive income (loss) $ (5,805) $ (12,261) $ 9,552Comprehensive income (loss) $ 23,001 $ (259,995) $ 62,414
See Notes to the Consolidated Financial Statements
Table of Contents

35
BLACK BOX CORPORATIONCONSOLIDATED STATEMENTS OF STOCKHOLDERS’ EQUITY
Common Stock Treasury Stock Accumulated Other
Comprehensive Income
In thousands Shares $.001 par Shares $
AdditionalPaid-inCapital
Foreign CurrencyTranslationAdjustment
DerivativeInstruments
DefinedBenefit
PensionRetainedEarnings Total
March 31, 2010 25,174 $ 25 7,626 $ (323,095) $ 451,778 $ 13,298 $ (320) $ (3,007) $ 551,315 $ 689,994Net income (loss) 52,862 52,862Foreign currency translation adjustment 10,616 10,616Pension, net of taxes
Actuarial gain (loss) (1,360) (1,360)Actuarial gain (loss) reclassified into results ofoperations
140 140Derivative Instruments, net of taxes
Net change in fair value of cash flow hedges (291) (291)Amounts reclassified into results of operations 447 447
Stock compensation expense 10,270 10,270Dividends declared (4,254) (4,254)Issuance of common stock 387 1 9,239 9,240Repurchases of common stock 17 (485) (485)Tax impact from equity awards (920) (920)March 31, 2011 25,561 $ 26 7,643 $ (323,580) $ 470,367 $ 23,914 $ (164) $ (4,227) $ 599,923 $ 766,259Net income (loss) (247,734) (247,734)Foreign currency translation adjustment (6,868) (6,868)Pension, net of taxes
Actuarial gain (loss) (5,503) (5,503)Actuarial gain (loss) reclassified into results ofoperations
99 99Derivative Instruments, net of taxes
Net change in fair value of cash flow hedges (143) (143)Amounts reclassified into results of operations 154 154
Stock compensation expense 9,296 9,296Dividends declared (4,947) (4,947)Issuance of common stock 169 — — —Repurchases of common stock 607 (15,292) (15,292)Tax impact from equity awards (937) (937)March 31, 2012 25,730 $ 26 8,250 $ (338,872) $ 478,726 $ 17,046 $ (153) $ (9,631) $ 347,242 $ 494,384Net income (loss) 28,806 28,806Foreign currency translation adjustment (4,237) (4,237)Pension, net of taxes
Actuarial gain (loss) (1,823) (1,823)Actuarial gain (loss) reclassified into results ofoperations
273 273Derivative Instruments, net of taxes
Net change in fair value of cash flow hedges (375) (375)Amounts reclassified into results of operations 357 357
Stock compensation expense 7,712 7,712Dividends declared (5,273) (5,273)Issuance of common stock 168 — — —Repurchases of common stock 1,515 (37,214) (37,214)Tax impact from equity awards (363) (363)March 31, 2013 25,898 $ 26 9,765 $ (376,086) $ 486,075 $ 12,809 $ (171) $ (11,181) $ 370,775 $ 482,247
See Notes to the Consolidated Financial Statements
Table of Contents

36
BLACK BOX CORPORATIONCONSOLIDATED STATEMENTS OF CASH FLOWS
Year Ended March 31,In thousands 2013 2012 2011Operating Activities Net income (loss) $ 28,806 $ (247,734) $ 52,862Adjustments to reconcile net income (loss) to net cash provided by (used for)operating activities
Intangibles amortization and depreciation 19,123 18,459 18,222Loss (gain) on sale of property (105) (253) (71)Deferred taxes 4,144 (18,398) 8,456Stock compensation expense 7,712 9,296 10,270Change in fair value of interest-rate swaps 606 (530) (2,968)Goodwill impairment loss — 317,797 —Joint venture investment loss 2,670 — —
Changes in operating assets and liabilities (net of acquisitions) —Accounts receivable, net 10,047 135 (10,393)Inventories, net 1,231 (3,540) 459Costs/estimated earnings in excess of billings on uncompleted contracts (13,928) 19,133 (17,537)All other assets (3,217) (2,822) (1,468)Billings in excess of costs/estimated earnings on uncompleted contracts (908) (6,603) 2,146All other liabilities (9,480) (19,119) (5,113)
Net cash provided by (used for) operating activities $ 46,701 $ 65,821 $ 54,865Investing Activities
Capital expenditures $ (6,323) $ (7,633) $ (5,149)Capital disposals 389 280 119Acquisition of businesses (payments)/recoveries 17 (39,770) (12,811)Prior merger-related (payments)/recoveries (2,388) (1,295) (1,829)
Net cash provided by (used for) investing activities $ (8,305) $ (48,418) $ (19,670)Financing Activities
Proceeds (repayments) from long-term debt $ 7,735 $ (1,911) $ (30,284)Proceeds (repayments) from short-term debt 4,005 — —Deferred financing costs (20) (1,743) (700)Purchase of treasury stock (37,214) (15,292) (485)Proceeds from the exercise of stock options — — 9,239Payment of dividends (5,206) (4,798) (4,232)Increase (decrease) in cash overdrafts 1,237 — —
Net cash provided by (used for) financing activities $ (29,463) $ (23,744) $ (26,462)Foreign currency exchange impact on cash $ (657) $ (2,427) $ 1,594Increase/(decrease) in cash and cash equivalents $ 8,276 $ (8,768) $ 10,327Cash and cash equivalents at beginning of period $ 22,444 $ 31,212 $ 20,885Cash and cash equivalents at end of period $ 30,720 $ 22,444 $ 31,212Supplemental cash flow
Cash paid for interest $ 5,092 $ 6,557 $ 8,557Cash paid for income taxes 10,097 29,437 21,513Non-cash financing activities
Dividends payable 1,291 1,223 1,075Capital leases 33 36 143
See Notes to the Consolidated Financial Statements
Table of Contents

37
BLACK BOX CORPORATIONNOTES TO THE CONSOLIDATED FINANCIAL STATEMENTS
Note 1: Business and Basis of Presentation
BusinessBlack Box Corporation ("Black Box," "we," the "Company" or "our") is a leading communications system integrator dedicated to designing, sourcing, implementing and maintaining today's complex communications solutions. The Company's primary service offering is voice communications solutions ("Voice Communications"); the Company also offers premise cabling and other data-related services solutions ("Data Infrastructure") and technology product solutions (“Technology Products”). Voice Communications and Data Infrastructure may collectively be referred to as “On-Site services.” As of March 31, 2013, the Company had more than 3,000 professional technical experts in approximately 200 offices serving more than 175,000 clients in approximately 150 countries throughout the world. Founded in 1976, Black Box, a Delaware corporation, operates subsidiaries on five continents and is headquartered near Pittsburgh in Lawrence, Pennsylvania.
Basis of PresentationReferences herein to "Fiscal Year" or "Fiscal" mean the Company’s fiscal year ended March 31 for the year referenced. All references to dollar amounts herein are presented in thousands, except per share amounts, unless otherwise noted.
The consolidated financial statements include the accounts of the parent company and its wholly-owned subsidiaries. All significant intercompany accounts and transactions have been eliminated in consolidation. Certain items in the consolidated financial statements of prior years have been reclassified to conform to the current year’s presentation.
The preparation of financial statements in conformity with accounting principles generally accepted in the United States of America requires Company management ("Management") to make estimates and assumptions that affect the reported amounts of assets and liabilities and disclosure of contingent assets and liabilities at the date of the financial statements and the reported amounts of revenues and expenses during the reporting period. Significant estimates in these financial statements include project progress towards completion to estimated budget, allowances for doubtful accounts receivable, sales returns, net realizable value of inventories, loss contingencies, warranty reserves, intangible assets and goodwill. Actual results could differ from those estimates. Management believes the estimates made are reasonable.
Note 2: Significant Accounting Policies
Cash and cash equivalentsThe Company considers all highly liquid investments purchased with an original maturity of three-months or less to be cash equivalents. Cash and cash equivalents are stated at cost, which approximates fair value.
Allowance for doubtful accounts receivableAn allowance for doubtful accounts is recorded as an offset to accounts receivable in order to present the net balance that the Company believes will be collected. This allowance is based on both recent trends in certain accounts receivable ("specific reserve") estimated to be a greater credit risk as well as general trends in the entire accounts receivable pool ("general reserve"). The Company computes a specific reserve by identifying specifically at-risk accounts receivable and applying historic reserve factors to the outstanding balance. The Company computes a general reserve by reviewing the accounts receivable aging and applying reserve factors based upon the age of the account receivable. Additions to the allowance for doubtful accounts are charged to Selling, general & administrative expense within the Company’s Consolidated Statements of Operations, and deductions from the allowance are recorded when specific accounts receivable are written off as uncollectible. The provision for doubtful accounts expense was $3,556, $3,006 and $2,674 for Fiscal 2013, Fiscal 2012 and Fiscal 2011, respectively.
InventoriesInventories are valued at the lower of cost or market. The Company uses the first-in, first-out average cost method to value the majority of its inventory. However, several locations within the Company use other valuation methods, including first-in, first-out ("FIFO"). The Company records an estimate for slow moving and obsolete inventory ("inventory reserve") based upon our product knowledge, physical inventory observation, future demand, market conditions and an aging analysis of the inventory on hand. For “convenience,” we reduce inventory cost through a contra asset rather than through a new cost basis. Upon a subsequent sale or disposal of the impaired inventory, the corresponding reserve is relieved to ensure the cost basis of the inventory reflects any reductions.
Table of Contents

38
Property, Plant and EquipmentProperty, plant and equipment are stated at cost, net of accumulated depreciation. Maintenance, repairs and minor renewals are charged to operations as incurred. Major renewals and betterments, which substantially extend the useful life of the property, are capitalized at cost. Upon sale or other disposition of assets, the costs and related accumulated depreciation are removed from the accounts and the resulting gain or loss, if any, is reflected in the Consolidated Statements of Operations.
Depreciation is computed using the straight-line method based on the estimated useful lives of 30 to 40 years for buildings and improvements and 3 to 5 years for equipment and computer hardware and software. Leasehold improvements are depreciated over their lease terms, or useful lives, if shorter. The Company reviews property, plant and equipment for impairment whenever events or changes in circumstances indicate that the carrying amount of an asset may not be recoverable. If the sum of the estimated future cash flows (undiscounted) expected to result from the use and eventual disposition of an asset is less than the carrying amount of the asset, an impairment loss is recognized. Measurement of an impairment loss is based on the fair value of the asset. No impairment of property, plant and equipment has been identified during any of the periods presented.
GoodwillGoodwill is the excess of purchase price over the value of net assets acquired in acquisitions. The Company conducts its annual goodwill impairment assessment during the third quarter of its fiscal year, using data as of the end of the second quarter of its fiscal year. Goodwill is tested using a two-step process. The first step of the goodwill impairment assessment, used to identify potential impairment, compares the fair value of a reporting unit with its carrying amount, including goodwill ("net book value"). If the fair value of a reporting unit exceeds its net book value, goodwill of the reporting unit is considered not impaired, thus the second step of the impairment test is unnecessary. If net book value of a reporting unit exceeds its fair value, the second step of the goodwill impairment test will be performed to measure the amount of impairment loss, if any. The second step of the goodwill impairment assessment, used to measure the amount of impairment loss, if any, compares the implied fair value of reporting unit goodwill, which is determined in the same manner as the amount of goodwill recognized in a business combination, with the carrying amount of that goodwill. If the carrying amount of reporting unit goodwill exceeds the implied fair value of that goodwill, an impairment loss shall be recognized in an amount equal to that excess.
In the first step of the goodwill impairment assessment, the Company uses an income approach to derive a present value of the reporting unit’s projected future annual cash flows and the present residual value of the reporting unit. The Company uses the income approach because it believes that the discounted future cash flows provide greater detail and opportunity to reflect facts, circumstances and economic conditions for each reporting unit. In addition, the Company believes that this valuation approach is a proven valuation technique and methodology for its industry and is widely accepted by investors. The Company uses a variety of underlying assumptions to estimate these future cash flows, which vary for each of the reporting units and include (i) future revenue growth rates, (ii) future operating profitability, (iii) the weighted-average cost of capital and (iv) a terminal growth rate. If the Company’s estimates and assumptions used in the discounted future cash flows should change at some future date, the Company could incur an impairment charge which could have a material adverse effect on the results of operations reported for the period in which the impairment occurs.
In addition to estimating fair value of the Company’s reporting units using the income approach, the Company also estimates fair value using a market-based approach which relies on values based on market multiples derived from comparable public companies. The Company uses the estimated fair value of the reporting units under the market approach to validate the estimated fair value of the reporting units under the income approach. See Note 5 for additional reference.
Intangible AssetsDefinite-lived intangible assets are amortized on a straight-line basis over their estimated useful lives of 3 to 5 years for non-compete agreements, one year for backlog and 4 to 20 years for customer relationships. Indefinite-lived intangible assets not subject to amortization consist solely of the Company’s trademark portfolio and are reviewed for impairment annually. The Company reviews definite-lived intangible assets for impairment whenever events or changes in circumstances indicate that the carrying amount of an asset may not be recoverable. If the sum of the estimated future cash flows (undiscounted) expected to result from the use and eventual disposition of an asset is less than the carrying amount of the asset, an impairment loss is recognized. Measurement of an impairment loss is based on the fair value of the asset. No impairments of intangible assets have been identified during any of the periods presented.
Table of Contents

39
Derivative Instruments and Hedging ActivitiesForeign Currency ContractsThe Company has operations, clients and suppliers worldwide, thereby exposing the Company’s financial results to foreign currency fluctuations. In an effort to reduce this risk of foreign currency fluctuations, the Company generally sells and purchases inventory based on prices denominated in U.S. dollars. Intercompany sales to subsidiaries are generally denominated in the subsidiaries’ local currency. The Company has entered and will continue in the future, on a selective basis, to enter into foreign currency contracts to reduce the foreign currency exposure related to certain intercompany transactions, primarily trade receivables and loans. All of the foreign currency contracts are recognized on the consolidated balance sheet at fair value and have been designated and qualify as cash flow hedges. The effective portion of any changes in the fair value of the derivative instruments is recorded in Accumulated other comprehensive income ("AOCI") until the hedged forecasted transaction occurs or the recognized currency transaction affects earnings. Once the forecasted transaction occurs or the recognized currency transaction affects earnings, the effective portion of any related gains or losses on the cash flow hedge is reclassified from AOCI to the Company’s Consolidated Statements of Operations. In the event it becomes probable that the hedged forecasted transaction will not occur, the ineffective portion of any gain or loss on the related cash flow hedge would be reclassified from AOCI to the Company’s Consolidated Statements of Operations.
Interest-rate SwapTo mitigate the risk of interest rate fluctuations associated with the Company’s variable rate long-term debt, the Company has implemented an interest rate risk management strategy that incorporates the use of derivative instruments to minimize significant unplanned fluctuations in earnings caused by interest rate volatility. The Company’s goal is to manage interest rate sensitivity by modifying the re-pricing characteristics of certain balance sheet liabilities so that the net-interest margin is not, on a material basis, adversely affected by the movements in interest rates. The interest-rate swaps (defined below) are recognized on the consolidated balance sheets at fair value. They do not meet the requirements for hedge accounting and are marked to market through Interest expense (income) within the Company’s Consolidated Statements of Operations.
Foreign Currency TranslationThe financial statements of the Company’s foreign subsidiaries, except those subsidiaries in Brazil and Mexico, are recorded in the local currency, which is the functional currency. Foreign currency assets and liabilities are translated into U.S. dollars at the rate of exchange existing at the year-end date. Revenues and expenses are translated at the average monthly exchange rates. Adjustments resulting from these translations are recorded in AOCI within the Company’s Consolidated Balance Sheets and will be included in the Company’s Consolidated Statements of Operations upon sale or liquidation of the foreign investment. Gains and losses from foreign currency transactions, denominated in a currency other than the functional currency, are insignificant to the Consolidated Statement of Operations and are recorded in Other expenses (income) within the Company’s Consolidated Statements of Operations. The U.S. dollar is the functional currency for those subsidiaries located in Brazil and Mexico.
RevenueWithin the Company’s Technology Products service type, revenues are recognized when title to products sold passes to the client, which generally occurs upon shipment from the Company’s location.
Within the Company’s Data Infrastructure and Voice Communications segments, revenues are recognized from maintenance service contracts, moves, adds and changes and network integration services when the services are provided. Service contracts are generally pre-billed, recorded in Deferred revenue within the Company’s Consolidated Balance Sheets and are generally recognized over the service period on a straight-line basis. Revenues from the sale and installation of products and systems are recognized using the percentage-of-completion method based upon the proportion of actual costs incurred to estimated total costs. At the time a loss on a contract becomes known, the entire amount of the estimated loss is recognized immediately in the financial statements. The Company has historically made reasonably accurate estimates of the extent of progress towards completion, contract revenues and contract costs on its long-term contracts. However, due to uncertainties inherent in the estimation process, actual results could differ materially from those estimates.
Sales returns - At the time of sale, an estimate for sales returns is recorded based on historical experience.
Warranties - Estimated future warranty costs related to certain products are charged to operations in the period the related revenue is recognized based on historical experience.
Shipping and handling fees and costs - All fees billed to clients for shipping and handling are classified as a component of Revenues. All costs associated with shipping and handling are classified as a component of Cost of sales.
Sales tax and other tax presentation - Sales taxes and other taxes are collected from clients on behalf of governmental authorities at the time of sale. These taxes are accounted for on a net basis and are not included in Revenues or Cost of sales.
Table of Contents

40
Stock-Based CompensationStock options: The Company records expense for those stock awards, vesting during the period, for which the requisite service period is expected to be rendered. The Company uses historical data in order to project the future employee turnover rates used to estimate the number of stock options for which the requisite service period will not be rendered. The fair value of stock options is determined on the grant date using a Black-Scholes option pricing model which includes several subjective assumptions. The Company recognizes the fair value of these awards into expense ratably over the requisite service periods associated with the award. The assumptions are summarized as follows:
Expected volatility: The Company estimates the volatility of its common stock, par value $.001 per share (the "common stock"), at the date of grant based on the historical volatility of its common stock.
Dividend yield: The Company estimates the dividend yield assumption based on the Company’s historical and projected dividend payouts.
Risk-free interest rate: The Company derives its risk-free interest rate on the observed interest rates appropriate for the term of the Company’s employee stock options.
Expected holding period: The Company estimates the expected holding period based on historical experience.
Restricted stock units: The Company records expense for those stock awards, vesting during the period, for which the requisite service period is expected to be rendered. The Company uses historical data in order to project the future employee turnover rates used to estimate the number of restricted stock units for which the requisite service period will not be rendered. The fair value of restricted stock units is determined based on the number of restricted stock units granted and the closing market price of the common stock on the date of grant. The Company recognizes the fair value of awards into expense ratably over the requisite service periods associated with the award.
Performance share awards: The Company records expense for those stock awards, vesting during the period, for which the requisite service period is expected to be rendered. The Company uses historical data in order to project the future employee turnover rates used to estimate the number of performance shares for which the requisite service period will not be rendered. The fair value of performance share awards subject to a cumulative Adjusted EBITDA target (as defined in the performance share award agreement) is determined based on the number of performance shares granted and the closing market price of the common stock on the date of grant. The Company recognizes the fair value of awards into expense ratably over the requisite service periods associated with the award. The probability of vesting of the award and the applicable number of shares of common stock to be issued are reassessed at each period end. The fair value of performance share awards subject to the Company’s total shareholder return ranking relative to the total shareholder return of the common stock (or its equivalent) of the companies in a peer group (the "Company’s Relative TSR Ranking") is determined on the grant date using a Monte-Carlo simulation valuation method which includes several subjective assumptions. The Company recognizes the fair value of these awards into expense ratably over the requisite service periods associated with the award. The assumptions are summarized as follows:
Expected volatility. The Company estimates the volatility of its common stock at the date of grant based on the historical volatility of its common stock.
Risk-Free rate. The Company derives its risk-free interest rate on the observed interest rates with an equivalent remaining term equal to the expected life of the award.
Dividend yield. The Company estimates the dividend yield assumption based on the Company’s historical and projected dividend payouts.
Marketing and Advertising ExpensesCatalogs and other direct marketing pieces are capitalized and amortized over their expected period of future benefit ranging from one to two-years, which is recorded in Prepaid and other assets within the Company’s Consolidated Balance Sheets. All other advertising costs are expensed as incurred.
Advertising expense was $4,636, $5,224 and $5,621 for Fiscal 2013, Fiscal 2012 and Fiscal 2011, respectively, and is recorded in Selling, general & administrative expenses within the Company’s Consolidated Statements of Operations.
Table of Contents

41
Income TaxesThe Company accounts for income taxes using an asset and liability approach, which requires the recognition of deferred income tax assets and liabilities for the expected future tax consequences of events that have been recognized in the Company’s financial statements or tax returns. Deferred income tax assets and liabilities are determined based on the temporary differences between the financial statement and tax basis of assets and liabilities using enacted tax rates. A valuation allowance is provided on deferred tax assets if it is determined that it is more likely than not that the asset will not be realized.
The Company requires that the realization of an uncertain income tax position must be "more likely than not" (i.e., greater than 50% likelihood of receiving a benefit) before it can be recognized in the financial statements. The benefit to be recorded in the financial statements is the amount most likely to be realized assuming a review by tax authorities having all relevant information and applying current conventions. The Company includes interest and penalties related to uncertain tax positions within the Provision (benefit) for income taxes within the Company’s Consolidated Statements of Operations.
Per share informationBasic earnings (loss) per common share ("basic EPS") is computed by dividing Net income (loss) by the weighted-average number of shares of the common stock outstanding during the period. Diluted earnings (loss) per share of the common stock ("diluted EPS") is computed similarly to that of basic EPS, except that the weighted-average number of shares of the common stock outstanding during the period is adjusted to include the number of additional shares of the common stock that would have been outstanding if the potential number of dilutive shares of the common stock had been issued.
Fair ValueThe Company’s assets and liabilities recorded at fair value are categorized based upon a fair value hierarchy that ranks the quality and reliability of the information used to determine fair value. The levels of the fair value hierarchy are described below:
Level 1: Unadjusted quoted prices in active markets that are accessible at the measurement date for identical, unrestricted assets or liabilities.
Level 2: Inputs other than quoted prices included within Level 1 that are observable for the asset or liability, either directly or indirectly, including quoted prices for similar assets or liabilities in active markets; quoted prices for identical or similar assets or liabilities in markets that are not active; inputs other than quoted prices that are observable for the asset or liability (e.g., interest rates); and inputs that are derived principally from or corroborated by observable market data by correlation or other means.
Level 3: Inputs that are both significant to the fair value measurement and unobservable.
Assets and liabilities measured at fair value are based on one or more of the valuation techniques. The valuation techniques are described below.
Market approach: The market approach uses prices and other relevant information generated by market transactions involving identical or comparable assets or liabilities.
Cost approach: The cost approach is based on the amount that currently would be required to replace the service capacity of an asset (current replacement cost).
Income approach: The income approach uses valuation techniques to convert future amounts to a single present amount.
The fair value of foreign currency contracts is determined using the market approach and primarily based on observable foreign exchange forward rates. The fair value of the interest-rate swaps (as defined below) is determined using the income approach and is predominately based on observable interest rates and yield curves. The fair value of certain of the Company’s financial instruments, including Accounts receivable and Accounts payable, approximates the carrying value due to the relatively short maturity of such instruments. The fair value of the Company's Long-term debt approximates carrying value because the interest rate is subject to change with market interest rates. There have been no changes in the Company’s valuation techniques used to measure fair values during Fiscal 2013. See Note 9 for further reference.
Recently Issued Accounting Standards There have been no accounting pronouncements adopted during Fiscal 2013, Fiscal 2012 or Fiscal 2011 that had a material impact on the Company’s consolidated financial statements. There have been no new accounting pronouncements issued but not yet adopted that are expected to have a material impact on the Company’s consolidated financial statements.
Table of Contents

42
Note 3: Inventories
The Company’s Inventories consist of the following:
March 31, 2013 2012Raw materials $ 1,231 $ 1,260Finished goods 72,278 74,596Inventory, gross 73,509 75,856Excess and obsolete inventory reserves (18,040) (18,900)Inventories, net $ 55,469 $ 56,956
Note 4: Property, Plant and Equipment
The Company’s Property, plant and equipment consist of the following:
March 31, 2013 2012Land $ 2,396 $ 2,396Building and improvements 30,823 31,011Equipment and computer hardware and software 67,651 66,052Property, plant and equipment, gross 100,870 99,459Accumulated depreciation (73,150) (72,350)Property, plant and equipment, net $ 27,720 $ 27,109
Depreciation expense was $5,386, $5,434 and $6,066 for Fiscal 2013, Fiscal 2012 and Fiscal 2011, respectively.
Note 5: GoodwillThe following table summarizes Goodwill at the Company’s reportable segments:
North America Europe All Other TotalGoodwill (gross) at March 31, 2011 $ 574,964 $ 72,752 $ 2,308 $ 650,024Accumulated impairment losses at March 31, 2011 — — — —Goodwill (net) at March 31, 2011 $ 574,964 $ 72,752 $ 2,308 $ 650,024
Foreign currency translation adjustment (10) (3,369) (64) (3,443)Current period acquisitions (see Note 11) 14,084 — — 14,084Prior period acquisitions (see Note 11) 3,570 — — 3,570Goodwill impairment loss (277,364) (40,433) — (317,797)
Goodwill (gross) at March 31, 2012 $ 592,608 $ 69,383 $ 2,244 $ 664,235Accumulated impairment losses at March 31, 2012 (277,364) (40,433) — (317,797)Goodwill (net) at March 31, 2012 $ 315,244 $ 28,950 $ 2,244 $ 346,438
Foreign currency translation adjustment 9 (1,098) 45 (1,044)Current period acquisitions (see Note 11) — — 3 3Prior period acquisitions (see Note 11) — — — —
Goodwill (gross) at March 31, 2013 $ 592,617 $ 68,285 $ 2,292 $ 663,194Accumulated impairment losses at March 31, 2013 (277,364) (40,433) — (317,797)Goodwill (net) at March 31, 2013 $ 315,253 $ 27,852 $ 2,292 $ 345,397
Table of Contents

43
Fiscal 2013The Company conducted its annual goodwill impairment assessment during the third quarter of Fiscal 2013 using data as of September 29, 2012. The first step of the goodwill impairment assessment, used to identify potential impairment, resulted in a surplus of fair value over carrying amount for each of our reporting units, thus the reporting units are considered not impaired and the second step of the impairment test is not necessary.
At March 31, 2013, the Company's stock market capitalization was below its net book value. However, each of the Company's reporting units continues to operate profitably and generate cash flow from operations, and the Company expects that each will continue to do so in Fiscal 2014 and beyond. The Company also believes that a reasonable potential buyer would offer a control premium for the business that would adequately cover any difference between the recent stock trading prices and the book value.
Future events that could result in an interim assessment of goodwill impairment and/or a potential impairment loss include, but are not limited to, (i) significant underperformance relative to historical or projected future operating results, (ii) significant changes in the manner of or use of the assets or the Company's overall business strategy, (iii) significant negative industry or economic trends, (iv) a further decline in market capitalization below book value and (v) a modification to the Company's operating segments.
In connection with a new management team and a renewed business strategy, the Company has realigned its organizational structure which will result in new operating segments for the purpose of making operational decisions and assessing financial performance which changes will be effective, on a prospective basis, beginning on April 1, 2013. This change in operating segments will affect the reporting units currently being used in the Company's annual goodwill impairment assessment. Although, at the present time, we do not expect a material charge as a result of the segment change, we provide no assurance that such a charge will not occur.
Fiscal 2012Beginning in 1998 and continuing through the present time, the Company has pursued a strategy to expand its technical capabilities and geographic footprint to include Data Infrastructure and Voice Communications in North America and Data Infrastructure in Europe by acquiring over one hundred companies that resulted in recording goodwill on its balance sheet. The North America and Europe reporting units continue to operate profitably and generate positive cash flow from operations. However, the fair value as of October 1, 2011, derived from a discounted cash flow model, of the North America and Europe reporting units did not support the book value of goodwill recorded from those acquisitions. The primary factors contributing to the difference in fair value to book value were an increased weighted-average cost of capital for North America (primarily driven by an increase in the risk premium associated with the Company's industry segment relative to a control group) and lower profitability as a result of competitive market conditions for both North America and Europe.
As previously disclosed, as a result of its annual goodwill assessment conducted as of October 1, 2011, the Company, after consultation by Management with the Audit Committee (the "Audit Committee") of the Company's Board of Directors (the "Board"), recorded a non-cash, pre-tax goodwill impairment charge of $317,797 during the third quarter of Fiscal 2012. The impairment charge did not impact the Company's business operations, compliance with debt covenants or future cash flows, or result in any cash expenditures.
In determining the impairment charge, the implied fair value of the reporting unit goodwill was compared to the carrying amount of the goodwill. The implied fair value of reporting unit goodwill was determined as the residual between the fair value of the reporting unit and the fair value of its assets (including any unrecognized intangible assets) and liabilities as of the annual goodwill assessment date.
Table of Contents

44
Note 6: Intangible Assets
The following table summarizes the gross carrying amount, accumulated amortization and net carrying amount by intangible asset class:
March 31, 2013 2012
GrossCarryingAmount
Accum.Amort.
NetCarryingAmount
GrossCarryingAmount
Accum.Amort.
NetCarryingAmount
Definite-lived Non-compete agreements $ 12,189 $ 10,906 $ 1,283 $ 12,228 $ 10,194 $ 2,034Customer relationships 137,267 58,092 79,175 140,669 47,226 93,443Acquired backlog 20,838 18,367 2,471 20,838 17,513 3,325
Total $ 170,294 $ 87,365 $ 82,929 $ 173,735 $ 74,933 $ 98,802Indefinite-lived
Trademarks 35,992 8,253 27,739 35,992 8,253 27,739Total $ 206,286 $ 95,618 $ 110,668 $ 209,727 $ 83,186 $ 126,541
The Company’s indefinite-lived intangible assets consist solely of the Company’s trademark portfolio. The Company’s definite-lived intangible assets are comprised of employee non-compete agreements, customer relationships and backlog obtained through business acquisitions.
The following table summarizes the changes to the net carrying amounts by Intangible asset class:
TrademarksNon-Competes
and BacklogCustomer
Relationships TotalMarch 31, 2011 $ 27,739 $ 1,328 $ 91,066 $ 120,133
Intangibles amortization — (1,100) (11,925) (13,025)Foreign currency translation adjustment — 5 — 5Current period acquisitions (see Note 11) — 5,126 14,302 19,428
March 31, 2012 $ 27,739 $ 5,359 $ 93,443 $ 126,541Intangibles amortization — (1,609) (12,128) (13,737)Foreign currency translation adjustment — 4 — 4Other 1 — — (2,140) (2,140)
March 31, 2013 $ 27,739 $ 3,754 $ 79,175 $ 110,6681
Primarily represents the write-off of the net book value of intangible assets due to the probable divestiture of our non-controlling interest in Genesis Networks Integration Services, LLC, a joint venture company which was formed in conjunction with Genesis Networks Enterprises, LLC.
Intangibles amortization was $13,737, $13,025 and $12,156 for Fiscal 2013, Fiscal 2012 and Fiscal 2011, respectively.
The following table details the estimated intangibles amortization expense for the next five years.
Fiscal 2014 $ 12,0252015 10,5422016 10,3372017 9,4252018 8,097Thereafter 32,503Total $ 82,929
Table of Contents

45
Note 7: Indebtedness
Short-Term DebtThe Company finances certain vendor-specific inventory under an unsecured revolving arrangement through a third party which provides extended payment terms beyond those offered by the vendor at no incremental cost to the Company. The outstanding balance for this unsecured revolving arrangement was $4,006 as of March 31, 2013 and is recorded as a current liability in Other liabilities within the Company's Consolidated Balance Sheets.
Long-Term DebtThe Company’s long-term debt consists of the following:
March 31, 2013 2012Revolving credit agreement $ 187,610 $ 179,470Other 142 514Total debt $ 187,752 $ 179,984
Less: current portion (included in Other liabilities) (104) (363)Long-term debt $ 187,648 $ 179,621
On March 23, 2012, the Company entered into a Credit Agreement (the "Credit Agreement") with Citizens Bank of Pennsylvania, as administrative agent, and certain other lender parties. The Credit Agreement expires on March 23, 2017. Borrowings under the Credit Agreement are permitted up to a maximum amount of $400,000, which includes up to $25,000 of swing-line loans and $25,000 of letters of credit. The Credit Agreement may be increased by the Company up to an additional $100,000 with the approval of the lenders and may be unilaterally and permanently reduced by the Company to not less than the then outstanding amount of all borrowings. Interest on outstanding indebtedness under the Credit Agreement accrues, at the Company’s option, at a rate based on either: (a) the greater of (i) the prime rate per annum of the agent then in effect and (ii) 0.50% plus the rate per annum announced by the Federal Reserve Bank of New York as being the weighted-average of the rates on overnight Federal funds transactions arranged by Federal funds brokers on the previous trading day, in each case plus 0% to 0.75% (determined by a leverage ratio based on the Company’s consolidated Earnings Before Interest, Taxes, Depreciation and Amortization ("EBITDA")) or (b) a rate per annum equal to the LIBOR rate plus 0.875% to 1.750% (determined by a leverage ratio based on the Company’s consolidated EBITDA). The Credit Agreement requires the Company to maintain compliance with certain non-financial and financial covenants such as leverage and fixed-charge coverage ratios. As of March 31, 2013, the Company was in compliance with all covenants under the Credit Agreement.
The maximum amount of debt outstanding under the Credit Agreement, the weighted-average balance outstanding under the Credit Agreement and the weighted-average interest rate on all outstanding debt for Fiscal 2013 was $220,470, $203,072 and 1.5%, respectively, compared to $216,180, $194,055 and 1.1%, respectively, for Fiscal 2012, and $237,255, $213,124 and 1.2%, respectively, for Fiscal 2011.
As of March 31, 2013, the Company had $4,050 outstanding in letters of credit and $208,340 in unused commitments under the Credit Agreement.
At March 31, 2013, scheduled maturities or required payments of long-term debt for each of the five succeeding fiscal years were as follows:
Fiscal 2014 $ 1042015 242016 82017 187,6132018 3Total $ 187,752
Table of Contents
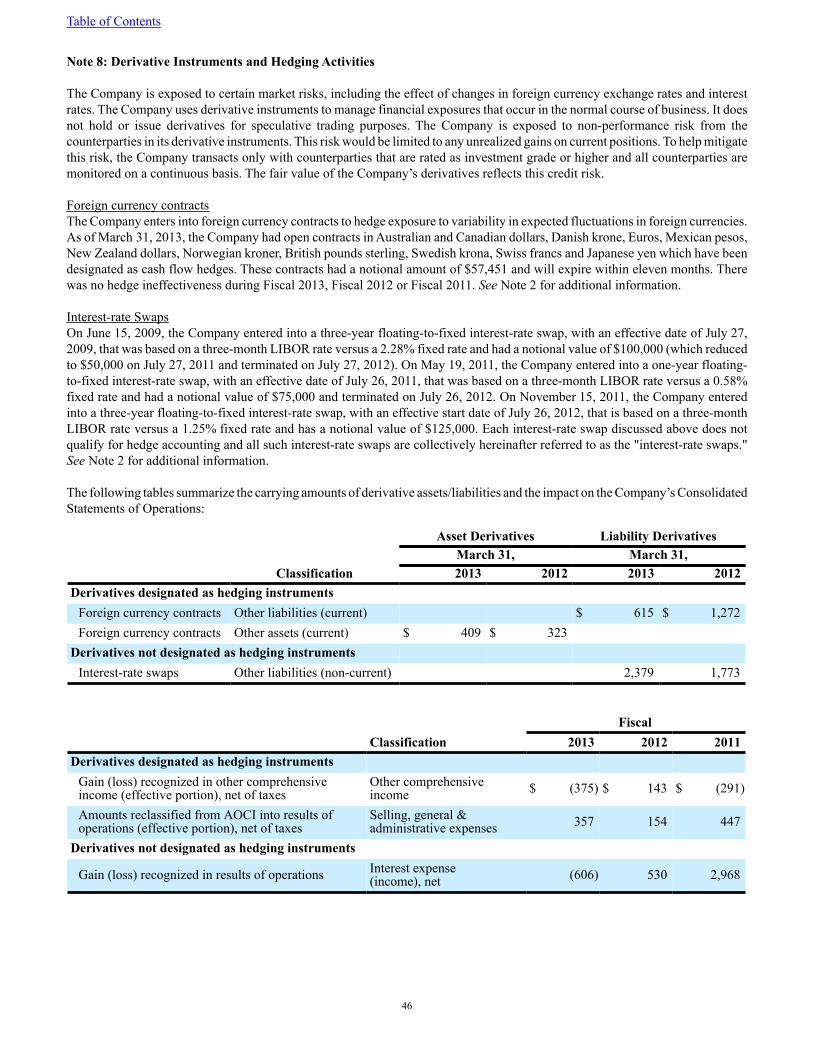
46
Note 8: Derivative Instruments and Hedging Activities
The Company is exposed to certain market risks, including the effect of changes in foreign currency exchange rates and interest rates. The Company uses derivative instruments to manage financial exposures that occur in the normal course of business. It does not hold or issue derivatives for speculative trading purposes. The Company is exposed to non-performance risk from the counterparties in its derivative instruments. This risk would be limited to any unrealized gains on current positions. To help mitigate this risk, the Company transacts only with counterparties that are rated as investment grade or higher and all counterparties are monitored on a continuous basis. The fair value of the Company’s derivatives reflects this credit risk.
Foreign currency contractsThe Company enters into foreign currency contracts to hedge exposure to variability in expected fluctuations in foreign currencies. As of March 31, 2013, the Company had open contracts in Australian and Canadian dollars, Danish krone, Euros, Mexican pesos, New Zealand dollars, Norwegian kroner, British pounds sterling, Swedish krona, Swiss francs and Japanese yen which have been designated as cash flow hedges. These contracts had a notional amount of $57,451 and will expire within eleven months. There was no hedge ineffectiveness during Fiscal 2013, Fiscal 2012 or Fiscal 2011. See Note 2 for additional information.
Interest-rate SwapsOn June 15, 2009, the Company entered into a three-year floating-to-fixed interest-rate swap, with an effective date of July 27, 2009, that was based on a three-month LIBOR rate versus a 2.28% fixed rate and had a notional value of $100,000 (which reduced to $50,000 on July 27, 2011 and terminated on July 27, 2012). On May 19, 2011, the Company entered into a one-year floating-to-fixed interest-rate swap, with an effective date of July 26, 2011, that was based on a three-month LIBOR rate versus a 0.58% fixed rate and had a notional value of $75,000 and terminated on July 26, 2012. On November 15, 2011, the Company entered into a three-year floating-to-fixed interest-rate swap, with an effective start date of July 26, 2012, that is based on a three-month LIBOR rate versus a 1.25% fixed rate and has a notional value of $125,000. Each interest-rate swap discussed above does not qualify for hedge accounting and all such interest-rate swaps are collectively hereinafter referred to as the "interest-rate swaps." See Note 2 for additional information.
The following tables summarize the carrying amounts of derivative assets/liabilities and the impact on the Company’s Consolidated Statements of Operations:
Asset Derivatives Liability DerivativesMarch 31, March 31,
Classification 2013 2012 2013 2012Derivatives designated as hedging instruments
Foreign currency contracts Other liabilities (current) $ 615 $ 1,272Foreign currency contracts Other assets (current) $ 409 $ 323
Derivatives not designated as hedging instruments Interest-rate swaps Other liabilities (non-current) 2,379 1,773
Fiscal Classification 2013 2012 2011Derivatives designated as hedging instruments
Gain (loss) recognized in other comprehensiveincome (effective portion), net of taxes
Other comprehensiveincome $ (375) $ 143 $ (291)
Amounts reclassified from AOCI into results ofoperations (effective portion), net of taxes
Selling, general &administrative expenses 357 154 447
Derivatives not designated as hedging instruments
Gain (loss) recognized in results of operations Interest expense(income), net (606) 530 2,968
Table of Contents
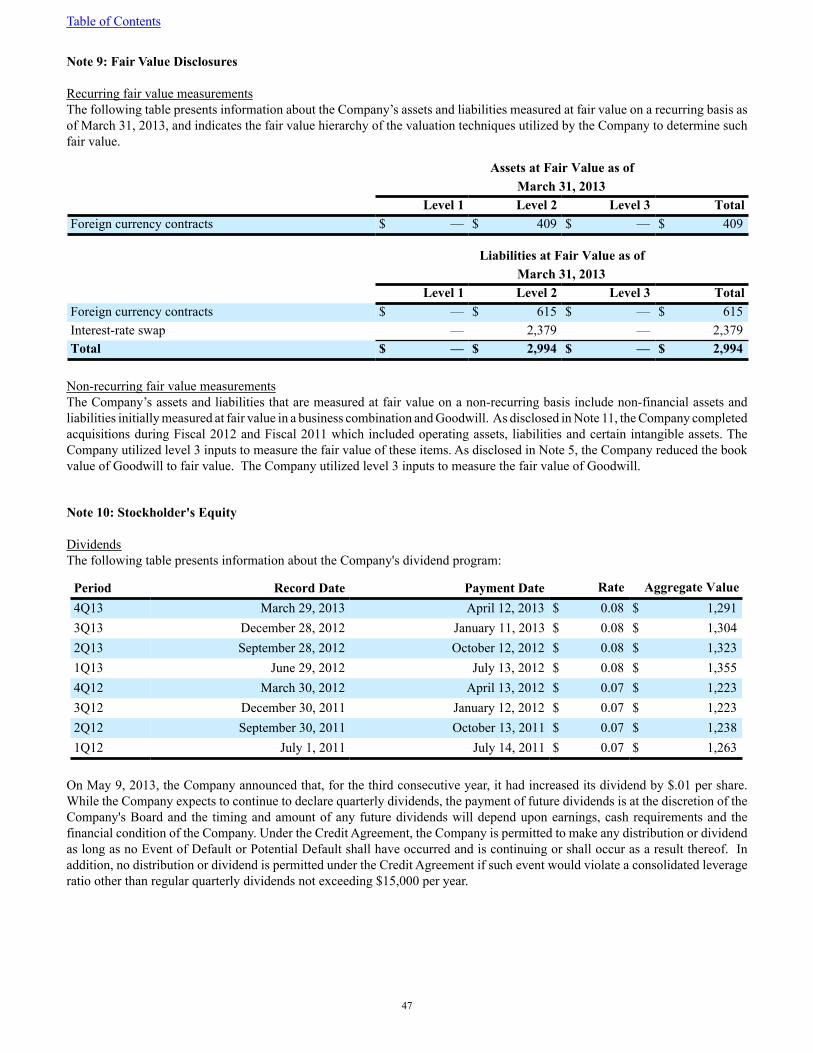
47
Note 9: Fair Value Disclosures
Recurring fair value measurementsThe following table presents information about the Company’s assets and liabilities measured at fair value on a recurring basis as of March 31, 2013, and indicates the fair value hierarchy of the valuation techniques utilized by the Company to determine such fair value.
Assets at Fair Value as ofMarch 31, 2013
Level 1 Level 2 Level 3 TotalForeign currency contracts $ — $ 409 $ — $ 409
Liabilities at Fair Value as ofMarch 31, 2013
Level 1 Level 2 Level 3 TotalForeign currency contracts $ — $ 615 $ — $ 615Interest-rate swap — 2,379 — 2,379Total $ — $ 2,994 $ — $ 2,994
Non-recurring fair value measurementsThe Company’s assets and liabilities that are measured at fair value on a non-recurring basis include non-financial assets and liabilities initially measured at fair value in a business combination and Goodwill. As disclosed in Note 11, the Company completed acquisitions during Fiscal 2012 and Fiscal 2011 which included operating assets, liabilities and certain intangible assets. The Company utilized level 3 inputs to measure the fair value of these items. As disclosed in Note 5, the Company reduced the book value of Goodwill to fair value. The Company utilized level 3 inputs to measure the fair value of Goodwill.
Note 10: Stockholder's Equity
DividendsThe following table presents information about the Company's dividend program:
Period Record Date Payment Date Rate Aggregate Value4Q13 March 29, 2013 April 12, 2013 $ 0.08 $ 1,2913Q13 December 28, 2012 January 11, 2013 $ 0.08 $ 1,3042Q13 September 28, 2012 October 12, 2012 $ 0.08 $ 1,3231Q13 June 29, 2012 July 13, 2012 $ 0.08 $ 1,3554Q12 March 30, 2012 April 13, 2012 $ 0.07 $ 1,2233Q12 December 30, 2011 January 12, 2012 $ 0.07 $ 1,2232Q12 September 30, 2011 October 13, 2011 $ 0.07 $ 1,2381Q12 July 1, 2011 July 14, 2011 $ 0.07 $ 1,263
On May 9, 2013, the Company announced that, for the third consecutive year, it had increased its dividend by $.01 per share. While the Company expects to continue to declare quarterly dividends, the payment of future dividends is at the discretion of the Company's Board and the timing and amount of any future dividends will depend upon earnings, cash requirements and the financial condition of the Company. Under the Credit Agreement, the Company is permitted to make any distribution or dividend as long as no Event of Default or Potential Default shall have occurred and is continuing or shall occur as a result thereof. In addition, no distribution or dividend is permitted under the Credit Agreement if such event would violate a consolidated leverage ratio other than regular quarterly dividends not exceeding $15,000 per year.
Table of Contents

48
Common Stock Repurchases The following table presents information about the Company's common stock repurchases:
Fiscal 2013 2012Common stock purchased 1,515,445 606,978Aggregate purchase price $ 37,214 $ 15,292Average purchase price $ 24.56 $ 25.19
During the first quarter of Fiscal 2013, the Company made tax payments of $983 and withheld 44,697 shares of common stock, which were designated as treasury shares, at an average price per share of $21.98, related to share withholding to satisfy employee income taxes due as a result of the vesting in May 2012 of certain restricted stock units. During the first quarter of Fiscal 2012, the Company made tax payments of $1,521 and withheld 45,778 shares of common stock, which were designated as treasury shares, at an average price per share of $33.22, related to share withholding to satisfy employee income taxes due as a result of the vesting in May 2011 of certain restricted stock units and performance shares.
Since the inception of the repurchase program in April 1999 through March 31, 2013, the Company has repurchased 9,658,227 shares of common stock for an aggregate purchase price of $373,101, or an average purchase price per share of $38.63. These shares do not include the treasury shares withheld for tax payments resulting from the vesting of certain restricted stock units and performance shares. As of March 31, 2013, 841,773 shares were available under repurchase programs approved by the Board. This includes 1,000,000 shares approved for repurchase by the Board on each of May 4, 2012 and October 2, 2012. Additional repurchases of common stock may occur from time to time depending upon various factors such as the Company’s cash flows and general market conditions. There can be no assurance as to the timing or amount of such repurchases. Under the Credit Agreement, the Company is permitted to repurchase its common stock as long as no Event of Default or Potential Default shall have occurred and is continuing or shall occur as a result thereof. In addition, no repurchase of common stock is permitted under the Credit Agreement if such event would violate a consolidated leverage ratio.
Note 11: Acquisitions
Fiscal 2013There were no acquisitions during Fiscal 2013.
Fiscal 2012 During the fourth quarter of Fiscal 2012, the Company acquired InnerWireless, Inc. ("InnerWireless"), a privately-held company headquartered in Richardson, TX. InnerWireless is the first Black Box acquisition in the rapidly-growing in-building wireless market and services clients in every industry from healthcare to Fortune 500 enterprises.
During the second quarter of Fiscal 2012, the Company acquired PS Technologies, LLC ("PS Tech"), a privately-held company headquartered in Dayton, OH. PS Tech is the first Black Box acquisition in the rapidly-growing enterprise video communications market and services clients in the healthcare and government verticals.
The acquisition of InnerWireless and PS Tech, both individually and in the aggregate, did not have a material impact on the Company's consolidated financial statements.
Fiscal 2011 During the third quarter of Fiscal 2011, the Company acquired LOGOS Communications Systems, Inc. ("Logos"), a privately-held company headquartered in Westlake, OH. Logos has an active client base which includes commercial, education and various local government agency accounts.
Also during the third quarter of Fiscal 2011, the Company acquired a non-controlling interest in Genesis Networks Integration Services, LLC, a joint venture company which was formed in conjunction with Genesis Networks Enterprises, LLC ("Genesis"). This joint venture company, based on Genesis’ existing Networks Integration Services Division, strengthens and enhances Genesis’ ability to deliver and support voice and data communications solutions to its enterprise clients. During the third quarter of Fiscal 2013, the Company recorded a loss of $2,670 in Other expenses (income), net within the Company’s Consolidated Statements of Operations due to the probable divestiture of our non-controlling interest in GNIS.
Table of Contents

49
The acquisition of Logos and the non-controlling interest in Genesis Networks Integration Services, LLC, both individually and in the aggregate, did not have a material impact on the Company’s consolidated financial statements.
In connection with the acquisitions during Fiscal 2013, Fiscal 2012 and Fiscal 2011, the Company acquired approximately $20,768 of goodwill. The Company believes that $10,864 of such amount will be recognized as a tax deduction over the next fifteen years.
Note 12: Operating Leases
The Company leases offices, facilities, equipment and vehicles throughout the world. While most of the leases are operating leases that expire over the next three-years, certain vehicles and equipment are leased under capital leases that also expire over the next three-years. As leases expire, it can be expected that, in the normal course of business, certain leases will be renewed or replaced.
Certain lease agreements include renewal options and escalating rents over the lease terms. Generally, the Company expenses rent on a straight-line basis over the life of the lease which commences on the date the Company has the right to control the property. The cumulative expense recognized on a straight-line basis in excess of the cumulative payments is included in Accrued expenses and Other liabilities within the Company’s Consolidated Balance Sheets. Rent expense was $19,717, $22,912 and $19,317 for Fiscal 2013, Fiscal 2012 and Fiscal 2011, respectively.
The future minimum lease payments under non-cancelable capital and operating leases with initial or remaining terms of one year or more as of March 31, 2013 are as follows:
Fiscal 2014 $ 11,7212015 8,4442016 5,5612017 3,6552018 2,518Thereafter 3,555Total minimum lease payments $ 35,454
Note 13: Income Taxes
The domestic and foreign components of Income (loss) before provision (benefit) for income taxes are as follows:
Fiscal 2013 2012 2011Domestic $ 34,597 $ (224,993) $ 65,295Foreign 11,866 (21,073) 19,985Consolidated $ 46,463 $ (246,066) $ 85,280
The provision/(benefit) for income taxes consists of the following:
Fiscal 2013 2012 2011Current
Federal $ 8,877 $ 14,166 $ 15,671State 2,203 2,962 4,160Foreign 2,433 2,938 4,131
Total current 13,513 20,066 23,962Deferred 4,144 (18,398) 8,456
Total provision (benefit) for income taxes $ 17,657 $ 1,668 $ 32,418
Table of Contents

50
Reconciliations between income taxes computed using the federal statutory income tax rate and the Company’s effective tax rate are as follows:
Fiscal 2013 2012 2011Federal statutory tax rate 35.0 % 35.0 % 35.0 %
Foreign taxes, net of foreign tax credits (2.9) (5.5) (1.6)Non-deductible expenses (0.9) 0.3 (0.9)State income taxes, net of federal benefit 2.9 0.2 3.0Valuation allowance — — (0.1)Non-deductible goodwill impairment loss — (31.5) —Equity awards 3.3 (0.3) 0.3Other, net 0.6 1.1 2.3
Effective tax rate 38.0% (0.7)% 38.0%
The effective tax rate of (0.7)% for Fiscal 2012 was primarily due to $262,703 of non-deductible goodwill impairment loss (see Note 5) and a reduction in reserves of $1,579 related to the settlement of an Internal Revenue Service ("IRS") audit for Fiscal 2007 through Fiscal 2010 and a state audit for Fiscal 2005 through Fiscal 2011.
The components of current and long-term deferred tax liabilities/assets are as follows:
March 31, 2013 2012Deferred Tax Liabilities
Goodwill and intangibles $ 29,206 $ 26,475Unremitted earnings of foreign subsidiaries 213 334Other 534 198
Gross deferred tax liabilities 29,953 27,007Deferred Tax Assets
Net operating losses 29,631 31,653Basis of finished goods inventory 7,714 7,741Reserve for bad debts 1,169 1,457Foreign tax credit carry-forwards 938 283Accrued employee costs 10,211 8,807Stock-based compensation 10,966 11,449Other 2,530 1,640
Gross deferred tax assets 63,159 63,030Valuation allowance (3,518) (3,518)
Net deferred tax assets 59,641 59,512Net deferred tax assets/(liabilities) $ 29,688 $ 32,505
The net deferred tax asset of $29,688 in the table above is classified as non-current under Other assets within the Company's Consolidated Balance Sheets. At March 31, 2013, the Company had $52,439, $102,203 and $21,203 of federal, state and foreign gross net operating loss carry-forwards, respectively. As a result of the Company’s acquisitions of InnerWireless and ACS Communications, Inc., Section 382 of the Internal Revenue Code of 1986, as amended (the "Code"), limits the amount of net operating losses available to the Company to approximately $6,178 per year. The federal gross net operating loss carry-forwards expire in Fiscal 2030. The state gross net operating loss carry-forwards expire at various times through Fiscal 2033 and the foreign gross net operating loss carry-forwards expire at various times through Fiscal 2022, with the exception of $208 for Austria, $583 for Belgium and $8,443 for Brazil, which have no expirations.
Table of Contents

51
A valuation allowance is provided when it is more likely than not that some portion or all of the deferred tax assets will not be realized. The Company has recorded a valuation allowance of $3,518 for certain state and foreign net operating loss carry-forwards anticipated to produce no tax benefit.
In general, except for certain earnings associated with inter-company loan balances, it is the Company’s intention to reinvest all undistributed earnings of non-U.S. subsidiaries for an indefinite period of time. Therefore, except for the exceptions noted above, no deferred U.S. income taxes have been provided on undistributed earnings of non-U.S. subsidiaries, which aggregate approximately $5,727 based on exchange rates at March 31, 2013, thus there is no unrealized currency translation adjustments related to translation of foreign denominated balance sheets.
A reconciliation of the change in the tax liability for unrecognized tax benefits is as follows:
Fiscal 2013 2012 2011Balance at beginning of year $ 5,204 $ 8,318 $ 7,559
Additions for tax positions related to the current year 465 801 481Additions for tax positions related to prior years 213 804 2,285Reductions for tax positions related to prior years (542) (4,235) (1,802)Settlements — (484) (205)
Balance at end of year $ 5,340 $ 5,204 $ 8,318
Unrecognized tax benefits are classified as current under Other liabilities within the Company's Consolidated Balance Sheets. Of the $5,340 noted above, the Company expects that $234 will reverse in the next twelve-months. As of March 31, 2013, 2012 and 2011, the Company recorded $1,001, $1,812 and $1,895, respectively, of interest and penalties related to uncertain tax positions in current liabilities within Income taxes, all of which impacted the Company's effective tax rate.
During the three-months ended December 31, 2012, the IRS commenced an examination of the Company's U.S. federal income tax return for Fiscal 2011. The IRS has not yet proposed any adjustment to the Company's filing positions in connection with this examination. Upon completion of this examination, it is reasonably possible that the total amount of unrecognized benefits will change. Any adjustment to the unrecognized tax benefits would impact the effective tax rate. The Company cannot make an estimate of the impact on the effective rate for any potential adjustment at this time.
Fiscal 2012 remains open to examination by the IRS and Fiscal 2008 through Fiscal 2012 remain open to examination by certain state and foreign taxing jurisdictions.
Note 14: Incentive Compensation Plans
Performance BonusThe Company has variable compensation plans covering certain team members. These plans provide a bonus contingent on the attainment of certain annual or quarterly performance targets. The Company recorded expense of $3,697, $7,388 and $11,670 under its variable compensation plans for Fiscal 2013, Fiscal 2012 and Fiscal 2011, respectively.
Profit Sharing and Savings Plans ("the savings plans")The Company has multiple profit sharing and savings plans which qualify as deferred salary arrangements under Section 401(k) of the Code. Participants may elect to contribute a portion of their eligible compensation, subject to limits imposed by the savings plans, which are partially matched by the Company. The Company recorded expense of $2,504, $2,639 and $2,427 for these plans during Fiscal 2013, Fiscal 2012 and Fiscal 2011, respectively.
Pension PlansThe Company has multiple defined benefit pension plans for which a majority of benefits have been "frozen" (i.e., no new employees will be admitted and those employees currently in the plan will not earn additional benefits based on service) and a multi-employer plan. The Company made contributions of $3,406, $3,349 and $2,936 during Fiscal 2013, Fiscal 2012 and Fiscal 2011, respectively, to the pension plans. The defined benefit pension plan had assets of $29,884, $25,770 and $24,391, a projected benefit obligation of $48,016, $43,110 and $34,950 and a resulting unfunded liability of $18,132, $17,340 and $10,559 for the periods ended March 31, 2013, 2012 and 2011, respectively.
Table of Contents

52
Stock-based compensation plansOn August 12, 2008 (the "Effective Date"), the Company’s stockholders approved the 2008 Long-Term Incentive Plan (the "Incentive Plan") which is designed to advance the Company’s interests and the interests of the Company’s stockholders by providing incentives to certain employees, directors, consultants, independent contractors and persons to whom an offer of employment has been extended by the Company (hereinafter referred to as "Eligible Persons"). The Incentive Plan replaced the 1992 Stock Option Plan, as amended (the "Employee Plan"), and the 1992 Director Stock Option Plan, as amended (the "Director Plan"), on the Effective Date. Stock option grants under the Employee Plan and the Director Plan, prior to the Effective Date, remain outstanding and will continue to be administered in accordance with the terms of their respective plans and plan agreements.
Awards (as defined below) under the Incentive Plan may include, but need not be limited to, one or more of the following types, either alone or in any combination thereof: (i) stock options, (ii) stock appreciation rights, (iii) restricted stock, (iv) restricted stock units, (v) performance grants, (vi) other share-based awards and (vii) any other type of award deemed by the Compensation Committee (the "Compensation Committee") of the Board or any successor thereto, or such other committee of the Board as is appointed by the Board to administer the Incentive Plan, in its sole discretion, to be consistent with the purposes of the Incentive Plan (hereinafter referred to as "Awards").
The maximum aggregate number of shares of common stock available for issuance under Awards granted under the Incentive Plan is 900,000 plus the number of shares that were available for the grant of stock options under the Employee Plan and the Director Plan on the Effective Date, plus the number of shares subject to stock options outstanding under the Employee Plan and the Director Plan on the Effective Date that are forfeited or cancelled prior to exercise. The following table details the shares of common stock available for grant under the Incentive Plan as of March 31, 2013.
SharesShares initially authorized under the Incentive Plan 900,000Number of shares that were available for the grant of stock options under the Employee Plan and theDirector Plan on August 12, 2008, the Effective Date 888,087
Number of shares subject to stock options outstanding under the Employee Plan and the Director Plan onAugust 12, 2008, the Effective Date, that were forfeited or cancelled, prior to exercise, through March 31,2013
1,463,021
Shares authorized for grant under the Incentive Plan as of March 31, 2013 3,251,108Shares available for grant under the Incentive Plan as of March 31, 2013 * 615,772
* The aggregate number of shares available for issuance is reduced by 1.87 shares for each issuance of a full value award (e.g., restricted stock units and performance share awards). The shares available for grant assume a 100% payout on outstanding performance share awards. Actual payout could range from 0% - 150% or 200% depending on performance goal resulting in shares available for grant from 1,130,589 to 268,297.
The Company recognized stock-based compensation expense of $7,712, $9,296 and $10,270 during Fiscal 2013, Fiscal 2012 and Fiscal 2011, respectively. The Company recognized total income tax benefit for stock-based compensation arrangements of $2,814, $3,417 and $3,768 during Fiscal 2013, Fiscal 2012 and Fiscal 2011, respectively. Stock-based compensation expense is recorded in Selling, general & administrative expense within the Company’s Consolidated Statements of Operations.
Stock optionsStock option awards are granted with an exercise price equal to the closing market price of the common stock on the date of grant; such stock options generally become exercisable in equal amounts over a three-year period and have a contractual life of ten-years from the grant date. The fair value of stock options is estimated on the grant date using the Black-Scholes option pricing model which includes the following weighted-average assumptions.
Fiscal 2013 2012 2011Expected life (in years) 7.0 4.8 4.9Risk free interest rate 0.8% 1.7% 2.3%Annual forfeiture rate 2.0% 2.1% 2.1%Expected Volatility 44.6% 45.3% 41.4%Dividend yield 1.0% 0.7% 0.8%
Table of Contents

53
The following table summarizes the Company’s stock option activity:
Shares(in 000’s)
Weighted-AverageExercise
Price
Weighted-Average
RemainingContractualLife (Years)
IntrinsicValue
(000’s)Outstanding at March 31, 2012 2,827 $ 34.95
Granted 184 22.07 Exercised — — Forfeited or cancelled (476) 34.91
Outstanding at March 31, 2013 2,535 $ 34.02 4.2 $ —Exercisable at March 31, 2013 2,187 $ 35.10 3.4 $ —
The weighted-average grant-date fair value of options granted during Fiscal 2013, Fiscal 2012 and Fiscal 2011 was $9.02, $12.42 and $11.69, respectively. The intrinsic value of options exercised during Fiscal 2013, Fiscal 2012 and Fiscal 2011 was $0, $0 and $2,669, respectively. The aggregate intrinsic value in the preceding table is based on the closing stock price of the common stock on March 28, 2013 of $21.81.
The following table summarizes certain information regarding the Company’s non-vested stock options:
Shares (in000’s)
Weighted-Average Grant-Date Fair Value
March 31, 2012 382 $ 12.15Granted 184 9.02Vested (188) 12.16Forfeited (30) 11.11
March 31, 2013 348 $ 10.57
As of March 31, 2013, there was $1,855 of total unrecognized pre-tax stock-based compensation expense related to non-vested stock options which is expected to be recognized over a weighted-average period of 1.5 years.
Restricted stock unitsRestricted stock unit awards are subject to a service condition and typically vest in equal amounts over a three-year period from the grant date. The fair value of restricted stock units is determined based on the number of restricted stock units granted and the closing market price of the common stock on the date of grant.
The following table summarizes the Company’s restricted stock unit activity:
Shares(in 000’s)
Weighted-Average Grant-Date Fair Value
March 31, 2012 280 $ 31.23Granted 238 22.98Vested (167) 29.25Forfeited (16) 28.72
March 31, 2013 335 $ 26.48
The total fair value of shares that vested during Fiscal 2013, Fiscal 2012 and Fiscal 2011 was $3,674, $3,921 and $1,985, respectively.
As of March 31, 2013, there was $4,766 of total unrecognized pre-tax stock-based compensation expense related to non-vested restricted stock units which is expected to be recognized over a weighted-average period of 1.7 years.
Table of Contents

54
Performance share awardsPerformance share awards are subject to one of the performance goals - the Company’s Relative TSR Ranking or cumulative Adjusted EBITDA - over a three-year period. The Company’s Relative TSR Ranking metric is based on the three-year cumulative return to shareholders from the change in stock price and dividends paid between the starting and ending dates. The fair value of performance share awards (subject to cumulative Adjusted EBITDA) is determined based on the number of performance shares granted and the closing market price of the common stock on the date of grant. The fair value of performance share awards (subject to the Company’s Relative TSR Ranking) is estimated on the grant date using the Monte-Carlo simulation valuation method which includes the following weighted-average assumptions.
Fiscal 2013 2012 2011Risk free interest rate 0.4% 0.9% 1.4%Expected Volatility 41.3% 50.8% 52.3%Dividend yield 1.0% 0.7% 0.8%
The following table summarizes the Company’s performance share award activity:
Shares(in 000’s)
Weighted-Average Grant-Date Fair Value
March 31, 2012 183 $ 33.77Granted 111 22.35Vested — —Forfeited (19) 30.36
March 31, 2013 275 $ 29.39
The total fair value of shares that vested during Fiscal 2013, Fiscal 2012 and Fiscal 2011 was $0, $1,679 and $0, respectively.
As of March 31, 2013, there was $1,811 of total unrecognized pre-tax stock-based compensation expense related to non-vested performance share awards which is expected to be recognized over a weighted-average period of 1.5 years.
Note 15: Earnings (loss) Per Share
The following table details the computation of basic and diluted earnings (loss) per common share from continuing operations for the periods presented (share numbers in thousands):
Fiscal 2013 2012 2011Net income (loss) $ 28,806 $ (247,734) $ 52,862Weighted-average common shares outstanding (basic) 16,627 17,725 17,680Effect of dilutive securities from equity awards 62 — 115Weighted-average common shares outstanding (diluted) 16,689 17,725 17,795Basic earnings (loss) per common share $ 1.73 $ (13.98) $ 2.99Dilutive earnings (loss) per common share $ 1.73 $ (13.98) $ 2.97
The Weighted-average common shares outstanding (diluted) computation is not impacted during any period where the exercise price of a stock option is greater than the average market price. There were 2,648,137, 2,870,784 and 2,323,094 non-dilutive equity awards outstanding during Fiscal 2013, Fiscal 2012 and Fiscal 2011, respectively, that are not included in the corresponding period Weighted-average common shares outstanding (diluted) computation.
Table of Contents

55
Note 16: Commitments and Contingencies
The Company is involved in, or has pending, various legal proceedings, claims, suits and complaints arising out of the normal course of business. Based on the facts currently available to the Company, Management believes these matters are adequately provided for, covered by insurance, without merit or not probable that an unfavorable material outcome will result.
Product WarrantiesEstimated future warranty costs related to certain products are charged to expense during the period the related revenue is recognized. The product warranty liability reflects the Company’s best estimate of probable obligations under those warranties. As of March 31, 2013 and 2012, the Company has recorded a warranty reserve of $1,937 and $1,896, respectively.
There has been no other significant or unusual activity during Fiscal 2013.
Note 17: Segment Reporting
Management reviews financial information for the consolidated Company accompanied by disaggregated information on revenues, operating income (loss) and assets by geographic region for the purpose of making operational decisions and assessing financial performance. Additionally, Management is presented with and reviews revenues and gross profit by service type. The accounting policies of the individual operating segments are the same as those of the Company.
The following table presents financial information about the Company’s reportable segments by geographic region:
Fiscal 2013 2012 2011North America
Revenues $ 862,957 $ 943,717 $ 931,181Operating income (loss) 1 47,413 (214,448) 76,789Depreciation expense 4,703 4,917 5,569Intangibles amortization 13,713 12,980 12,111Assets (as of March 31) 831,384 832,248 1,079,622
EuropeRevenues $ 97,114 $ 105,492 $ 100,221Operating income (loss) 2 5,191 (30,347) 8,032Depreciation expense 455 379 352Intangibles amortization 24 39 39Assets (as of March 31) 76,397 75,072 127,176
All OtherRevenues $ 37,715 $ 38,319 $ 36,827Operating income (loss) 3,665 5,122 6,237Depreciation expense 228 138 145Intangibles amortization — 6 6Assets (as of March 31) 28,983 27,758 27,539
1 Includes restructuring expense of $6,689 during Fiscal 2013 and goodwill impairment loss of $277,132 recorded during the third
quarter of Fiscal 2012.
2 Includes restructuring expense of $1,756 during Fiscal 2013 and goodwill impairment loss of $40,665 recorded during the third
quarter of Fiscal 2012.
The Company generated revenues of $159,438, $184,833 and $208,829 with the United States Federal Government during Fiscal 2013, Fiscal 2012 and Fiscal 2011, respectively, all of which is included within the Company's North America reportable segment.
Table of Contents

56
The sum of the segment revenues, operating income (loss), depreciation and intangibles amortization equals the consolidated revenues, operating income (loss), depreciation and intangibles amortization. The following table reconciles segment assets to total consolidated assets as of March 31, 2013, 2012 and 2011:
March 31, 2013 2012 2011Segment assets for North America, Europe and All Other $ 936,764 $ 935,078 $ 1,234,337Corporate eliminations (58,763) (47,055) (62,354)Total consolidated assets $ 878,001 $ 888,023 $ 1,171,983
The following table presents financial information about the Company by service type:
Fiscal 2013 2012 2011Data Infrastructure
Revenues $ 243,711 $ 247,157 $ 230,719Gross profit 63,370 62,032 59,287
Voice Communications Revenues $ 572,371 $ 641,731 $ 648,512Gross profit 176,057 196,279 210,558
Technology Products Revenues $ 181,704 $ 198,640 $ 188,998Gross profit 80,503 88,185 87,265
The sum of service type revenues and gross profit equals consolidated revenues and gross profit.
In connection with a new management team and a renewed business strategy, the Company has realigned its organizational structure which will result in new reporting segments (North America Services, North America Products, International Services and International Products) for the purpose of making operational decisions and assessing financial performance which will be effective, on a prospective basis, beginning on April 1, 2013. This is consistent with the proliferation of voice-over-internet-protocol (VOIP) solutions and the adoption of unified communication technologies which has resulted in a trend toward convergence of voice and data networks. The Company believes that, in the near future, the distinction between our voice and data solution offerings will not be significant. As such, those historical Voice Communications and Data Infrastructure offerings have been aggregated into Services in their respective geography. The Company will report financial information (revenue through operating income) for these new reporting segments which should provide enhanced visibility and transparency into our operations, our business drivers and the value of our enterprise. The Company believes that a successful transition will better position Black Box as a comprehensive communications system integrator where we can support our clients with multiple offerings.
Table of Contents

57
Note 18: Quarterly Data (Unaudited)
The following tables represent summary Quarterly (Unaudited) Consolidated Statements of Operations for Fiscal 2013 and Fiscal 2012. Earnings (loss) per common share may not compute due to the use of different quarterly/annual basic and diluted shares.
Fiscal 2013Unaudited 1Q 2Q 3Q 4Q FYRevenues
Products $ 44,148 $ 46,490 $ 46,854 $ 44,212 $ 181,704On-Site services 203,689 213,671 205,235 193,487 816,082
Total 247,837 260,161 252,089 237,699 997,786Cost of sales
Products 24,201 26,076 26,735 24,189 101,201On-Site services 144,362 154,031 143,622 134,640 576,655
Total 168,563 180,107 170,357 158,829 677,856Gross profit 79,274 80,054 81,732 78,870 319,930Selling, general & administrative expenses 63,950 62,596 60,542 62,836 249,924Intangibles amortization 3,464 3,474 3,478 3,321 13,737Operating income (loss) 11,860 13,984 17,712 12,713 56,269Interest expense (income), net 1,930 1,893 1,133 1,134 6,090Other expenses (income), net 1 361 588 2,839 (72) 3,716Income (loss) before provision for income taxes 9,569 11,503 13,740 11,651 46,463Provision for income taxes 3,637 4,370 5,222 4,428 17,657Net income (loss) $ 5,932 $ 7,133 $ 8,518 $ 7,223 $ 28,806Earnings (loss) per common share
Basic $ 0.34 $ 0.43 $ 0.52 $ 0.45 $ 1.73Diluted $ 0.34 $ 0.43 $ 0.52 $ 0.44 $ 1.73
1 Includes a loss of $2,670 during the third quarter of Fiscal 2013 due to the probable divestiture of our non-controlling interest in GNIS, a joint venture company which was formed in conjunction with Genesis Networks Enterprises, LLC.
Table of Contents

58
Fiscal 2012Unaudited 1Q 2Q 3Q 4Q FYRevenues
Products $ 47,719 $ 50,329 $ 51,379 $ 49,213 $ 198,640On-Site services 220,707 236,842 224,560 206,779 888,888
Total 268,426 287,171 275,939 255,992 1,087,528Cost of sales
Products 26,267 27,660 29,088 27,440 110,455On-Site services 155,578 170,645 158,538 145,816 630,577
Total 181,845 198,305 187,626 173,256 741,032Gross profit 86,581 88,866 88,313 82,736 346,496Selling, general & administrative expenses 66,644 63,256 62,644 62,803 255,347Goodwill impairment loss — — 317,797 — 317,797Intangibles amortization 3,059 3,176 3,249 3,541 13,025Operating income (loss) 16,878 22,434 (295,377) 16,392 (239,673)Interest expense (income), net 1,065 769 1,856 1,458 5,148Other expenses (income), net 292 273 311 369 1,245Income (loss) before provision for income taxes 15,521 21,392 (297,544) 14,565 (246,066)Provision for income taxes 5,898 6,548 (14,101) 3,323 1,668Net income (loss) $ 9,623 $ 14,844 $ (283,443) $ 11,242 $ (247,734)Earnings (loss) per common share
Basic $ 0.54 $ 0.83 $ (16.12) $ 0.64 $ (13.98)Diluted $ 0.53 $ 0.83 $ (16.12) $ 0.64 $ (13.98)
Item 9. Changes in and Disagreements with Accountants on Accounting and Financial Disclosure.
None.
Item 9A. Controls and Procedures.
Conclusions Regarding the Effectiveness of Disclosure Controls and ProceduresManagement, including the Company’s Chief Executive Officer ("CEO") and Chief Financial Officer ("CFO"), is responsible for establishing and maintaining adequate disclosure controls and procedures (as defined in Rules 13a-15(e) and 15d-15(e) under the Securities Exchange Act of 1934, as amended (the "Exchange Act")) for the Company. Management assessed the effectiveness of the Company’s disclosure controls and procedures as of March 31, 2013. Based upon this assessment, Management has concluded that the Company’s disclosure controls and procedures were effective as of March 31, 2013 to provide reasonable assurance that information required to be disclosed by the Company in the reports filed or submitted by it under the Exchange Act is recorded, processed, summarized and reported within the time periods specified in the SEC's rules and forms, and to provide reasonable assurance that information required to be disclosed by the Company in such reports is accumulated and communicated to Management, including its principal executive officer and principal financial officer, as appropriate to allow timely decisions regarding required disclosure.
Management’s Report on Internal Control Over Financial ReportingManagement, including the Company’s CEO and CFO, is responsible for establishing and maintaining adequate internal control over financial reporting (as defined in Rule 13a-15(f) and 15d-15(f) under the Exchange Act) for the Company. Management assessed the effectiveness of the Company’s internal control over financial reporting as of March 31, 2013 based on the framework described in “Internal Control – Integrated Framework,” issued by the Committee of Sponsoring Organizations ("COSO") of the Treadway Commission. Based on this assessment, Management has concluded that the Company’s internal control over financial reporting was effective, as of March 31, 2013, to provide reasonable assurance regarding the reliability of financial reporting and the preparation of financial statements for external reporting purposes in accordance with U.S. generally accepted accounting principles. Management of the Company reviewed the results of its assessment with the Audit Committee of the Board.
Table of Contents

59
BDO USA, LLP, the Company’s independent registered public accounting firm, has issued an attestation report on the Company’s internal control over financial reporting, which is included in this Annual Report.
Changes in Internal Control Over Financial ReportingThere have not been any changes in the Company’s internal control over financial reporting (as such term is defined in Rules 13a-15(f) and 15d-15(f) of the Exchange Act) during the most recent fiscal quarter that have materially affected or are reasonably likely to materially affect the Company’s internal control over financial reporting.
Limitations on the Effectiveness of ControlsAll internal control systems, no matter how well designed, have inherent limitations. Therefore, even those systems determined to be effective can provide only reasonable assurance with respect to financial statement preparation and presentation. Because of its inherent limitations, the Company’s internal control over financial reporting may not prevent or detect misstatements. In addition, projections of any evaluation of effectiveness to future periods are subject to the risk that controls may become inadequate because of changes in conditions, or that the degree of compliance with the policies and procedures may deteriorate.
Item 9B. Other Information.
None.
PART III
Item 10. Directors, Executive Officers and Corporate Governance.Certain of the information required by this item is incorporated herein by reference to the information set forth under Part I of this Annual Report under the captions "Executive Officers of the Registrant" and "Directors of the Registrant." The other information required by this item is incorporated herein by reference to the information set forth under the captions "Policies and Procedures Related to the Approval of Transactions with Related Persons,"Annual Meeting Matters - Proposal 1 - Election of Directors" and "Board of Directors and Certain Board Committees" in the Proxy Statement to be filed pursuant to Regulation 14A of the Exchange Act.
Item 11. Executive Compensation.The information required by this item is incorporated herein by reference to the information under the captions "Compensation of Directors" and "Executive Compensation and Other Information" in the Proxy Statement.
Item 12. Security Ownership of Certain Beneficial Owners And Management And Related Stockholder Matters.The information required by this item is incorporated herein by reference to the information set forth under the captions "Equity Plan Compensation Information," "Security Ownership of Certain Beneficial Owners" and "Security Ownership of Management" in the Proxy Statement.
Item 13. Certain Relationships and Related Transactions, and Director Independence.The information required by this item is incorporated herein by reference to the information set forth under the captions "Annual Meeting Matters - Proposal 1 - Election of Directors," "Board of Directors and Certain Board Committees," "Policies and Procedures Related to the Approval of Transactions with Related Persons" and "Executive Compensation and Other Information" in the Proxy Statement.
Item 14. Principal Accounting Fees and Services.The information required by this item is incorporated herein by reference to the information set forth under the caption "Independent Public Accountants" in the Proxy Statement.
Table of Contents

60
PART IV
Item 15. Exhibits and Financial Statement Schedules.Financial statements, financial statement schedules and exhibits not listed below have been omitted where the required information is included in the consolidated financial statements or notes thereto, or is not applicable or required. Documents filed as part of this report include:
(a)(1) Financial Statements - no financial statements have been filed in this Form 10-K other than those in Item 8
(a)(2) Financial Statement Schedule (Schedule II - Valuation and Qualifying Accounts)
SCHEDULE II
BLACK BOX CORPORATION
Valuation and Qualifying Accounts(Dollars in thousands)
Description
Balance atBeginningof Period
AdditionsCharged to
Expense
Additionsfrom
Acquisitions
Reductionsfrom
Reserves Other
Balance atEnd ofPeriod
March 31, 2013 Excess and obsolete inventoryreserves $ 18,900 $ 3,586 $ — $ (4,392) $ (54) $ 18,040
Allowance for doubtful accounts 6,273 3,556 — (3,531) 2 6,300March 31, 2012 Excess and obsolete inventoryreserves $ 19,859 $ 1,648 $ 32 $ (2,639) $ — $ 18,900
Allowance for doubtful accounts 7,121 3,006 12 (3,866) — 6,273March 31, 2011 Excess and obsolete inventoryreserves $ 19,990 $ 1,408 $ 17 $ (1,556) $ — $ 19,859
Allowance for doubtful accounts 9,505 2,674 2 (5,060) — 7,121
(a)(3) Exhibits
EXHIBITS
Exhibit Number Description
3(i) Second Restated Certificate of Incorporation of the Company, as amended (1)
3(ii) Amended and Restated By-laws of the Company, as amended (2)
10.1 Credit Agreement dated as of March 23, 2012 by and among Black Box Corporation, the Guarantors, the Lenders parties thereto and Citizens Bank of Pennsylvania, as Administrative Agent (the “Credit Agreement”) (3)
10.2 Guaranty and Suretyship Agreement dated as of March 23, 2012 (3)
10.3 Amended and Restated Agreement between the Company and Michael McAndrew (4)
10.4 Amended and Restated Agreement between the Company and R. Terry Blakemore (5)
10.5 1992 Stock Option Plan, as amended through August 9, 2007 (6)
10.6 1992 Director Stock Option Plan, as amended through August 9, 2007 (6)
10.7 Form of Black Box Corporation Non-Qualified Stock Option Agreement (pursuant to the 1992 Director Stock Option Plan; form of agreement in effect prior to August 10, 2004) (7)
Table of Contents
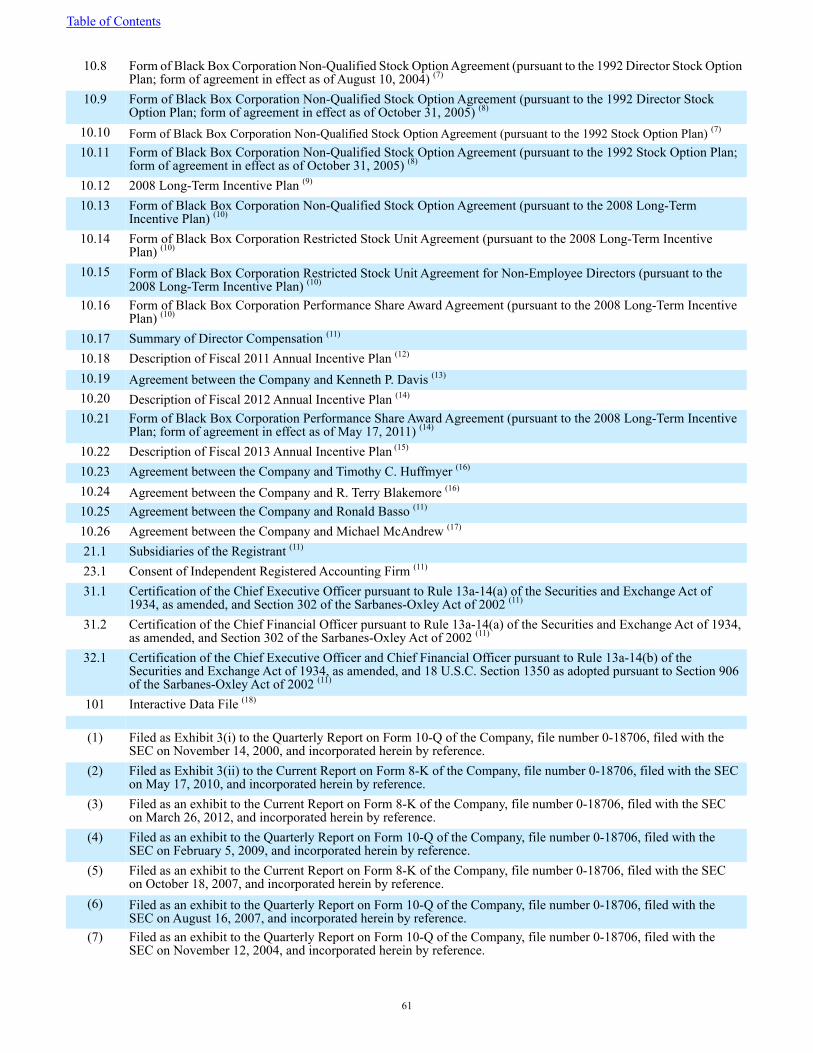
61
10.8 Form of Black Box Corporation Non-Qualified Stock Option Agreement (pursuant to the 1992 Director Stock Option Plan; form of agreement in effect as of August 10, 2004) (7)
10.9 Form of Black Box Corporation Non-Qualified Stock Option Agreement (pursuant to the 1992 Director Stock Option Plan; form of agreement in effect as of October 31, 2005) (8)
10.10 Form of Black Box Corporation Non-Qualified Stock Option Agreement (pursuant to the 1992 Stock Option Plan) (7)
10.11 Form of Black Box Corporation Non-Qualified Stock Option Agreement (pursuant to the 1992 Stock Option Plan; form of agreement in effect as of October 31, 2005) (8)
10.12 2008 Long-Term Incentive Plan (9)
10.13 Form of Black Box Corporation Non-Qualified Stock Option Agreement (pursuant to the 2008 Long-Term Incentive Plan) (10)
10.14 Form of Black Box Corporation Restricted Stock Unit Agreement (pursuant to the 2008 Long-Term Incentive Plan) (10)
10.15 Form of Black Box Corporation Restricted Stock Unit Agreement for Non-Employee Directors (pursuant to the 2008 Long-Term Incentive Plan) (10)
10.16 Form of Black Box Corporation Performance Share Award Agreement (pursuant to the 2008 Long-Term Incentive Plan) (10)
10.17 Summary of Director Compensation (11)
10.18 Description of Fiscal 2011 Annual Incentive Plan (12)
10.19 Agreement between the Company and Kenneth P. Davis (13)
10.20 Description of Fiscal 2012 Annual Incentive Plan (14)
10.21 Form of Black Box Corporation Performance Share Award Agreement (pursuant to the 2008 Long-Term Incentive Plan; form of agreement in effect as of May 17, 2011) (14)
10.22 Description of Fiscal 2013 Annual Incentive Plan (15)
10.23 Agreement between the Company and Timothy C. Huffmyer (16)
10.24 Agreement between the Company and R. Terry Blakemore (16)
10.25 Agreement between the Company and Ronald Basso (11)
10.26 Agreement between the Company and Michael McAndrew (17)
21.1 Subsidiaries of the Registrant (11)
23.1 Consent of Independent Registered Accounting Firm (11)
31.1 Certification of the Chief Executive Officer pursuant to Rule 13a-14(a) of the Securities and Exchange Act of 1934, as amended, and Section 302 of the Sarbanes-Oxley Act of 2002 (11)
31.2 Certification of the Chief Financial Officer pursuant to Rule 13a-14(a) of the Securities and Exchange Act of 1934, as amended, and Section 302 of the Sarbanes-Oxley Act of 2002 (11)
32.1 Certification of the Chief Executive Officer and Chief Financial Officer pursuant to Rule 13a-14(b) of the Securities and Exchange Act of 1934, as amended, and 18 U.S.C. Section 1350 as adopted pursuant to Section 906 of the Sarbanes-Oxley Act of 2002 (11)
101 Interactive Data File (18)
(1) Filed as Exhibit 3(i) to the Quarterly Report on Form 10-Q of the Company, file number 0-18706, filed with the SEC on November 14, 2000, and incorporated herein by reference.
(2) Filed as Exhibit 3(ii) to the Current Report on Form 8-K of the Company, file number 0-18706, filed with the SEC on May 17, 2010, and incorporated herein by reference.
(3) Filed as an exhibit to the Current Report on Form 8-K of the Company, file number 0-18706, filed with the SEC on March 26, 2012, and incorporated herein by reference.
(4) Filed as an exhibit to the Quarterly Report on Form 10-Q of the Company, file number 0-18706, filed with the SEC on February 5, 2009, and incorporated herein by reference.
(5) Filed as an exhibit to the Current Report on Form 8-K of the Company, file number 0-18706, filed with the SEC on October 18, 2007, and incorporated herein by reference.
(6) Filed as an exhibit to the Quarterly Report on Form 10-Q of the Company, file number 0-18706, filed with the SEC on August 16, 2007, and incorporated herein by reference.
(7) Filed as an exhibit to the Quarterly Report on Form 10-Q of the Company, file number 0-18706, filed with the SEC on November 12, 2004, and incorporated herein by reference.
Table of Contents

62
(8) Filed as an exhibit to the Quarterly Report on Form 10-Q of the Company, file number 0-18706, filed with the SEC on November 10, 2005, and incorporated herein by reference.
(9) Filed as Exhibit I to the Proxy Statement for the 2008 Annual Meeting of Stockholders filed on Schedule 14A, file number 0-18706, filed with the SEC on June 26, 2008.
(10) Filed as an exhibit to the Quarterly Report on Form 10-Q of the Company, file number 0-18706, filed with the SEC on August 6, 2009, and incorporated herein by reference.
(11) Filed herewith.(12) Filed as an exhibit to the Quarterly Report on Form 10-Q of the Company, file number 0-18706, filed with the
SEC on August 12, 2010, and incorporated herein by reference.(13) Filed as an exhibit to the Quarterly Report on Form 10-Q of the Company, file number 0-18706, filed with the
SEC on February 10, 2011, and incorporated herein by reference.(14) Filed as an exhibit to the Quarterly Report on Form 10-Q of the Company, file number 0-18706, filed with the
SEC on August 10, 2011, and incorporated herein by reference.(15) Filed as an exhibit to the Quarterly Report on Form 10-Q of the Company, file number 0-18706, filed with the
SEC on August 8, 2012, and incorporated herein by reference.(16) Filed as an exhibit to the Current Report on Form 8-K of the Company, file number 0-18706, filed with the SEC
on October 9, 2012, and incorporated herein by reference.(17) Filed as an exhibit to the Current Report on Form 8-K of the Company, file number 0-18706, filed with the SEC
on April 2, 2013, and incorporated herein by reference.(18) In accordance with Rule 406T of Regulation S-T promulgated by the SEC, Exhibit 101 is deemed not filed or part
of any registration statement or prospectus for purposes of Sections 11 or 12 of the Securities Act of 1933, as amended, is deemed not filed for purposes of Section 18 of the Exchange Act and otherwise is not subject to liability under these sections.
Table of Contents

63
SIGNATURES
Pursuant to the requirements of Section 13 or 15(d) of the Securities Exchange Act of 1934, the registrant has duly caused this report to be signed on its behalf by the undersigned, thereunto duly authorized.
BLACK BOX CORPORATION
Date: May 30, 2013 /s/ TIMOTHY C. HUFFMYER
Timothy C. HuffmyerVice President, Chief Financial Officer and Treasurer (Principal Accounting Officer)
Pursuant to the requirements of the Securities Exchange Act of 1934, this report has been signed below by the following persons on behalf of the registrant and in the capacities and on the dates indicated.
Signatures Capacity Date
/s/ WILLIAM F. ANDREWS Director May 30, 2013William F. Andrews
/s/ R. TERRY BLAKEMORE Director May 30, 2013R. Terry Blakemore
/s/ RICHARD L. CROUCH Director May 30, 2013Richard L. Crouch
/s/ THOMAS W. GOLONSKI Director May 30, 2013Thomas W. Golonski
/s/ THOMAS G. GREIG Director and Chairman of the Board May 30, 2013Thomas G. Greig
/s/ JOHN S. HELLER Director May 30, 2013John S. Heller
/s/ WILLIAM H. HERNANDEZ Director May 30, 2013William H. Hernandez
/s/ TIMOTHY C. HUFFMYER Vice President, Chief Financial Officer and Treasurer (Principal Accounting Officer)
May 30, 2013
Timothy C. Huffmyer
/s/ MICHAEL MCANDREW Director, President and Chief Executive Officer May 30, 2013Michael McAndrew
/s/ EDWARD A. NICHOLSON Director May 30, 2013Edward A. Nicholson
/s/ JOEL T. TRAMMELL Director May 30, 2013Joel T. Trammell
Table of Contents

64
EXHIBIT INDEX
Exhibit Number Description
3(i) Second Restated Certificate of Incorporation of the Company, as amended (1)
3(ii) Amended and Restated By-laws of the Company, as amended (2)
10.1 Credit Agreement dated as of March 23, 2012 by and among Black Box Corporation, the Guarantors, the Lenders parties thereto and Citizens Bank of Pennsylvania, as Administrative Agent (the “Credit Agreement”) (3)
10.2 Guaranty and Suretyship Agreement dated as of March 23, 2012 (3)
10.3 Amended and Restated Agreement between the Company and Michael McAndrew (4)
10.4 Amended and Restated Agreement between the Company and R. Terry Blakemore (5)
10.5 1992 Stock Option Plan, as amended through August 9, 2007 (6)
10.6 1992 Director Stock Option Plan, as amended through August 9, 2007 (6)
10.7 Form of Black Box Corporation Non-Qualified Stock Option Agreement (pursuant to the 1992 Director Stock Option Plan; form of agreement in effect prior to August 10, 2004) (7)
10.8 Form of Black Box Corporation Non-Qualified Stock Option Agreement (pursuant to the 1992 Director Stock Option Plan; form of agreement in effect as of August 10, 2004) (7)
10.9 Form of Black Box Corporation Non-Qualified Stock Option Agreement (pursuant to the 1992 Director Stock Option Plan; form of agreement in effect as of October 31, 2005) (8)
10.10 Form of Black Box Corporation Non-Qualified Stock Option Agreement (pursuant to the 1992 Stock Option Plan) (7)
10.11 Form of Black Box Corporation Non-Qualified Stock Option Agreement (pursuant to the 1992 Stock Option Plan; form of agreement in effect as of October 31, 2005) (8)
10.12 2008 Long-Term Incentive Plan (9)
10.13 Form of Black Box Corporation Non-Qualified Stock Option Agreement (pursuant to the 2008 Long-Term Incentive Plan) (10)
10.14 Form of Black Box Corporation Restricted Stock Unit Agreement (pursuant to the 2008 Long-Term Incentive Plan) (10)
10.15 Form of Black Box Corporation Restricted Stock Unit Agreement for Non-Employee Directors (pursuant to the 2008 Long-Term Incentive Plan) (10)
10.16 Form of Black Box Corporation Performance Share Award Agreement (pursuant to the 2008 Long-Term Incentive Plan) (10)
10.17 Summary of Director Compensation (11)
10.18 Description of Fiscal 2011 Annual Incentive Plan (12)
10.19 Agreement between the Company and Kenneth P. Davis (13)
10.20 Description of Fiscal 2012 Annual Incentive Plan (14)
10.21 Form of Black Box Corporation Performance Share Award Agreement (pursuant to the 2008 Long-Term Incentive Plan; form of agreement in effect as of May 17, 2011) (14)
10.22 Description of Fiscal 2013 Annual Incentive Plan (15)
10.23 Agreement between the Company and Timothy C. Huffmyer (16)
10.24 Agreement between the Company and R. Terry Blakemore (16)
10.25 Agreement between the Company and Ronald Basso (11)
10.26 Agreement between the Company and Michael McAndrew (17)
21.1 Subsidiaries of the Registrant (11)
23.1 Consent of Independent Registered Accounting Firm (11)
31.1 Certification of the Chief Executive Officer pursuant to Rule 13a-14(a) of the Securities and Exchange Act of 1934, as amended, and Section 302 of the Sarbanes-Oxley Act of 2002 (11)
31.2 Certification of the Chief Financial Officer pursuant to Rule 13a-14(a) of the Securities and Exchange Act of 1934, as amended, and Section 302 of the Sarbanes-Oxley Act of 2002 (11)
32.1 Certification of the Chief Executive Officer and Chief Financial Officer pursuant to Rule 13a-14(b) of the Securities and Exchange Act of 1934, as amended, and 18 U.S.C. Section 1350 as adopted pursuant to Section 906 of the Sarbanes-Oxley Act of 2002 (11)
101 Interactive Data File (18)
Table of Contents

65
(1) Filed as Exhibit 3(i) to the Quarterly Report on Form 10-Q of the Company, file number 0-18706, filed with the SEC on November 14, 2000, and incorporated herein by reference.
(2) Filed as Exhibit 3(ii) to the Current Report on Form 8-K of the Company, file number 0-18706, filed with the SEC on May 17, 2010, and incorporated herein by reference.
(3) Filed as an exhibit to the Current Report on Form 8-K of the Company, file number 0-18706, filed with the SEC on March 26, 2012, and incorporated herein by reference.
(4) Filed as an exhibit to the Quarterly Report on Form 10-Q of the Company, file number 0-18706, filed with the SEC on February 5, 2009, and incorporated herein by reference.
(5) Filed as an exhibit to the Current Report on Form 8-K of the Company, file number 0-18706, filed with the SEC on October 18, 2007, and incorporated herein by reference.
(6) Filed as an exhibit to the Quarterly Report on Form 10-Q of the Company, file number 0-18706, filed with the SEC on August 16, 2007, and incorporated herein by reference.
(7) Filed as an exhibit to the Quarterly Report on Form 10-Q of the Company, file number 0-18706, filed with the SEC on November 12, 2004, and incorporated herein by reference.
(8) Filed as an exhibit to the Quarterly Report on Form 10-Q of the Company, file number 0-18706, filed with the SEC on November 10, 2005, and incorporated herein by reference.
(9) Filed as Exhibit I to the Proxy Statement for the 2008 Annual Meeting of Stockholders filed on Schedule 14A, file number 0-18706, filed with the SEC on June 26, 2008.
(10) Filed as an exhibit to the Quarterly Report on Form 10-Q of the Company, file number 0-18706, filed with the SEC on August 6, 2009, and incorporated herein by reference.
(11) Filed herewith.(12) Filed as an exhibit to the Quarterly Report on Form 10-Q of the Company, file number 0-18706, filed with the
SEC on August 12, 2010, and incorporated herein by reference.(13) Filed as an exhibit to the Quarterly Report on Form 10-Q of the Company, file number 0-18706, filed with the
SEC on February 10, 2011, and incorporated herein by reference.(14) Filed as an exhibit to the Quarterly Report on Form 10-Q of the Company, file number 0-18706, filed with the
SEC on August 10, 2011, and incorporated herein by reference.(15) Filed as an exhibit to the Quarterly Report on Form 10-Q of the Company, file number 0-18706, filed with the
SEC on August 8, 2012, and incorporated herein by reference.(16) Filed as an exhibit to the Current Report on Form 8-K of the Company, file number 0-18706, filed with the SEC
on October 9, 2012, and incorporated herein by reference.(17) Filed as an exhibit to the Current Report on Form 8-K of the Company, file number 0-18706, filed with the SEC
on April 2, 2013, and incorporated herein by reference.(18) In accordance with Rule 406T of Regulation S-T promulgated by the SEC, Exhibit 101 is deemed not filed or part
of any registration statement or prospectus for purposes of Sections 11 or 12 of the Securities Act of 1933, as amended, is deemed not filed for purposes of Section 18 of the Exchange Act and otherwise is not subject to liability under these sections.
Table of Contents

Exhibit 10.17
1
SUMMARY OF DIRECTOR COMPENSATION
Directors who are not employees of Black Box Corporation (the “Company”) receive directors' fees of $35,000 per annum, paid quarterly, and an additional fee of $2,000 for each meeting of the Board of Directors attended in person and $1,000 for each meeting of the Board of Directors attended via telephone. The Chairman of the Board also receives an annual fee of $75,000, paid quarterly. Non-employee directors also are eligible to receive awards under the 2008 Long-Term Incentive Plan (the “2008 Plan”). On May 15, 2012, each non-employee director received an immediately-vested restricted stock unit award with a value of $100,000 on such date (the same value utilized in 2010 and 2011). Based on the closing price of the Company's common stock, par value $.001 per share (the “Common Stock”), on the date of grant (and rounding to the nearest ten shares), this grant resulted in a restricted stock unit award to each non-employee director for 4,530 shares of Common Stock which vested immediately upon grant. In addition, on May 14, 2013, each non-employee director received an immediately-vested restricted stock unit award with a value of $100,000 ($50,000 for Messrs. John S. Heller and Joel T. Trammell who recently joined the Board) on such date (which was the same amount for the previous three (3) fiscal years). Based on the closing price of the Common Stock on the date of grant (and rounding to the nearest ten shares), this grant resulted in a restricted stock unit award to each non-employee director for 3,820 shares (1,910 for Messrs. Heller and Trammell) of the Common Stock which vested immediately upon grant.
To further achieve the objective of more closely aligning the interests of our non-employee directors with those of our stockholders, upon the recommendation of the Governance Committee after discussions with the Governance Committee's compensation consultants, our Board adopted stock retention guidelines for our non-employee directors requiring them to hold, until retirement, but subject to diversification at age 60, 50% of the net, after-tax shares of Common Stock issued to them pursuant to performance share awards and restricted stock awards/units. All of our non-employee directors are in compliance with these ownership guidelines.
Members of the Audit Committee of the Board of Directors receive a fee of $1,500 for each meeting of the Audit Committee attended in person or by telephone, and members of each of the Compensation Committee, Nominating Committee and Governance Committee receive a fee of $1,000 for each meeting of the respective committee attended in person or by telephone. The Chairman of each of the Audit Committee and Compensation Committee receives an annual fee of $15,000, paid quarterly, and the Chairman of each of the Nominating Committee and Governance Committee receives an annual fee of $7,500, paid quarterly.
Any director who is an employee of the Company does not receive additional compensation for service as a director of the Company.
In addition, the Company maintains directors' and officers' liability insurance. Directors also are reimbursed customary expenses for attending meetings of the board of directors, board committees and stockholders.

Exhibit 21.1
1
SUBSIDIARIES OF THE REGISTRANT
Legal Name Doing Business As
State or OtherJurisdiction ofIncorporation orOrganization
Black Box Corporation Black Box Corporation Delaware
ACS Communications, Inc. ACS Communications, Inc. Texas
ACS Dataline of the Northwest, Inc. Black Box Network ServicesBlack Box Network Services - West
Oregon
ACS Investors, LLC ACS Investors, LLC Delaware
ACS Dataline, LP Black Box Network ServicesBlack Box Network Services - West
Texas
ACS Partners, LLC ACS Partners, LLC Texas
ADS Telecom, Inc. Black Box Network Services Florida
B & C Telephone, Inc. Black Box Network ServicesBlack Box Network Services - Spokane
Washington
BBox Holding Company BBox Holding Company Delaware
Advanced Communications Corporation Black Box Network Services - South Carolina South Carolina
Advanced Network Technologies, Inc. Black Box Network Services - California California
American Telephone Wiring Company Black Box Network Services - West VirginiaOperations
West Virginia
Atimco Network Services, Inc. Black Box Network Services - WesternPennsylvania Operations
Pennsylvania
Black Box Corporation of Pennsylvania Black Box Network Services Delaware
BB Technologies, Inc. BB Technologies, Inc. Delaware
Black Box A/S Black Box A/S Denmark
Black Box Canada Corporation Black Box Canada Corporation Canada
Black Box Comunicaciones, S.A. Black Box Comunicaciones, S.A. Spain
Black Box Datacom B.V. Black Box Datacom B.V. Netherlands
Black Box Deutschland GmbH Black Box Deutschland GmbH Germany
Black Box Netzwerk Service GmbH Black Box Netzwerk Service GmbH Germany
Black Box do Brasil Industria e Comercio Ltda. Black Box do Brasil Industria e Comercio Ltda. Brazil
Black Box France Black Box France France
Black Box GmbH Black Box GmbH Austria

Exhibit 21.1
2
Legal Name Doing Business As
State or OtherJurisdiction ofIncorporation orOrganization
Black Box Holdings Australia Pty. Ltd. Black Box Holdings Australia Pty. Ltd. Australia
Black Box Italia S.r.l. Black Box Italia S.r.l. Italy
Black Box Network Services AG Black Box Network Services AG Switzerland
Black Box Network Services Australia Pty Ltd Black Box Network Services Australia Pty Ltd Australia
Black Box Network Services New ZealandLimited
Black Box Network Services New ZealandLimited
New Zealand
Black Box Network Services India PrivateLimited
Black Box Network Services India Private Limited India
Black Box Network Services Kabushiki Kaisha Black Box Network Services Kabushiki Kaisha Japan
Black Box Network Services Korea Limited Black Box Network Services Korea Limited Korea
Black Box Network Services NV Black Box Network Services NV Belgium
Black Box Network Services (UK) Limited Black Box Network Services (UK) LimitedBlack Box Network Services (UK) Limited - Northern Ireland
England
Black Box P.R. Corp. Black Box P.R. Corp. Puerto Rico
Black Box LLC Holdings, Inc. Black Box LLC Holdings, Inc. Delaware
PS Technologies, LLC Black Box Network ServicesBlack Box Network Services - Western Operations
Maryland
PS Tech Video, LLC Black Box Network Services California
Black Box Network and Electrical Services, Inc. Black Box Network and Electrical Services, Inc.Allcom Electric
New York
Black Box Network Services, Inc. - GovernmentSolutions
Black Box Network Services, Inc. - GovernmentSolutions
Tennessee
Black Box Ventures Holding Company Black Box Ventures Holding Company Delaware
Cable Consultants, Incorporated Black Box Network Services - Atlanta Georgia
Comm Line, Inc. Black Box Network Services Ohio
Communication Contractors, Inc. Black Box Network Services - Chicago Illinois
Datel Communications, Inc. Black Box Network Services - Arizona Arizona
Delaney Telecom, Inc. Black Box Network Services Pennsylvania
DESIGNet, Inc. Black Box Network Services - San Jose California

Exhibit 21.1
3
Legal Name Doing Business As
State or OtherJurisdiction ofIncorporation orOrganization
InnerWireless, Inc. Black Box Network ServicesBlack Box Network Services - Wireless
Delaware
Integrated Cabling Systems, Inc. Integrated Cabling Systems, Inc. Nebraska
Jet Line Communications, Inc. Black Box Network Services - Dallas Texas
BBC Acquisition, LLC BBC Acquisition, LLC Texas
FBS Communications, L.P. Black Box Network Services - San Antonio Texas
K & A Communications, Inc. K & A Communications, Inc. Missouri
Koncepts Communications of L.I., Corp. Black Box Network Services - Tristate Operations New York
LOGOS Communications Systems, Inc. Black Box Network ServicesBlack Box Network Services - Cleveland
Ohio
Michael Electric, Inc. Black Box Network Services - New Jersey New Jersey
Midwest Communications Technologies, Inc. Black Box Network Services Ohio
Midwest Electronics and Communications, Inc. Black Box Network Services - Denver Operations Colorado
R & D Services, Inc. R & D Services, Inc. Massachusetts
Teldata Corporation Black Box Network Services - Tennessee Tennessee
Telefuture Communications Ltd. Black Box Network Services - New RochelleOffice
New York
Todd Communications, Inc. Black Box Network Services - North Carolina North Carolina
U.S. Premise Networking Services, Inc. Black Box Network Services - MN Minnesota
Black Box AB Black Box AB Sweden
Black Box Chile S.A. Black Box Chile S.A. Chile
Black Box de Mexico, S.A. de C.V. Black Box de Mexico, S.A. de C.V. Mexico
Black Box Finland OY Black Box Finland OY Finland
Black Box Network Services AB Black Box Network Services AB Sweden
Black Box Network Services Corporation Black Box Network Services Corporation Taiwan
Black Box Network Services (Dublin) Limited Black Box Network Services (Dublin) Limited Ireland
Black Box Network Services Puebla, S.A. de C.V. Black Box Network Services Puebla, S.A. de C.V. Mexico
Black Box Network Services S.r.l. Black Box Network Services S.r.l. Italy

Exhibit 21.1
4
Legal Name Doing Business As
State or OtherJurisdiction ofIncorporation orOrganization
Black Box Network Services SDN. BHD. Black Box Network Services SDN. BHD. Malaysia
Black Box Network Services Singapore Pte Ltd. Black Box Network Services Singapore Pte Ltd. Singapore
Black Box Norge AS Black Box Norge AS Norway
Black Box Services Reseaux Mediterranee Black Box Services Reseaux Mediterranee France
CBS Technologies Corp. Black Box Network Services New York
Consultoria en Redes, S.A. de C.V. Consultoria en Redes, S.A. de C.V. Mexico
J.C. Informatica Integral, S.A. de C.V. J.C. Informatica Integral, S.A. de C.V. Mexico
Mutual Telecom Services Inc. Black Box Network Services Delaware
Network Communications Technologies, Inc. Black Box Network ServicesBlack Box Network Services - Charlotte
North Carolina
Norstan, Inc. Black Box Network Services Minnesota
Norstan Canada Inc. Norstan Canada Inc. Minnesota
Norstan Canada, Ltd./Norstan Canada, Ltee Black Box Network Services Canada
Norstan Communications, Inc. Black Box Network ServicesBlack Box Network Services - Montana Black Box Network Services - Northeast
Minnesota
NextiraOne, LLC Black Box Network ServicesBlack Box Network Services - IllinoisBlack Box Network Services - MidwestBlack Box Network Services - NortheastBlack Box Network Services - NorthwestBlack Box Network Services - South
Delaware
Data Communications 2000, Inc. Data Communications 2000, Inc. California
Milgo Holdings Canada, LLC Milgo Holdings Canada, LLC Delaware
NextiraOne Canada ULC NextiraOne Canada ULC Canada
NextiraOne California L.P. NextiraOne California L.P. California
NXO Installation, LLC NXO Installation, LLC Delaware
NextiraOne Federal, LLC Black Box Network ServicesBlack Box Network Services - Federal
Delaware
Quanta Systems, LLC Black Box Network Services - Federal SecuritySolutions
Delaware
NextiraOne New York, LLC Black Box Network Services Delaware

Exhibit 21.1
5
Legal Name Doing Business As
State or OtherJurisdiction ofIncorporation orOrganization
Vibes Technologies, Inc. Black Box Resale Services Minnesota
Norstan International, Inc. Norstan International, Inc. Minnesota
Nortech Telecommunications Inc. Black Box Network Services - Elk Grove Illinois
Nu-Vision Technologies, Inc. Black Box Network Services New York
Nu-Vision Technologies, LLC Black Box Network ServicesBlack Box Network Services - Oregon
New York
BCS II, LLC BCS II, LLC Delaware
Scottel Voice & Data, Inc. Black Box Network ServicesBlack Box Network Services - Pacific
California
UCI Communications LLC Black Box Network Services South Carolina

Exhibit 23.1
1
CONSENT OF INDEPENDENT REGISTERED PUBLIC ACCOUNTING FIRM
Black Box CorporationLawrence, Pennsylvania
We hereby consent to the incorporation by reference in the Registration Statements on Form S 8 (Nos. 33-75254, 33-75252, 33-92656, 333-01978, 333-34839, 333-34837, 333-81521, 333-81523, 333-64412, 333-100294, 333-100295, 333-116550, 333-116551, 333-125839, 333-125840, 333-129838, 333-146202, and 333-157467) of our reports dated May 30, 2013 relating to the consolidated financial statements, financial statement schedule, and the effectiveness of Black Box Corporation's internal control over financial reporting which appear in this Annual Report on Form 10-K.
/s/ BDO USA, LLP
Chicago, IllinoisMay 30, 2013
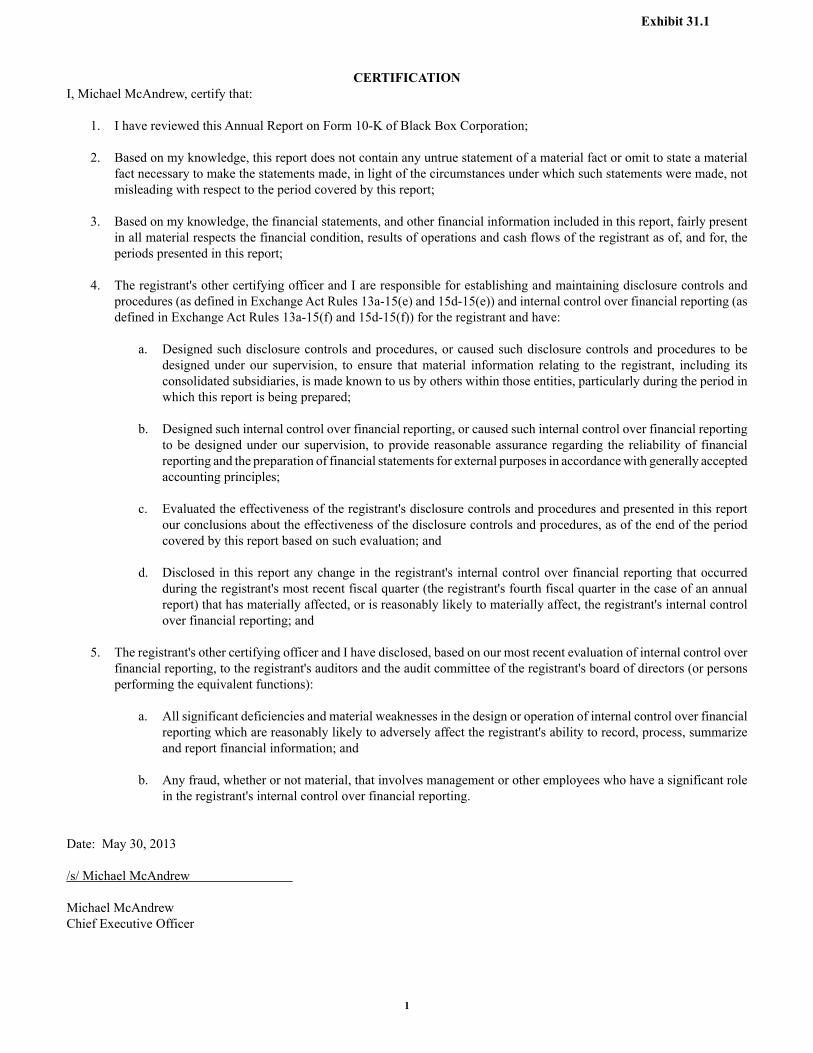
Exhibit 31.1
1
CERTIFICATION
I, Michael McAndrew, certify that:
1. I have reviewed this Annual Report on Form 10-K of Black Box Corporation;
2. Based on my knowledge, this report does not contain any untrue statement of a material fact or omit to state a material fact necessary to make the statements made, in light of the circumstances under which such statements were made, not misleading with respect to the period covered by this report;
3. Based on my knowledge, the financial statements, and other financial information included in this report, fairly present in all material respects the financial condition, results of operations and cash flows of the registrant as of, and for, the periods presented in this report;
4. The registrant's other certifying officer and I are responsible for establishing and maintaining disclosure controls and procedures (as defined in Exchange Act Rules 13a-15(e) and 15d-15(e)) and internal control over financial reporting (as defined in Exchange Act Rules 13a-15(f) and 15d-15(f)) for the registrant and have:
a. Designed such disclosure controls and procedures, or caused such disclosure controls and procedures to be designed under our supervision, to ensure that material information relating to the registrant, including its consolidated subsidiaries, is made known to us by others within those entities, particularly during the period in which this report is being prepared;
b. Designed such internal control over financial reporting, or caused such internal control over financial reporting to be designed under our supervision, to provide reasonable assurance regarding the reliability of financial reporting and the preparation of financial statements for external purposes in accordance with generally accepted accounting principles;
c. Evaluated the effectiveness of the registrant's disclosure controls and procedures and presented in this report our conclusions about the effectiveness of the disclosure controls and procedures, as of the end of the period covered by this report based on such evaluation; and
d. Disclosed in this report any change in the registrant's internal control over financial reporting that occurred during the registrant's most recent fiscal quarter (the registrant's fourth fiscal quarter in the case of an annual report) that has materially affected, or is reasonably likely to materially affect, the registrant's internal control over financial reporting; and
5. The registrant's other certifying officer and I have disclosed, based on our most recent evaluation of internal control over financial reporting, to the registrant's auditors and the audit committee of the registrant's board of directors (or persons performing the equivalent functions):
a. All significant deficiencies and material weaknesses in the design or operation of internal control over financial reporting which are reasonably likely to adversely affect the registrant's ability to record, process, summarize and report financial information; and
b. Any fraud, whether or not material, that involves management or other employees who have a significant role in the registrant's internal control over financial reporting.
Date: May 30, 2013
/s/ Michael McAndrew
Michael McAndrewChief Executive Officer

Exhibit 31.2
1
CERTIFICATION I, Timothy C. Huffmyer, certify that:
1. I have reviewed this Annual Report on Form 10-K of Black Box Corporation;
2. Based on my knowledge, this report does not contain any untrue statement of a material fact or omit to state a material fact necessary to make the statements made, in light of the circumstances under which such statements were made, not misleading with respect to the period covered by this report;
3. Based on my knowledge, the financial statements, and other financial information included in this report, fairly present in all material respects the financial condition, results of operations and cash flows of the registrant as of, and for, the periods presented in this report;
4. The registrant's other certifying officer and I are responsible for establishing and maintaining disclosure controls and procedures (as defined in Exchange Act Rules 13a-15(e) and 15d-15(e)) and internal control over financial reporting (as defined in Exchange Act Rules 13a-15(f) and 15d-15(f)) for the registrant and have:
a. Designed such disclosure controls and procedures, or caused such disclosure controls and procedures to be designed under our supervision, to ensure that material information relating to the registrant, including its consolidated subsidiaries, is made known to us by others within those entities, particularly during the period in which this report is being prepared;
b. Designed such internal control over financial reporting, or caused such internal control over financial reporting to be designed under our supervision, to provide reasonable assurance regarding the reliability of financial reporting and the preparation of financial statements for external purposes in accordance with generally accepted accounting principles;
c. Evaluated the effectiveness of the registrant's disclosure controls and procedures and presented in this report our conclusions about the effectiveness of the disclosure controls and procedures, as of the end of the period covered by this report based on such evaluation; and
d. Disclosed in this report any change in the registrant's internal control over financial reporting that occurred during the registrant's most recent fiscal quarter (the registrant's fourth fiscal quarter in the case of an annual report) that has materially affected, or is reasonably likely to materially affect, the registrant's internal control over financial reporting; and
5. The registrant's other certifying officer and I have disclosed, based on our most recent evaluation of internal control over financial reporting, to the registrant's auditors and the audit committee of the registrant's board of directors (or persons performing the equivalent functions):
a. All significant deficiencies and material weaknesses in the design or operation of internal control over financial reporting which are reasonably likely to adversely affect the registrant's ability to record, process, summarize and report financial information; and
b. Any fraud, whether or not material, that involves management or other employees who have a significant role in the registrant's internal control over financial reporting.
Date: May 30, 2013
/s/ Timothy C. Huffmyer
Timothy C. HuffmyerVice President, Chief Financial Officer and Treasurer (Principal Accounting Officer)
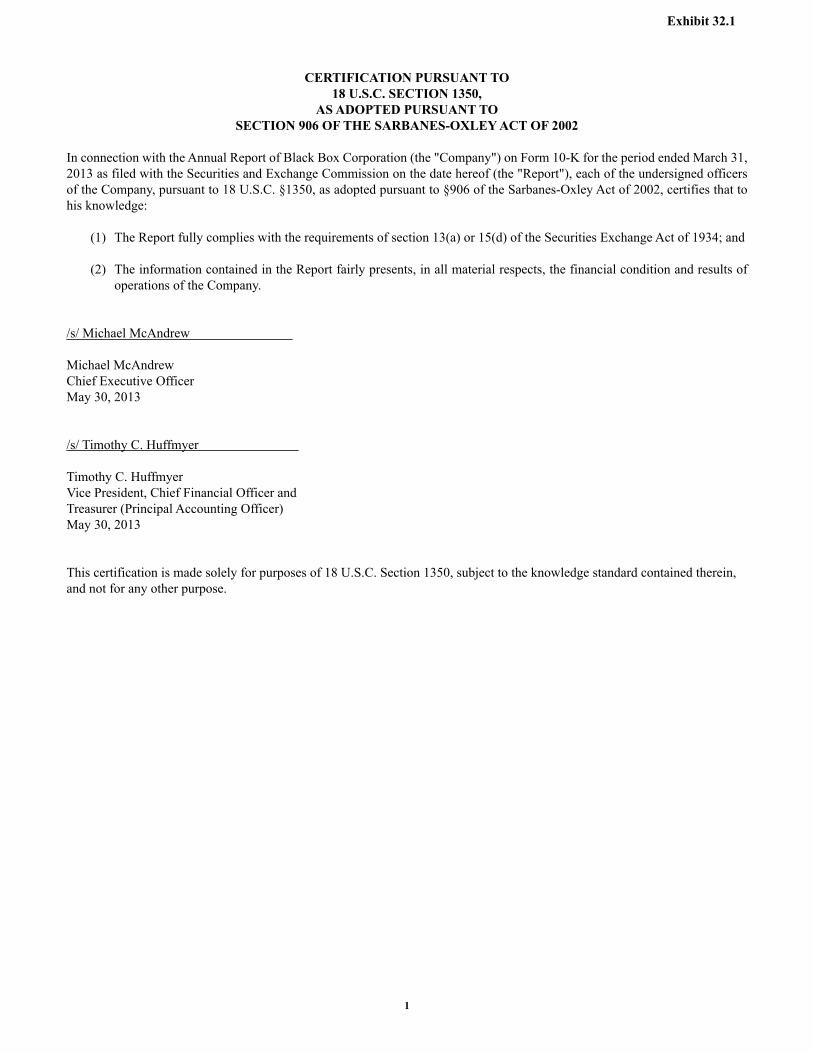
Exhibit 32.1
1
CERTIFICATION PURSUANT TO18 U.S.C. SECTION 1350,
AS ADOPTED PURSUANT TOSECTION 906 OF THE SARBANES-OXLEY ACT OF 2002
In connection with the Annual Report of Black Box Corporation (the "Company") on Form 10-K for the period ended March 31, 2013 as filed with the Securities and Exchange Commission on the date hereof (the "Report"), each of the undersigned officers of the Company, pursuant to 18 U.S.C. §1350, as adopted pursuant to §906 of the Sarbanes-Oxley Act of 2002, certifies that to his knowledge:
(1) The Report fully complies with the requirements of section 13(a) or 15(d) of the Securities Exchange Act of 1934; and
(2) The information contained in the Report fairly presents, in all material respects, the financial condition and results of operations of the Company.
/s/ Michael McAndrew
Michael McAndrewChief Executive OfficerMay 30, 2013
/s/ Timothy C. Huffmyer
Timothy C. HuffmyerVice President, Chief Financial Officer and Treasurer (Principal Accounting Officer)May 30, 2013
This certification is made solely for purposes of 18 U.S.C. Section 1350, subject to the knowledge standard contained therein, and not for any other purpose.

The graph below represents and compares the value, through March 31, 2013, of a hypothetical investment of $100 made on March 31, 2008, in each of (i) the common stock, (ii) the S&P SmallCap 600, (iii) the NASDAQ Composite, (iv) the Russell 2000 and (v) a peer group of companies determined by the Company (the “Peer Group”), assuming the reinvestment of dividends in each case. The Peer Group consists of Cisco Systems, Inc., Insight Enterprises, Inc., International Business Machines Corporation and Hewlett-Packard Company.
Year Ended March 31, 2008 2009 2010 2011 2012 2013
Black Box Corporation $ 100.00 $ 77.21 $ 101.41 $ 116.73 $ 85.63 $ 74.14
S&P SmallCap 600 100.00 61.94 101.58 127.25 133.64 155.21
NASDAQ Composite 100.00 67.15 105.79 124.53 139.51 150.61
Russell 2000 100.00 62.50 101.72 127.96 127.73 148.55
Peer Group 100.00 110.11 76.02 106.27 119.41 123.05
Performance Graph
$0
$20
$40
$60
$80
$100
$120
$140
$160
$180
3/08 3/09 3/10 3/11 3/12 3/13
Black Box Corporation S&P Smallcap 600 NASDAQ Composite
Russell 2000 Peer Group
$0
$20
$40
$60
$80
$100
$120
$140
$160
$180
3/08 3/09 3/10 3/11 3/12 3/13
Black Box Corporation S&P Smallcap 600 NASDAQ Composite
Russell 2000 Peer Group

Fiscal 2013 2012 2011
Diluted earnings (loss) per common share $ 1.73 $ (13.98) $ 2.97
EPS impact of reconciling items .94 17.01 0.32
Operating earnings per common share $ 2.67 $ 3.03 $ 3.29
Fiscal 2013 2012 2011
Operating income (loss) $ 56,269 $ (239,673) $ 91,058
Operating income as a % of revenue 5.6 % (22.0) % 8.5 %
Reconciling Items
Amortization of intangible assets on acquisitions 13,713 12,980 12,111
Restructuring expense 8,445 — —
Goodwill impairment loss — 317,797 —
Total reconciling items 22,158 330,777 12,111
Adjusted operating income $ 78,427 $ 91,104 $ 103,169
Adjusted operating income as a % of revenue 7.9 % 8.4 % 9.7 %
Fiscal 2013 2012 2011
Net income (loss) $ 28,806 $ (247,734) $ 52,862
Net income as a % of revenue 2.9 % (22.8) % 4.9 %
Provision for income taxes 17,657 1,668 32,418
Income (loss) before provision for income taxes 46,463 (246,066) 85,280
Reconciling Items
Amortization of intangible assets on acquisitions 13,713 12,980 12,111
Restructuring expense 8,445 — —
Goodwill impairment loss — 317,797 —
Joint venture impairment loss 2,670 — —
Change in fair value of interest-rate swaps 606 (530) (2,968)
Total reconciling items 25,434 330,247 9,143
Adjusted income before provision for income taxes 71,897 84,181 94,423
Operational income taxes1 27,322 30,207 35,894
Operating net income $ 44,575 $ 53,974 $ 58,529
Operating net income as a % of revenue 4.5 % 5.0 % 5.5 %1 The effective tax rate utilized to determine Operational income taxes is the Company’s operational effective tax rate which generally excludes discreet tax items.
The following table reconciles Diluted earnings (loss) per common share to Operating earnings per common share:
The following table reconciles Net income (loss) to Operating net income:
Non-GAAP Reconciliations (Dollars in thousands, except per share amounts.)
The following table reconciles Operating income (loss) to Adjusted operating income:

Investor Information
Corporate Headquarters 1000 Park Drive, Lawrence, PA 15055 Telephone: 724-746-5500 Facsimile: 724-746-0746 Web: blackbox.com
Dividend Policy Cash dividends of $0.08 per share of Common Stock were paid for each of the four quarters during Fiscal 2013. Cash dividends of $0.07 and $0.06 per share of Common Stock were paid for each of the four quarters during Fiscal 2012 and Fiscal 2011, respectively.
Investor RelationsTo receive further information about Black Box Corporation, including copies of press releases; Annual, Quarterly and Current Reports; and other SEC Filings — without charge — contact: Investor Relations Department 1000 Park Drive, Lawrence, PA 15055 Telephone: 724-873-6788 E-mail: [email protected] Or visit the Black Box Web site: blackbox.com.
Registrar and Transfer AgentAmerican Stock Transfer & Trust Company, LLC 6201 15th Avenue Brooklyn, NY 11219 Telephone: 800-937-5449 E-mail: [email protected] Web site: www.amstock.com
Corporate CounselBuchanan Ingersoll & Rooney PC One Oxford Centre 301 Grant Street, 20th Floor Pittsburgh, PA 15219-1410
Independent Registered Public Accounting FirmBDO USA, LLP 330 N. Wabash Avenue Suite 3200 Chicago, IL 60601 Telephone: 312-856-9100
Annual MeetingThe Annual Meeting of Stockholders will take place on Tuesday, August 6, 2013 at the Corporate Headquarters in Lawrence, PA.
Worldwide LocationsHeadquartered in the United States, the Company operates subsidiaries in Australia, Austria, Belgium, Brazil, Canada, Chile, Denmark, Finland, France, Germany, Italy, Japan, Korea, Malaysia, Mexico, the Netherlands, New Zealand, Norway, Puerto Rico, Singapore, Spain, Sweden, Switzerland, Taiwan and the United Kingdom, and services clients in approximately 150 countries.

High LowFiscal 2013
1st Quarter $ 28.87 20.262nd Quarter 28.80 21.283rd Quarter 26.57 19.314th Quarter 26.85 21.63
Fiscal 20121st Quarter $ 36.20 28.872nd Quarter 32.78 20.843rd Quarter 29.96 19.804th Quarter 31.94 24.34
Fiscal 20111st Quarter $ 35.59 27.012nd Quarter 33.42 26.403rd Quarter 40.17 31.154th Quarter 40.78 33.30
DirectorsWilliam F. Andrews, Chairman of the Executive Committee, Corrections Corporation of America; Chairman of Katy Industries, Inc.; Principal, Kohlberg & Co.; Director, Corrections Corporation of America, Katy Industries, Inc. and SVP Holdings Limited
R. Terry Blakemore, retired President and Chief Executive Officer, Black Box Corporation
Richard L. Crouch, retired General Partner, PricewaterhouseCoopers LLP
Thomas Golonski, retired Chairman, President and Chief Executive Officer, National City Bank of Pennsylvania; retired Executive Vice President, National City Corporation
Thomas G. Greig, Senior Managing Director, Liberty Capital Partners; Director, Rudolph Technologies, Inc.; Non-executive Chairman of the Board of Black Box Corporation
John S. Heller, retired Vice President and Chief Information Officer, Caterpillar Inc.
William H. Hernandez, retired Senior Vice President, Finance and Chief Financial Officer, PPG Industries, Inc.; Director, Albemarle Corporation, Eastman Kodak Company and USG Corporation
Michael McAndrew, President and Chief Executive Officer, Black Box Corporation
Edward A. Nicholson, Ph.D., Professor of Management and retired President, Robert Morris University; Director, Brentwood Bank
Common Stock InformationAs of March 31, 2013, there were 1,026 holders of record. The following table sets forth the fiscal quarterly high and low sale prices of the Company’s Common Stock as reported by the NASDAQ Global Select Market.
Joel T. Trammell, Managing Partner, Lone Rock Technology Group; formerly Founder and Chief Executive Officer, CacheIQ, Inc. and NetQoS, Inc.
Executive Vice President, Business Development, General Counsel and Secretary
Vice President, Chief Financial Officer and Treasurer
President and Chief Executive Officer
Executive Vice President, North America Commercial Services
OfficersMichael McAndrew Kenneth P. Davis Ronald Basso Timothy C. Huffmyer
Black Box Corporation (NASDAQ Global Select: BBOX)Complete life cycle services for today’s integrated communications.
1000 Park Drive l Lawrence, PA 15055 l 724-746-5500 l blackbox.com
© Copyright 2013. Black Box Corporation. All rights reserved.
Bla
ck
Bo
x C
orp
ora
tion
20
13
An
nu
al R
ep
ort
BLACK BOX®
2013 Annual Report
Enabling communications that empower your enterprise.