EN - European Parliament2009)0110_EN.pdfEN EN COMMISSION OF THE EUROPEAN COMMUNITIES Brussels,...
26
EN EN EN
Transcript of EN - European Parliament2009)0110_EN.pdfEN EN COMMISSION OF THE EUROPEAN COMMUNITIES Brussels,...

EN EN
EN

EN EN
COMMISSION OF THE EUROPEAN COMMUNITIES
Brussels, 6.3.2009 COM(2009) 110 final
PRELIMINARY DRAFT AMENDING BUDGET No 3 TO THE GENERAL BUDGET 2009
GENERAL STATEMENT OF REVENUE
(presented by the Commission)

EN 2 EN
PRELIMINARY DRAFT AMENDING BUDGET No 3 TO THE GENERAL BUDGET 2009
GENERAL STATEMENT OF REVENUE
Having regard to:
– the Treaty establishing the European Community, and in particular Article 272 thereof,
– the Treaty establishing the European Atomic Energy Community, and in particular Article 177 thereof,
– the Council Regulation (EC, Euratom) No 1605/2002 of 25 June 2002 on the Financial Regulation applicable to the general budget of the European Communities1, as last amended by Council Regulation (EC) No 1525/20072, and in particular Article 37 thereof,
The European Commission hereby presents to the budgetary authority the Preliminary Draft Amending Budget No 3 to the 2009 budget.
1 OJ L 248, 16.9.2002, p. 1. 2 OJ L 343, 27.12.2007, p. 9.

EN 3 EN
TABLE OF CONTENTS
1. Introduction...................................................................................................................4
2. Rate of call of the VAT-based own resource................................................................5
3. Gross reductions in their annual GNI-based contributions for the Netherlands and Sweden......................................................................................................................................9
4. Calculation of the correction mechanism in favour of the United Kingdom (UK correction)....................................................................................................................................13
4.1. Calculation of the corrections .....................................................................................13
4.1.1. 2007 UK correction ....................................................................................................14
4.1.2. 2008 UK correction ....................................................................................................14
4.2. Entry in the PDAB 3/2009 of the 1st update of the 2007 UK correction and of the provisional amount of the 2008 UK correction ..........................................................15
4.2.1. 2007 UK correction (chapter 15) ................................................................................15
4.2.2. 2008 UK correction (chapter 15) ................................................................................16
4.2.3. Financial impact of ORD 2007 on contributions for the UK correction, per year and per Member State..............................................................................................................17
5. Other amendments related to the implementation of ORD 2007 ...............................18
5.1. Impact on GNI-based own resource contributions of the new call rate of the VAT-based own resource ...............................................................................................................18
5.2. Technical amendments related to the implementation of ORD 2007.........................22
6. Summary of the financial impact from the implementation of ORD 2007 ................22
7. Summary of the financing of the general budget........................................................24
CHANGES TO THE GENERAL STATEMENT OF REVENUE
The changes to the general statement of revenue are forwarded separately via the SEI-BUD system. An English version of the changes to the general statement of revenue is attached for information as a budgetary annex.

EN 4 EN
1. INTRODUCTION
This Preliminary Draft Amending Budget No 3 to the Budget for 2009 (PDAB 3/2009) covers the implementation of the new Own Resources Decision No 2007/436/EC, Euratom (hereafter, ORD 2007)3, following the entry into force of ORD 2007 on 1 March 2009. PDAB 3/2009 takes into account the retroactive effect of ORD 2007 from 1 January 2007 onwards and therefore includes the adjustments for the financial years 2007, 2008 and 2009 related to the new provisions introduced by ORD 2007.
Therefore the Commission proposes to readjust the financing of the Community budget.
3 The implementation of ORD 2007 is regulated by Council Regulation (EC, Euratom) No 105/2009 of
26 January 2009 that amends Council Regulation (EC, Euratom) No 1150/2000.

EN 5 EN
2. RATE OF CALL OF THE VAT-BASED OWN RESOURCE
Council Decision No 2000/597 of 29 September 2000 (hereafter, ORD 2000) provided for the application of a uniform rate valid for all Member States to the harmonised Value Added Tax (VAT) assessment bases determined according to Community rules. This rate was calculated according to the specific provisions of Article 2 (4) of ORD 2000.
According to ORD 2007, the uniform rate of call of the VAT-based resource is fixed at 0.30 % from 1 January 2007. However, for the period 2007-2013, the rate of call of the VAT-based own resource for Austria has been fixed at 0.225 %, for Germany at 0.15 % and for the Netherlands and Sweden at 0.10 %.
The revised VAT-based own resource contributions taking into account the new uniform rates are set out in the following tables:
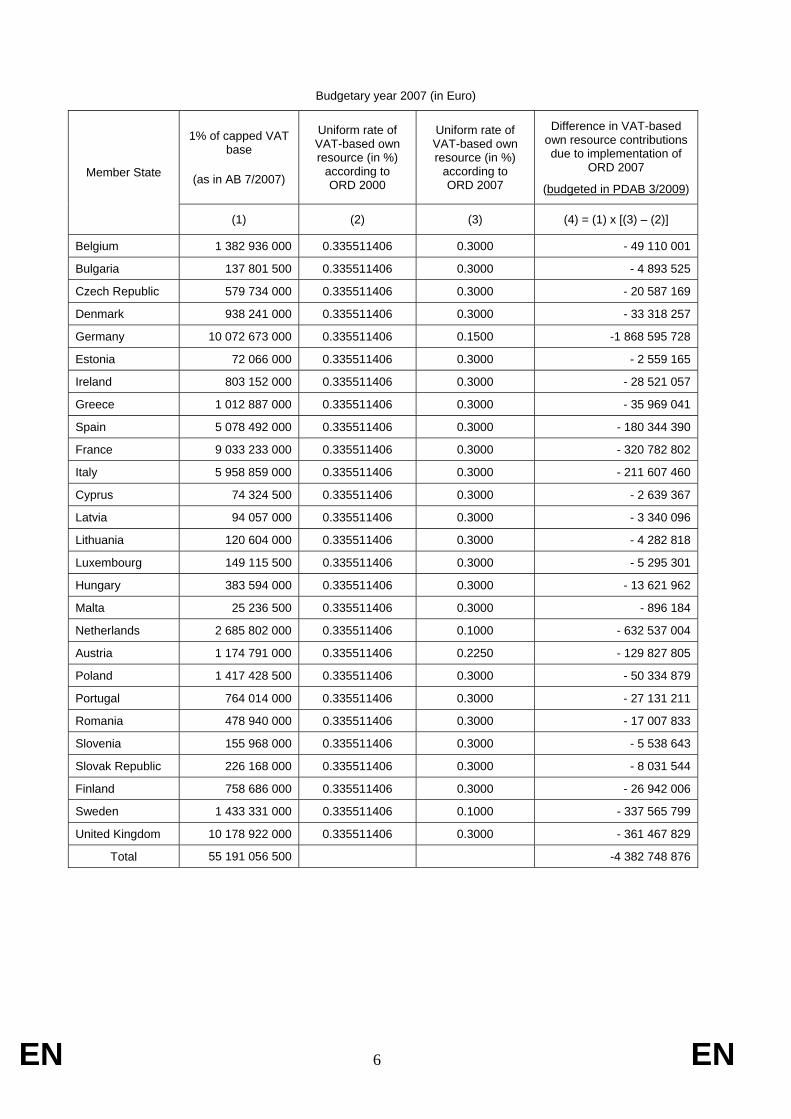
EN 6 EN
Budgetary year 2007 (in Euro)
1% of capped VAT base
(as in AB 7/2007)
Uniform rate of VAT-based own resource (in %)
according to ORD 2000
Uniform rate of VAT-based own resource (in %)
according to ORD 2007
Difference in VAT-based own resource contributions due to implementation of
ORD 2007
(budgeted in PDAB 3/2009) Member State
(1) (2) (3) (4) = (1) x [(3) – (2)]
Belgium 1 382 936 000 0.335511406 0.3000 - 49 110 001
Bulgaria 137 801 500 0.335511406 0.3000 - 4 893 525
Czech Republic 579 734 000 0.335511406 0.3000 - 20 587 169
Denmark 938 241 000 0.335511406 0.3000 - 33 318 257
Germany 10 072 673 000 0.335511406 0.1500 -1 868 595 728
Estonia 72 066 000 0.335511406 0.3000 - 2 559 165
Ireland 803 152 000 0.335511406 0.3000 - 28 521 057
Greece 1 012 887 000 0.335511406 0.3000 - 35 969 041
Spain 5 078 492 000 0.335511406 0.3000 - 180 344 390
France 9 033 233 000 0.335511406 0.3000 - 320 782 802
Italy 5 958 859 000 0.335511406 0.3000 - 211 607 460
Cyprus 74 324 500 0.335511406 0.3000 - 2 639 367
Latvia 94 057 000 0.335511406 0.3000 - 3 340 096
Lithuania 120 604 000 0.335511406 0.3000 - 4 282 818
Luxembourg 149 115 500 0.335511406 0.3000 - 5 295 301
Hungary 383 594 000 0.335511406 0.3000 - 13 621 962
Malta 25 236 500 0.335511406 0.3000 - 896 184
Netherlands 2 685 802 000 0.335511406 0.1000 - 632 537 004
Austria 1 174 791 000 0.335511406 0.2250 - 129 827 805
Poland 1 417 428 500 0.335511406 0.3000 - 50 334 879
Portugal 764 014 000 0.335511406 0.3000 - 27 131 211
Romania 478 940 000 0.335511406 0.3000 - 17 007 833
Slovenia 155 968 000 0.335511406 0.3000 - 5 538 643
Slovak Republic 226 168 000 0.335511406 0.3000 - 8 031 544
Finland 758 686 000 0.335511406 0.3000 - 26 942 006
Sweden 1 433 331 000 0.335511406 0.1000 - 337 565 799
United Kingdom 10 178 922 000 0.335511406 0.3000 - 361 467 829
Total 55 191 056 500 -4 382 748 876

EN 7 EN
Budgetary year 2008 (in Euro)
1% of capped VAT base
(as in AB 10/2008)
Uniform rate of VAT-based own resource (in %)
according to ORD 2000
Uniform rate of VAT-based own resource (in %)
according to ORD 2007
Difference in VAT-based own resource contributions due to implementation of
ORD 2007
(budgeted in PDAB 3/2009)
Member State
(1) (2) (3) (4) = (1) x [(3) – (2)]
Belgium 1 477 380 000 0.312238077 0.3000 - 18 080 290
Bulgaria 164 568 500 0.312238077 0.3000 - 2 014 002
Czech Republic 664 746 500 0.312238077 0.3000 - 8 135 219
Denmark 1 010 552 000 0.312238077 0.3000 - 12 367 213
Germany 10 693 785 000 0.312238077 0.1500 -1 734 939 111
Estonia 80 569 000 0.312238077 0.3000 - 986 010
Ireland 807 539 500 0.312238077 0.3000 - 9 882 730
Greece 1 186 227 500 0.312238077 0.3000 - 14 517 143
Spain 5 314 146 000 0.312238077 0.3000 - 65 034 926
France 9 501 255 000 0.312238077 0.3000 - 116 277 087
Italy 6 448 943 000 0.312238077 0.3000 - 78 922 659
Cyprus 81 104 000 0.312238077 0.3000 - 992 557
Latvia 112 964 000 0.312238077 0.3000 - 1 382 462
Lithuania 154 087 000 0.312238077 0.3000 - 1 885 729
Luxembourg 147 725 500 0.312238077 0.3000 - 1 807 876
Hungary 446 300 000 0.312238077 0.3000 - 5 461 854
Malta 27 381 500 0.312238077 0.3000 - 335 097
Netherlands 2 869 049 000 0.312238077 0.1000 - 608 921 442
Austria 1 243 687 000 0.312238077 0.2250 - 108 496 862
Poland 1 680 813 000 0.312238077 0.3000 - 20 569 918
Portugal 799 321 500 0.312238077 0.3000 - 9 782 158
Romania 543 585 000 0.312238077 0.3000 - 6 652 435
Slovenia 176 000 500 0.312238077 0.3000 - 2 153 908
Slovak Republic 240 492 000 0.312238077 0.3000 - 2 943 160
Finland 797 612 000 0.312238077 0.3000 - 9 761 237
Sweden 1 443 385 000 0.312238077 0.1000 - 306 341 256
United Kingdom 9 844 979 000 0.312238077 0.3000 - 120 483 608
Total 57 958 198 000 -3 269 127 949

EN 8 EN
Budgetary year 2009 (in Euro)
1% of capped VAT base
(as in B2009)
Uniform rate of VAT-based own resource (in %)
according to ORD 2000
Uniform rate of VAT-based own resource (in %)
according to ORD 2007
Difference in VAT-based own resource contributions due to implementation of
ORD 2007
(budgeted in PDAB 3/2009)
Member State
(1) (2) (3) (4) = (1) x [(3) – (2)]
Belgium 1 536 968 000 0.327757350 0.3000 - 42 662 159
Bulgaria 183 065 500 0.327757350 0.3000 - 5 081 413
Czech Republic 749 109 500 0.327757350 0.3000 - 20 793 295
Denmark 1 049 347 000 0.327757350 0.3000 - 29 127 092
Germany 11 027 669 000 0.327757350 0.1500 -1 960 249 221
Estonia 89 573 500 0.327757350 0.3000 - 2 486 323
Ireland 851 305 500 0.327757350 0.3000 - 23 629 985
Greece 1 270 498 000 0.327757350 0.3000 - 35 265 658
Spain 5 535 648 000 0.327757350 0.3000 - 153 654 921
France 9 811 160 000 0.327757350 0.3000 - 272 331 805
Italy 6 665 384 000 0.327757350 0.3000 - 185 013 399
Cyprus 86 575 000 0.327757350 0.3000 - 2 403 093
Latvia 126 051 500 0.327757350 0.3000 - 3 498 856
Lithuania 170 568 000 0.327757350 0.3000 - 4 734 516
Luxembourg 156 391 000 0.327757350 0.3000 - 4 341 000
Hungary 470 859 000 0.327757350 0.3000 - 13 069 798
Malta 28 914 500 0.327757350 0.3000 - 802 590
Netherlands 2 991 782 000 0.327757350 0.1000 - 681 400 341
Austria 1 288 744 000 0.327757350 0.2250 - 132 427 919
Poland 1 892 700 500 0.327757350 0.3000 - 52 536 351
Portugal 831 122 000 0.327757350 0.3000 - 23 069 744
Romania 603 228 000 0.327757350 0.3000 - 16 744 011
Slovenia 189 526 000 0.327757350 0.3000 - 5 260 740
Slovak Republic 272 101 000 0.327757350 0.3000 - 7 552 803
Finland 836 092 000 0.327757350 0.3000 - 23 207 699
Sweden 1 517 820 000 0.327757350 0.1000 - 345 694 661
United Kingdom 9 617 309 000 0.327757350 0.3000 - 266 951 015
Total 59 849 511 500 -4 313 990 408

EN 9 EN
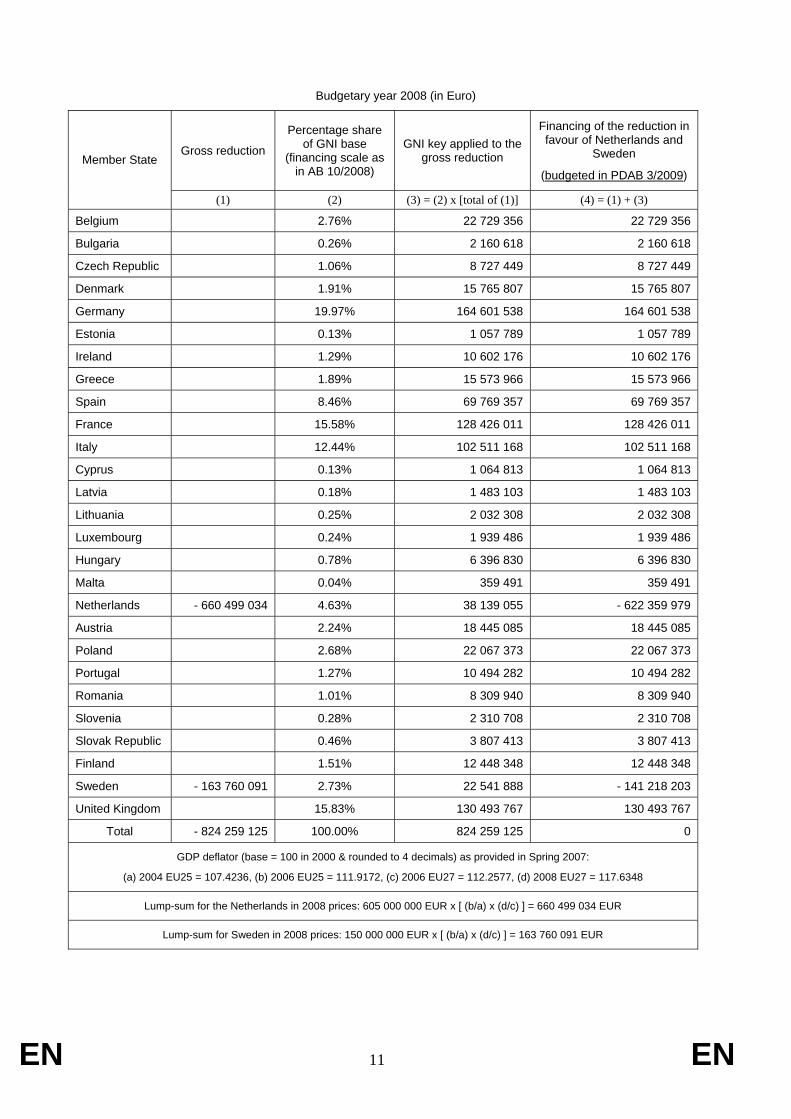
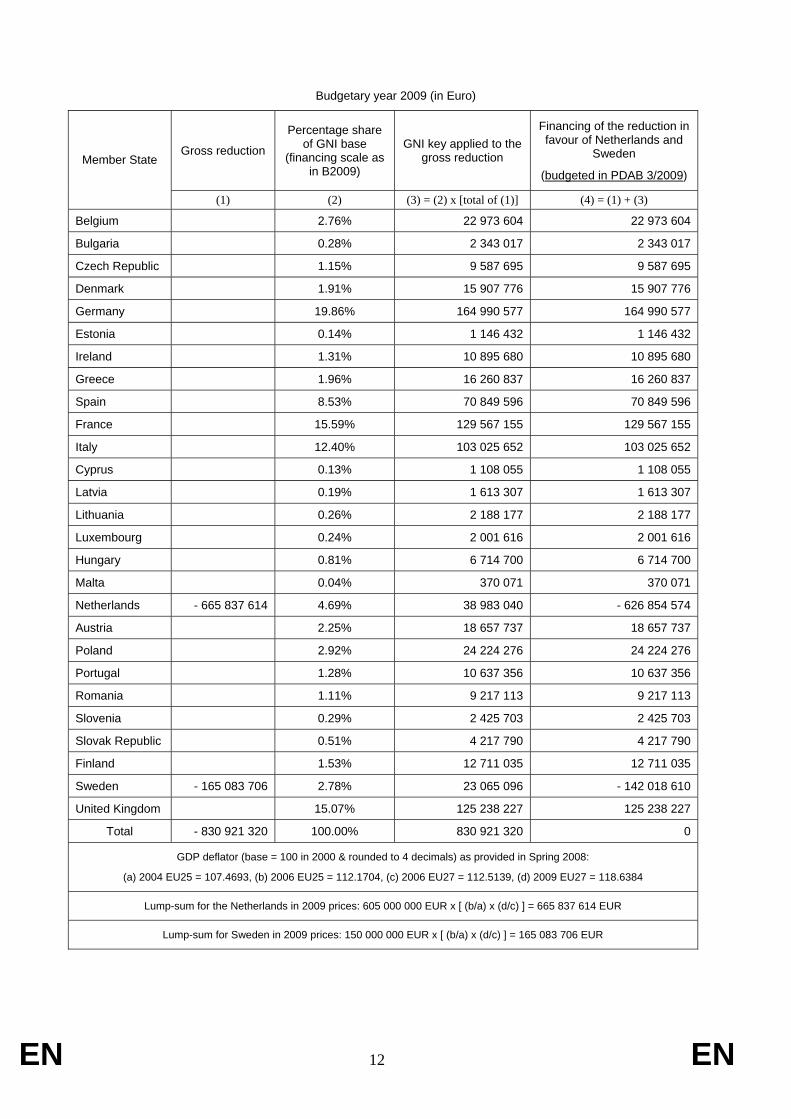
3. GROSS REDUCTIONS IN THEIR ANNUAL GNI-BASED CONTRIBUTIONS FOR THE NETHERLANDS AND SWEDEN
According to ORD 2007, the Netherlands and Sweden receive a gross reduction in their annual GNI-based contributions for the period 2007-2013. ORD 2007 specifies the amount of this reduction (which has to be adapted for current prices) and indicates that this reduction shall be granted after financing of the correction mechanism in favour of the UK (UK correction).
This reduction is to be financed by all Member States pursuant to Article 10 (9) of Regulation No 1150/2000, as amended by Regulation No 105/2009 implementing ORD 2007.
The gross reduction for the Netherlands and Sweden, which equals respectively EUR 605 million and EUR 150 million in 2004 prices, is adjusted to current prices by applying the GDP deflator for the EU expressed in Euro.
The following tables provide an overview of the gross reductions and their financing.

EN 10 EN
Budgetary year 2007 (in Euro)
Gross reduction
Percentage share of GNI base
(financing scale as in AB 7/2007)
GNI key applied to the gross reduction
Financing of the reduction in favour of Netherlands and
Sweden
(budgeted in PDAB 3/2009) Member State
(1) (2) (3) = (2) x [total of (1)] (4) = (1) + (3)
Belgium 2.73% 21 698 582 21 698 582
Bulgaria 0.23% 1 822 583 1 822 583
Czech Republic 0.96% 7 667 646 7 667 646
Denmark 1.90% 15 164 793 15 164 793
Germany 19.83% 157 876 965 157 876 965
Estonia 0.12% 953 155 953 155
Ireland 1.33% 10 622 605 10 622 605
Greece 1.68% 13 396 590 13 396 590
Spain 8.44% 67 168 870 67 168 870
France 15.35% 122 231 797 122 231 797
Italy 12.56% 100 044 774 100 044 774
Cyprus 0.12% 983 027 983 027
Latvia 0.16% 1 244 011 1 244 011
Lithuania 0.22% 1 722 328 1 722 328
Luxembourg 0.25% 1 972 223 1 972 223
Hungary 0.77% 6 124 591 6 124 591
Malta 0.04% 333 782 333 782
Netherlands - 638 056 879 4.57% 36 375 847 - 601 681 032
Austria 2.19% 17 399 575 17 399 575
Poland 2.35% 18 747 115 18 747 115
Portugal 1.27% 10 104 960 10 104 960
Romania 0.94% 7 512 715 7 512 715
Slovenia 0.26% 2 062 855 2 062 855
Slovak Republic 0.42% 3 363 898 3 363 898
Finland 1.46% 11 608 429 11 608 429
Sweden - 158 195 920 2.76% 21 968 798 - 136 227 122
United Kingdom 17.09% 136 080 285 136 080 285
Total - 796 252 799 100.00% 796 252 799 0
GDP deflator (base = 100 in 2000 & rounded to 4 decimals) as provided in Spring 2006:
(a) EU25 2004 = 107.2318, (b) EU25 2006 = 111.0288, (c) EU27 2006 = 111.3417, (d) EU27 2007 = 113.4096
Lump-sum for the Netherlands in 2007 prices: 605 000 000 EUR x [ (b/a) x (d/c) ] = 638 056 879 EUR
Lump-sum for Sweden in 2007 prices: 150 000 000 EUR x [ (b/a) x (d/c) ] = 158 195 920 EUR
EN 11 EN
Budgetary year 2008 (in Euro)
Gross reduction
Percentage share of GNI base
(financing scale as in AB 10/2008)
GNI key applied to the gross reduction
Financing of the reduction in favour of Netherlands and
Sweden
(budgeted in PDAB 3/2009) Member State
(1) (2) (3) = (2) x [total of (1)] (4) = (1) + (3)
Belgium 2.76% 22 729 356 22 729 356
Bulgaria 0.26% 2 160 618 2 160 618
Czech Republic 1.06% 8 727 449 8 727 449
Denmark 1.91% 15 765 807 15 765 807
Germany 19.97% 164 601 538 164 601 538
Estonia 0.13% 1 057 789 1 057 789
Ireland 1.29% 10 602 176 10 602 176
Greece 1.89% 15 573 966 15 573 966
Spain 8.46% 69 769 357 69 769 357
France 15.58% 128 426 011 128 426 011
Italy 12.44% 102 511 168 102 511 168
Cyprus 0.13% 1 064 813 1 064 813
Latvia 0.18% 1 483 103 1 483 103
Lithuania 0.25% 2 032 308 2 032 308
Luxembourg 0.24% 1 939 486 1 939 486
Hungary 0.78% 6 396 830 6 396 830
Malta 0.04% 359 491 359 491
Netherlands - 660 499 034 4.63% 38 139 055 - 622 359 979
Austria 2.24% 18 445 085 18 445 085
Poland 2.68% 22 067 373 22 067 373
Portugal 1.27% 10 494 282 10 494 282
Romania 1.01% 8 309 940 8 309 940
Slovenia 0.28% 2 310 708 2 310 708
Slovak Republic 0.46% 3 807 413 3 807 413
Finland 1.51% 12 448 348 12 448 348
Sweden - 163 760 091 2.73% 22 541 888 - 141 218 203
United Kingdom 15.83% 130 493 767 130 493 767
Total - 824 259 125 100.00% 824 259 125 0
GDP deflator (base = 100 in 2000 & rounded to 4 decimals) as provided in Spring 2007:
(a) 2004 EU25 = 107.4236, (b) 2006 EU25 = 111.9172, (c) 2006 EU27 = 112.2577, (d) 2008 EU27 = 117.6348
Lump-sum for the Netherlands in 2008 prices: 605 000 000 EUR x [ (b/a) x (d/c) ] = 660 499 034 EUR
Lump-sum for Sweden in 2008 prices: 150 000 000 EUR x [ (b/a) x (d/c) ] = 163 760 091 EUR
EN 12 EN
Budgetary year 2009 (in Euro)
Gross reduction
Percentage share of GNI base
(financing scale as in B2009)
GNI key applied to the gross reduction
Financing of the reduction in favour of Netherlands and
Sweden
(budgeted in PDAB 3/2009) Member State
(1) (2) (3) = (2) x [total of (1)] (4) = (1) + (3)
Belgium 2.76% 22 973 604 22 973 604
Bulgaria 0.28% 2 343 017 2 343 017
Czech Republic 1.15% 9 587 695 9 587 695
Denmark 1.91% 15 907 776 15 907 776
Germany 19.86% 164 990 577 164 990 577
Estonia 0.14% 1 146 432 1 146 432
Ireland 1.31% 10 895 680 10 895 680
Greece 1.96% 16 260 837 16 260 837
Spain 8.53% 70 849 596 70 849 596
France 15.59% 129 567 155 129 567 155
Italy 12.40% 103 025 652 103 025 652
Cyprus 0.13% 1 108 055 1 108 055
Latvia 0.19% 1 613 307 1 613 307
Lithuania 0.26% 2 188 177 2 188 177
Luxembourg 0.24% 2 001 616 2 001 616
Hungary 0.81% 6 714 700 6 714 700
Malta 0.04% 370 071 370 071
Netherlands - 665 837 614 4.69% 38 983 040 - 626 854 574
Austria 2.25% 18 657 737 18 657 737
Poland 2.92% 24 224 276 24 224 276
Portugal 1.28% 10 637 356 10 637 356
Romania 1.11% 9 217 113 9 217 113
Slovenia 0.29% 2 425 703 2 425 703
Slovak Republic 0.51% 4 217 790 4 217 790
Finland 1.53% 12 711 035 12 711 035
Sweden - 165 083 706 2.78% 23 065 096 - 142 018 610
United Kingdom 15.07% 125 238 227 125 238 227
Total - 830 921 320 100.00% 830 921 320 0
GDP deflator (base = 100 in 2000 & rounded to 4 decimals) as provided in Spring 2008:
(a) 2004 EU25 = 107.4693, (b) 2006 EU25 = 112.1704, (c) 2006 EU27 = 112.5139, (d) 2009 EU27 = 118.6384
Lump-sum for the Netherlands in 2009 prices: 605 000 000 EUR x [ (b/a) x (d/c) ] = 665 837 614 EUR
Lump-sum for Sweden in 2009 prices: 150 000 000 EUR x [ (b/a) x (d/c) ] = 165 083 706 EUR
EN 13 EN
4. CALCULATION OF THE CORRECTION MECHANISM IN FAVOUR OF THE UNITED KINGDOM (UK CORRECTION)
ORD 2007 introduces several changes to the calculation of the amount of the UK correction.
The fixation of the rate of call of the VAT-based own resource at 0.30 % and the reduced rates temporary granted to Germany, the Netherlands, Austria and Sweden (see above) increase the amount of the UK correction via a reduction of the 'UK advantage', as described in Article 4 (1) (d) of ORD 2007 (unchanged, as compared to ORD 2000).
Article 4 (1) (f) of ORD 2007 suppresses the adjustment related to pre-accession expenditure from the 2013 UK correction (to be first budgeted in 2014) onwards.
Article 4 (1) (g) of ORD 2007 introduces an adjustment related to expenditure in the new Member States: from the 2008 UK correction (to be first budgeted in 2009) onwards, total allocated expenditure will be reduced by allocated expenditure in Member States which joined the EU after 30 April 2004, except for agricultural direct payments and market-related expenditure as well as that part of rural development expenditure originating from the EAGGF, Guarantee Section. This reduction will be phased in progressively according to the following schedule: 20 % for the 2008 UK correction, 70 % for the 2009 UK correction and 100 % onwards. The additional contribution of the UK resulting from the above reduction may not exceed a ceiling of EUR 10.5 billion, in 2004 prices, during the period 2007-2013. In the event of further enlargement between 2008 and 2013, this ceiling will be adjusted upwards accordingly.
The present PDAB 3/2009 concerns the 2007 UK correction and 2008 UK correction, the amounts of which are modified by ORD 2007. From the 2007 UK correction onwards, UK corrections are subject to the rules of ORD 2007 and its accompanying working document No 9851/07 ADD2 of 23 May 2007 on the calculation method of the UK correction4.
4.1. Calculation of the corrections
In the present PDAB, the calculation and financing of the 1st update of the 2007 UK correction, as well as of the provisional amount of the 2008 UK correction are entered. The amount of the 1st update of the 2007 and provisional amount of the 2008 UK correction are entered under chapter 15 of the PDAB 3/2009, respectively as a replacement of the 1st update of the 2007 UK correction entered under chapter 15 of the AB 5/2008 and as a replacement of the provisional amount of the 2008 UK correction entered under chapter 15 of the budget 2009.
4 http://ec.europa.eu/budget/library/documents/revenue_expenditure/own_resources/calc_own_res_2007_en.pdf

EN 14 EN
4.1.1. 2007 UK correction
The following table summarises the changes between the 1st update of the 2007 UK correction entered in the AB 5/2008 (calculated according to ORD 2000) and the 1st update of the 2007 UK correction to be entered in the PDAB 3/2009 (calculated according to ORD 2007)
2007 UK correction 1st update AB 5/2008
(ORD 2000)
1st update PDAB 3/2009 (ORD 2007)
Difference
(1) UK share of notional uncapped VAT base 17.3696 % 17.3696 % 0.00 %
(2) UK share of enlargement-adjusted total allocated expenditure
7.2340 % 7.2340 % 0.00%
(3) = (1) - (2) 10.1356 % 10.1356 % 0.00 %(4) Total allocated expenditure 105 334 416 783 105 334 416 783 0(5) Enlargement-related expenditure 2 930 184 072 2 930 184 072 0
(6) Enlargement-adjusted total allocated expenditure = (4) - (5)
102 404 232 710 102 404 232 710 0
(7) UK correction original amount = (3) x (6) x 0.66 6 850 293 993 6 850 293 993 0(8) UK advantage 360 165 002 - 25 569 599 - 385 734 601(9) Core UK correction = (7) - (8) 6 490 128 991 6 875 863 592 + 385 734 601
(10) TOR windfall gains -44 329 991 -44 329 991 0(11) UK correction = (9) - (10) 6 534 458 982 6 920 193 583 + 385 734 601
The 1st update of the 2007 UK correction (calculated according to ORD 2007) is EUR 385.7 million higher as compared to the 1st update of the 2007 UK correction entered in the AB 5/2008 (calculated according to ORD 2000).
4.1.2. 2008 UK correction
The table hereafter summarises the changes between the provisional amount of the 2008 UK correction entered in the budget 2009 (calculated according to ORD 2000) and the provisional amount of the 2008 UK correction to be entered in the PDAB 3/2009 (calculated according to ORD 2007).
2008 UK correction provisional
B 2009 (ORD 2000)
provisional PDAB 3/2009 (ORD 2007)
Difference
(1) UK share of notional uncapped VAT base 16.5798 % 16.5798 % 0.00 %
(2) UK share of enlargement-adjusted total allocated expenditure
7.2239 % 7.4338 % + 0.21%
(3) = (1) - (2) 9.3559 % 9.1460 % - 0.21 %(4) Total allocated expenditure 109 143 810 077 109 143 810 077 0(5) Enlargement-related expenditure 3 009 254 322 6 006 470 758 + 2 997 216 436
(6) Enlargement-adjusted total allocated expenditure = (4) - (5)
106 134 555 754 103 137 339 318 - 2 997 216 436
(7) UK correction original amount = (3) x (6) x 0.66 6 553 709 792 6 225 734 850 - 327 974 942(8) UK advantage 297 412 656 - 105 381 521 - 402 794 177(9) Core UK correction = (7) - (8) 6 256 297 136 6 331 116 370 + 74 819 234
(10) TOR windfall gains -23 555 354 -23 555 354 0(11) UK correction = (9) - (10) 6 279 852 489 6 354 671 724 + 74 819 235

EN 15 EN
The provisional amount of the 2008 UK correction (calculated according to ORD 2007) is EUR 74.8 million higher as compared to the provisional amount of the 2008 UK correction entered in the budget 2009 (calculated according to ORD 2000).
4.2. Entry in the PDAB 3/2009 of the 1st update of the 2007 UK correction and of the provisional amount of the 2008 UK correction
4.2.1. 2007 UK correction (chapter 15)
The amount of the 2007 UK correction to be budgeted in chapter 15 of the present PDAB 3/2009 is the amount of the 1st update of the 2007 UK correction (calculated according to ORD 2007) i.e. € 6 920 193 583, replacing the € 6 534 458 982 entered in the AB 5/2008 (calculated according to ORD 2000).
This amount is to be financed in line with the 2008 GNI bases, as agreed at the May 2008 meeting of the Advisory Committee on Own Resources (ACOR). The budgeting of this amount in chapter 15 is summarised below in euro currency:
Member State GNI 2008
as agreed at May 2008 ACOR
Financing key applied to the
correction
Belgium 346 246 900 000 318 810 944
Bulgaria 32 913 700 000 30 305 680
Czech Republic 132 949 300 000 122 414 646
Denmark 240 167 900 000 221 137 445
Germany 2 507 452 100 000 410 468 213
Estonia 16 113 800 000 14 836 973
Ireland 161 507 900 000 148 710 316
Greece 237 245 500 000 218 446 611
Spain 1 062 829 200 000 978 612 604
France 1 956 373 400 000 1 801 354 035
Italy 1 561 600 500 000 1 437 862 200
Cyprus 16 220 800 000 14 935 494
Latvia 22 592 800 000 20 802 589
Lithuania 30 959 100 000 28 505 959
Luxembourg 29 545 100 000 27 204 002
Hungary 97 445 900 000 89 724 469
Malta 5 476 300 000 5 042 368
Netherlands 580 990 000 000 95 107 670
Austria 280 982 600 000 45 996 662
Poland 336 162 600 000 309 525 705
Portugal 159 864 300 000 147 196 952
Romania 126 589 200 000 116 558 509
Slovenia 35 200 100 000 32 410 910
Slovak Republic 58 000 100 000 53 404 281
Finland 189 631 500 000 174 605 455
Sweden 343 391 100 000 56 212 891
United Kingdom 1 987 872 500 000 - 6 920 193 583 EU-27 12 556 324 200 000 0

EN 16 EN
4.2.2. 2008 UK correction (chapter 15)
The amount of the 2008 UK correction to be budgeted in chapter 15 of the present PDAB 3/2009 is the amount of the provisional amount of the 2008 UK correction (calculated according to ORD 2007) i.e. € 6 354 671 724, replacing the € 6 279 852 489 entered in the budget 2009 (calculated according to ORD 2000).
This amount is to be financed in line with the 2009 GNI bases, as agreed at the May 2008 ACOR meeting. The budgeting of this amount in chapter 15 is summarised below in euro currency:
Member State GNI 2009
as agreed at May 2008 ACOR
Financing key applied to the
correction
Belgium 358 996 500 000 289 752 905
Bulgaria 36 613 100 000 29 551 130
Czech Republic 149 821 900 000 120 924 106
Denmark 248 582 500 000 200 635 665
Germany 2 578 221 500 000 371 434 773
Estonia 17 914 700 000 14 459 295
Ireland 170 261 100 000 137 420 973
Greece 254 099 600 000 205 088 621
Spain 1 107 129 600 000 893 585 363
France 2 024 678 200 000 1 634 156 294
Italy 1 609 928 000 000 1 299 403 517
Cyprus 17 315 000 000 13 975 266
Latvia 25 210 300 000 20 347 713
Lithuania 34 193 500 000 27 598 224
Luxembourg 31 278 200 000 25 245 230
Hungary 104 927 100 000 84 688 659
Malta 5 782 900 000 4 667 489
Netherlands 609 167 600 000 87 760 508
Austria 291 554 700 000 42 003 200
Poland 378 540 100 000 305 526 916
Portugal 166 224 400 000 134 162 876
Romania 144 031 000 000 116 250 160
Slovenia 37 905 200 000 30 594 008
Slovak Republic 65 909 200 000 53 196 569
Finland 198 628 700 000 160 317 003
Sweden 360 426 200 000 51 925 261
United Kingdom 1 957 032 300 000 - 6 354 671 724
EU-27 12 984 373 100 000 0

EN 17 EN
4.2.3. Financial impact of ORD 2007 on contributions for the UK correction, per year and per Member State
The following table shows the detailed impact per year and per Member State in euro.
Impact of ORD 2007
on contributions for the 2007 UK correction
Impact of ORD 2007
on contributions for the 2008 UK correction
Cumulated impact
(budgeted in PDAB 3/2009) Member State
(1) (2) (3) = (1) + (2)
Belgium 17 770 661 3 411 520 21 182 181
Bulgaria 1 689 252 347 932 2 037 184
Czech Republic 6 823 445 1 423 748 8 247 193
Denmark 12 326 297 2 362 263 14 688 560
Germany 22 879 677 4 373 236 27 252 913
Estonia 827 020 170 242 997 262
Ireland 8 289 177 1 617 980 9 907 157
Greece 12 176 309 2 414 691 14 591 000
Spain 54 548 292 10 520 980 65 069 272
France 100 408 258 19 240 383 119 648 641
Italy 80 147 064 15 299 039 95 446 103
Cyprus 832 511 164 543 997 054
Latvia 1 159 546 239 572 1 399 118
Lithuania 1 588 935 324 938 1 913 873
Luxembourg 1 516 363 297 234 1 813 597
Hungary 5 001 281 997 116 5 998 397
Malta 281 064 54 955 336 019
Netherlands 5 301 343 1 033 283 6 334 626
Austria 2 563 874 494 541 3 058 415
Poland 17 253 097 3 597 241 20 850 338
Portugal 8 204 822 1 579 620 9 784 442
Romania 6 497 022 1 368 717 7 865 739
Slovenia 1 806 598 360 211 2 166 809
Slovak Republic 2 976 778 626 331 3 603 109
Finland 9 732 584 1 887 556 11 620 140
Sweden 3 133 331 611 363 3 744 694
United Kingdom - 385 734 601 - 74 819 235 - 460 553 836
Total 0 0 0
EN 18 EN
5. OTHER AMENDMENTS RELATED TO THE IMPLEMENTATION OF ORD 2007
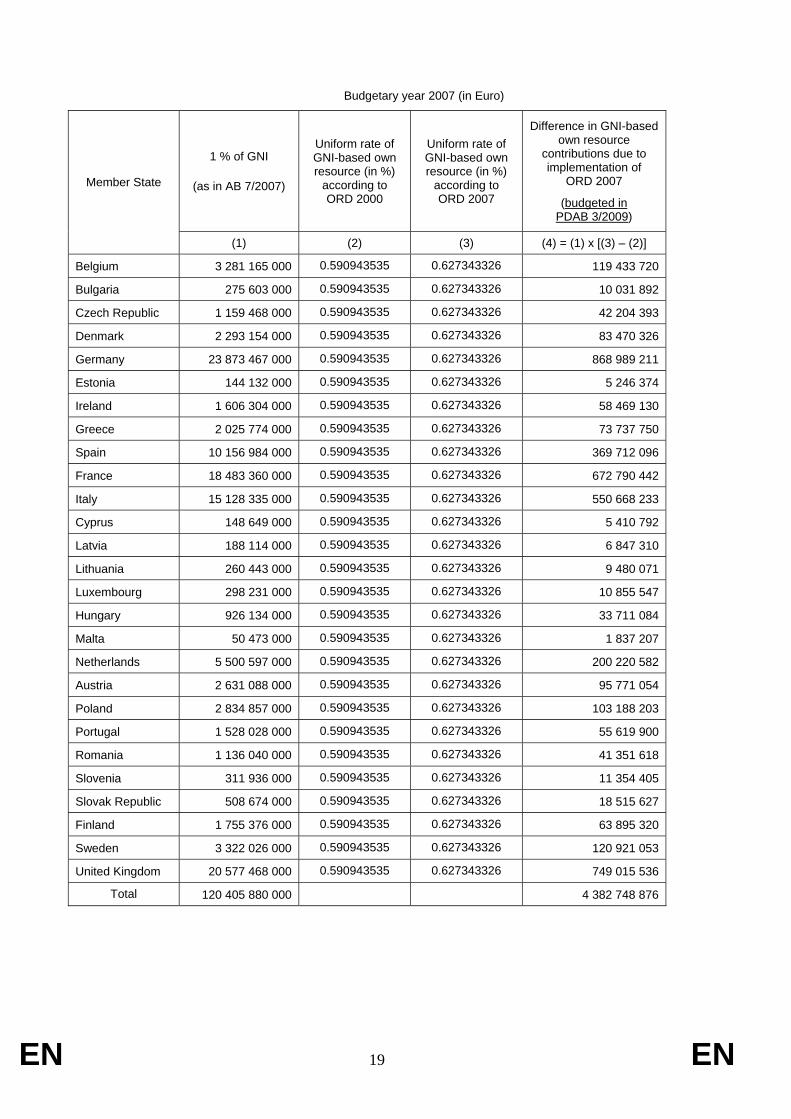
5.1. Impact on GNI-based own resource contributions of the new call rate of the VAT-based own resource
By implementing the new rules regarding the call rate of the VAT-based own resource, VAT-based own resource contributions for the budgetary years 2007, 2008 and 2009 decreased by respectively EUR 4 382 748 876, EUR 3 269 127 949 and EUR 4 313 990 408.
To respect the principle of equilibrium applicable to the budget of the European Union, the uniform rate to be applied to the sum of all Member States' GNI has to be recalculated, taken into account the total of all other revenue, including VAT-based own resource contributions.
The recalculated uniform rate for the GNI-based own resource for each year is fixed at:
- 0.627343326 % for the year 2007 (instead of 0.590943535 %).
Uniform rate to be applied on 1 % of GNI = (total expenditure – other revenue – total net amount of traditional own resources – VAT-based own resource contributions) / 1 % of GNI
Uniform rate = (113 845 815 415 – 7 642 610 077 – 16 532 900 000 – 14 134 480 075) / 120 405 880 000
Uniform rate = 0.627343326 % (rounded)
- 0.609728123 % for the year 2008 (instead of 0.583692415 %).
Uniform rate to be applied on 1 % of GNI = (total expenditure – other revenue – total net amount of traditional own resources – VAT-based own resource contributions) / 1 % of GNI
Uniform rate = (115 771 282 245 – 7 447 914 040 – 16 936 300 000 – 14 827 628 325) / 125 563 242 000
Uniform rate = 0.609728123 % (rounded)
- 0.617882067 % for the year 2009 (instead of 0.584657588 %).
Uniform rate to be applied on 1 % of GNI = (total expenditure – other revenue – total net amount of traditional own resources – VAT-based own resource contributions) / 1 % of GNI
Uniform rate = (116 096 062 329 – 1 359 722 489 – 19 206 100 000 – 15 302 126 900) / 129 843 731 000
Uniform rate = 0.617882067 % (rounded)
The revised GNI-based own resources contributions considering the new uniform rates are set out in the following tables:
EN 19 EN
Budgetary year 2007 (in Euro)
1 % of GNI
(as in AB 7/2007)
Uniform rate of GNI-based own resource (in %)
according to ORD 2000
Uniform rate of GNI-based own resource (in %)
according to ORD 2007
Difference in GNI-based own resource
contributions due to implementation of
ORD 2007
(budgeted in PDAB 3/2009)
Member State
(1) (2) (3) (4) = (1) x [(3) – (2)]
Belgium 3 281 165 000 0.590943535 0.627343326 119 433 720
Bulgaria 275 603 000 0.590943535 0.627343326 10 031 892
Czech Republic 1 159 468 000 0.590943535 0.627343326 42 204 393
Denmark 2 293 154 000 0.590943535 0.627343326 83 470 326
Germany 23 873 467 000 0.590943535 0.627343326 868 989 211
Estonia 144 132 000 0.590943535 0.627343326 5 246 374
Ireland 1 606 304 000 0.590943535 0.627343326 58 469 130
Greece 2 025 774 000 0.590943535 0.627343326 73 737 750
Spain 10 156 984 000 0.590943535 0.627343326 369 712 096
France 18 483 360 000 0.590943535 0.627343326 672 790 442
Italy 15 128 335 000 0.590943535 0.627343326 550 668 233
Cyprus 148 649 000 0.590943535 0.627343326 5 410 792
Latvia 188 114 000 0.590943535 0.627343326 6 847 310
Lithuania 260 443 000 0.590943535 0.627343326 9 480 071
Luxembourg 298 231 000 0.590943535 0.627343326 10 855 547
Hungary 926 134 000 0.590943535 0.627343326 33 711 084
Malta 50 473 000 0.590943535 0.627343326 1 837 207
Netherlands 5 500 597 000 0.590943535 0.627343326 200 220 582
Austria 2 631 088 000 0.590943535 0.627343326 95 771 054
Poland 2 834 857 000 0.590943535 0.627343326 103 188 203
Portugal 1 528 028 000 0.590943535 0.627343326 55 619 900
Romania 1 136 040 000 0.590943535 0.627343326 41 351 618
Slovenia 311 936 000 0.590943535 0.627343326 11 354 405
Slovak Republic 508 674 000 0.590943535 0.627343326 18 515 627
Finland 1 755 376 000 0.590943535 0.627343326 63 895 320
Sweden 3 322 026 000 0.590943535 0.627343326 120 921 053
United Kingdom 20 577 468 000 0.590943535 0.627343326 749 015 536
Total 120 405 880 000 4 382 748 876

EN 20 EN
Budgetary year 2008 (in Euro)
1 % of GNI
(as in AB 10/2008)
Uniform rate of GNI-based own resource (in %)
according to ORD 2000
Uniform rate of GNI-based own resource (in %)
according to ORD 2007
Difference in GNI-based own resource
contributions due to implementation of
ORD 2007
(budgeted in PDAB 3/2009)
Member State
(1) (2) (3) (4) = (1) x [(3) – (2)]
Belgium 3 462 469 000 0.583692415 0.609728123 90 147 833
Bulgaria 329 137 000 0.583692415 0.609728123 8 569 315
Czech Republic 1 329 493 000 0.583692415 0.609728123 34 614 292
Denmark 2 401 679 000 0.583692415 0.609728123 62 529 414
Germany 25 074 521 000 0.583692415 0.609728123 652 832 921
Estonia 161 138 000 0.583692415 0.609728123 4 195 342
Ireland 1 615 079 000 0.583692415 0.609728123 42 049 725
Greece 2 372 455 000 0.583692415 0.609728123 61 768 546
Spain 10 628 292 000 0.583692415 0.609728123 276 715 110
France 19 563 734 000 0.583692415 0.609728123 509 355 672
Italy 15 616 005 000 0.583692415 0.609728123 406 573 752
Cyprus 162 208 000 0.583692415 0.609728123 4 223 200
Latvia 225 928 000 0.583692415 0.609728123 5 882 195
Lithuania 309 591 000 0.583692415 0.609728123 8 060 421
Luxembourg 295 451 000 0.583692415 0.609728123 7 692 276
Hungary 974 459 000 0.583692415 0.609728123 25 370 730
Malta 54 763 000 0.583692415 0.609728123 1 425 793
Netherlands 5 809 900 000 0.583692415 0.609728123 151 264 862
Austria 2 809 826 000 0.583692415 0.609728123 73 155 810
Poland 3 361 626 000 0.583692415 0.609728123 87 522 314
Portugal 1 598 643 000 0.583692415 0.609728123 41 621 803
Romania 1 265 892 000 0.583692415 0.609728123 32 958 395
Slovenia 352 001 000 0.583692415 0.609728123 9 164 595
Slovak Republic 580 001 000 0.583692415 0.609728123 15 100 737
Finland 1 896 315 000 0.583692415 0.609728123 49 371 904
Sweden 3 433 911 000 0.583692415 0.609728123 89 404 305
United Kingdom 19 878 725 000 0.583692415 0.609728123 517 556 687
Total 125 563 242 000 3 269 127 949

EN 21 EN
Budgetary year 2009 (in Euro)
1 % of GNI
(as in B2009)
Uniform rate of GNI-based own resource (in %)
according to ORD 2000
Uniform rate of GNI-based own resource (in %)
according to ORD 2007
Difference in GNI-based own resource
contributions due to implementation of
ORD 2007
(budgeted in PDAB 3/2009)
Member State
(1) (2) (3) (4) = (1) x [(3) – (2)]
Belgium 3 589 965 000 0.584657588 0.617882067 119 274 720
Bulgaria 366 131 000 0.584657588 0.617882067 12 164 512
Czech Republic 1 498 219 000 0.584657588 0.617882067 49 777 547
Denmark 2 485 825 000 0.584657588 0.617882067 82 590 242
Germany 25 782 215 000 0.584657588 0.617882067 856 600 679
Estonia 179 147 000 0.584657588 0.617882067 5 952 066
Ireland 1 702 611 000 0.584657588 0.617882067 56 568 365
Greece 2 540 996 000 0.584657588 0.617882067 84 423 271
Spain 11 071 296 000 0.584657588 0.617882067 367 838 049
France 20 246 782 000 0.584657588 0.617882067 672 688 798
Italy 16 099 280 000 0.584657588 0.617882067 534 890 202
Cyprus 173 150 000 0.584657588 0.617882067 5 752 819
Latvia 252 103 000 0.584657588 0.617882067 8 375 991
Lithuania 341 935 000 0.584657588 0.617882067 11 360 613
Luxembourg 312 782 000 0.584657588 0.617882067 10 392 019
Hungary 1 049 271 000 0.584657588 0.617882067 34 861 483
Malta 57 829 000 0.584657588 0.617882067 1 921 338
Netherlands 6 091 676 000 0.584657588 0.617882067 202 392 765
Austria 2 915 547 000 0.584657588 0.617882067 96 867 532
Poland 3 785 401 000 0.584657588 0.617882067 125 767 979
Portugal 1 662 244 000 0.584657588 0.617882067 55 227 192
Romania 1 440 310 000 0.584657588 0.617882067 47 853 550
Slovenia 379 052 000 0.584657588 0.617882067 12 593 805
Slovak Republic 659 092 000 0.584657588 0.617882067 21 897 989
Finland 1 986 287 000 0.584657588 0.617882067 65 993 352
Sweden 3 604 262 000 0.584657588 0.617882067 119 749 730
United Kingdom 19 570 323 000 0.584657588 0.617882067 650 213 800
Total 129 843 731 000 4 313 990 408
EN 22 EN
5.2. Technical amendments related to the implementation of ORD 2007
In addition, this PDAB incorporates some technical amendments related to the adoption of ORD 2007 and its implementing Regulation No 1150/2000, as last modified by Council Regulation No 105/2009. The adjustments proposed with this PDAB and the new provisions regarding the own resources must be reflected in the 2009 budget structure.
A first adjustment concerns the elimination of the distinction between agricultural duties (budgeted under Article 100 of the revenue side of the budget) and import duties (budgeted under Article 120 of the revenue side of the budget). Following the implementation in EU legislation of the agreements concluded during the Uruguay Round, there is no longer any material difference between agricultural duties and customs duties. Thus the distinction between these duties was removed in ORD 2007 and consequently, the budget nomenclature has to be adapted accordingly. Therefore Chapter 10 will no longer be used. All customs duties, including those relating to the agricultural sector, will be budgeted under Chapter 12.
A new Article 160 is created in Chapter 1 to accommodate the gross reduction in the annual GNI-based contribution granted to the Netherlands and Sweden (see point 3 above).
Finally, a new Chapter in the budgetary nomenclature has to be foreseen for the adjustments relating to the implementation of ORD 2007 for the years 2007 and 2008, as Article 11 of ORD 2007 stipulates that once the Decision enters into force, it shall take effect on 1 January 2007 (see points 3, 4 and 5.1 above). As budgetary years 2007 & 2008 are closed, these adjustments have to be done in the budgetary year 2009. Therefore, these adjustments will be integrated in title 3 (surpluses, balances, and adjustments) of the budget, where a new Chapter 37 is created.
6. SUMMARY OF THE FINANCIAL IMPACT FROM THE IMPLEMENTATION OF ORD 2007
The following summary table shows per year and per Member State the global impact of the implementation of ORD 2007. This global impact is the result of the sum of the amendments related to the new uniform rate of call of the VAT-based own resource, to the gross reduction in the annual GNI-based contributions for the Netherlands and Sweden, to the revised calculation of the UK correction and to the GNI-based own resource.

EN 23 EN
Summary of the financial impact of ORD 2007 per year and per Member State (in Euro)
Financial impact Total own resources
contributions (as in B 2009) Cumulated Stemming from
2007 Stemming from
2008 Stemming from
2009
Total own resources
contributions (as in
PDAB 3/2009) Member State
(1) (2) (2.1) (2.2) (2.3) (3) = (1) + (2)
Belgium 4 879 194 220 307 587 546 92 022 301 112 567 560 102 997 685 5 186 781 766
Bulgaria 388 765 528 27 140 181 6 960 950 10 405 183 9 774 048 415 905 709
Czech Republic 1 487 971 609 111 310 532 29 284 870 42 029 967 39 995 695 1 599 282 141
Denmark 2 363 861 042 215 304 356 65 316 862 78 254 305 71 733 189 2 579 165 398
Germany 22 638 628 731 -2 670 639 256 - 841 729 552 - 894 624 975 - 934 284 729 19 967 989 475
Estonia 185 287 079 13 516 922 3 640 364 5 094 141 4 782 417 198 804 001
Ireland 1 669 669 068 137 081 066 40 570 678 51 058 348 45 452 040 1 806 750 134
Greece 2 374 101 579 194 000 118 51 165 299 75 001 678 67 833 141 2 568 101 697
Spain 10 616 530 915 888 088 113 256 536 576 335 997 833 295 553 704 11 504 619 028
France 18 125 130 437 1 645 316 822 474 239 437 621 912 854 549 164 531 19 770 447 259
Italy 14 795 799 284 1 417 616 366 439 105 547 510 309 325 468 201 494 16 213 415 650
Cyprus 193 019 777 13 504 743 3 754 452 5 127 967 4 622 324 206 524 520
Latvia 243 016 379 18 623 621 4 751 225 7 142 382 6 730 014 261 640 000
Lithuania 336 893 094 25 854 728 6 919 581 9 795 935 9 139 212 362 747 822
Luxembourg 281 776 666 25 222 587 7 532 469 9 340 249 8 349 869 306 999 253
Hungary 990 183 293 87 024 201 26 213 713 31 306 987 29 503 501 1 077 207 494
Malta 57 999 638 4 549 830 1 274 805 1 731 251 1 543 774 62 549 468
Netherlands 6 744 850 361 -3 213 541 537 -1 033 997 454 -1 074 715 216 -1 104 828 867 3 531 308 824
Austria 2 414 000 654 - 47 397 378 - 16 657 176 - 14 332 093 - 16 408 109 2 366 603 276
Poland 3 611 439 593 278 926 450 71 600 439 106 272 866 101 053 145 3 890 366 043
Portugal 1 537 333 167 133 506 822 38 593 649 50 538 749 44 374 424 1 670 839 989
Romania 1 400 182 024 114 664 791 31 856 500 41 112 922 41 695 369 1 514 846 815
Slovenia 420 567 965 29 125 589 7 878 617 11 127 993 10 118 979 449 693 554
Slovak Republic 645 296 480 51 979 056 13 847 981 18 941 768 19 189 307 697 275 536
Finland 1 761 262 512 167 737 586 48 561 743 61 791 599 57 384 244 1 929 000 098
Sweden 3 152 149 685 -1 075 245 869 - 352 871 868 - 355 021 823 - 367 352 178 2 076 903 816
United Kingdom 11 421 429 060 1 099 142 014 523 627 992 141 832 245 433 681 777 12 520 571 074
Total 114 736 339 840 0 0 0 0 114 736 339 840

EN 24 EN
7. SUMMARY OF THE FINANCING OF THE GENERAL BUDGET
The following summary table shows per Member State and by type of own resource the contributions according to this PDAB No 3/2009.

EN 25 EN
Traditional own resources (TOR) VAT and GNI-based own resources, including adjustments
Member State Net sugar sector levies
(75 %)
Net customs duties (75 %)
Total net traditional own resources (75
%)
p.m. Collection costs (25% of gross TOR)
VAT-based own resource
GNI-based own resource
Reduction in favour of
Netherlands and Sweden
United Kingdom correction
Adjustments relating to 2007
and 2008
Total 'national contributions'
Share in total 'national contributions'
(%)
Total own resources
according to PDAB No 3/2009
(1) (2) (3) = (1) + (2) (4) (5) (6) (7) (8) (9) (10) = (5) to (9) (11) (12) = (3) + (10) Belgium 6 900 000 1 983 300 000 1 990 200 000 663 400 000 461 090 400 2 218 174 996 22 973 604 289 752 905 204 589 861 3 196 581 766 3.35 5 186 781 766 Bulgaria 400 000 85 100 000 85 500 000 28 500 000 54 919 650 226 225 779 2 343 017 29 551 130 17 366 133 330 405 709 0.35 415 905 709 Czech Republic 3 400 000 243 600 000 247 000 000 82 333 333 224 732 850 925 722 653 9 587 695 120 924 106 71 314 837 1 352 282 141 1.42 1 599 282 141 Denmark 3 500 000 364 800 000 368 300 000 122 766 667 314 804 100 1 535 946 690 15 907 776 200 635 665 143 571 167 2 210 865 398 2.31 2 579 165 398 Germany 28 700 000 3 554 700 000 3 583 400 000 1 194 466 662 1 654 150 350 15 930 368 302 164 990 577 371 434 773 -1 736 354 527 16 384 589 475 17.15 19 967 989 475 Estonia 8 600 000 28 300 000 36 900 000 12 300 000 26 872 050 110 691 719 1 146 432 14 459 295 8 734 505 161 904 001 0.17 198 804 001 Ireland 0 259 400 000 259 400 000 86 466 667 255 391 650 1 052 012 805 10 895 680 137 420 973 91 629 026 1 547 350 134 1.62 1 806 750 134 Greece 1 400 000 268 000 000 269 400 000 89 800 000 381 149 400 1 570 035 862 16 260 837 205 088 621 126 166 977 2 298 701 697 2.41 2 568 101 697 Spain 6 500 000 1 439 700 000 1 446 200 000 482 066 667 1 660 694 400 6 840 755 260 70 849 596 893 585 363 592 534 409 10 058 419 028 10.53 11 504 619 028 France 32 700 000 1 424 400 000 1 457 100 000 485 700 000 2 943 348 000 12 510 123 519 129 567 155 1 634 156 294 1 096 152 291 18 313 347 259 19.17 19 770 447 259 Italy 4 700 000 1 909 800 000 1 914 500 000 638 166 667 1 999 615 200 9 947 456 409 103 025 652 1 299 403 517 949 414 872 14 298 915 650 14.97 16 213 415 650 Cyprus 3 800 000 45 800 000 49 600 000 16 533 334 25 972 500 106 986 280 1 108 055 13 975 266 8 882 419 156 924 520 0.16 206 524 520 Latvia 800 000 33 400 000 34 200 000 11 400 000 37 815 450 155 769 923 1 613 307 20 347 713 11 893 607 227 440 000 0.24 261 640 000 Lithuania 900 000 52 900 000 53 800 000 17 933 333 51 170 400 211 275 505 2 188 177 27 598 224 16 715 516 308 947 822 0.32 362 747 822 Luxembourg 0 22 700 000 22 700 000 7 566 667 46 917 300 193 262 389 2 001 616 25 245 230 16 872 718 284 299 253 0.30 306 999 253 Hungary 2 900 000 135 800 000 138 700 000 46 233 334 141 257 700 648 325 735 6 714 700 84 688 659 57 520 700 938 507 494 0.98 1 077 207 494 Malta 200 000 9 900 000 10 100 000 3 366 667 8 674 350 35 731 502 370 071 4 667 489 3 006 056 52 449 468 0.05 62 549 468 Netherlands 7 300 000 2 108 700 000 2 116 000 000 705 333 333 299 178 200 3 763 937 360 - 626 854 574 87 760 508 -2 108 712 670 1 415 308 824 1.48 3 531 308 824 Austria 3 200 000 242 300 000 245 500 000 81 833 334 289 967 400 1 801 464 208 18 657 737 42 003 200 - 30 989 269 2 121 103 276 2.22 2 366 603 276 Poland 14 000 000 462 000 000 476 000 000 158 666 667 567 810 150 2 338 931 396 24 224 276 305 526 916 177 873 305 3 414 366 043 3.57 3 890 366 043 Portugal 200 000 160 300 000 160 500 000 53 500 000 249 336 600 1 027 070 759 10 637 356 134 162 876 89 132 398 1 510 339 989 1.58 1 670 839 989 Romania 1 100 000 244 400 000 245 500 000 81 833 334 180 968 400 889 941 720 9 217 113 116 250 160 72 969 422 1 269 346 815 1.33 1 514 846 815 Slovenia 0 106 600 000 106 600 000 35 533 333 56 857 800 234 209 433 2 425 703 30 594 008 19 006 610 343 093 554 0.36 449 693 554 Slovakia 2 300 000 115 900 000 118 200 000 39 400 000 81 630 300 407 241 128 4 217 790 53 196 569 32 789 749 579 075 536 0.61 697 275 536 Finland 800 000 166 700 000 167 500 000 55 833 334 250 827 600 1 227 291 118 12 711 035 160 317 003 110 353 342 1 761 500 098 1.84 1 929 000 098 Sweden 2 800 000 493 300 000 496 100 000 165 366 667 151 782 000 2 227 008 856 - 142 018 610 51 925 261 - 707 893 691 1 580 803 816 1.65 2 076 903 816 United Kingdom 9 700 000 3 097 500 000 3 107 200 000 1 035 733 333 2 885 192 700 12 092 151 634 125 238 227 -6 354 671 724 665 460 237 9 413 371 074 9.85 12 520 571 074
Total 146 800 000 19 059 300 000 19 206 100 000 6 402 033 333 15 302 126 900 80 228 112 940 0 0 0 95 530 239 840 100.00 114 736 339 840