Emulsions, Microemulsions and Foams (Part IV) · Emulsions, Microemulsions and Foams (Part IV) Dr....
22
NPTEL Chemical Engineering Interfacial Engineering Module 6: Lecture 4 Joint Initiative of IITs and IISc Funded by MHRD 1/22 Emulsions, Microemulsions and Foams (Part IV) Dr. Pallab Ghosh Associate Professor Department of Chemical Engineering IIT Guwahati, Guwahati–781039 India
Transcript of Emulsions, Microemulsions and Foams (Part IV) · Emulsions, Microemulsions and Foams (Part IV) Dr....
NPTEL Chemical Engineering Interfacial Engineering Module 6: Lecture 4
Joint Initiative of IITs and IISc Funded by MHRD 1/22
Emulsions, Microemulsions and Foams
(Part IV)
Dr. Pallab Ghosh
Associate Professor
Department of Chemical Engineering
IIT Guwahati, Guwahati–781039
India

NPTEL Chemical Engineering Interfacial Engineering Module 6: Lecture 4
Joint Initiative of IITs and IISc Funded by MHRD 2/22
Table of Contents
Section/Subsection Page No. 6.4.1 Microemulsions 3
6.4.2 Winsor’s classification of microemulsions 4
6.4.3 Stability of microemulsions 11
Exercise 21
Suggested reading 22
NPTEL Chemical Engineering Interfacial Engineering Module 6: Lecture 4
Joint Initiative of IITs and IISc Funded by MHRD 3/22
6.4.1 Microemulsions
Microemulsions are thermodynamically stable mixtures of oil and water. The
stability is due to the presence of fairly large amounts of surfactants. They are
often transparent or translucent. Some microemulsions exhibit strong light
scattering and the transmitted light is typically reddish while the reflected light is
whitish.
Oil and water are not molecularly dispersed in a microemulsion, but are coarsely
mixed, i.e., oil and water are present in domains spanning over several
nanometers. As a consequence, microemulsions contain huge oil-water interfacial
areas. The interfacial tension is quite low in microemulsion systems (well below
1 mN/m).
Microemulsions were introduced in 1940s by Schulman and co-workers (see
Hoar and Schulman, 1943). They observed that isotropic and optically transparent
dispersions of oil-in-water or water-in-oil formed spontaneously in the presence
of a surfactant and a cosurfactant such as an aliphatic alcohol.
In many liquidliquid systems, the interfacial tension did not reach ultra-low
values even though the critical micelle concentration (CMC) was reached.
However, addition of the cosurfactant solved this problem. These systems were
investigated over a period of two decades by several experimental techniques
such as X-ray diffraction, ultracentrifugation, light scattering, electron
microscopy, viscometry and nuclear magnetic resonance to characterize the size,
shape and dynamics of the dispersed phase (see Kumar and Mittal, 1999).
The terms hydrophilic oleomicelles and oleophilic hydromicelles were originally
used by Hoar and Schulman (1943) for the droplets depending on whether the
continuous medium was non-aqueous or aqueous, respectively. The term
‘microemulsion’ was coined 16 years later (Schulman et al., 1959). Apart from
the classical ternary (i.e., water-oil-surfactant) and quaternary (i.e., water-oil-
surfactant-alcohol) microemulsions, many quinary systems (water-oil-surfactant-
alcohol-salt) are also well known.
Microemulsions can have various textures apart from simply oil droplets in water
and water droplets in oil, such as random bicontinuous mixtures, ordered droplets
NPTEL Chemical Engineering Interfacial Engineering Module 6: Lecture 4
Joint Initiative of IITs and IISc Funded by MHRD 4/22
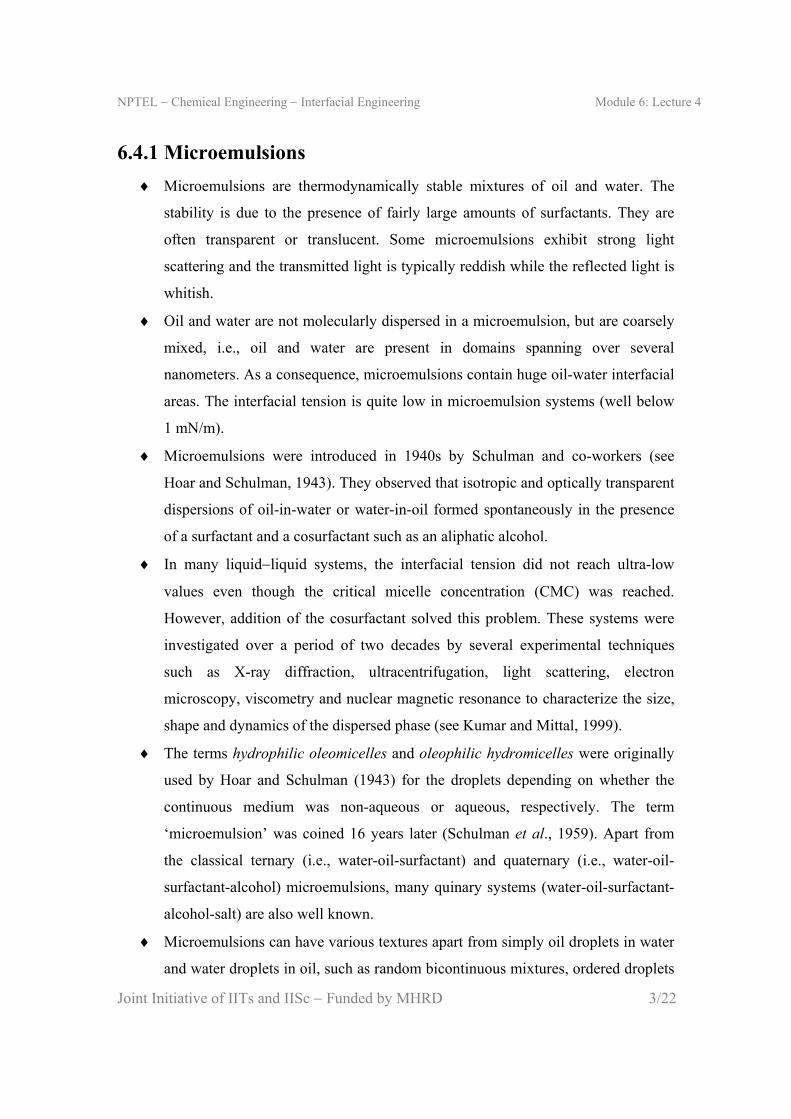
or lamellar mixtures with a wide range of phase equilibria among them and with
excess oil and water phases. The bicontinuous structure in microemulsions was
proposed by L. E. Scriven (1976), as shown in Fig. 6.4.1.
Fig. 6.4.1 Bicontinuous structure.
In this structure, the domains are connected in three dimensions. It is an important
structure in the microemulsion systems. In addition to the bicontinuous phases,
lamellar phases have also been observed.
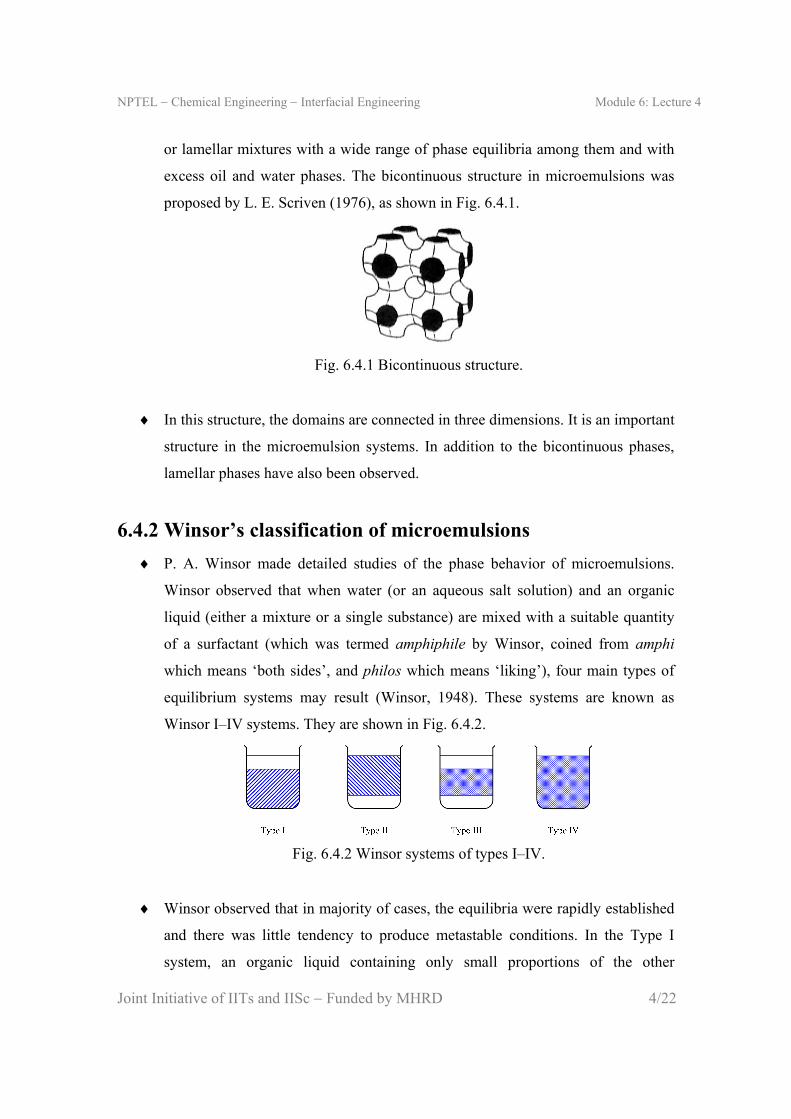
6.4.2 Winsor’s classification of microemulsions
P. A. Winsor made detailed studies of the phase behavior of microemulsions.
Winsor observed that when water (or an aqueous salt solution) and an organic
liquid (either a mixture or a single substance) are mixed with a suitable quantity
of a surfactant (which was termed amphiphile by Winsor, coined from amphi
which means ‘both sides’, and philos which means ‘liking’), four main types of
equilibrium systems may result (Winsor, 1948). These systems are known as
Winsor I–IV systems. They are shown in Fig. 6.4.2.
Fig. 6.4.2 Winsor systems of types I–IV.
Winsor observed that in majority of cases, the equilibria were rapidly established
and there was little tendency to produce metastable conditions. In the Type I
system, an organic liquid containing only small proportions of the other

NPTEL Chemical Engineering Interfacial Engineering Module 6: Lecture 4
Joint Initiative of IITs and IISc Funded by MHRD 5/22
components of the system exists in equilibrium with an aqueous solution of the
surfactant containing solubilized organic liquid. In other words, an oil-in-water
microemulsion coexists with the excess oil.
In the Type II system, water (or an aqueous salt solution) containing only small
proportions of the other components of the system exists in equilibrium with a
solution of the surfactant in the organic liquid containing solubilized water.
Therefore, in this type, a water-in-oil microemulsion coexists with excess water.
In the Type III system, free organic and aqueous phases are in equilibrium with a
third solubilized phase containing the three components. Therefore, the
microemulsion coexists with both the phases. The microemulsion phase in this
equilibrium is also known as middle phase or midrange microemulsion.
The Type IV system contains no free organic or aqueous layers and the three
components are mutually solubilized.
Solubilization of the organic liquid in Type I systems can be increased by: (i) a
reduction in the relative proportion of water, (ii) the addition of an oil-soluble
component to the organic liquid that is capable of hydrogen bonding and/or that
has greater solvent attraction for the surfactant than the organic liquid has (e.g.,
fatty acids, amines and alcohols), (iii) increasing the lipophilic nature of the
surfactant, and (iv) addition of an inorganic salt to the aqueous solution. If
sufficient amount of surfactant is present, and if any of the above methods is
applied progressively, first a Type IV system is produced, and ultimately in case
of the techniques (ii), (iii) and (iv), a Type II system is produced.
On the other hand, solubilization of water in the Type II systems can be increased
by the methods which, in some respects, are complementary to the four methods
described above for the increase of solubilization of organic liquid in Type I
systems. These techniques are: (i) a reduction in the relative proportion of the
organic liquid, (ii) addition of a water-soluble organic compound which is
capable of hydrogen bonding to water (e.g., ethylene glycol and ethanol), (iii) a
reduction in the lipophilic nature of the surfactant, and (iv) addition of a less
hydrophilic oil-soluble compound to the oil. If sufficient amount of surfactant is
present, and if any of the above methods is applied progressively, first a Type IV

NPTEL Chemical Engineering Interfacial Engineering Module 6: Lecture 4
Joint Initiative of IITs and IISc Funded by MHRD 6/22
system is produced, and ultimately in case of techniques (ii), (iii) and (iv), a Type
I system is produced.
If the surfactant is an alkali metal salt, a rise of temperature usually diminishes
solubilization of the organic liquid in Type I systems and increases the
solubilization of water in Type II systems. Winsor (1948) observed that there are
exceptions to this behavior, particularly for the Type I systems.
In Type IV systems, although no free oil and water phases exist, phase changes
can occur in certain cases by the addition of an alcohol and an amine in gradually
increasing quantities. According to the observations of Winsor, some of these
stages are: a clear sol (which he designated as 1S ), a heterogeneous mixture of sol
1S and gel G , a homogeneous gel G , a heterogeneous mixture of G and a
second sol 2S , and a clear sol 2S .
A schematic representation of the passage from Type I to Type II system via the
1S , G and 2S stages of a Type IV system is illustrated in Fig. 6.4.3.
Fig. 6.4.3 Transition from Type I system to the Type II system via the various stages of a Type IV system.
In some transitions, the gel state does not appear, and in some cases the sol and
gel regions may not be distinguishable.
To account for the interactions between oil, water and the surfactant, a ratio, wR ,
(termed Winsor ratio) is defined as,
solvent attraction between surfactant and oil in the solubilized phase
solvent attraction between surfactant and water in the solubilized phasewR (6.4.1)
The Winsor ratio can be expressed in terms of the molecular interaction energies
per unit area according to the regular solution theory. If we represent the oil,

NPTEL Chemical Engineering Interfacial Engineering Module 6: Lecture 4
Joint Initiative of IITs and IISc Funded by MHRD 7/22
water and surfactant by O , W and C , respectively, then the interaction between
the surfactant and the aqueous phase is given by,
CW HCW LCW (6.4.2)
where HCW is the interaction between the hydrophilic group of the surfactant
and water, and LCW is the interaction between the lipophilic group and water. It
is likely that LCW HCW .
In a similar manner, the interaction between the surfactant and the oil phase is
given by,
CO HCO LCO (6.4.3)
where HCO is the interaction between the hydrophilic group of the surfactant
and oil, and LCO is the interaction between the lipophilic group and water. It is
likely that HCO LCO .
The Winsor ratio was originally defined as,
COw
CWR
(6.4.4)
This expression has been modified to incorporate the effects of the interactions
between the hydrophilic groups of the surfactant molecules HH , lipophilic
groups of the surfactant molecules LL , oil molecules OO and water
molecules WW .
The modified definition for wR is,
CO OO LLw
CW WW HHR
(6.4.5)
The interface will be convex towards water if 1wR and the converse will
happen if 1wR . Therefore, 1wR on the extreme left of the diagram and
1wR on the extreme right.

NPTEL Chemical Engineering Interfacial Engineering Module 6: Lecture 4
Joint Initiative of IITs and IISc Funded by MHRD 8/22
All the methods, (i)(iv), discussed earlier for passing from left to right in Fig.
6.4.3 are likely to increase the wR . Conversely, the methods (i)(iv) for passing
from right to left in Fig. 6.4.3 are expected to decrease wR .
In view of the symmetric character of the figure, 1wR corresponds to the center
of the diagram, i.e., to the middle of the Type IV region. This region contains
liquid crystalline phases. 1wR indicates a zero-curvature interface, which is
possible with a lamellar liquid crystal structure, a Schwarz-type zero-curvature
interface, or a transient and fluctuating combination of the 1S and 2S structures.
It is now well known that the middle-phase microemulsions exhibit bicontinuous
structures, which are not too far from the transient mixture of 1S and 2S swollen
micelles proposed by Winsor (1948).
The Winsor I, II and III phase equilibria are also designated by 2 , 3 and 2 ,
where the bar below or above the 2 indicates that the microemulsion is the lower
(water-rich) phase and the upper (oil-rich) phase, respectively.
The microemulsion composition corresponding to Winsor III is characterized by
very low interfacial tension and maximum solubilization of oil and water for a
given quantity of surfactant. The system is said to be optimized or balanced.
Thus, there have been intensive investigations on the three-phase region. The
transition from Type I and Type II systems to the Type III system can be
achieved by varying several parameters such as temperature, salinity, pH,
oil/water ratio and molecular geometry (see Kumar and Mittal, 1999).
Let us consider the phase behavior in microemulsions in the simplest ternary case
involving ionic surfactants. The notations used by Winsor have been followed by
many scientists who rediscovered and extended Winsor’s work in the 1970s and
1980s. The Type I, Type II and Type III phase behavior are shown in Fig. 6.4.4.
In the Type I phase behavior, a 1S type of aqueous micellar system (and its
extension to an oil-in-water microemulsion) is in equilibrium with oil.

NPTEL Chemical Engineering Interfacial Engineering Module 6: Lecture 4
Joint Initiative of IITs and IISc Funded by MHRD 9/22
Fig. 6.4.4 Schematic phase diagrams for Winsor systems.
A Winsor Type II phase behavior corresponds to the opposite situation in which
an inverse micellar organic solution, 2S (which eventually solubilizes water), is
in equilibrium with the aqueous phase. The slope of the tie line in the polyphasic
region indicates the partitioning of the surfactant, which is related to
physicochemical formulation.
Between Types I and II, one could expect a situation in which the tie lines would
be horizontal indicating that the surfactant partitions equally in both phases. Such
a case may occur with alcohols, but not generally for ionic surfactants, for which
the Type III phase behavior is exhibited. In this case, the polyphasic region
contains a three phase zone surrounded by three two phase zones.
Systems whose compositions lie in the three-phase zone separate into a
surfactant-rich phase that is in the middle of the diagram at the boundary of the
microemulsion single-phase zone (shaded region), and two excess phases, which
are essentially pure aqueous phase and pure oil. This microemulsion phase is
called middle phase because it appears between the oil and water phases when
prepared in a test tube due to its intermediate density. It is in equilibrium with

NPTEL Chemical Engineering Interfacial Engineering Module 6: Lecture 4
Joint Initiative of IITs and IISc Funded by MHRD 10/22
both excess phases. These three phase systems have been extensively studied due
to their importance in enhanced oil recovery.
In mixtures of oil, water and surfactant, it is common to have lyotropic liquid
crystalline phases (Winsor, 1968). Therefore, isotropic microemulsion phases co-
exist with the liquid crystalline phases in the phase diagram for many ternary
systems. The phase diagram for the sodium caprylatedecanolwater system is
shown in Fig. 6.4.5.
Fig. 6.4.5 Phase diagram for the three-component system: sodium caprylatedecanolwater at 293 K. L1: homogeneous isotropic solutions in water; L2: homogeneous isotropic solutions in decanol; B, C, D, E and F: homogeneous mesomorphous phases; g: solid crystalline sodium caprylate with fiber structure; 1–10: three-phase triangles (Winsor, 1968) (reproduced by permission from The
American Chemical Society, © 1968).
The X-ray diffraction measurements of the individual phases have revealed that:
(i) the phase E is the middle phase having hexagonal structure, (ii) the phase F is
the inverse middle phase having the inverse fibrous hexagonal structure, (iii) the
phase D is the lamellar phase, and (iv) mobile isotropic micellar phases exist in
regions L1 1S and L2 2S .

NPTEL Chemical Engineering Interfacial Engineering Module 6: Lecture 4
Joint Initiative of IITs and IISc Funded by MHRD 11/22
It is possible that the region B represents an extension of region D, rather than a
new phase. The phase indicated by C represents a viscous dispersion of the
orderly phase, D, in the isotropic phase, 1S . This is in accord with the opacity of
C, which contrasts the translucency and lack of any preferred orientation of the
liquid crystalline phases. The lack of orientation in the dispersion is a
consequence of the averaging effect of Brownian movements over the period of
exposure.
6.4.3 Stability of microemulsions
Although the name ‘microemulsion’ suggests an emulsion with extremely small
droplets, microemulsions possess thermodynamic stability in contrast to the
regular emulsions, which are only kinetically stable.
The analysis of thermodynamic stability of the microemulsions needs to account
for the entropy of dispersion of the droplets in the continuous medium, the free
energy of formation of the interface between the two phases, the interaction
among the droplets, and the distribution at equilibrium of the species between the
two phases and the interface.
Let us assume that a large interface has been spontaneously created between the
two immiscible phases. The surfactant and cosurfactant are accumulated at the
interface. This accumulation has two important effects: (i) it decreases the
interfacial tension of the wateroil interface from about 50 mN/m to well-below 1
mN/m, and (ii) because of the large decrease in the concentrations of surfactant
and cosurfactant in the two bulk phases, the molecules of surfactant and
cosurfactant have a small chemical potential, which decreases the free energy of
the system. The latter phenomenon is known as dilution effect (Ruckenstein,
1978).
In addition to these effects, an ionic surfactant generates a charge on the interface
and therefore inter-droplet repulsive double layer forces develop. If the free
energy change due to the dilution effect is sufficiently negative to overcome the

NPTEL Chemical Engineering Interfacial Engineering Module 6: Lecture 4
Joint Initiative of IITs and IISc Funded by MHRD 12/22
positive free energy change due to the surface tension, the overall free energy
change is negative and spontaneous dispersion occurs.
The formation of droplets occurs at constant temperature and constant volume.
Therefore, the main quantity regarding the thermodynamic stability is the
Helmholtz free energy of formation F per unit volume of microemulsion.
This is defined as the difference between the free energy of a microemulsion
having droplets of a given radius and the free energy of the same system when the
droplets are very large. For a microemulsion, which is stable from a
thermodynamic point of view, the free energy of formation has to be negative.
The size of the droplets is the radius for which the free energy of formation has a
minimum value.
Suppose that the surfactant is soluble only in water, which is the continuous
phase, and the cosurfactant is soluble only in oil. ix represents the mole fraction
when the radius of the droplets is very large, where the subscripts 1, 2,3 and 4i
refer to the surfactant, co-surfactant, water and oil, respectively.
The bulk chemical potential, i , of one molecule (ion) can be expressed as,
0 lni i i ikT x (6.4.6)
where 0i is the standard chemical potential, k is Boltzmann’s constant, T is
temperature and i is the activity coefficient.
The free energy of the generated droplet surface is equal to the product of the
surface area per unit volume, 3 v dR (where v is the volume fraction of the
droplets and dR is the radius of the droplets, which is assumed to be uniform for
the sake of simplicity), and the specific interfacial free energy.
The specific interfacial free energy is equal to i i , where i is the
surface excess (the tilde indicates the state of the system after the formation of the
droplets of radius, dR , and adsorption of surfactant and co-surfactant at the
surface of the droplets, i.e., the final state). The surface excess quantities for
water and oil are assumed zero. Because of thermodynamic equilibrium, the

NPTEL Chemical Engineering Interfacial Engineering Module 6: Lecture 4
Joint Initiative of IITs and IISc Funded by MHRD 13/22
chemical potentials are the same for the molecules (ions), which are adsorbed,
and for those in the bulk solution.
If im is the total number of molecules (ions) of species i per unit volume of
microemulsion, then the number of molecules remaining in bulk solutions after
adsorption is, 3i v d im R . The corresponding Gibbs free energy is,
3i v d i im R .
Now, the change in Helmholtz free energy due to the formation of the interface
and dilution from the mole fractions, ix , before adsorption to the final mole
fractions, ix , is given by,
4
1 21
31v
d i i i v vid
F m p p pR
(6.4.7)
where 1p is the pressure in the continuous phase, 2 1 2 dp p R is the
pressure in the dispersed phase and p is the pressure when the droplets are very
large.
Since the pressures are different, the standard chemical potentials are not the
same in the initial and final states. Neglecting the compressibility, we can write,
0 0i i i jv p p (6.4.8)
where iv is the volume of a molecule of species i . If the component is in the
continuous phase then 1j , and 2j if the component is in the dispersed
phase.
Since the surfactant is soluble only in water (which is the continuous phase) and
the cosurfactant is soluble only in oil, it can be shown that Eq. (6.4.8) becomes,
41
1
2 1 1 3 3 1 2 2 4 4 2
3ln 1v i i
d i vid i i
v
xF kT m p
R x
p v m v m p v m v m p
(6.4.9)
If 2 2 4 4 vv m v m and 1 1 3 3 1 vv m v m , the last four terms of Eq. (6.4.9)
cancel and we obtain

NPTEL Chemical Engineering Interfacial Engineering Module 6: Lecture 4
Joint Initiative of IITs and IISc Funded by MHRD 14/22
4
1
3lnv i i
d iid i i
xF kT m
R x
(6.4.10)
For nonionic surfactants in dilute systems, the ratio of activity coefficients
approaches unity. For dilute ionic surfactant systems, however, the ratios i i
are unity only if the ionic strengths after and before adsorption are sufficiently
close.
In Eq. (6.4.10), the terms on the right hand side corresponding to 1i and 2i
have negative contributions to dF , and the terms corresponding to 3i and
4i provide positive contributions to dF . The former is larger in absolute
value than the latter. Hence, the dilution effect has a negative contribution to
dF .
The equation for the interfacial tension incorporating the effect of electrostatic
double layer is given below. Since the interface is charged, the interfacial tension,
, depends on the surface potential and the surface charge density. These
contributions are contained in i .
From the Gibbs adsorption equation under isothermal conditions, we have,
i id d (6.4.11)
Integrating at constant chemical potentials for all the species with the exception
of the surfactant and co-surfactant, we obtain,
0 i id (6.4.12)
where 0 is the surfactant-free interfacial tension for water and oil, and the
second term on the right of Eq. (6.4.12) represents the effect of adsorption of the
surfactant and co-surfactant on surface tension.
Equation (6.4.12) can be expressed in terms of the surface potential and
surface charge density as,
d (6.4.13)
where the term, d , is the free energy of the electrostatic double layer. It can
be written as,

NPTEL Chemical Engineering Interfacial Engineering Module 6: Lecture 4
Joint Initiative of IITs and IISc Funded by MHRD 15/22
1 2d (6.4.14)
where the quantity, 1 , is the specific free energy of non-overlapping double
layers and 2 is the specific free energy of overlapping double layers. The former
is negative whereas the latter is positive.
Therefore, from Eqs. (6.4.13) and (6.4.14), we can write,
1 2 (6.4.15)
The total free energy of formation per unit volume of microemulsion, F , is
given by,
d eF F F (6.4.16)
where eF is the free energy change due to the entropy generated by dispersion
of the droplets in the continuous phase. Apparently, 0eF . From the minimum
of F with respect to dR , the radius of the stable droplets ˆdR can be obtained.
The terms, and ix , which appear in the expression for dF are dependent on
the radius. Let us examine the qualitative behavior of various contributions to
dF . The surface tension, , decreases when dR increases because the bulk
concentrations and hence the specific adsorptions become larger with increasing
dR . The free energy term, 3 0v dR as dR , and 3 v dR as
0dR . For sufficiently large values of dR , may become negative. Of course,
the corresponding radii do not represent equilibrium states but stages of the
kinetic process. The free energy of the non-overlapping double layers,
13 v dR , is a negative quantity. This term approaches zero for dR , and
tends to for 0dR . The free energy change due to the double layer
interactions has a positive contribution to dF . Its variation with dR is similar to
that described before.
Let us now consider the effect of dR on the mole fraction terms ix . As 0dR ,
infinite dilution occurs, and dR corresponds to no dilution. This is apparent,
because for low values of dR , almost the entire amount of surfactant is adsorbed

NPTEL Chemical Engineering Interfacial Engineering Module 6: Lecture 4
Joint Initiative of IITs and IISc Funded by MHRD 16/22
and 1 dx R . The terms due to dilution approach ln dR as 0dR , and they
approach zero as dR . The free energy change due to the generation of
entropy, eF , tends to for 0dR , and to zero for dR .
From this analysis, it is evident that some of the free energy contributions are
positive and decay with increasing dR , while others are negative and decrease in
absolute value when dR increases. A negative minimum of the free energy of
formation of a microemulsion for a particular radius can be obtained if the total
negative contribution is sufficiently large in absolute value. This is the radius of
the thermodynamically stable microemulsion.
Let us consider a system composed of water, oil and a nonionic surfactant. It is
assumed, for the sake of simplicity, that the surfactant is soluble only in oil which
is also the continuous phase, and that the system is dilute. It is known that
microemulsions can sometimes form without a cosurfactant for this kind of
systems.
For this case,
3 1ln ln
1v
s o ed
x xF m kT m kT F
R x x
(6.4.17)
where sm and om are the number of molecules of surfactant and oil,
respectively, per unit volume of microemulsion, and x and x are the mole
fractions of surfactant after and before adsorption.
The equilibrium radius, ˆdR , is obtained by putting the condition, 0dd F dR .
Performing this differentiation we obtain,
2ˆ
30
ˆd
v e
dd R
d F
dRR
(6.4.18)
Because eF is a small quantity which becomes less negative as dR increases,
the derivative, e dd F dR , is positive. Therefore, the interfacial tension, , has
to be a small but positive quantity at thermodynamic equilibrium.

NPTEL Chemical Engineering Interfacial Engineering Module 6: Lecture 4
Joint Initiative of IITs and IISc Funded by MHRD 17/22
Assuming further that s s sK c (where sK is a constant and sc is surfactant
concentration per unit volume of oil), we have,
0 s skK Tc (6.4.19)
A material balance for surfactant gives,
ˆ3 1v d s s v sR c m (6.4.20)
Substituting the value of s in Eq. (6.4.20) and rearranging we get,
31
ˆ
ss
v sv
d
mc
K
R
(6.4.21)
Neglecting the derivative of eF in Eq. (6.4.18), substituting from Eq. (6.4.19)
and sc from Eq. (6.4.21) into Eq. (6.4.18) and simplifying, we obtain,
0
0
3ˆ1
v sd
s s v
KR
m kK T
(6.4.22)
For the case, 0 1s s vm kK T , Eq. (6.4.22) reduces to,
03ˆ vd
sR
m kT
(6.4.23)
Equation (6.4.23) gives the equilibrium radius of the microemulsion droplets. It
has a simple physical interpretation because it can be obtained by writing the
proportionality between the translational energy of the surfactant molecules and
the product of interfacial tension and the surface area per unit volume.
For the high surface concentrations, the gas-like model implied in the equation,
s s sK c is not adequate. However, it permits a simple illustration of the main
features of the theory.
It can be shown that because of the dilution effect, ˆ 0dRF . Example 6.4.1
illustrates the calculation of ˆdR .

NPTEL Chemical Engineering Interfacial Engineering Module 6: Lecture 4
Joint Initiative of IITs and IISc Funded by MHRD 18/22
Example 6.4.1: Calculate the equilibrium radius of the microemulsion droplets at 298 K
if the interfacial tension between oil and water is 50 mN/m, volume fraction of the
droplets is 0.03, and the surfactant concentration in the microemulsion is 100 mol/m3.
Solution: From the given data, we have,
0 0.05 N/m, 0.03v , 23 25100 6.023 10 6.023 10sm m3 and 298T K
Therefore, from Eq. (6.4.23) we get,
8025 23
3 3 0.03 0.05ˆ 1.8 106.023 10 1.38 10 298
vd
sR
m kT
m = 18 nm
Another droplet-model of microemulsion is based upon the bending free energy
of the interface. As discussed in Section 6.4.2, the surfactants and cosurfactants
not only lower the interfacial tension, but their molecular structures affect the
curvature of the interface as well. This determines whether a W/O type or an O/W
type of microemulsion would be formed.
Each composition of the interface has its own curvature at which the interface
forms most easily and thus has the lowest interfacial tension. The curvature free
energy is expressed by the equation given by Helfrich (1973).
21 2 0 1 22b
c GA
E H H H H H dA
(6.4.24)
where dA represents the intrinsic area element, b represents the bending
modulus, 0H represents the spontaneous curvature and G represents the
Gaussian curvature modulus. 1H and 2H are the two principal curvatures. cE is
the free energy contribution due to the bending of a flat interface of area A .
For a single droplet of radius dR , cE is given by,
208 1 4c b d GE H R (6.4.25)
where the quantity, 4 G , may be viewed as the free energy needed (or furnished
if 0G ) to detach a suitable area of flat interface and close it around the
droplet.

NPTEL Chemical Engineering Interfacial Engineering Module 6: Lecture 4
Joint Initiative of IITs and IISc Funded by MHRD 19/22
In Winsor Type I and Type II systems, the tension of the droplet surface, , can
be related to the interfacial tension, , by the relation (see Kumar and Mittal,
1999),
22
02
0
2 4 2
2
dR
c b b Gd
d d d d
E HR d
A R R R R
(6.4.26)
From Eq. (6.4.26), it follows that the minimum of the tension of a droplet is
found at,
0
min
21
2b
d b G
H
R
(6.4.27)
Therefore, Eq. (6.4.27) gives the radius of the droplet that minimizes the
curvature free energy.
The values of b and G are of the order of kT . The entropy of mixing tends to
maximize the number of droplets, and this effect can lead to a smaller average
value of dR than that predicted by Eq. (6.4.27). The system may increase its
configurational entropy by exploring a distribution of radius around that given by
Eq. (6.4.27).
The sign of 0H determines whether O/W or W/O microemulsion would be
formed. The sign and magnitude of 0H are determined by two competing forces
at the droplet interface: (i) the hydrocarbon chains tend to bend the interface
around the water-side and has a positive contribution to 0H , and (ii) the
counterions of the ionic head-groups have a negative contribution to 0H .
The origin of these contributions can be explained as follows. The hydrocarbon
chains are rather closely packed occupying ~0.25 nm2 per chain. They repel one
another sideways, and as a result tend to bend the interface around the water side.
The counterions of the ionic head-groups, on the other hand, repel one another
sideways and thus tend to curve the interface around the oil side. The bulky polar
groups of nonionic surfactants have a similar effect.

NPTEL Chemical Engineering Interfacial Engineering Module 6: Lecture 4
Joint Initiative of IITs and IISc Funded by MHRD 20/22
At low salt contribution, the contribution of the electrostatic double layer to 0H
is the dominant factor and an oil-in-water microemulsion (i.e., Winsor Type I) is
formed. If the salt concentration is increased, 0H becomes less and less negative
and the average droplet radius increases. At a certain salt concentration, the
contributions of the electrostatic double layer and the hydrocarbon chains to 0H
balance each other, and a structure with zero mean curvature is expected at this
point.
Several structures such as flat monolayers and cubic phases can exist here. Since
fluctuations around the mean curvature are expected to be present, it is not easy to
predict the stable structure. If the salt concentration is increased even further, 0H
becomes positive and a water-in-oil microemulsion (i.e., Winsor Type II system)
becomes stable.
The average size of the droplets decreases with increasing salt concentration. A
similar phase inversion can be observed in systems where a co-surfactant is
present. In such a situation, the increase in the concentration of the co-surfactant
leads to an increase in adsorption of the co-surfactant molecules at the interface.
This results in an increase in surface pressure, which has a positive contribution
to 0H .

NPTEL Chemical Engineering Interfacial Engineering Module 6: Lecture 4
Joint Initiative of IITs and IISc Funded by MHRD 21/22
Exercise
Exercise 6.4.1: Show that when the radius of the droplet in microemulsion approaches
zero (i.e., infinite dilution limit), 1 dx R , where 1x is the mole fraction of surfactant
after the formation of the droplets of radius, dR , and adsorption of surfactant and
cosurfactant at the surface of the droplets.
Exercise 6.4.2: The interaction energy between surfactant and oil, surfactant and water,
oil molecules, water molecules, hydrophilic groups of surfactant molecules, and
lipophilic groups of surfactant molecules are 142, 42, 15, 27, 5 and 13 J/mol,
respectively. Comment on the shape of the oil–water interface.
Exercise 6.4.3: In a microemulsion system, the interfacial bending modulus is
215.35 10 J, the Gaussian curvature modulus is 214.1 10 J, and the bending force is
138.23 10 N. Calculate the radius of microemulsion droplet that minimizes the
curvature free energy. Hint: bending force is 0bH .
Exercise 6.4.4: Answer the following questions clearly.
1) What is the main difference between an emulsion and a microemulsion?
2) Explain the properties of Winsor Type I – IV microemulsion systems.
3) Explain how the solubilization of organic liquid in a Type I microemulsion and
solubilization of water in a Type II microemulsion can be increased.
4) Define Winsor ratio and explain its significance.
5) Draw typical ternary phase diagrams for Winsor Type I, II and III systems and
explain the main features of these diagrams.
6) Explain briefly the factors which impart thermodynamic stability to
microemulsions. What is equilibrium droplet radius? How would you calculate it?
7) What is dilution effect? Explain its significance in microemulsion stability.
8) Explain the significance of interfacial bending free energy in stabilizing a
microemulsion.

NPTEL Chemical Engineering Interfacial Engineering Module 6: Lecture 4
Joint Initiative of IITs and IISc Funded by MHRD 22/22
Suggested reading
Textbooks
A. W. Adamson and A. P. Gast, Physical Chemistry of Surfaces, John Wiley,
New York, 1997, Chapter 14.
J. C. Berg, An Introduction to Interfaces and Colloids: The Bridge to
Nanoscience, World Scientific, Singapore, 2010, Chapter 9.
P. Ghosh, Colloid and Interface Science, PHI Learning, New Delhi, 2009,
Chapter 9.
Reference books
P. Kumar and K. L. Mittal (Editors), Handbook of Microemulsion Science and
Technology, Marcel Dekker, New York, 1999, Chapters 1–3 & 8.
Journal articles
E. Ruckenstein, Chem. Phys. Lett., 57, 517 (1978).
J. H. Schulman, W. Stoeckenius, and L. M. Prince, J. Phys. Chem., 63, 1677
(1959).
L. E. Scriven, Nature, 263, 123 (1976).
P. A. Winsor, Chem. Rev., 68, 1 (1968).
P. A. Winsor, Trans. Faraday Soc., 44, 376 (1948).
T. P. Hoar and J. H. Schulman, Nature, 152, 102 (1943).
W. Helfrich, Z. Naturforsch, 28c, 693 (1973).


![Hierarchically Porous Carbon Foams from Pickering High Internal Phase Emulsions · · 2017-02-03Hierarchically Porous Carbon Foams from Pickering High Internal ... [3, 4], electromagnetic](https://static.fdocuments.us/doc/165x107/5ad95b5f7f8b9a865b8ea9a6/hierarchically-porous-carbon-foams-from-pickering-high-internal-phase-emulsions.jpg)