Empowering Michigan: Eleventh Annual Benchmarking Report ... · 2016 was spent at the URC or one of...
41
April 10, 2018 © Anderson Economic Group, LLC, 2018 Permission to reproduce in entirety granted with proper citation. All other rights reserved. Anderson Economic Group, LLC East Lansing | Chicago | New York | Istanbul 1555 Watertower Place, Suite 100 East Lansing, Michigan 48823 Telephone: (517) 333-6984 www.AndersonEconomicGroup.com Empowering Michigan Eleventh Annual Benchmarking Report of Michigan’s University Research Corridor Commissioned by Michigan’s University Research Corridor Michigan State University University of Michigan Wayne State University Prepared by: Traci Giroux, Consultant
Transcript of Empowering Michigan: Eleventh Annual Benchmarking Report ... · 2016 was spent at the URC or one of...
April 10, 2018
© Anderson Economic Group, LLC, 2018Permission to reproduce in entirety granted with proper citation. All other rights reserved.
Anderson Economic Group, LLCEast Lansing | Chicago | New York | Istanbul
1555 Watertower Place, Suite 100East Lansing, Michigan 48823Telephone: (517) 333-6984
www.AndersonEconomicGroup.com
Empowering Michigan
Eleventh Annual Benchmarking Report of Michigan’s University Research Corridor
Commissioned by Michigan’s University Research Corridor
Michigan State UniversityUniversity of MichiganWayne State University
Prepared by:Traci Giroux, Consultant

Table of Contents
Anderson Economic Group, LLC TOC - 1
I. Executive Summary............................................... 1Purpose of Report .................................................................. 1Overview of Approach .......................................................... 1Peer University Clusters ........................................................ 2Key Benchmarks ................................................................... 3Summary of Findings ............................................................ 3About Anderson Economic Group ........................................ 6
II. Michigan’s University Research Corridor........... 7
III. Education and Talent Benchmarks..................... 8Student Enrollment ............................................................... 8Total Degrees Granted .......................................................... 9Degrees by Program ............................................................ 10High-Tech and High-Demand Degrees ............................... 12
IV. Research and Development Benchmarks.......... 15
V. Technology Commercialization Benchmarks ..... 20
VI. Innovation Power Rankings ............................. 23Components of Innovation Power Rankings ...................... 23Rankings by Category ......................................................... 24
Appendix A. Methodology .....................................A-1Benchmarking Metrics ......................................................A-1Innovation Power Rankings ..............................................A-5
Appendix B. Additional Data and Tables ..............B-1Education and Talent Benchmarks ................................... B-1Research and Development ............................................... B-4
Appendix C. About Anderson Economic Group... C-1Anderson Economic Group ............................................... C-1Authors .............................................................................. C-2Contributors ...................................................................... C-2

Executive Summary
I.Executive Summary
The University Research Corridor (URC) is an alliance of Michigan’s three largest higher education institutions: Michigan State University, the University of Michigan, and Wayne State University. The purpose of this alliance is to accelerate economic development in Michigan by educating students, attracting talented workers to Michigan, supporting innovation, and encouraging the transfer of technology to the private sector.
In 2007, the presidents of the URC universities hired Anderson Economic Group (AEG) to perform the first annual independent analysis of the URC’s economic impact and to benchmark its performance against peer universities across the nation. Since the inception of these reports, Anderson Economic Group has typically published the economic impact and benchmarking analyses in the same report. Starting this year, we will publish these analyses in two separate reports. This report is the 11th in the series that contains the benchmarking analysis.
PURPOSE OF REPORT The purpose of this report is to compare the URC’s collective performance to peer university clusters nationwide on their contributions to their state’s economy as premier research universities. We benchmark the URC’s performance along the following measures:
• Talent;• Research and development (R&D) expenditures; and• Technology transfer activities.
OVERVIEW OF APPROACH
Using data from institutional and public sources, we aggregate student enrollment, degrees awarded, R&D expenditures, and technology transfer activity metrics at each URC university and those of peer clusters.
Talent. The URC universities are talent producers, attracting students to the state and preparing graduates to contribute to vital industries—including high-tech, medical, and other high-demand industries. Many of these students remain in the state after graduation, and many alumni become business owners and employees in Michigan. This attraction and retention of talent is vital to assuring innovation and development happens at companies in Michigan. Information about the URC’s current students can be found in “Education and Talent Benchmarks” on page 8.
Research and Development (R&D). Each of the URC universities secures billions of dollars to support its faculty, staff, and students in research and development each year. These activities are vital to advancing technologies in both science and engineering (S&E) and non-S&E fields, and promoting basic,
Anderson Economic Group, LLC 1

Executive Summary
applied, and development research. The majority of the URC universities’ R&D activities are funded by the federal government, which brings new economic activity into the state. See “Research and Development Benchmarks” on page 15 for details about the URC’s R&D activities.
Technology Commercialization. R&D investment at the URC often leads to new inventions or start-up companies, supporting growth and dynamism in Michigan’s economy. Patents and licensing activity bring in money to the universities and the state, and attract investment in new technologies. Start-ups that thrive and grow bring jobs and higher incomes to Michigan residents. See “Technology Commercialization Benchmarks” on page 20 for details about the URC’s technology commercialization activities.
PEER UNIVERSITY CLUSTERS
FIGURE 1. Comparison Peer University Clusters
We compare the URC to seven groups of top research universities from across the country. Each cluster includes three universities from the same geographical
Northern California �� University of California, San
Francisco
�� University of California, Berkeley
�� Stanford University
North Carolina �� Duke University
�� University of North Carolina (Chapel Hill)
�� North Carolina State University
Texasb �� University of Texas (Austin)
�� Texas A&M University (College Station, and Commerce)
�� Rice University
Pennsylvania �� Pennsylvania State University
(all campuses except the Penn State World Campus)
�� University of Pittsburgh (all campuses)
�� Carnegie Mellon University
Massachusetts �� Harvard University
�� Massachusetts Institute of Technology (MIT)
�� Boston Universitya
Illinois �� University of Chicago
�� University of Illinois at Urbana-Champaign
�� Northwestern University
Source: Anderson Economic Group, LLC ——————————————————— a. In previous reports, we included Tufts in the Massachusetts cluster. Starting in 2013, Boston University has replaced Tufts University in the
Massachusetts cluster. b. The Texas cluster has been included as a peer cluster starting in 2013.
Michigan’s URC �� Michigan State University
�� University of Michigan (all campuses)
�� Wayne State University
Southern California �� University of California, Los
Angeles
�� University of California, San Diego
�� University of Southern California
Anderson Economic Group, LLC 2
Executive Summary
area. We selected these peer clusters based on academic quality, research intensity, and size of the institutions. Figure 1 on page 2 shows the universities that make up the URC and each of the peer clusters.
KEY BENCHMARKS The URC universities’ combined performance is summarized in Table 1. The remainder of this executive summary and the report lay out these results in greater detail.
SUMMARY OF FINDINGS
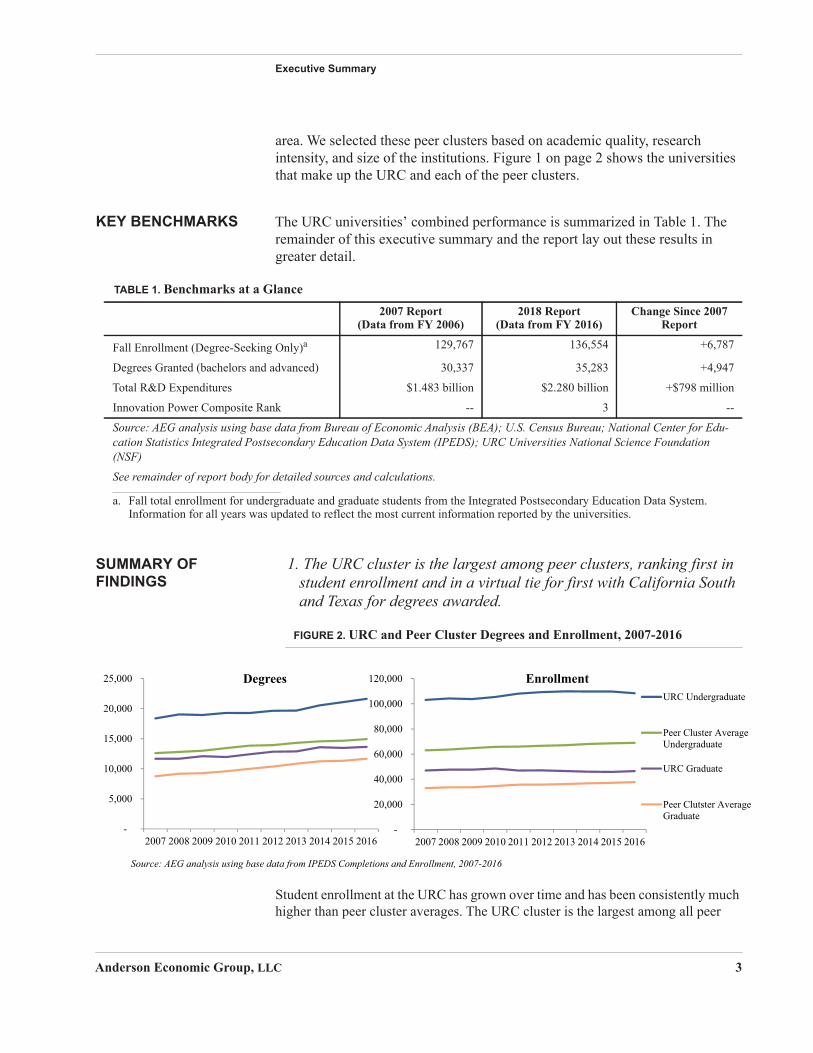
1. The URC cluster is the largest among peer clusters, ranking first in student enrollment and in a virtual tie for first with California South and Texas for degrees awarded.
FIGURE 2. URC and Peer Cluster Degrees and Enrollment, 2007-2016
Student enrollment at the URC has grown over time and has been consistently much higher than peer cluster averages. The URC cluster is the largest among all peer
TABLE 1. Benchmarks at a Glance2007 Report
(Data from FY 2006)2018 Report
(Data from FY 2016)Change Since 2007
Report
Fall Enrollment (Degree-Seeking Only)a 129,767 136,554 +6,787
Degrees Granted (bachelors and advanced) 30,337 35,283 +4,947
Total R&D Expenditures $1.483 billion $2.280 billion +$798 million
Innovation Power Composite Rank -- 3 --
Source: AEG analysis using base data from Bureau of Economic Analysis (BEA); U.S. Census Bureau; National Center for Edu-cation Statistics Integrated Postsecondary Education Data System (IPEDS); URC Universities National Science Foundation (NSF)
See remainder of report body for detailed sources and calculations.
a. Fall total enrollment for undergraduate and graduate students from the Integrated Postsecondary Education Data System. Information for all years was updated to reflect the most current information reported by the universities.
-
5,000
10,000
15,000
20,000
25,000
2007 2008 2009 2010 2011 2012 2013 2014 2015 2016
Degrees
-
20,000
40,000
60,000
80,000
100,000
120,000
2007 2008 2009 2010 2011 2012 2013 2014 2015 2016
EnrollmentURC Undergraduate
Peer Cluster AverageUndergraduate
URC Graduate
Peer Clutster AverageGraduate
Source: AEG analysis using base data from IPEDS Completions and Enrollment, 2007-2016
Anderson Economic Group, LLC 3
Executive Summary
clusters, ranking first in enrollment. In 2016, the URC enrolled nearly 155,000 students, and awarded over 35,000 in undergraduate and graduate degrees. Figure 2 on page 3 shows the growth in student enrollment and degrees conferred since 2007. The California South and Texas clusters both also awarded just over 35,000 degrees in 2016.
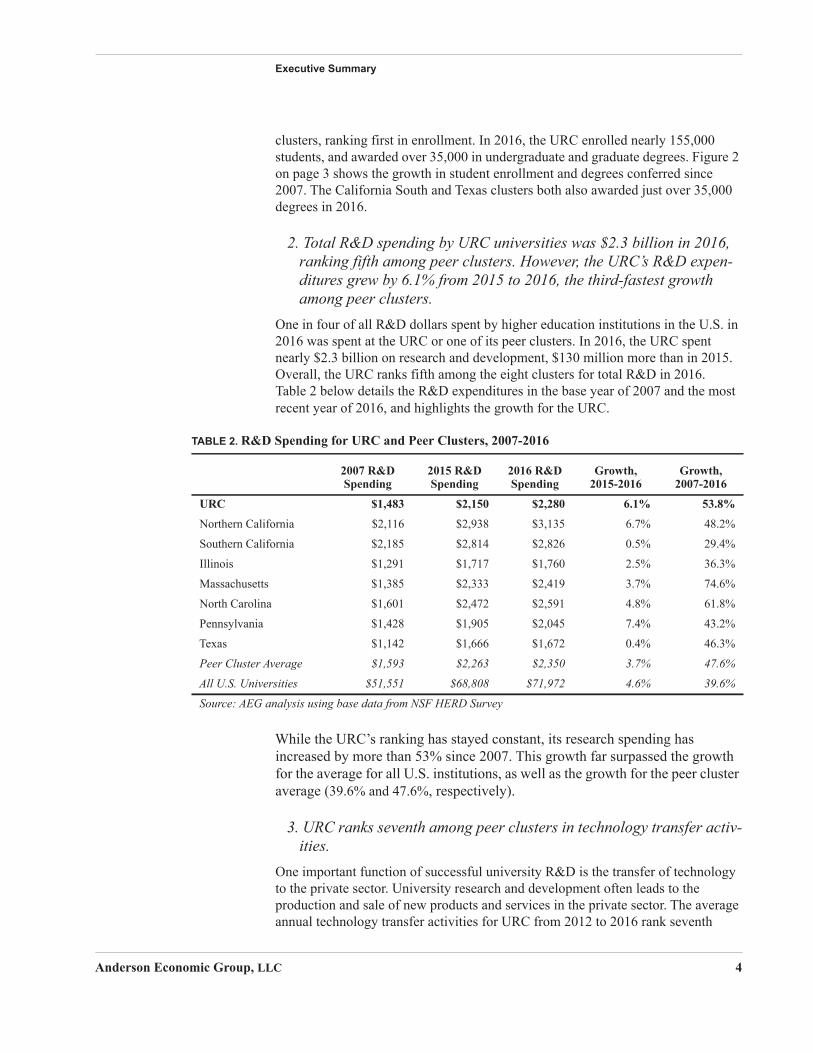
2. Total R&D spending by URC universities was $2.3 billion in 2016, ranking fifth among peer clusters. However, the URC’s R&D expen-ditures grew by 6.1% from 2015 to 2016, the third-fastest growth among peer clusters.
One in four of all R&D dollars spent by higher education institutions in the U.S. in 2016 was spent at the URC or one of its peer clusters. In 2016, the URC spent nearly $2.3 billion on research and development, $130 million more than in 2015. Overall, the URC ranks fifth among the eight clusters for total R&D in 2016. Table 2 below details the R&D expenditures in the base year of 2007 and the most recent year of 2016, and highlights the growth for the URC.
While the URC’s ranking has stayed constant, its research spending has increased by more than 53% since 2007. This growth far surpassed the growth for the average for all U.S. institutions, as well as the growth for the peer cluster average (39.6% and 47.6%, respectively).
3. URC ranks seventh among peer clusters in technology transfer activ-ities.
One important function of successful university R&D is the transfer of technology to the private sector. University research and development often leads to the production and sale of new products and services in the private sector. The average annual technology transfer activities for URC from 2012 to 2016 rank seventh
TABLE 2. R&D Spending for URC and Peer Clusters, 2007-2016
2007 R&D Spending
2015 R&D Spending
2016 R&D Spending
Growth, 2015-2016
Growth, 2007-2016
URC $1,483 $2,150 $2,280 6.1% 53.8%
Northern California $2,116 $2,938 $3,135 6.7% 48.2%
Southern California $2,185 $2,814 $2,826 0.5% 29.4%
Illinois $1,291 $1,717 $1,760 2.5% 36.3%
Massachusetts $1,385 $2,333 $2,419 3.7% 74.6%
North Carolina $1,601 $2,472 $2,591 4.8% 61.8%
Pennsylvania $1,428 $1,905 $2,045 7.4% 43.2%
Texas $1,142 $1,666 $1,672 0.4% 46.3%
Peer Cluster Average $1,593 $2,263 $2,350 3.7% 47.6%
All U.S. Universities $51,551 $68,808 $71,972 4.6% 39.6%
Source: AEG analysis using base data from NSF HERD Survey
Anderson Economic Group, LLC 4

Executive Summary
among peer clusters. In 2016, the URC surpassed its five-year averages for all measures for patent and licensing activity except licensing revenue. The URC supported 20 start-ups in 2016, ranking seventh among peer clusters. Table 3 on page 5 details the average annual technology transfer activities for URC and its peer clusters.
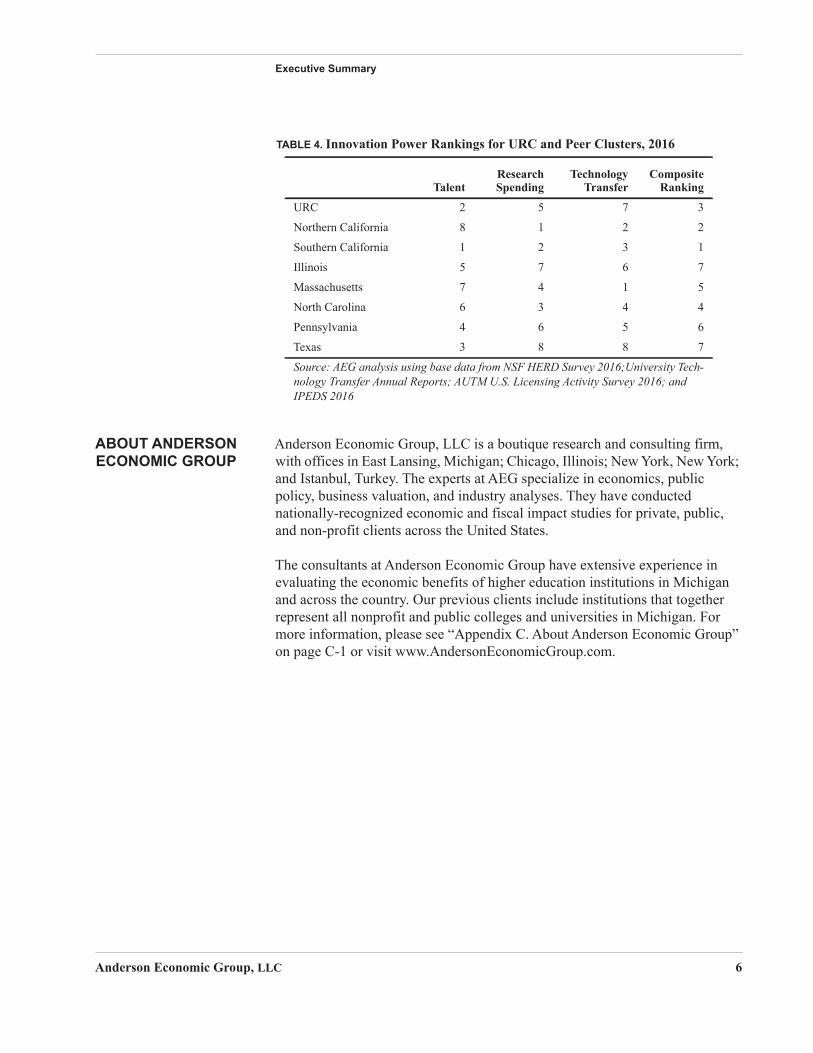
4. The URC ranks third among the peer clusters on our overall Innova-tion Power Ranking.
We compare the URC to peer clusters using our Innovation Power Rankings, a composite ranking system to benchmark the URC and its peer clusters on their overall innovation activity. We define innovation activity as performance on the following three components:
1. Talent;2. Research spending; and3. Technology transfer activity.
We rank the university clusters on each of these components separately, and then aggregate them to determine the overall composite ranking for innovation activity. These rankings capture how each cluster contributes to their regional economy through activities that foster innovation and growth. Overall, the URC ranks third out of the eight clusters on our Innovation Power Rankings. We summarize the rankings by component, as well as the composite rankings for each cluster, in Table 4 on page 6.
TABLE 3. Average Annual Technology Transfer Activities for URC and Peer Clusters, 2012-2016
Licenses/ Options
Licensing Revenue Start-Ups
Patents Awarded
Invention Disclosures
URC 203 $35.7 16 195 621
Northern California 183 $130.9 43a 313 871
Southern California 137 $69.0 43a 269 984
Illinois 115 $195.6 23 186 510
Massachusetts 194 $97.3 37 394 1,281
North Carolina 306 $41.4 27 135 654
Pennsylvania 266 $25.5 32 139 711
Texas 103 $30.2 15 138 513
Source: AEG analysis using base data from NSF HERD 2016; University Technology Transfer Annual Reports; AUTM U.S. Licensing Activity Survey 2016; IPEDS 2016_________________________
a. Numbers differ by amount smaller than rounding threshold.
Anderson Economic Group, LLC 5
Executive Summary
ABOUT ANDERSON ECONOMIC GROUP
Anderson Economic Group, LLC is a boutique research and consulting firm, with offices in East Lansing, Michigan; Chicago, Illinois; New York, New York; and Istanbul, Turkey. The experts at AEG specialize in economics, public policy, business valuation, and industry analyses. They have conducted nationally-recognized economic and fiscal impact studies for private, public, and non-profit clients across the United States.
The consultants at Anderson Economic Group have extensive experience in evaluating the economic benefits of higher education institutions in Michigan and across the country. Our previous clients include institutions that together represent all nonprofit and public colleges and universities in Michigan. For more information, please see “Appendix C. About Anderson Economic Group” on page C-1 or visit www.AndersonEconomicGroup.com.
TABLE 4. Innovation Power Rankings for URC and Peer Clusters, 2016
TalentResearchSpending
TechnologyTransfer
CompositeRanking
URC 2 5 7 3
Northern California 8 1 2 2
Southern California 1 2 3 1
Illinois 5 7 6 7
Massachusetts 7 4 1 5
North Carolina 6 3 4 4
Pennsylvania 4 6 5 6
Texas 3 8 8 7
Source: AEG analysis using base data from NSF HERD Survey 2016;University Tech-nology Transfer Annual Reports; AUTM U.S. Licensing Activity Survey 2016; and IPEDS 2016
Anderson Economic Group, LLC 6

Michigan’s University Research Corridor
Anderson Economic Group, LLC 7
II.Michigan’s University Research Corridor
Michigan's University Research Corridor (URC) is one of the nation's top academic research clusters and the leading engine for innovation in Michigan and the Great Lakes region. An alliance of Michigan State University, the University of Michigan, and Wayne State University, the URC universities are focused on increasing economic prosperity and connecting Michigan to the world. The URC universities educate Michigan residents, attract talented workers to Michigan, support innovation, and encourage the transfer of new technology to the private sector. The URC universities have main campuses in East Lansing, Ann Arbor, Flint, Dearborn, and Detroit, and their reach extends to all areas of the state. Each URC university has research, teaching locations, and partner hospitals located throughout the state, as shown on Map 1 below.
MAP 1.URC Presence in Michigan, 2016
URC Locations
AgBioResearch Centers
_̂ Campus Locations
^ MSU Extensions District Offices
/ MSU Extensions
v Partner Hospitals
0 50 100Miles
¯
Source: AEG map using base data from URC Universities
Education and Talent Benchmarks
III.Education and Talent Benchmarks
Each year, we compare the URC to peer innovation clusters on metrics related to education, talent, research, and innovation. In this section, we compare URC universities to seven peer clusters on student enrollment and the quantity and nature of degrees awarded, measures of the talent generated and supported at each of these clusters.
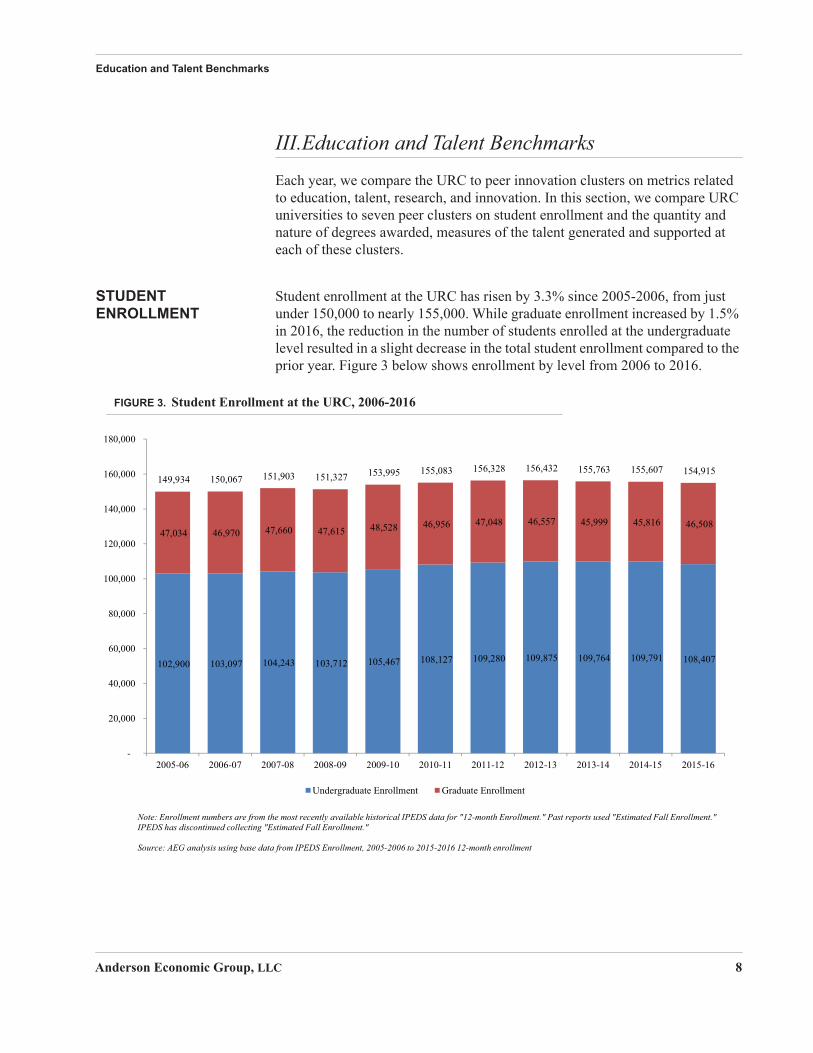
STUDENT ENROLLMENT
Student enrollment at the URC has risen by 3.3% since 2005-2006, from just under 150,000 to nearly 155,000. While graduate enrollment increased by 1.5% in 2016, the reduction in the number of students enrolled at the undergraduate level resulted in a slight decrease in the total student enrollment compared to the prior year. Figure 3 below shows enrollment by level from 2006 to 2016.
FIGURE 3. Student Enrollment at the URC, 2006-2016
102,900 103,097 104,243 103,712 105,467 108,127 109,280 109,875 109,764 109,791 108,407
47,034 46,970 47,660 47,615 48,528 46,956 47,048 46,557 45,999 45,816 46,508
149,934 150,067 151,903 151,327 153,995 155,083 156,328 156,432 155,763 155,607 154,915
-
20,000
40,000
60,000
80,000
100,000
120,000
140,000
160,000
180,000
2005-06 2006-07 2007-08 2008-09 2009-10 2010-11 2011-12 2012-13 2013-14 2014-15 2015-16
Undergraduate Enrollment Graduate Enrollment
Note: Enrollment numbers are from the most recently available historical IPEDS data for "12-month Enrollment." Past reports used "Estimated Fall Enrollment." IPEDS has discontinued collecting "Estimated Fall Enrollment."
Source: AEG analysis using base data from IPEDS Enrollment, 2005-2006 to 2015-2016 12-month enrollment
Anderson Economic Group, LLC 8
Education and Talent Benchmarks
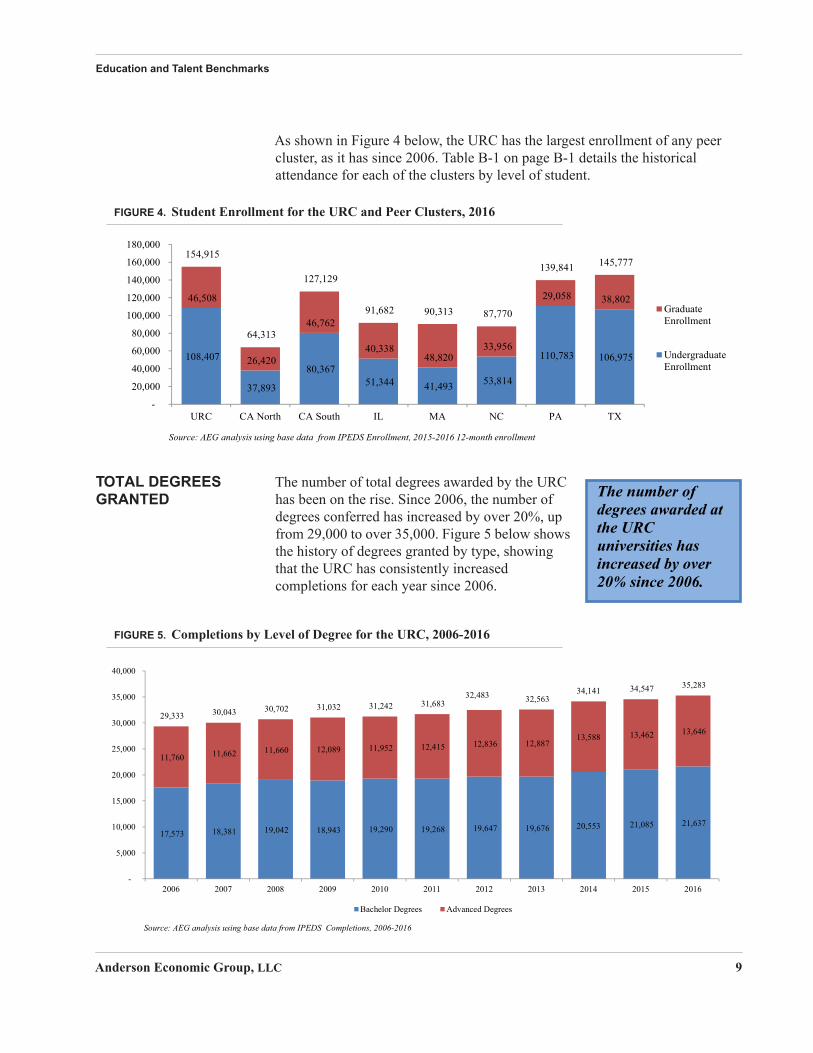
As shown in Figure 4 below, the URC has the largest enrollment of any peer cluster, as it has since 2006. Table B-1 on page B-1 details the historical attendance for each of the clusters by level of student.
FIGURE 4. Student Enrollment for the URC and Peer Clusters, 2016
TOTAL DEGREES GRANTED
The number of total degrees awarded by the URC has been on the rise. Since 2006, the number of degrees conferred has increased by over 20%, up from 29,000 to over 35,000. Figure 5 below shows the history of degrees granted by type, showing that the URC has consistently increased completions for each year since 2006.
FIGURE 5. Completions by Level of Degree for the URC, 2006-2016
108,407
37,893
80,367 51,344 41,493 53,814
110,783 106,975
46,508
26,420
46,762
40,338 48,820
33,956
29,058 38,802
154,915
64,313
127,129
91,682 90,313 87,770
139,841 145,777
-
20,000
40,000
60,000
80,000
100,000
120,000
140,000
160,000
180,000
URC CA North CA South IL MA NC PA TX
GraduateEnrollment
UndergraduateEnrollment
Source: AEG analysis using base data from IPEDS Enrollment, 2015-2016 12-month enrollment
The number of degrees awarded at the URCuniversities has increased by
% since 2006.
17,573 18,381 19,042 18,943 19,290 19,268 19,647 19,676 20,553 21,085 21,637
11,760 11,662 11,660 12,089 11,952 12,415 12,836 12,887 13,588 13,462 13,646
29,333 30,043 30,702 31,032 31,242 31,683 32,483 32,563
34,141 34,547 35,283
-
5,000
10,000
15,000
20,000
25,000
30,000
35,000
40,000
2006 2007 2008 2009 2010 2011 2012 2013 2014 2015 2016
Bachelor Degrees Advanced Degrees
Source: AEG analysis using base data from IPEDS Completions, 2006-2016
Anderson Economic Group, LLC 9
Education and Talent Benchmarks
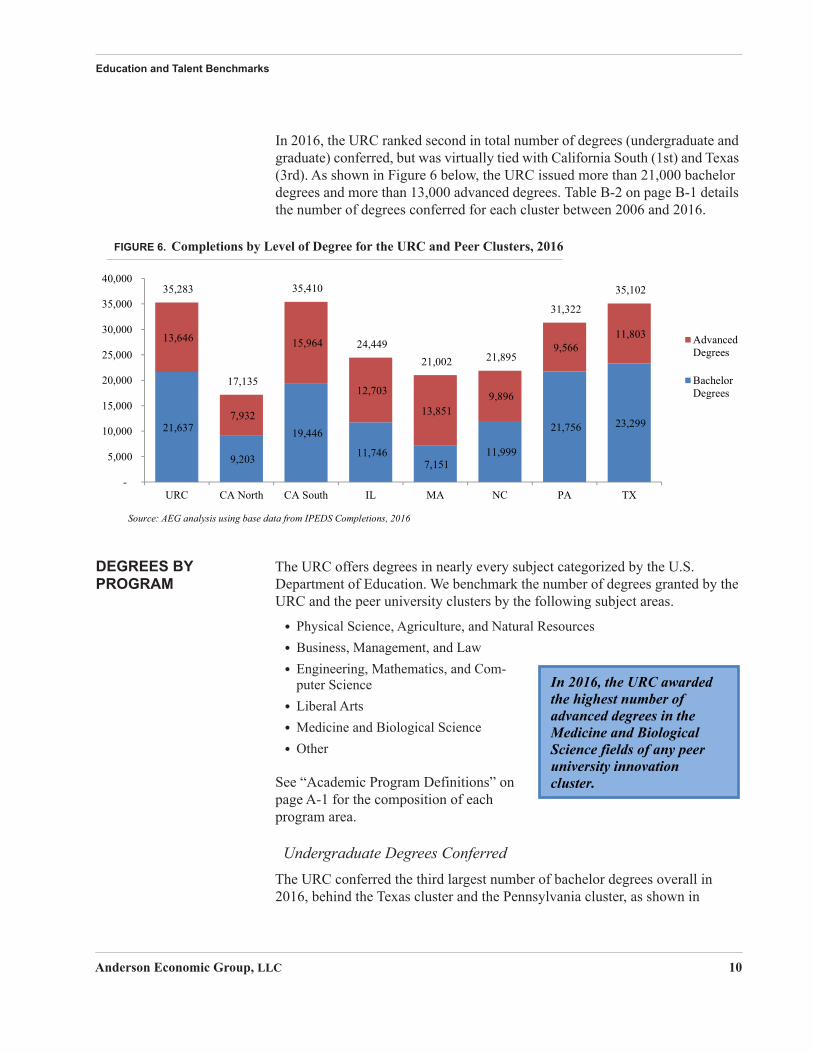
In 2016, the URC ranked second in total number of degrees (undergraduate and graduate) conferred, but was virtually tied with California South (1st) and Texas (3rd). As shown in Figure 6 below, the URC issued more than 21,000 bachelor degrees and more than 13,000 advanced degrees. Table B-2 on page B-1 details the number of degrees conferred for each cluster between 2006 and 2016.
FIGURE 6. Completions by Level of Degree for the URC and Peer Clusters, 2016
DEGREES BY PROGRAM
The URC offers degrees in nearly every subject categorized by the U.S. Department of Education. We benchmark the number of degrees granted by the URC and the peer university clusters by the following subject areas.
• Physical Science, Agriculture, and Natural Resources • Business, Management, and Law• Engineering, Mathematics, and Com-
puter Science• Liberal Arts• Medicine and Biological Science • Other
See “Academic Program Definitions” on page A-1 for the composition of each program area.
Undergraduate Degrees ConferredThe URC conferred the third largest number of bachelor degrees overall in 2016, behind the Texas cluster and the Pennsylvania cluster, as shown in
21,637
9,203
19,446
11,746 7,151
11,999
21,756 23,299
13,646
7,932
15,964
12,703
13,851 9,896
9,566 11,803
35,283
17,135
35,410
24,449 21,002 21,895
31,322
35,102
-
5,000
10,000
15,000
20,000
25,000
30,000
35,000
40,000
URC CA North CA South IL MA NC PA TX
AdvancedDegrees
BachelorDegrees
Source: AEG analysis using base data from IPEDS Completions, 2016
In 201 , the URC awardedthe highest number of advanced degrees in the Medicine and Biological Science fields of any peer university innovation cluster.
Anderson Economic Group, LLC 10
Education and Talent Benchmarks
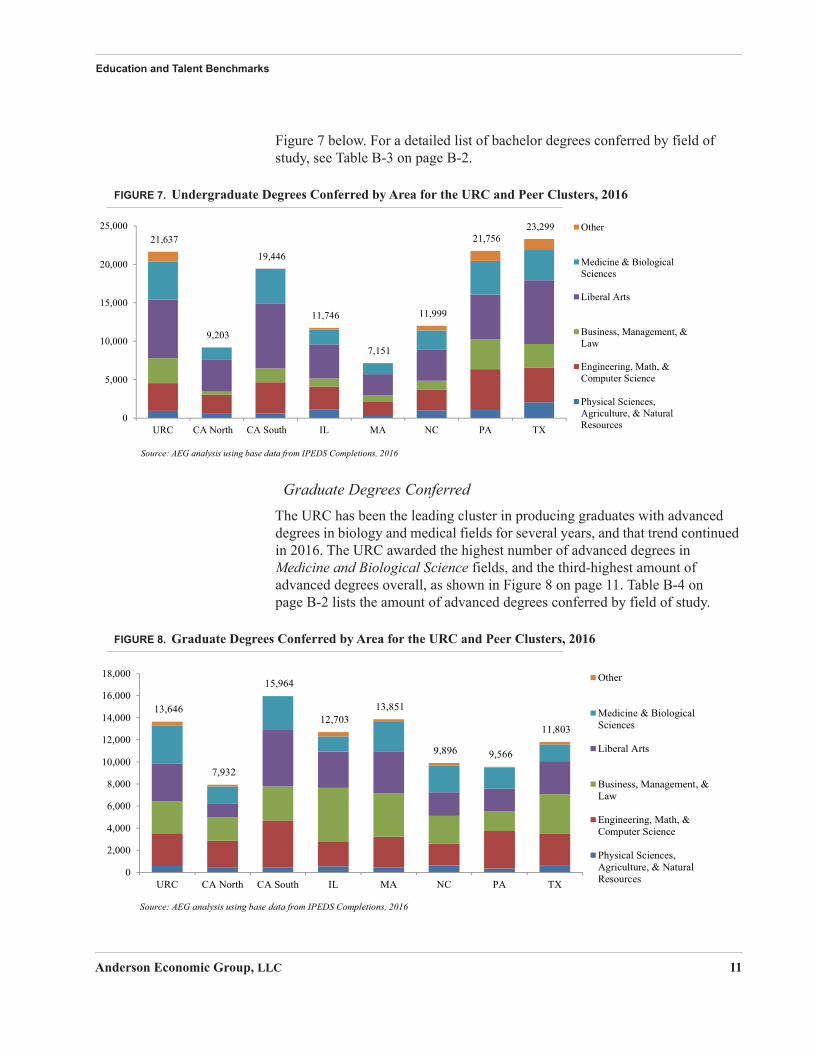
Figure 7 below. For a detailed list of bachelor degrees conferred by field of study, see Table B-3 on page B-2.
FIGURE 7. Undergraduate Degrees Conferred by Area for the URC and Peer Clusters, 2016
Graduate Degrees ConferredThe URC has been the leading cluster in producing graduates with advanced degrees in biology and medical fields for several years, and that trend continued in 2016. The URC awarded the highest number of advanced degrees in Medicine and Biological Science fields, and the third-highest amount of advanced degrees overall, as shown in Figure 8 on page 11. Table B-4 on page B-2 lists the amount of advanced degrees conferred by field of study.
FIGURE 8. Graduate Degrees Conferred by Area for the URC and Peer Clusters, 2016
21,637
9,203
19,446
11,746
7,151
11,999
21,756 23,299
0
5,000
10,000
15,000
20,000
25,000
URC CA North CA South IL MA NC PA TX
Other
Medicine & BiologicalSciences
Liberal Arts
Business, Management, &Law
Engineering, Math, &Computer Science
Physical Sciences,Agriculture, & NaturalResources
Source: AEG analysis using base data from IPEDS Completions, 2016
13,646
7,932
15,964
12,703 13,851
9,896 9,566
11,803
0
2,000
4,000
6,000
8,000
10,000
12,000
14,000
16,000
18,000
URC CA North CA South IL MA NC PA TX
Other
Medicine & BiologicalSciences
Liberal Arts
Business, Management, &Law
Engineering, Math, &Computer Science
Physical Sciences,Agriculture, & NaturalResources
Source: AEG analysis using base data from IPEDS Completions, 2016
Anderson Economic Group, LLC 11

Education and Talent Benchmarks
HIGH-TECH AND HIGH-DEMAND DEGREES
In this section, we identify the number of degrees awarded in each cluster that prepare students for jobs in high-tech industries or jobs that are in particularly high demand. See “High-Tech, High-Demand, and Medical Degrees” on page A-2 for further description of our methodology.
Michigan Governor Rick Snyder announced a Marshall Plan for talent in October 2017, a plan for investment to encourage education and training for high-tech jobs. The URC universities are perhaps the biggest source of that education and training in Michigan. The degrees that we focus on in this section are crucial to the growth of vital industries in the state.
Benchmarking High-Tech DegreesThe URC awarded 10,669 high-tech degrees in 2016. As shown in Figure 9, the largest share of these degrees was awarded in engineering, with the second largest share being awarded in biological and biomedical sciences. A breakdown of high-tech degrees by cluster category can be found in Table B-5 on page B-3.
FIGURE 9. URC Completion of Undergraduate and Graduate High-Tech Degrees by Field of Study, 2016
As shown in Figure 10 on page 13, the URC awarded the fourth-highest number of undergraduate high-tech degrees, and the third-highest number of advanced high-tech degrees in the 2016 academic year. The URC’s total high-tech degrees conferred increased by 7.9% since the previous year. This growth surpassed the peer cluster average, which was 6.3%.
4.1%3.2%
23.8%
0.01%12.4%
4.5%
40.8%
5.2%6.0% Agriculture, agriculture operations and related sciences
Architecture and related services
Biological and biomedical sciences
Communications technologies/technicians and support services
Computer and information sciences and support services
Engineering technologies and engineering-related fields
Engineering
Mathematics and statistics
Physical sciences
Source: AEG analysis using base data from IPEDS Completions, 2016
Anderson Economic Group, LLC 12

Education and Talent Benchmarks
FIGURE 10. Completion of High-Tech Degrees for the URC and Peer Clusters, 2016
Benchmarking High-Demand DegreesHigh-demand degrees include those in computer science, engineering, and business.1 Figure 11 below shows the total number of high-demand degrees conferred by academic area for the URC and each peer cluster. The URC conferred the third-highest number of high-demand degrees overall in 2016.
FIGURE 11. Completion of High-Demand Degrees for the URC and Peer Clusters, 2016
6,514
3,671
7,3134,902
2,754 4,812
7,593 8,584
4,155
3,305
5,274
3,274
3,940
3,063
4,199 3,895
10,669
6,976
12,587
8,176
6,694 7,875
11,79212,479
-
2,000
4,000
6,000
8,000
10,000
12,000
14,000
URC CA North CA South IL MA NC PA TX
Graduate High-TechCompletions
Undergraduate High-TechCompletions
Source: AEG analysis using base data from IPEDS Completions, 2016
1. High-demand degrees include the three fields of study with the highest demand among employers according to the 2017 Job Outlook Report by the National Association of Colleges and Employers. See “High-Demand Degree Definition” on page A-2 for more information.
5,266
1,5203,958 4,854
3,598 3,146 5,237 6,062
1,318
1,054
1,973 9421,158 1,043
2,654 1,456
4,830
3,117
4,7233,412
2,297 3,147
5,441 5,146
11,414
5,691
10,654 9,208
7,053 7,336
13,332 12,664
-
2,000
4,000
6,000
8,000
10,000
12,000
14,000
16,000
URC CA North CA South IL MA NC PA TX
Engineering
Computer Science
Business
Source: AEG analysis using base data from IPEDS Completions, 2016
Anderson Economic Group, LLC 13
Education and Talent Benchmarks
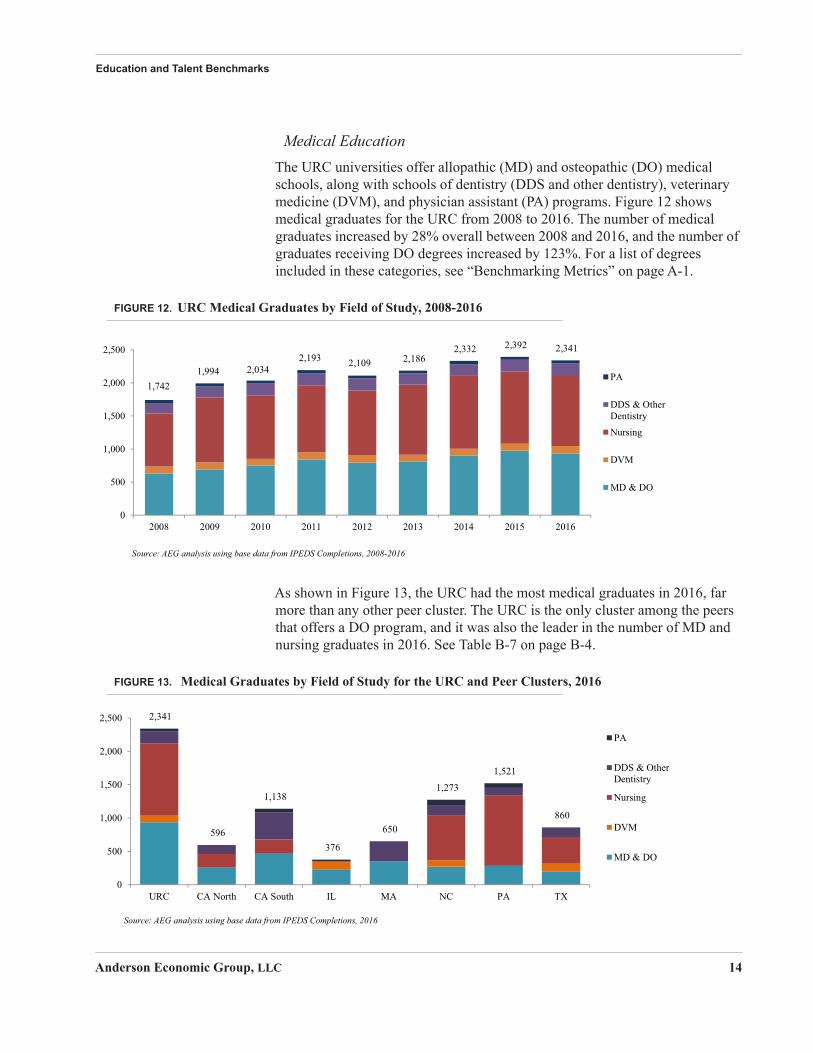
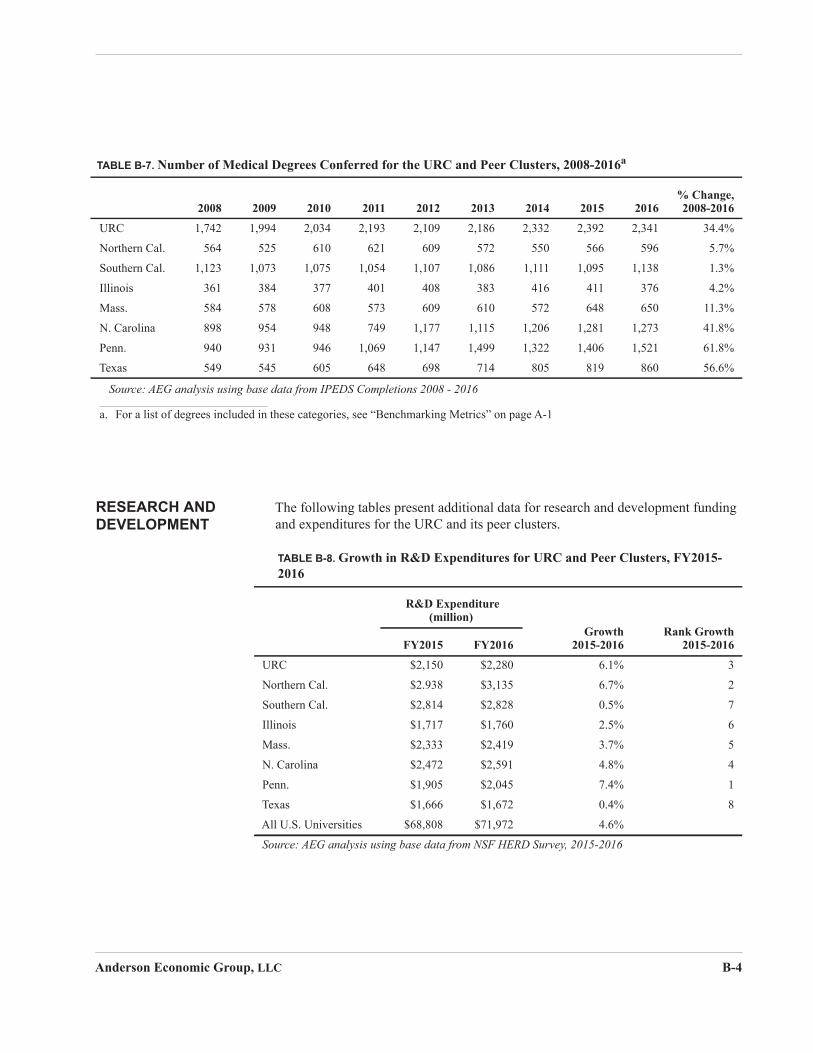
Medical EducationThe URC universities offer allopathic (MD) and osteopathic (DO) medical schools, along with schools of dentistry (DDS and other dentistry), veterinary medicine (DVM), and physician assistant (PA) programs. Figure 12 shows medical graduates for the URC from 2008 to 2016. The number of medical graduates increased by 28% overall between 2008 and 2016, and the number of graduates receiving DO degrees increased by 123%. For a list of degrees included in these categories, see “Benchmarking Metrics” on page A-1.
FIGURE 12. URC Medical Graduates by Field of Study, 2008-2016
As shown in Figure 13, the URC had the most medical graduates in 2016, far more than any other peer cluster. The URC is the only cluster among the peers that offers a DO program, and it was also the leader in the number of MD and nursing graduates in 2016. See Table B-7 on page B-4.
FIGURE 13. Medical Graduates by Field of Study for the URC and Peer Clusters, 2016
1,7421,994 2,034
2,193 2,109 2,1862,332 2,392 2,341
0
500
1,000
1,500
2,000
2,500
2008 2009 2010 2011 2012 2013 2014 2015 2016
PA
DDS & OtherDentistry
Nursing
DVM
MD & DO
Source: AEG analysis using base data from IPEDS Completions, 2008-2016
2,341
596
1,138
376
650
1,273
1,521
860
0
500
1,000
1,500
2,000
2,500
URC CA North CA South IL MA NC PA TX
PA
DDS & OtherDentistry
Nursing
DVM
MD & DO
Source: AEG analysis using base data from IPEDS Completions, 2016
Anderson Economic Group, LLC 14

Research and Development Benchmarks
IV.Research and Development Benchmarks
In the previous chapter, we highlighted how the URC universities contribute to the talent pool in Michigan by educating students in all fields of study. The URC also plays a big role in research and development activity in Michigan.
Universities across the country secure funding to support billions of dollars for research and development by faculty, staff, and students. Nearly every university in the defined peer clusters is classified as an institution engaging in very high research activity.2 This section highlights the URC’s research and development, and benchmarks the URC against its peers in academic R&D expenditures.
Academic R&D ExpendituresTotal R&D expenditures by the eight university clusters totaled nearly $19 billion in 2016, about 26% of R&D expenditures by all U.S. colleges and universities.3 In 2016, the URC had the fifth-largest R&D expenditures of the eight university clusters at $2.28 billion, accounting for more than 92% of R&D spending at colleges or universities in Michigan.
Using the most recent data available from the National Science Foundation (NSF), we show the sources for R&D expenditures for each university cluster in Figure 5 on page 16. Higher education institutions in Michigan spent nearly $1.3 billion in R&D from federally-financed sources.4 Ninety-four percent of the federally-funded R&D in Michigan was conducted at the URC.
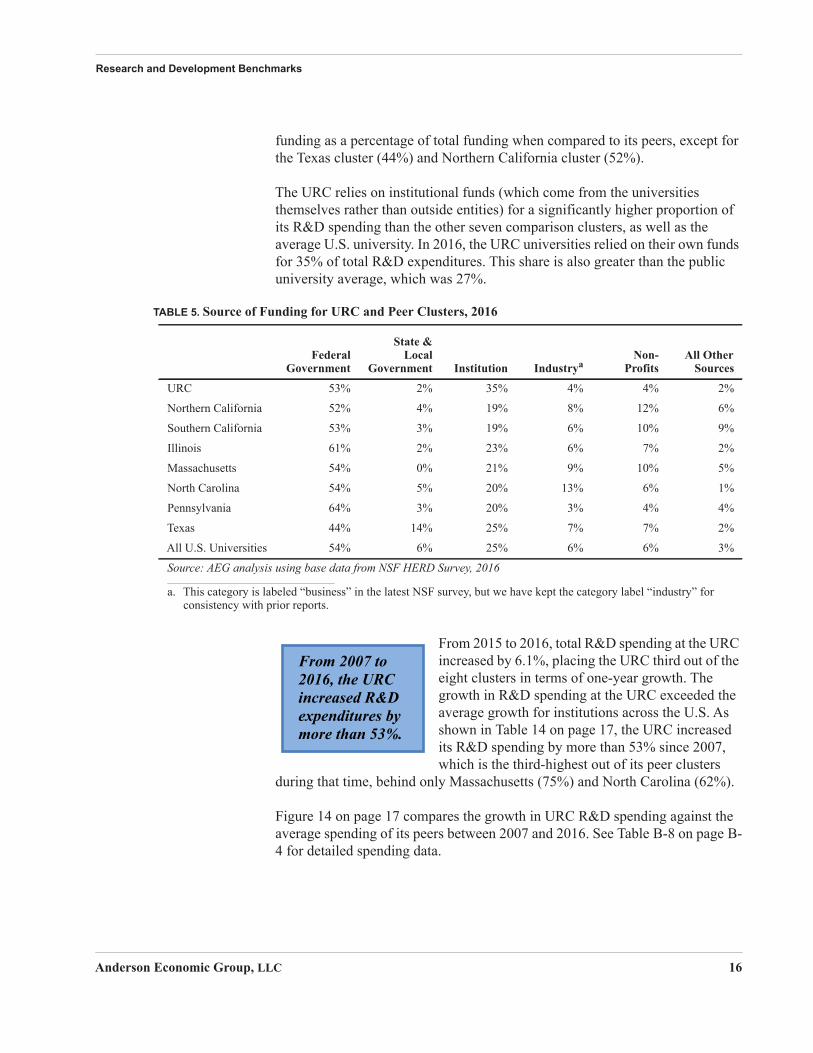
The majority of university funding for R&D comes from the federal government, as shown in Table 5 on page 16. While the URC received 53% of its funding in 2016 from the federal government, the URC received less federal
2. “Very high research activity” is a classification designated by the Carnegie Foundation for the Advancement of Teaching, assigned to doctorate-granting institutions with the highest level of research activity. Carnegie classifications have been the leading framework for recognizing and describing institutional diversity in U.S. higher education for the past four decades. The exceptions are UCSF, which is classified as a medical school and medical center, and some of the University of Michigan, Pennsylvania State University, and the University of Pittsburgh campuses.
3. NSF National Center for Science and Engineering Statistics, Higher Education Research and Development (HERD) Survey, FY 2016.
4. This data comes from the NSF HERD survey and includes respondents that only filled out the short-form survey. As a result this number includes both public and private colleges and uni-versities receiving federal research funding.
The URC accounted for 94% of federally-funded R&D expenditures at higher education institutions in Michigan.
Anderson Economic Group, LLC 15
Research and Development Benchmarks
funding as a percentage of total funding when compared to its peers, except for the Texas cluster (44%) and Northern California cluster (52%).
The URC relies on institutional funds (which come from the universities themselves rather than outside entities) for a significantly higher proportion of its R&D spending than the other seven comparison clusters, as well as the average U.S. university. In 2016, the URC universities relied on their own funds for 35% of total R&D expenditures. This share is also greater than the public university average, which was 27%.
From 2015 to 2016, total R&D spending at the URC increased by 6.1%, placing the URC third out of the eight clusters in terms of one-year growth. The growth in R&D spending at the URC exceeded the average growth for institutions across the U.S. As shown in Table 14 on page 17, the URC increased its R&D spending by more than 53% since 2007, which is the third-highest out of its peer clusters
during that time, behind only Massachusetts (75%) and North Carolina (62%).
Figure 14 on page 17 compares the growth in URC R&D spending against the average spending of its peers between 2007 and 2016. See Table B-8 on page B-4 for detailed spending data.
TABLE 5. Source of Funding for URC and Peer Clusters, 2016
FederalGovernment
State &Local
Government Institution IndustryaNon-
ProfitsAll Other
Sources
URC 53% 2% 35% 4% 4% 2%
Northern California 52% 4% 19% 8% 12% 6%
Southern California 53% 3% 19% 6% 10% 9%
Illinois 61% 2% 23% 6% 7% 2%
Massachusetts 54% 0% 21% 9% 10% 5%
North Carolina 54% 5% 20% 13% 6% 1%
Pennsylvania 64% 3% 20% 3% 4% 4%
Texas 44% 14% 25% 7% 7% 2%
All U.S. Universities 54% 6% 25% 6% 6% 3%
Source: AEG analysis using base data from NSF HERD Survey, 2016
a. This category is labeled “business” in the latest NSF survey, but we have kept the category label “industry” for consistency with prior reports.
From 2007 to 2016, the URC increased R&D expenditures by more than 53%.
Anderson Economic Group, LLC 16

Research and Development Benchmarks
s
FIGURE 14. Growth in R&D Spending, 2007-2016 (2007 value=100)
Between 2015 and 2016, the URC increased science and engineering (S&E) R&D expenditures by 5.7%. This growth exceeded the average increase for all institutions across the U.S. as well as the peer cluster average. Since 2007, the URC increased its S&E R&D spending by 53%, which is the third-highest of the clusters and is higher than the average increase for peer clusters, as well as the average for all U.S. institutions. Figure 15 below shows the growth in R&D spending on S&E for the URC, and the average of its peers. See Table B-9 on page B-5 for the detailed spending amounts for the past two years.
FIGURE 15. Growth in R&D Spending on S&E 2007-2016 (2007 value=100)
Research priorities vary across the university clusters, resulting in variation in which fields receive higher a share of R&D funding. By and large, universities focus the greatest share of their spending on S&E fields, as shown in Figure 16 on page 18. Table B-10 on page B-5 details spending amounts by field.
90
100
110
120
130
140
150
160
2007 2008 2009 2010 2011 2012 2013 2014 2015 2016
URC
Peer ClusterAverage
All U.S.Institutions
Source: AEG analysis using base data from NSF HERD Survey
90
100
110
120
130
140
150
160
2007 2008 2009 2010 2011 2012 2013 2014 2015 2016
URC
Peer ClusterAverage
All U.S. Institution
Source: AEG analysis using base data from NSF HERD Survey
Anderson Economic Group, LLC 17

Research and Development Benchmarks
t
FIGURE 16. R&D Expenditures by Field, 2016
The shares of R&D spending by field for the URC are mostly consistent with national averages. The only exception is in the “other sciences” category, where the URC spends a significantly lower share on environmental sciences and a higher share on social sciences than the national average.
Expenditures by Research TypeThere are three general categories of academic research: basic, applied, and development.
FIGURE 17. Share of R&D Expenditures Spent on Basic, Applied, And Development Research by URC and Peer Clusters, 2016
0%10%20%30%40%50%60%70%80%90%
100%
URC CA North CA South IL MA NC PA TX All U.S.Universities
Non S&Efields
PhysicalSciences
Socialsciences
Engineering
Othersciences
Life sciences
Source: AEG analysis using base data from NSF HERD Survey, 2016
63% 66% 70%80%
62%52% 51%
77%63%
35% 23% 19%14%
36%
22%35%
21%
28%
2%11% 11% 5%
2%
26%
14%2%
9%
0%10%20%30%40%50%60%70%80%90%
100%
URC CA North CA South IL MA NC PA TX All U.S.Universities
Developmen
Applied
Basic
Source: AEG analysis using base data from NSF HERD Survey, 2016
Anderson Economic Group, LLC 18
Research and Development Benchmarks
The NSF defines basic research as research undertaken primarily to acquire knowledge without any particular application or use in mind, and applied research as research conducted to meet a specific, recognized need. Development is the systematic use of research towards the production of useful materials, devices, systems, or methods, including the design and development of prototypes and processes.
In Figure 17 on page 18, we show the percentage of R&D funds going toward basic research, applied research, and development. The URC spends the second-highest amount of their funding on applied research (35%) behind only the Massachusetts cluster (36%).
Anderson Economic Group, LLC 19

Technology Commercialization Benchmarks
V.Technology Commercialization Benchmarks
An important function of successful university R&D is the transfer of new technology to the private sector. University R&D expenditures support the research activity of students, faculty, and staff at the university. Technology transfer (or technology commercialization) offices at universities support moving developments and discoveries made in the university setting to the private sector.
Tech transfer allows technology innovation and improvements to reach a larger audience. These offices assist with invention disclosures, patent applications, licensing, and entrepreneurial support. Patents and licensing activity bring in money to the universities and the state, and attract investment in new technologies. Start-ups that thrive and grow bring jobs and higher incomes to Michigan residents.
This section describes the URC’s technology transfer activities, and benchmarks the URC against its peers in technology commercialization.5
Patents and LicensingPatent and licensing activity includes invention disclosures, patents issued, licensing and options agreements, and licensing revenue. While the number of patent applications and invention disclosures in a single year may provide a rough indication of success of the research and development at a university, it will not necessarily show the effectiveness of that research and development reaching the private sector. We find that the statistics on other services provided by tech transfer offices, such as patents granted, number of licenses, royalty revenue, and the number of new start-ups more directly reflect the impact of innovation on the private sector.
Since these numbers tend to be volatile, we focus on the most recent 5-year averages to make meaningful comparisons. In Table 6 on page 21, we show each of these metrics for the URC, and we benchmark the URC’s performance against peer clusters.
In 2016, the URC surpassed its five-year averages for all measures for patent and licensing activity, except licensing revenue. Among its peer clusters, the URC ranks sixth in invention disclosures, fourth in average annual number of patent grants, third in licenses and options issued, and sixth in licensing revenue.
5. For a more in-depth discussion about technology commercialization at the URC universities, see “Embracing Entrepreneurship: The URC’s Growing Support for Entrepreneurs in Michi-gan and Throughout the World,” Anderson Economic Group LLC, East Lansing, May 2013.
Anderson Economic Group, LLC 20
Technology Commercialization Benchmarks
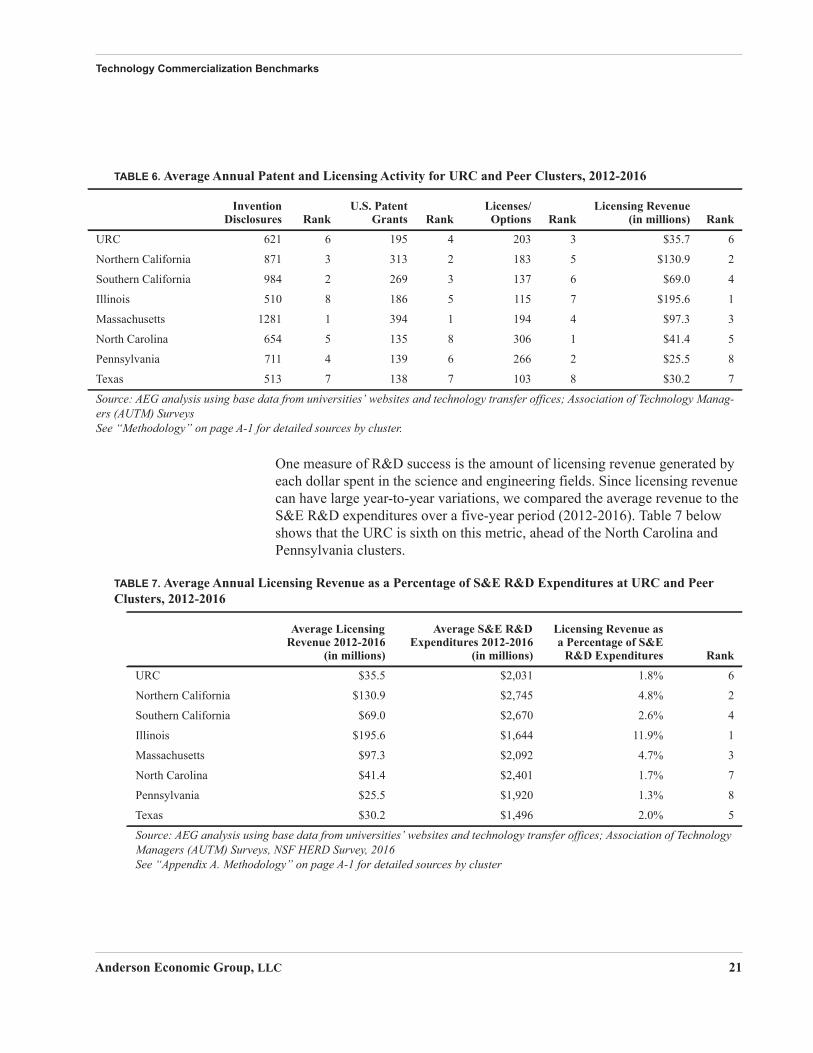
One measure of R&D success is the amount of licensing revenue generated by each dollar spent in the science and engineering fields. Since licensing revenue can have large year-to-year variations, we compared the average revenue to the S&E R&D expenditures over a five-year period (2012-2016). Table 7 below shows that the URC is sixth on this metric, ahead of the North Carolina and Pennsylvania clusters.
TABLE 6. Average Annual Patent and Licensing Activity for URC and Peer Clusters, 2012-2016
InventionDisclosures Rank
U.S. PatentGrants Rank
Licenses/Options Rank
Licensing Revenue(in millions) Rank
URC 621 6 195 4 203 3 $35.7 6
Northern California 871 3 313 2 183 5 $130.9 2
Southern California 984 2 269 3 137 6 $69.0 4
Illinois 510 8 186 5 115 7 $195.6 1
Massachusetts 1281 1 394 1 194 4 $97.3 3
North Carolina 654 5 135 8 306 1 $41.4 5
Pennsylvania 711 4 139 6 266 2 $25.5 8
Texas 513 7 138 7 103 8 $30.2 7
Source: AEG analysis using base data from universities’ websites and technology transfer offices; Association of Technology Manag-ers (AUTM) SurveysSee “Methodology” on page A-1 for detailed sources by cluster.
TABLE 7. Average Annual Licensing Revenue as a Percentage of S&E R&D Expenditures at URC and Peer Clusters, 2012-2016
Average LicensingRevenue 2012-2016
(in millions)
Average S&E R&DExpenditures 2012-2016
(in millions)
Licensing Revenue asa Percentage of S&E
R&D Expenditures Rank
URC $35.5 $2,031 1.8% 6
Northern California $130.9 $2,745 4.8% 2
Southern California $69.0 $2,670 2.6% 4
Illinois $195.6 $1,644 11.9% 1
Massachusetts $97.3 $2,092 4.7% 3
North Carolina $41.4 $2,401 1.7% 7
Pennsylvania $25.5 $1,920 1.3% 8
Texas $30.2 $1,496 2.0% 5
Source: AEG analysis using base data from universities’ websites and technology transfer offices; Association of Technology Managers (AUTM) Surveys, NSF HERD Survey, 2016See “Appendix A. Methodology” on page A-1 for detailed sources by cluster
Anderson Economic Group, LLC 21
Technology Commercialization Benchmarks
Start-upsOver the past several years, the URC has developed and expanded incubators, small business and start-up support services, and grant programs for different stages of business development. These services, along with the relationships the URC has fostered with local communities and businesses, contribute to the success of start-ups at the URC universities for students, alumni, and the community.6 The URC’s reach spans farther than only those start-ups, which use URC-licensed technology.
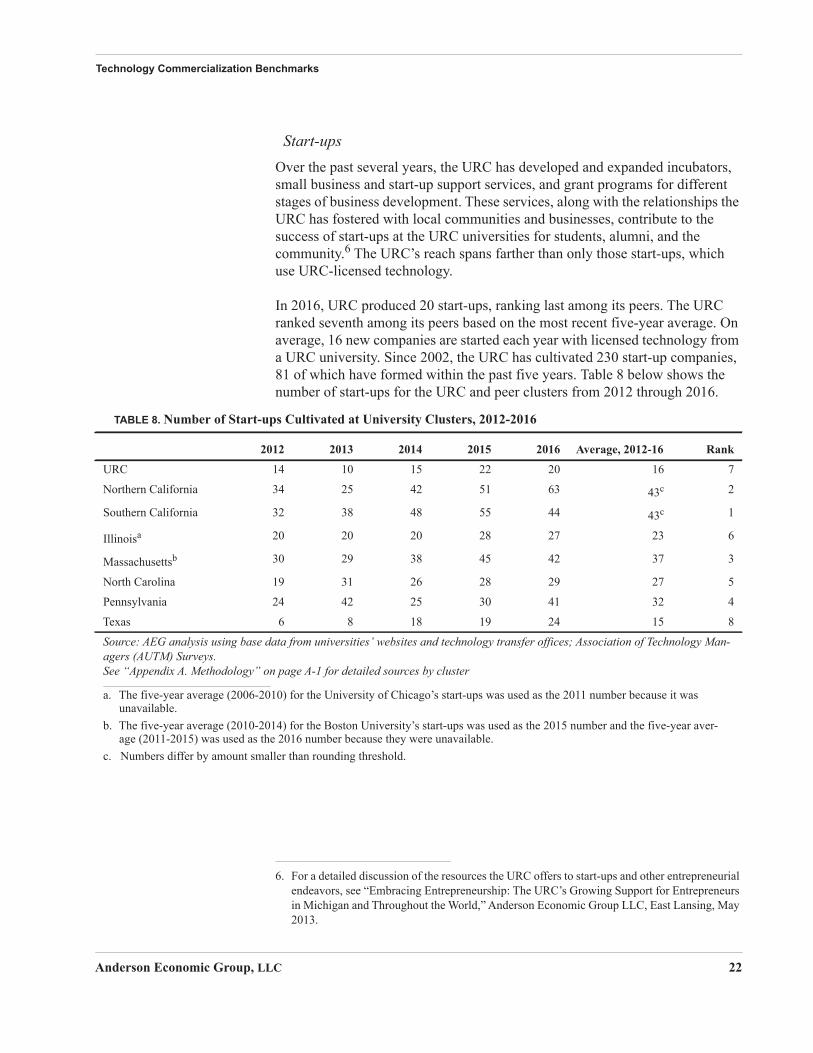
In 2016, URC produced 20 start-ups, ranking last among its peers. The URC ranked seventh among its peers based on the most recent five-year average. On average, 16 new companies are started each year with licensed technology from a URC university. Since 2002, the URC has cultivated 230 start-up companies, 81 of which have formed within the past five years. Table 8 below shows the number of start-ups for the URC and peer clusters from 2012 through 2016.
6. For a detailed discussion of the resources the URC offers to start-ups and other entrepreneurial endeavors, see “Embracing Entrepreneurship: The URC’s Growing Support for Entrepreneurs in Michigan and Throughout the World,” Anderson Economic Group LLC, East Lansing, May 2013.
TABLE 8. Number of Start-ups Cultivated at University Clusters, 2012-2016
2012 2013 2014 2015 2016 Average, 2012-16 Rank
URC 14 10 15 22 20 16 7
Northern California 34 25 42 51 63 43c 2
Southern California 32 38 48 55 44 43c 1
Illinoisa 20 20 20 28 27 23 6
Massachusettsb 30 29 38 45 42 37 3
North Carolina 19 31 26 28 29 27 5
Pennsylvania 24 42 25 30 41 32 4
Texas 6 8 18 19 24 15 8
Source: AEG analysis using base data from universities’ websites and technology transfer offices; Association of Technology Man-agers (AUTM) Surveys.See “Appendix A. Methodology” on page A-1 for detailed sources by cluster
a. The five-year average (2006-2010) for the University of Chicago’s start-ups was used as the 2011 number because it was unavailable.
b. The five-year average (2010-2014) for the Boston University’s start-ups was used as the 2015 number and the five-year aver-age (2011-2015) was used as the 2016 number because they were unavailable.
c. Numbers differ by amount smaller than rounding threshold.
Anderson Economic Group, LLC 22
Innovation Power Rankings
VI.Innovation Power Rankings
In the previous sections, we compared the URC to seven peer clusters on enrollment, degrees, research, and technology transfer activity. In this section, we report our Innovation Power Rankings, a composite ranking of the innovation activity for the URC and each of its peer innovation clusters. This composite ranking incorporates the performance of each cluster on many of the metrics discussed earlier in the report, and provides a way to benchmark the URC’s overall innovation activity to that of its peer clusters. It is a way to capture the contribution that the university clusters make to their regional economy as a result of their research, talent, and technology transfer activities, and is based on the relative positions of clusters within each category.
COMPONENTS OF INNOVATION POWER RANKINGS
The purpose of the Innovation Power Rankings is to capture the URC and each peer innovation cluster’s measurable contributions to innovation from its efforts in the following categories:
• Talent;• Research spending; and• Technology transfer activity.
TalentFor the talent component, we rank each university cluster on the total number of degrees awarded and on the total number of high-tech degrees awarded.
We include a talent metric in the composite ranking because the number of degrees awarded approximates a university’s contribution to an educated and productive workforce. High-technology degrees reflect graduates that may work in fields in which technology and innovation are key components of the industry. “High-Tech, High-Demand, and Medical Degrees” on page A-2 provides a list of which fields of study are included in high-technology degrees.
Research SpendingEach peer university cluster engages in a high level of research activity, with nearly every school in the peer clusters classified as a very high level research university.
We include total research spending and research spending in S&E fields to determine the research ranking. We do not adjust research spending activity to measure spending per student, spending per research faculty, or any other ratio. As a result, we capture the sheer volume of research at universities.
Anderson Economic Group, LLC 23
Innovation Power Rankings
Technology Transfer ActivityAs discussed in “Technology Commercialization Benchmarks” on page 20, technology transfer and commercialization is an important aspect of a university’s contribution to industry. By ranking each cluster on technology transfer activity, we capture how its research and technology efforts are utilized in the private and public sectors. We rank each university cluster on the most recent five-year averages for the following metrics:
• Licensing revenue;• Start-up companies;• Patent grants issued;• Technology licenses issued; and• Invention disclosures.
See “Appendix A. Methodology” on page A-1 for more details on how we measured the metrics in each component of the composite ranking.
RANKINGS BY CATEGORY
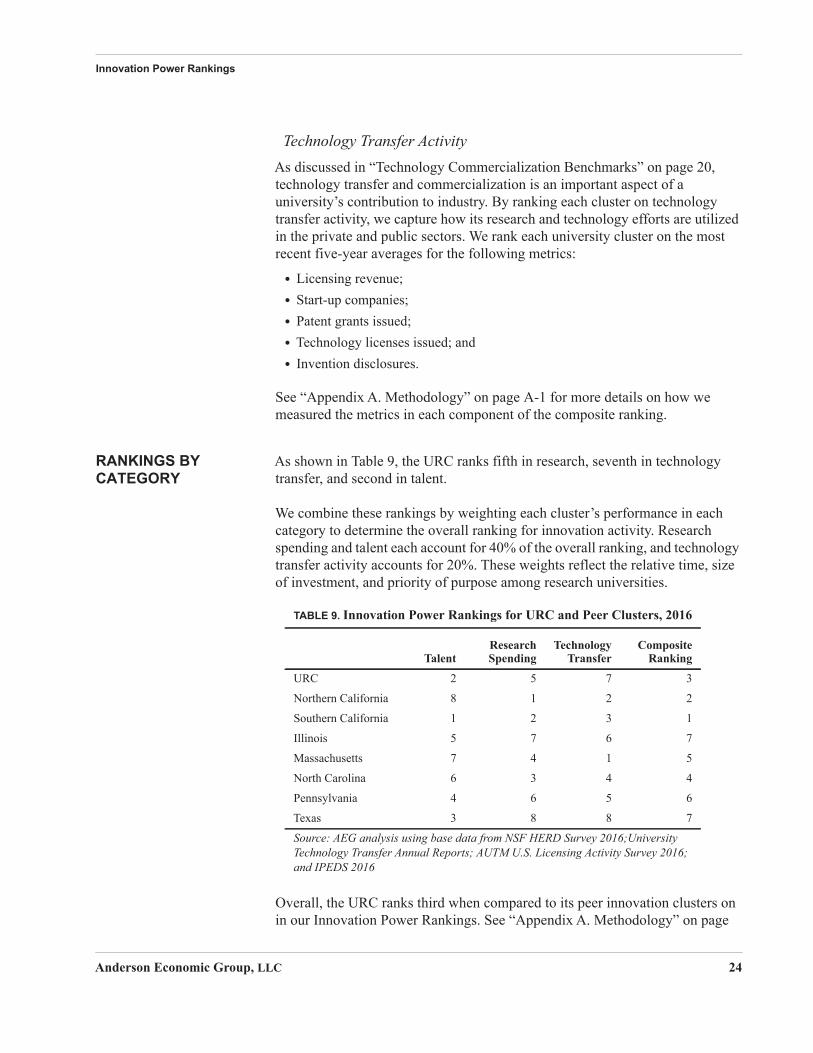
As shown in Table 9, the URC ranks fifth in research, seventh in technology transfer, and second in talent.
We combine these rankings by weighting each cluster’s performance in each category to determine the overall ranking for innovation activity. Research spending and talent each account for 40% of the overall ranking, and technology transfer activity accounts for 20%. These weights reflect the relative time, size of investment, and priority of purpose among research universities.
Overall, the URC ranks third when compared to its peer innovation clusters on in our Innovation Power Rankings. See “Appendix A. Methodology” on page
TABLE 9. Innovation Power Rankings for URC and Peer Clusters, 2016
TalentResearchSpending
TechnologyTransfer
CompositeRanking
URC 2 5 7 3
Northern California 8 1 2 2
Southern California 1 2 3 1
Illinois 5 7 6 7
Massachusetts 7 4 1 5
North Carolina 6 3 4 4
Pennsylvania 4 6 5 6
Texas 3 8 8 7
Source: AEG analysis using base data from NSF HERD Survey 2016;University Technology Transfer Annual Reports; AUTM U.S. Licensing Activity Survey 2016; and IPEDS 2016
Anderson Economic Group, LLC 24
Innovation Power Rankings
A-1 for details on how we determined rankings by category. A more detailed display of the URC and peer cluster rankings by metric can be found in Table A- 1 on page A-7.
Anderson Economic Group, LLC 25
Appendix A. Methodology
This appendix describes the methods used to benchmark the URC against its peer clusters in terms of education and research metrics. The methodology used in this report is consistent with the methodology for benchmarking used in reports in previous years.
BENCHMARKING METRICS
Below we include definitions of degree categories created by AEG and describe any changes to methodology compared to previous years’ reports.
Total Degree CompletionsThe completions data contained in “Total Degrees Granted” on page 9 may not exactly match the numbers in our previous reports. While we continued to use completion data from the Integrated Postsecondary Education Data System (IPEDS) for this analysis, we no longer include second majors. Including both first and second majors over-represented degrees awarded as it double-counts students who may have two majors, but only one degree.
Academic Program DefinitionsThe academic program areas used in “Degrees by Program” on page 10 are based on the National Center for Education Statistics’ Classification of Instructional Programs (CIP) codes from the Integrated Postsecondary Education Data System (IPEDS). The composition of each program area is as follows:
The Physical Science, Agriculture, and Natural Resources academic program area includes the following fields of study: agriculture, agriculture operations, and related sciences; natural resources and conservation; and physical sciences.
The Business, Management, and Law academic program area includes the following fields of study: legal professions and studies; and business, management, marketing, and related support services.
The Engineering, Mathematics, and Computer Science academic program area includes the following fields of study: architecture and related services; computer and information sciences and support services; engineering; and mathematics and statistics.
The Liberal Arts academic program area includes the following fields of study: area, ethnic, cultural, and gender studies; communication, journalism, and related programs; education; foreign languages, literatures, and linguistics; family and consumer sciences/human sciences; English language and literature/letters; liberal arts and sciences; general studies and humanities; library science; multi/interdisciplinary studies; philosophy and religious studies; theology and
Anderson Economic Group, LLC A-1
religious vocations; public administration and social service professions; social sciences; visual and performing arts; and history.
The Medicine and Biological Science academic program area includes the following fields of study: biological and biomedical sciences; psychology; and health professions and related clinical sciences.
The Other academic program area includes the following fields of study: personal and culinary services; parks, recreation, leisure, and fitness studies; security and protective services; construction trades; mechanic and repair technologies/technicians; precision production; transportation and materials moving; undesignated fields of study; communications technologies/technicians and support services; engineering technologies/technicians; military technologies; and science technologies/technicians.
High-Tech, High-Demand, and Medical DegreesIn the following section, we define these categories of degrees and provide a basic reasoning for how they were created.
High-Tech Degree Definition. AEG’s definition of high-tech degrees is one that we use regularly to assess Michigan’s high-tech industry in Southeast Michigan.7 As with the academic definitions, we used the CIP codes in IPEDS to pull degrees that fit our definition of high-tech. These degrees include:
• agriculture, agriculture operations, and related sciences (we include only 10% of this field of study as most agriculture is not high-tech)
• architecture and related services• biological and biomedical sciences• communications technologies/technicians and support services• computer and information sciences and support services• engineering technologies/technicians• engineering• mathematics and statistics• physical sciences
High-Demand Degree Definition. The three fields of study with the highest demand among employers are business, computer science and engineering, according to a survey done by the National Association of Colleges and Employers. Their 2017 Job Outlook Report surveyed approximately 169 employers from a variety of sectors and found that computer science,
7. Anderson Economic Group, Driving Southeast Michigan Forward, prepared for Automation Alley (November 2008).
Anderson Economic Group, LLC A-2
engineering, accounting, finance, and business administration were in the most demand by employers.
For the purposes of this analysis we combined the three business related majors (accounting, finance, and business administration) into one category due to substantial overlap between these degrees at the undergraduate level in many universities. Our data source (IPEDS) does not distinguish clearly between them.
Additionally, for engineering degrees awarded, we included “engineering” and “engineering technologies/technicians,” because the IPEDS database presents highly related concentrations under each and they likely signal similar skill sets in the entry-level job market.
Medical Degrees. For this analysis, we used the following IPEDS categories to represent the medical field:
• Medicine Doctor's degree—professional practice• Osteopathic Medicine/Osteopathy Doctor's degree—professional practice• Veterinary Medicine Doctor's degree—professional practice• Registered Nursing, Nursing Administration, Nursing Research, and Clinical
Nursing (Bachelor’s, Master’s, and Doctor’s degrees)• Dentistry Doctor's degree—professional practice• Advanced/Graduate Dentistry and Oral Sciences (Master’s and Doctor’s
degrees)• Dental Support Services and Allied Professions (Bachelor's and Master’s
degrees)• Physician Assistant (Master’s degree)
R&D ExpendituresThe data reported to IPEDS for research expenditures are lower than the research expenditures reported to the National Science Foundation because they include different things. Research expenditures reported to IPEDS only include direct research costs. Indirect costs, while included in NSF reporting, are counted in other spending categories when reported to IPEDS.
The science and engineering (S&E) fields used in “Academic R&D Expenditures” on page 15 are based on the NSF’s survey of higher education institutions. The composition of each S&E field is as follows:
• Environmental sciences includes atmospheric and earth sciences, oceanography, and other miscellaneous sciences.
• Life sciences includes agricultural, biological, medical, and other miscellaneous life sciences.
Anderson Economic Group, LLC A-3
• Physical sciences includes astronomy, chemistry, physics, and other miscellaneous physical sciences.
• Social sciences includes economics, political sciences, sociology, and other miscellaneous social sciences.
• Engineering includes aeronautical, biomedical, bioengineering, chemical, civil, electrical, mechanical, metallurgical, and other engineering fields.
Technology Transfer InformationFor information on invention disclosures, patent grants, licenses and options, and licensing revenue, we relied on data provided by the URC universities, universities in each peer cluster, as well as the Association of University Technology Managers (AUTM) Surveys. For each cluster, we obtained the data from the following detailed sources:
• URC: Michigan State University, the University of Michigan, and Wayne State University information was obtained from the URC.
• Northern California: The University of California provided statistics for all their campuses through their Office of Technology and its Annual Reports for 2005-2016. Stanford University provided all statistics for 2005-2013 through their website and Office of Technology Licensing. Stanford’s 2014, 2015 and 2016 data was obtained through the AUTM survey.
• Southern California: The University of California provided statistics for all their campuses through their Office of Technology and its Annual Reports for 2005-2016. USC data for 2006 and 2013-2016 was collected from the AUTM survey and through USC’s Stevens Institute for 2007-2012.
• Illinois: Northwestern University provided all statistics for 2006-2009 through their website. Northwestern data for 2010, 2014, and 2015 was collected from the AUTM survey. Northwestern data for invention disclosures and patent grants in 2016 was obtained from its FY2016 Impact Report, while the rest of the 2016 data was collected from the AUTM survey as those numbers were not made available in the said report. Northwestern data for 2011 was collected from the Innovation and New Ventures Office, and data for 2012 and 2013 was found on page 61 of their annual report entitled “Northwestern University Research: Creating New Knowledge, Annual Report 2012.” University of Chicago provided all statistics through their Office of Technology & Intellectual Property for 2005-2012 and the AUTM survey for 2013 through 2016. University of Illinois, Urbana-Champaign provided all statistics through their Office of Technology Management website.
• Massachusetts: MIT reported 2004-2016 data on their website via downloadable reports; however, licensing revenue and patent numbers were obtained and/or verified through AUTM, as patent data was not made available and licensing revenue numbers were unreadable in said reports. Boston University data for 2005-2016 was obtained through AUTM. Harvard data was collected from the 2006 and 2014 AUTM survey and through Harvard’s Office of Technology Development for 2007-2013, 2015 and 2016.
• North Carolina: Data for UNC-Chapel Hill was collected from their Office of Technology Development for 2002-2014 and from the AUTM survey for 2015
Anderson Economic Group, LLC A-4
and 2016. Data for Duke University was provided by AUTM in 2006, 2014, 2015, and 2016 and through their Office of Licensing & Ventures for 2007-2013. North Carolina State University data were collected from their Office of Technology Transfer.
• Pennsylvania: Pennsylvania cluster data from 2002-2013 was obtained from the University of Pittsburgh’s Office of Technology Management, Penn State’s Intellectual Property office, Carnegie Mellon’s Center for Technology Transfer and Enterprise Creation, and the 2006 AUTM surveys. The 2014-2016 data for all were collected from the AUTM survey.
• Texas: Data for Texas A&M was provided by their Technology Commercialization office for 2002-2013 and by AUTM for 2014-2016. Data for The University of Texas at Austin from 2005-2016 was provided by their Office of Technology Commercialization, while data from 2002-2004 was provided by AUTM (with the exception of number of licenses/options, which had no data reported for the aforementioned years). Rice University also had no license/option numbers to report (via AUTM) for 2002-2004, however, the rest of the university data from 2002-2006 was reported to and obtained from AUTM. Rice University data for 2007-2013 was from their Office of Technology Transfer and the data for 2014-2016 was from the AUTM survey.
INNOVATION POWER RANKINGS
In 2013, we included a new element: a composite ranking, which rates the URC’s performance relative to its peer clusters for research spending, talent, and technology transfer activity. We ranked the URC on each of those three components separately, and then combined the rankings for an overall, composite ranking.
TalentThe talent component is based on the total number of degrees awarded, as well as the number of high-technology degrees awarded. High-tech degrees are listed in “High-Tech Degree Definition” on page A-2. We weighted these ranks at 80% and 20%, respectively, to determine the overall ranking for talent.
ResearchFor the research component, the clusters are ranked on total research spending, as well as spending on science and engineering R&D. We weighted these ranks at 80% and 20%, respectively, to determine the ranking for research.
Technology TransferThe technology transfer and commercialization rankings are composed of each cluster’s ranks for the five-year averages (2012-2016) of the following five measures:
• Licensing revenue• Start-up companies
Anderson Economic Group, LLC A-5
• Patent grants issued• Technology licenses issued• Invention disclosures
Licensing revenues and start-ups provide the strongest direct measures of how valuable university R&D efforts are to the private sector. Therefore, we weighted rankings for licensing revenues and start-up companies as half of the total technology transfer ranking, and the other three measures are equally weighted to make up the other half of the overall ranking.
Overall Composite RankingOnce we determine the overall rankings for research, talent, and technology transfer activity, we use a weighted average to combine them into a single composite ranking for each cluster. We weight talent and research at 40% each, and weight tech transfer and commercialization at 20% of the final ranking. What metrics to include and how to weight them involves subjective judgement. Our goal is to combine the metrics for which we have high-quality data (those included in this report) into the best possible overall measure of a cluster’s contribution to innovation.
We weight research and talent more heavily than technology transfer for two reasons. First, for most universities, research and educating students are more closely related to the institution’s core mission than technology transfer, even though the latter is important and becoming increasingly emphasized. Second, while we believe the technology transfer metrics we use are the best available, they do not capture the universities’ impacts on technology and practices outside of the universities as well as the talent and research metrics in their respective areas. University R&D reaches practical application outside the universities through a variety of channels, including formal technology transfer, research partnerships, and the education of students who may take what they have learned in the lab with them to the outside world. Table A-1 on page A-7 displays the detailed rankings by metric for the URC and peer clusters
Anderson Economic Group, LLC A-6

ClusteURC
Norther
Souther
Illinois
Mass.
N. Caro
Penn.
Texas
Source:2016; a
TABLE A-1. 2016 Innovation Power Rankings for URC and Peer Clusters, Detailed
rTalent
(40% of Composite)Research Spending Rank
(40% of Composite)Technology Transfer(20% of Composite)
Composite Ranking
Category Rank: 2 5 7 3
Subcategory Ranks: Degrees (80%): 2High-tech Degrees (20%): 4
Total R&D (80%): 5Total R&D in S&E (20%): 5
Licensing Revenue (25%): 6Start-up Companies (25%): 7Patent Grants Issued (17%): 4Tech. Licenses Issued (17%): 3Invention Disclosures (17%): 6
n Cal. Category Rank: 8 1 2 2
Subcategory Ranks: Degrees (80%): 8High-tech Degrees (20%): 7
Total R&D (80%): 1Total R&D in S&E (20%): 1
Licensing Revenue (25%): 2Start-up Companies (25%): 2Patent Grants Issued (17%): 2Tech. Licenses Issued (17%): 5Invention Disclosures (17%): 3
n Cal. Category Rank: 1 2 3 1
Subcategory Ranks: Degrees (80%): 1High-tech Degrees (20%): 1
Total R&D (80%): 2Total R&D in S&E (20%): 2
Licensing Revenue (25%): 4Start-up Companies (25%): 1Patent Grants Issued (17%): 3Tech. Licenses Issued (17%): 6Invention Disclosures (17%): 2
Category Rank: 5 7 7 7
Subcategory Ranks: Degrees (80%): 5High-tech Degrees (20%): 5
Total R&D (80%): 7Total R&D in S&E (20%): 7
Licensing Revenue (25%): 1Start-up Companies (25%): 6Patent Grants Issued (17%): 5Tech. Licenses Issued (17%): 7Invention Disclosures (17%): 8
Category Rank: 7 4 1 5
Subcategory Ranks: Degrees (80%): 7High-tech Degrees (20%): 8
Total R&D (80%): 4Total R&D in S&E (20%): 4
Licensing Revenue (25%): 3Start-up Companies (25%): 3Patent Grants Issued (17%): 1Tech. Licenses Issued (17%): 4Invention Disclosures (17%): 1
lina Category Rank: 6 3 4 4
Subcategory Ranks: Degrees (80%): 6High-tech Degrees (20%): 6
Total R&D (80%): 3Total R&D in S&E (20%): 3
Licensing Revenue (25%): 5Start-up Companies (25%): 5Patent Grants Issued (17%): 8Tech. Licenses Issued (17%): 1Invention Disclosures (17%): 5
Category Rank: 4 6 5 6
Subcategory Ranks: Degrees (80%): 4High-tech Degrees (20%): 3
Total R&D (80%): 6Total R&D in S&E (20%): 6
Licensing Revenue (25%): 8Start-up Companies (25%): 4Patent Grants Issued (17%): 6Tech. Licenses Issued (17%): 2Invention Disclosures (17%): 4
Category Rank: 3 8 8 7
Subcategory Ranks: Degrees (80%): 3High-tech Degrees (20%): 2
Total R&D (80%): 8Total R&D in S&E (20%): 8
Licensing Revenue (25%): 7Start-up Companies (25%): 8Patent Grants Issued (17%): 7Tech. Licenses Issued (17%): 8Invention Disclosures (17%): 7
AEG analysis using base data from NSF HERD Survey 2016;University Technology Transfer Annual Reports; AUTM U.S. Licensing Activity Survey nd IPEDS 2016
Anderson Economic Group, LLC A-7

16
U 15
N 13
S 29
I 82
M 13
N 70
P 41
T 77
S
T
016
UR ,283
No ,135
Sou ,410
Illi ,449
Ma ,002
N. ,895
Pen ,322
Tex ,102
Sou
Appendix B. Additional Data and Tables
This appendix contains additional detailed data for some of the numbers, tables, and figures presented throughout the report.
EDUCATION AND TALENT BENCHMARKS
The following tables present additional data for students and degrees for the URC and its peer clusters.
Enrollment
Degrees
TABLE B-1. Student Enrollment for the URC and Peer Clusters, 2007-2016
2007 2008 2009 2010 2011 2012 2013 2014 2015 20
RC 150,067 151,903 151,327 153,995 155,083 156,328 156,432 155,763 155,607 154,9
orthern Cal. 60,891 64,001 61,941 63,428 64,281 62,615 63,548 64,451 63,498 64,3
outhern Cal. 104,739 106,441 108,196 111,145 112,467 114,651 116,445 120,986 124,506 127,1
llinois 83,477 83,892 84,676 85,874 88,425 89,335 90,051 90,932 91,080 91,6
ass. 83,120 83,859 85,510 85,325 86,581 87,099 88,948 88,928 89,885 90,3
. Carolina 80,003 84,655 86,030 87,371 89,229 89,772 89,367 88,324 88,029 87,7
enn. 138,826 140,105 143,001 145,215 143,880 142,272 139,830 140,610 140,215 139,8
exas 120,614 117,770 118,995 124,095 126,804 130,483 134,511 139,696 142,875 145,7
ource: AEG analysis using base data from IPEDS Enrollment, 12-Month Enrollment 2006-2007 to 2015-2016
ABLE B-2. Number of Degrees Conferred for the URC and Peer Clusters, 2007-2016
2007 2008 2009 2010 2011 2012 2013 2014 2015 2
C 30,043 30,702 31,032 31,242 31,683 32,483 32,563 34,141 34,547 35
rthern Cal. 15,420 15,592 15,833 15,946 16,599 16,856 17,144 16,872 17,044 17
thern Cal. 27,147 28,392 28,599 29,582 31,401 32,180 32,552 33,265 34,208 35
nois 20,497 21,256 21,340 22,129 22,618 23,061 23,207 23,730 24,154 24
ss. 18,317 19,167 19,115 19,420 19,676 20,008 20,140 20,464 20,576 21
Carolina 17,062 17,370 18,000 18,524 19,381 20,727 21,105 21,744 21,553 21
n. 26,409 26,695 27,240 29,642 30,458 30,286 30,255 31,885 31,095 31
as 24,638 25,378 25,689 25,913 26,705 26,951 31,763 32,769 33,264 35
rce: AEG analysis using base data from IPEDS Completions, 2007-2016
Anderson Economic Group, LLC B-1
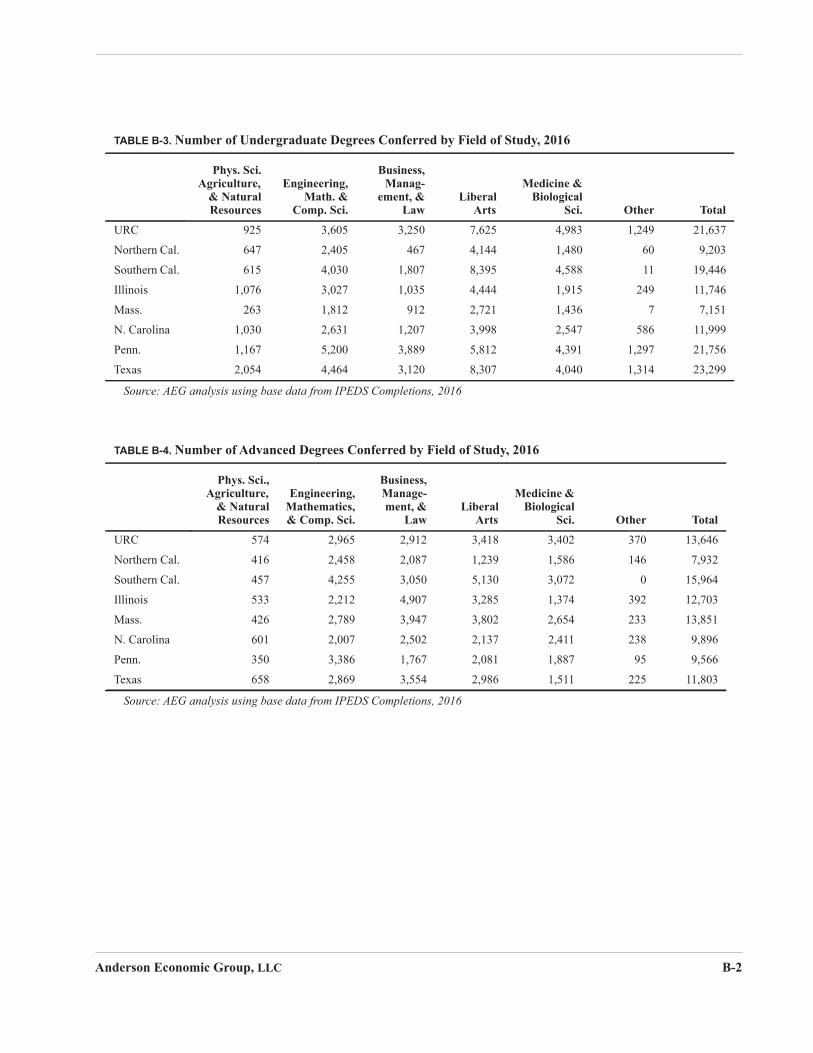
TABLE B-3. Number of Undergraduate Degrees Conferred by Field of Study, 2016
Phys. Sci.Agriculture,
& NaturalResources
Engineering,Math. &
Comp. Sci.
Business,Manag-
ement, &Law
LiberalArts
Medicine &Biological
Sci. Other Total
URC 925 3,605 3,250 7,625 4,983 1,249 21,637
Northern Cal. 647 2,405 467 4,144 1,480 60 9,203
Southern Cal. 615 4,030 1,807 8,395 4,588 11 19,446
Illinois 1,076 3,027 1,035 4,444 1,915 249 11,746
Mass. 263 1,812 912 2,721 1,436 7 7,151
N. Carolina 1,030 2,631 1,207 3,998 2,547 586 11,999
Penn. 1,167 5,200 3,889 5,812 4,391 1,297 21,756
Texas 2,054 4,464 3,120 8,307 4,040 1,314 23,299
Source: AEG analysis using base data from IPEDS Completions, 2016
TABLE B-4. Number of Advanced Degrees Conferred by Field of Study, 2016
Phys. Sci.,Agriculture,
& NaturalResources
Engineering,Mathematics,& Comp. Sci.
Business,Manage-ment, &
LawLiberal
Arts
Medicine &Biological
Sci. Other Total
URC 574 2,965 2,912 3,418 3,402 370 13,646
Northern Cal. 416 2,458 2,087 1,239 1,586 146 7,932
Southern Cal. 457 4,255 3,050 5,130 3,072 0 15,964
Illinois 533 2,212 4,907 3,285 1,374 392 12,703
Mass. 426 2,789 3,947 3,802 2,654 233 13,851
N. Carolina 601 2,007 2,502 2,137 2,411 238 9,896
Penn. 350 3,386 1,767 2,081 1,887 95 9,566
Texas 658 2,869 3,554 2,986 1,511 225 11,803
Source: AEG analysis using base data from IPEDS Completions, 2016
Anderson Economic Group, LLC B-2
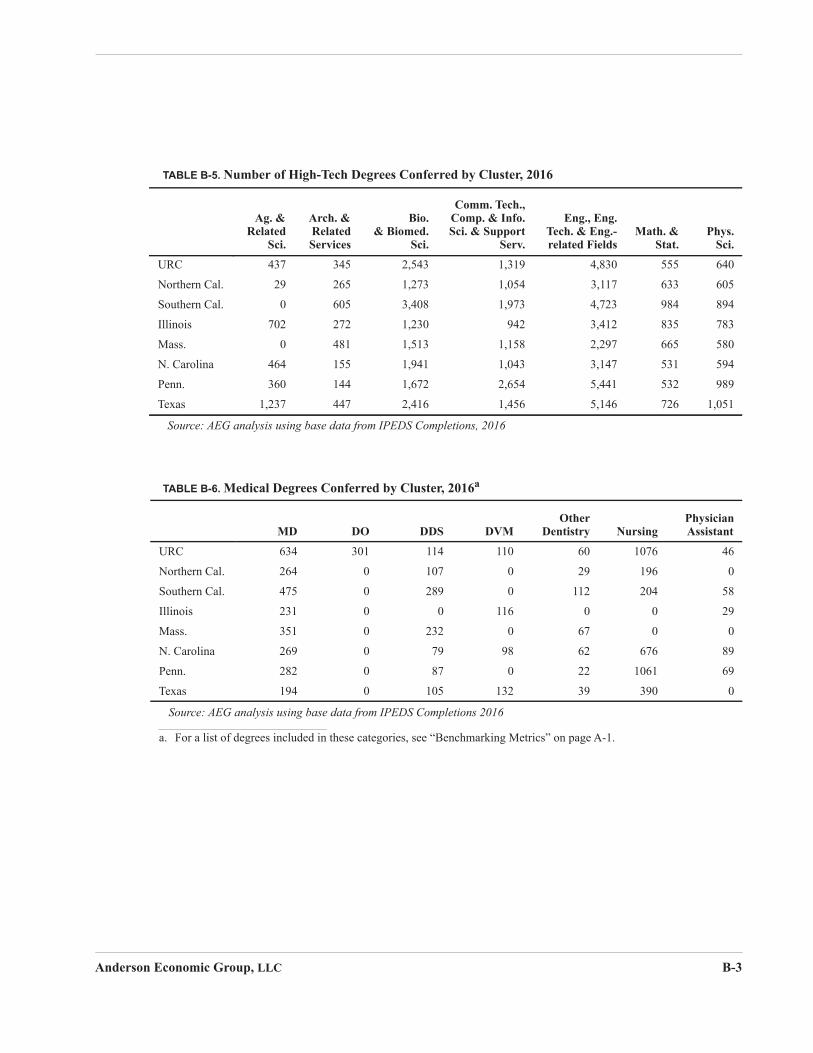
TABLE B-5. Number of High-Tech Degrees Conferred by Cluster, 2016
Ag. &Related
Sci.
Arch. &RelatedServices
Bio.& Biomed.
Sci.
Comm. Tech.,Comp. & Info.Sci. & Support
Serv.
Eng., Eng.Tech. & Eng.-related Fields
Math. &Stat.
Phys.Sci.
URC 437 345 2,543 1,319 4,830 555 640
Northern Cal. 29 265 1,273 1,054 3,117 633 605
Southern Cal. 0 605 3,408 1,973 4,723 984 894
Illinois 702 272 1,230 942 3,412 835 783
Mass. 0 481 1,513 1,158 2,297 665 580
N. Carolina 464 155 1,941 1,043 3,147 531 594
Penn. 360 144 1,672 2,654 5,441 532 989
Texas 1,237 447 2,416 1,456 5,146 726 1,051
Source: AEG analysis using base data from IPEDS Completions, 2016
TABLE B-6. Medical Degrees Conferred by Cluster, 2016a
MD DO DDS DVMOther
Dentistry NursingPhysicianAssistant
URC 634 301 114 110 60 1076 46
Northern Cal. 264 0 107 0 29 196 0
Southern Cal. 475 0 289 0 112 204 58
Illinois 231 0 0 116 0 0 29
Mass. 351 0 232 0 67 0 0
N. Carolina 269 0 79 98 62 676 89
Penn. 282 0 87 0 22 1061 69
Texas 194 0 105 132 39 390 0
Source: AEG analysis using base data from IPEDS Completions 2016
a. For a list of degrees included in these categories, see “Benchmarking Metrics” on page A-1.
Anderson Economic Group, LLC B-3
RESEARCH AND DEVELOPMENT
The following tables present additional data for research and development funding and expenditures for the URC and its peer clusters.
TABLE B-7. Number of Medical Degrees Conferred for the URC and Peer Clusters, 2008-2016a
2008 2009 2010 2011 2012 2013 2014 2015 2016% Change,2008-2016
URC 1,742 1,994 2,034 2,193 2,109 2,186 2,332 2,392 2,341 34.4%
Northern Cal. 564 525 610 621 609 572 550 566 596 5.7%
Southern Cal. 1,123 1,073 1,075 1,054 1,107 1,086 1,111 1,095 1,138 1.3%
Illinois 361 384 377 401 408 383 416 411 376 4.2%
Mass. 584 578 608 573 609 610 572 648 650 11.3%
N. Carolina 898 954 948 749 1,177 1,115 1,206 1,281 1,273 41.8%
Penn. 940 931 946 1,069 1,147 1,499 1,322 1,406 1,521 61.8%
Texas 549 545 605 648 698 714 805 819 860 56.6%
Source: AEG analysis using base data from IPEDS Completions 2008 - 2016
a. For a list of degrees included in these categories, see “Benchmarking Metrics” on page A-1
TABLE B-8. Growth in R&D Expenditures for URC and Peer Clusters, FY2015-2016
R&D Expenditure (million)
Growth2015-2016
Rank Growth2015-2016FY2015 FY2016
URC $2,150 $2,280 6.1% 3
Northern Cal. $2.938 $3,135 6.7% 2
Southern Cal. $2,814 $2,828 0.5% 7
Illinois $1,717 $1,760 2.5% 6
Mass. $2,333 $2,419 3.7% 5
N. Carolina $2,472 $2,591 4.8% 4
Penn. $1,905 $2,045 7.4% 1
Texas $1,666 $1,672 0.4% 8
All U.S. Universities $68,808 $71,972 4.6%
Source: AEG analysis using base data from NSF HERD Survey, 2015-2016
Anderson Economic Group, LLC B-4

TABLE B-9. Growth in Science and Engineering R&D Expenditures for URC and Peer Clusters, FY2015-2016
S&E R&D Expenditure (million)
Growth2015-2016
Rank Growth2015-2016FY2015 FY2016
URC $2,036 $2,152 5.7% 3
Northern Cal. $2,844 $3,041 6.9% 1
Southern Cal. $2,736 $2,743 0.3% 7
Illinois $1,650 $1,675 1.5% 6
Mass. $2,186 $2,271 3.9% 5
N. Carolina $2,431 $2,536 4.3% 4
Penn. $1,878 $2,005 6.7% 2
Texas $1,578 $1,579 0.1% 8
All U.S. Universities $65,158 $67,787 4.0%
Source: AEG analysis using base data from NSF HERD Survey, 2015-2016
TABLE B-10. R&D Spending by Field, FY2016 (thousands)
Env. Sci. Life Sci.
Math &Comp.
Sci.Phys.
Sci.Psycho
-logySocial
Sci.Other
Sci. Engin.
All Non-S&E
Fields
URC $16,899 $1,245,448 $54,641 $235,534 $35,377 $184,107 $18,335 $361,984 $127,966
Northern Cal. $27,789 $2,151,213 $50,153 $315,697 $31,018 $69,024 $85,522 $310,682 $93,687
Southern Cal. $217,948 $1,798,232 $147,442 $150,288 $47,381 $89,940 $32,749 $259,491 $80,040
Illinois $16,341 $954,824 $136,775 $187,712 $34,561 $50,074 $28,331 $265,904 $85,146
Mass. $98,741 $985,500 $115,165 $245,051 $22,430 $131,139 $115,098 $558,054 $148,155
N. Carolina $52,512 $1,881,614 $70,580 $72,725 $61,497 $130,257 $15,002 $252,026 $54,821
Penn. $57,265 $1,021,982 $225,605 $117,245 $54,448 $60,898 $31,828 $435,486 $40,681
Texas $188,868 $422,431 $137,858 $173,464 $14,575 $52,876 $11,895 $576,957 $92,972
Note: Fields determined by NSF. See “R&D Expenditures” on page A-3 for further description of S&E fields.
Source: AEG analysis using base data from NSF HERD Survey, 2016
Anderson Economic Group, LLC B-5
Appendix C. About Anderson Economic Group
ANDERSON ECONOMIC GROUP
Anderson Economic Group, LLC is a boutique consulting firm founded in 1996, with offices in East Lansing, Chicago, New York, and Istanbul. Our team has a deep understanding of advanced economic modeling techniques and extensive experience in several industries in multiple states and countries. We are experts across a variety of fields in tax policy, strategy and business valuation, public policy and economic analysis, and market and industry analysis.
Relevant publications from our team include:
• University Research Corridor Annual Economic Impact Reports, published annually since 2007. This series of reports benchmarks Michigan’s research universities (Wayne State University, Michigan State University, and the University of Michigan) against peer clusters across the country, as well as evaluates the collective economic impact on the state of Michigan.
• “Higher Education Performance Tracker”, Business Leaders for Michigan, published in 2016.
• “2014 Study on Higher Education in the Loop and South Loop,” published in 2014.
• “America’s Urban Campus: The Economic, Social, and Cultural Contributions of Chicago’s Colleges and Universities,” published in 2014.
• “The Economic Footprint of Michigan’s Fifteen Public Universities,” published in 2013.
Past clients of Anderson Economic Group include:
• Governments: The government of Canada; the states of Michigan, North Carolina, and Wisconsin; the cities of Detroit, Cincinnati, and Sandusky; counties such as Oakland County, and Collier County; and authorities such as the Detroit-Wayne County Port Authority.
• Corporations: Ford Motor Company, First Merit Bank, Lithia Motors, Spartan Stores, Nestle, and InBev USA; automobile dealers and dealership groups representing Toyota, Honda, Chrysler, Mercedes-Benz, General Motors, Kia, and other brands.
• Nonprofit organizations: Convention and visitor bureaus of Lansing, Ann Arbor, Traverse City, and Detroit, and Experience Grand Rapids; higher education institutions including Michigan State University, Wayne State University, and University of Michigan; trade associations such as the Michigan Manufacturers Association, Service Employees International Union, Automation Alley, the Michigan Chamber of Commerce, and Business Leaders for Michigan.
Please visit www.AndersonEconomicGroup.com for more information.
Anderson Economic Group, LLC D-1

AUTHORS Traci Giroux. Ms. Giroux is a Consultant with Anderson Economic Group, working in the Public Policy and Economic Analysis practice area. Her background is in applied economics.
While at AEG, Ms. Giroux has performed research and analysis for a wide range of clients, including universities, trade associations, and businesses. Her recent work includes multi-scenario analysis of pending energy regulation; economic and fiscal impact analyses of major investments; analyses of new tourism activity due to policy changes as well as special events; benchmarking studies; and analyses of tax reform proposals.
Prior to joining AEG, she worked as an engineer in the petrochemicals industry in Louisiana and as an AmeriCorps VISTA at a non-profit organization in New Orleans. She has also served as a graduate research assistant at Michigan State University.
Ms. Giroux holds a Master of Science in Agricultural, Food, and Resource Economics and a Bachelor of Science in Chemical Engineering, both from Michigan State University.
CONTRIBUTORS Judy Zhang. Ms. Zhang is an Analyst with Anderson Economic Group, working in the Public Policy and Economic Analysis practice area. She has a background in economic and public policy analysis. While at AEG, Ms. Zhang has contributed to a number of projects including an impact study of state business tax incentives, a survey analysis related to real estate closing costs, and an assessment of pension reform and alternative investment.
Eleanor Delamater. Ms. Delamater is an Analyst in the Public Policy and Economic Analysis practice area at Anderson Economic Group. Her work consists of research and data analysis for a range of projects including an economic impact study, as well as an analysis related to the costs of aquatic invasive species.
Anderson Economic Group, LLC D-2