Employing Empirical Data in Judgmental Processes Wayne J. Camara National Conference on Student...
24
Employing Empirical Data in Judgmental Processes Wayne J. Camara National Conference on Student Assessment, San Diego, CA June 23, 2015
-
Upload
todd-caldwell -
Category
Documents
-
view
213 -
download
0
Transcript of Employing Empirical Data in Judgmental Processes Wayne J. Camara National Conference on Student...
Employing Empirical Data in Judgmental Processes
Wayne J. Camara
National Conference on Student Assessment, San Diego, CA
June 23, 2015
2
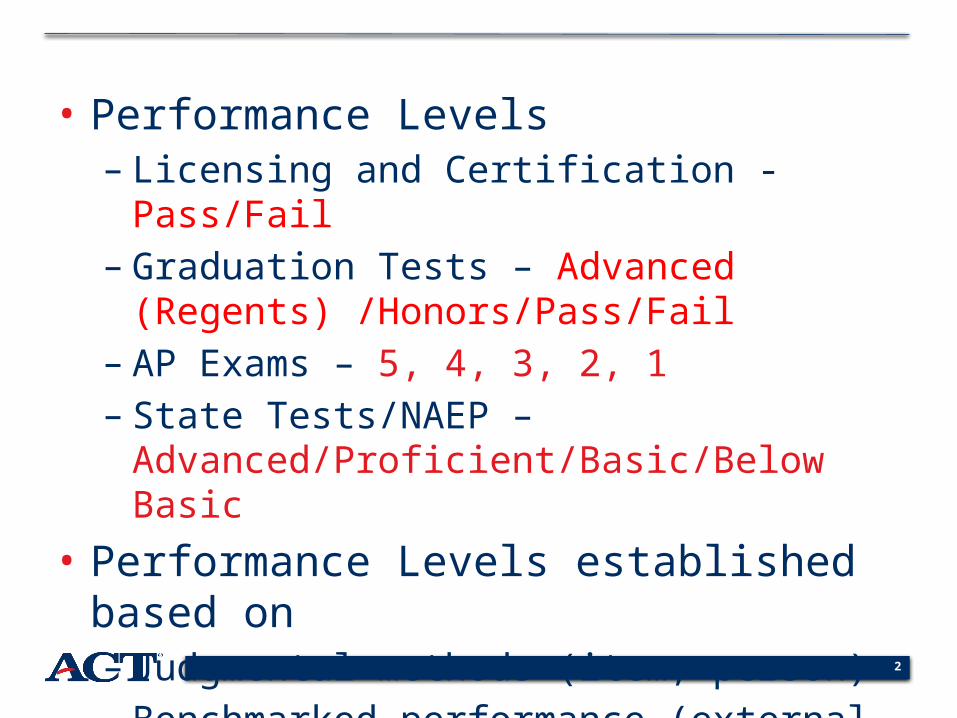
• Performance Levels– Licensing and Certification - Pass/Fail– Graduation Tests – Advanced (Regents)
/Honors/Pass/Fail– AP Exams – 5, 4, 3, 2, 1– State Tests/NAEP –
Advanced/Proficient/Basic/Below Basic
• Performance Levels established based on – Judgmental methods (item, person) – Benchmarked performance (external data)

3
Content – performance level (Proficient Ohio Graduation Test, 2006)
Students performing at the Proficient level apply mathematical concepts, terms and properties to problem situations. Most times, students can solve problems with two or more steps or decision points. They usually make appropriate decisions about what to do and can use informal reasoning and problem-solving strategies. Students typically can interpret or provide a visual or symbolic representation to match a problem situation and purpose. Students communicate mathematical thinking and solutions using a combination of informal and mathematical language.
Performance level descriptors

4
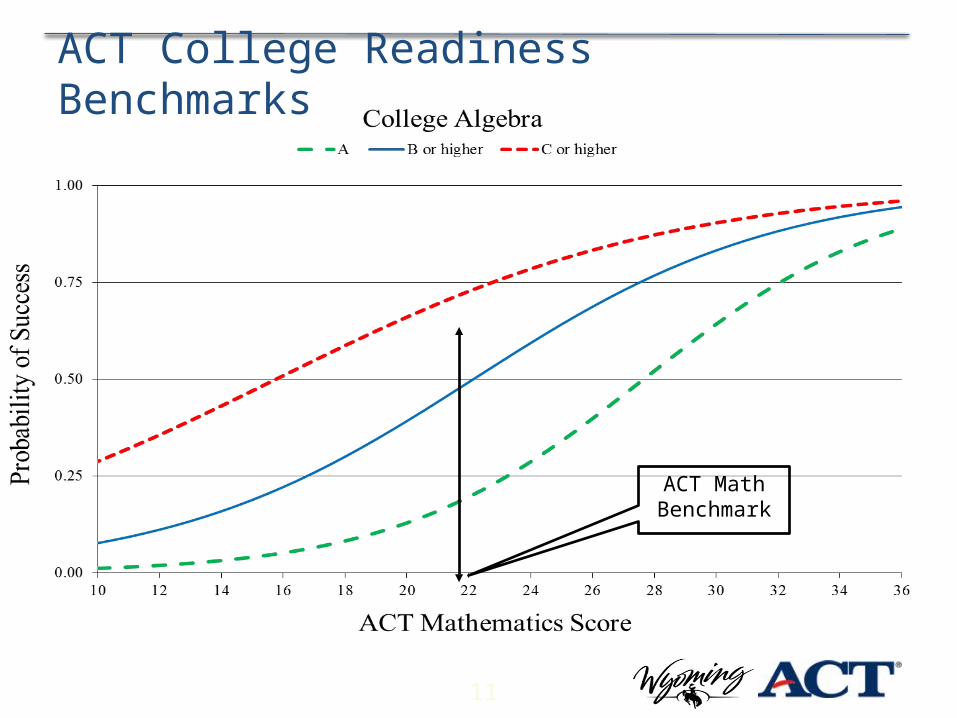
Empirical benchmark (ACT, 2013):
Students attaining the College Readiness benchmark have a 50% probability of attaining a grade >B and a 75% probability of attaining a grade > C in college algebra <entry level credit bearing course> across a nationally representative sample of colleges.

5
• Item difficulty (p-values)• Gap between actual and perceived item difficulty• Internal consistency of raters (as a group, consistency of
individual rater to other raters)
_______________________________________________• Impact on total group (% in each category or passing)• Impact of subgroups (differential impact)• Trends – across years, subjects, grades, regions
_______________________________________________• Within tables and across tables• The timing of the data (after ratings, before next rating,
Policy panel, State Board)
Data Incorporated into Judgmental Processes
6
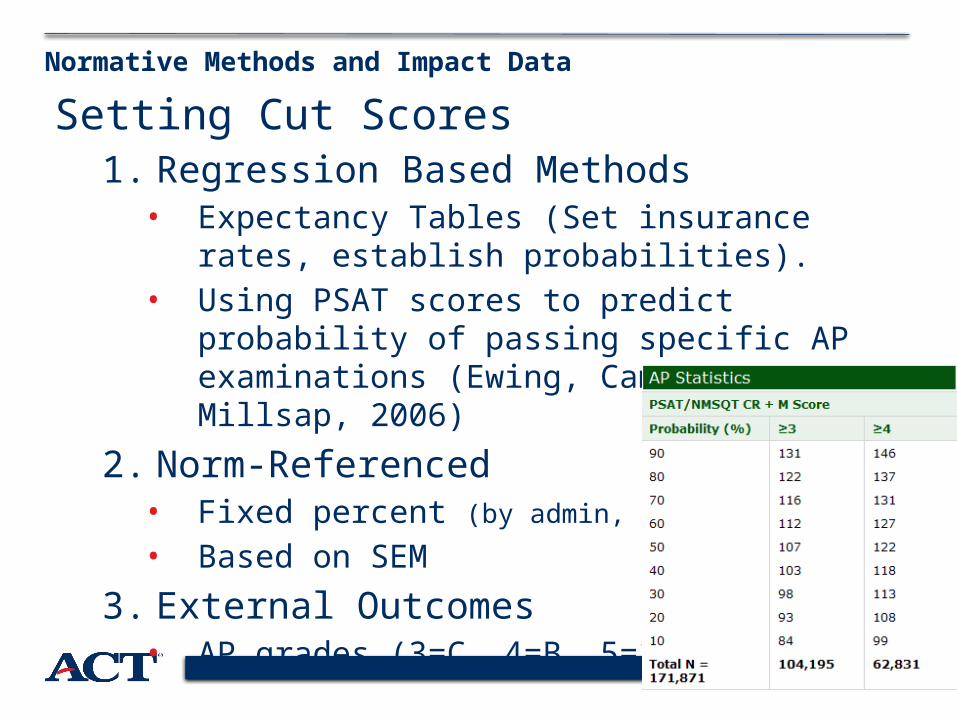
Setting Cut Scores1. Regression Based Methods
• Expectancy Tables (Set insurance rates, establish probabilities).
• Using PSAT scores to predict probability of passing specific AP examinations (Ewing, Camara & Millsap, 2006)
2. Norm-Referenced• Fixed percent (by admin, study))
• Based on SEM
3. External Outcomes• AP grades (3=C, 4=B, 5=1)
Normative Methods and Impact Data

7
8
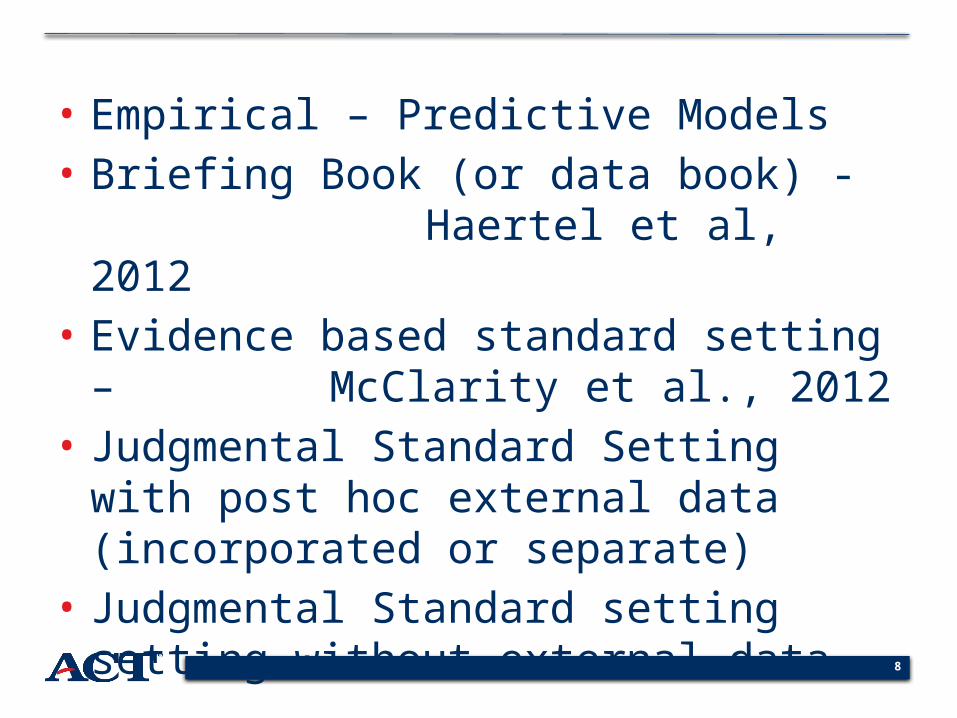
• Empirical – Predictive Models• Briefing Book (or data book) -
Haertel et al, 2012• Evidence based standard setting –
McClarity et al., 2012• Judgmental Standard Setting with post
hoc external data (incorporated or separate)
• Judgmental Standard setting setting without external data
9
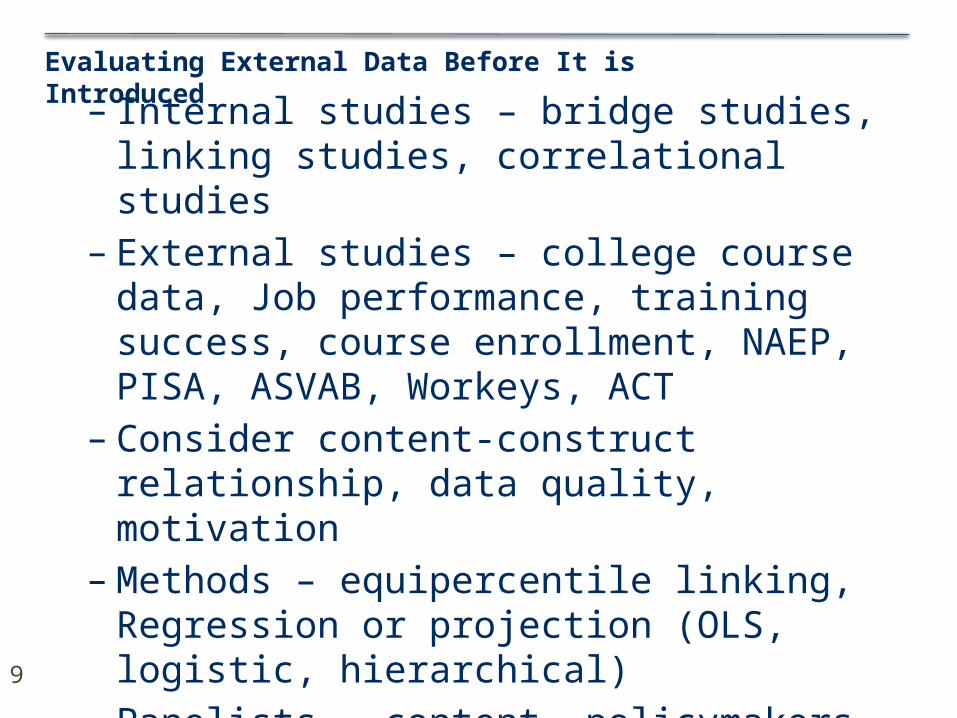
– Internal studies – bridge studies, linking studies, correlational studies
– External studies – college course data, Job performance, training success, course enrollment, NAEP, PISA, ASVAB, Workeys, ACT
– Consider content-construct relationship, data quality, motivation
– Methods – equipercentile linking, Regression or projection (OLS, logistic, hierarchical)
– Panelists – content, policymakers, horizontal vs vertical lines of expertise
– Setting neighborhoods vs cut scores
Evaluating External Data Before It is Introduced
9

10
Three Methods of Incorporating Outcome Data in Standard Setting
10
Final Cut Scores
At end of rating process (Round 2 of 3) show panelists relevant outcome data along with any other impact data, and allow discussion. Outcome Data
as Impact with Standard Setting
Panel
Bring a wide range of outcome and correlational data to the table.
Data Collection
Bring relevant outcome data to a separate policy panel changed with evaluating the standards / cut scores before acceptance.
Outcome Data with Separate Policy Panel
11
ACT College Readiness Benchmarks
ACT Math Benchmark

12
ACT Test
(1-36)
Freshmen Course
(50% B + 75% C)
2005 2013 Benchmark2013
(2005)
% Meeting
2013 Cohort
Logistic Reg Slope Coeff.
English English Comp. 0.120 0.132 18 79%
Math College Alg. 0.195 0.204 22 73%
Reading Social Science 0.109 0.135 22 (21) 74%
Science Biology 0.169 0.201 23 (24) 77%

ROUND 1 PROFICIENT LEVEL RATING FORM*
13
A prob
B or higher prob
C or higher
prob
WY State National
2013 2014 20130.13 0.40 0.67 42 42 510.15 0.42 0.68 39 40 500.16 0.44 0.69 37 38 480.17 0.46 0.71 35 36 470.19 0.48 0.72 33 35 450.20 0.50 0.73 31 34 430.22 0.52 0.74 30 31 410.24 0.54 0.76 29 29 390.25 0.56 0.77 27 27 370.27 0.58 0.78 25 25 350.29 0.60 0.79 22 23 320.32 0.62 0.80 20 20 30
* This is the math rating form. The reading and science forms will have slightly different probabilities and percentages.

ESTABLISHING CUT SCORES FOR FOUR LEVELS OF ACHIEVEMENT
To divide the achievement scale into Below Basic, Basic, Proficient, and Advanced, we will focus on the lower borderline of each achievement level.
Basic Proficient
Advanced
Basic Proficient AdvancedBelow Basic
Low College and Career Ready High
Lower Borderline
Basic
Lower Borderline Proficient
Lower Borderline Advanced
14

PROFICIENT ACHIEVEMENT LEVEL
First, we will focus on the lower borderline of the Proficient achievement level.
Basic Proficient
Advanced
Basic Proficient AdvancedBelow Basic
Low College and Career Ready High
Lower Borderline
Basic
Lower Borderline Proficient
Lower Borderline Advanced
15
1616
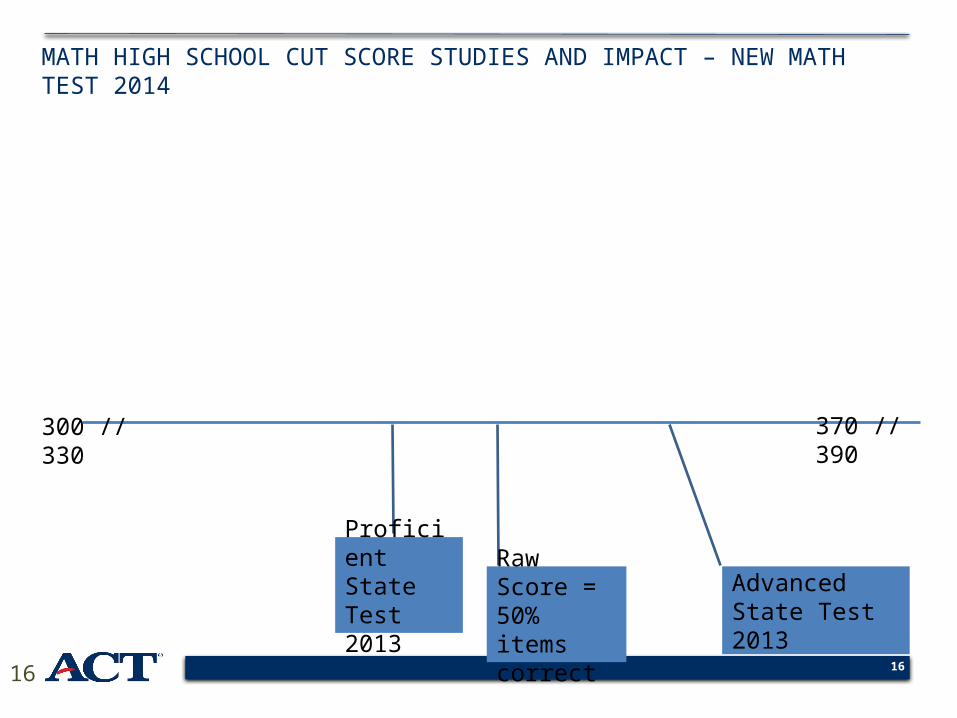
370 // 390 300 // 330
Proficient State Test 2013
Advanced State Test 2013
Raw Score = 50% items correct
MATH HIGH SCHOOL CUT SCORE STUDIES AND IMPACT – NEW MATH TEST 2014
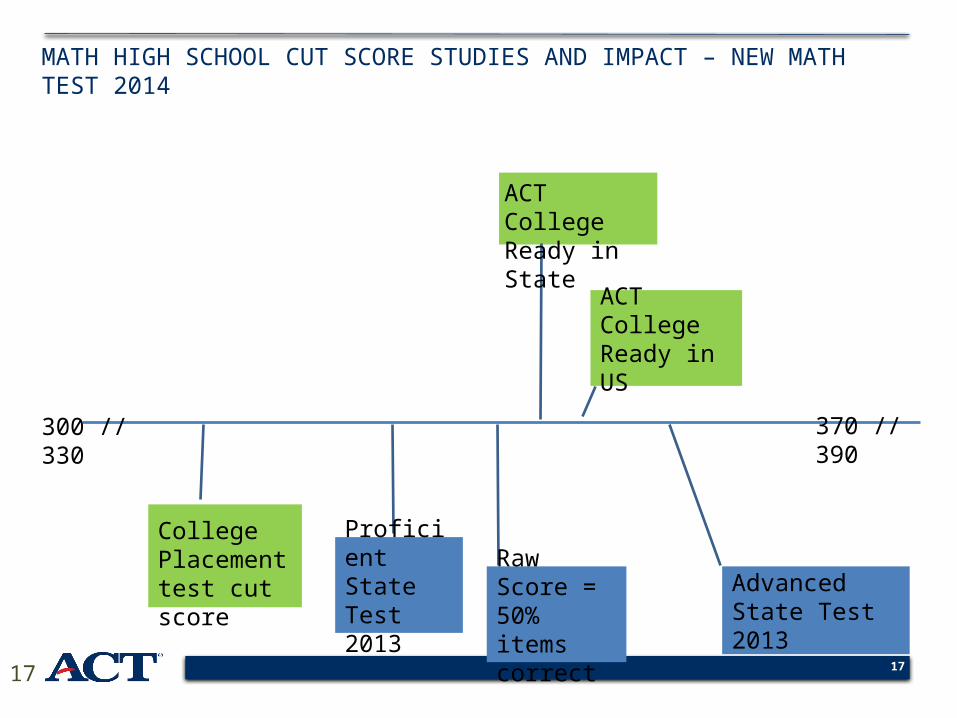
1717
ACT College Ready in State
370 // 390 300 // 330
Proficient State Test 2013
ACT College Ready in US
Advanced State Test 2013
College Placement test cut score Raw Score =
50% items correct
MATH HIGH SCHOOL CUT SCORE STUDIES AND IMPACT – NEW MATH TEST 2014

1818
ACT College Ready in State
370 // 390 300 // 330
NAEP Proficient
NAEP Advanced
Proficient State Test 2013
ACT College Ready in US
Advanced State Test 2013
College Placement test cut score Raw Score =
50% items correct
MATH HIGH SCHOOL CUT SCORE STUDIES AND IMPACT – NEW MATH TEST 2014
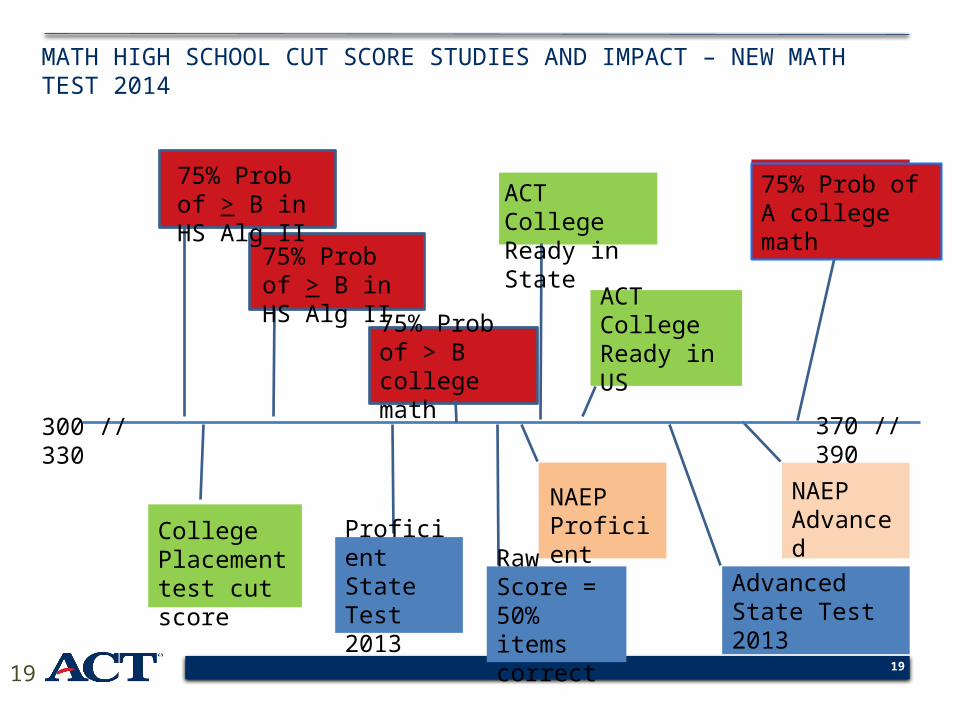
1919
ACT College Ready in State
370 // 390 300 // 330
NAEP Proficient
NAEP Advanced
Proficient State Test 2013
ACT College Ready in US
Advanced State Test 2013
75% Prob of > B college math
75% Prob of A college math
75% Prob of > B in HS Alg II
College Placement test cut score Raw Score =
50% items correct
75% Prob of > B in HS Alg II
MATH HIGH SCHOOL CUT SCORE STUDIES AND IMPACT – NEW MATH TEST 2014
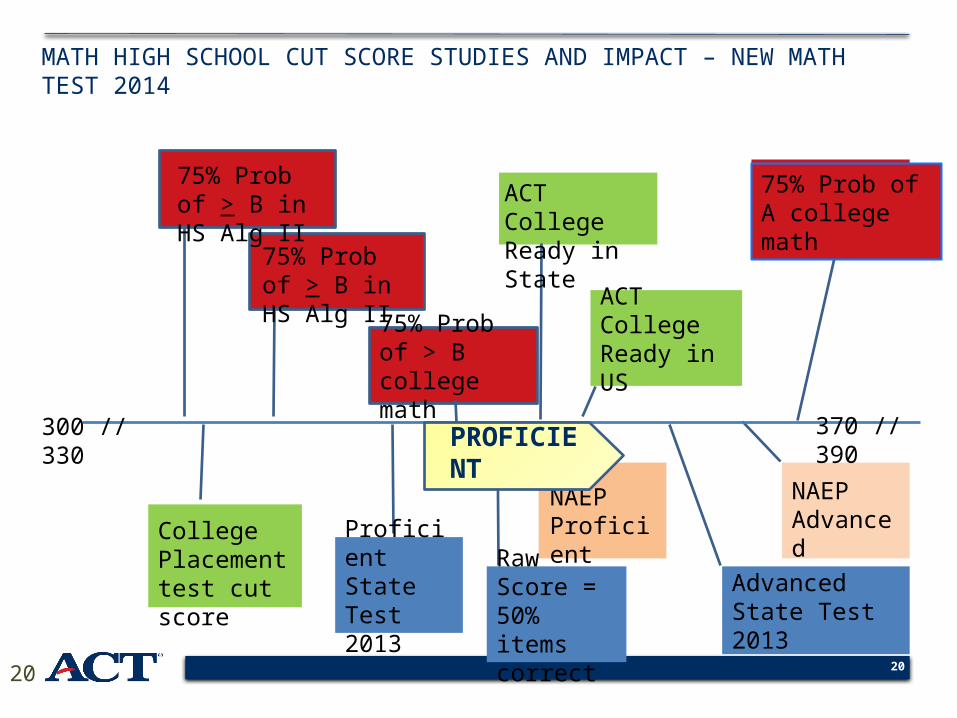
2020
ACT College Ready in State
370 // 390 300 // 330
NAEP Proficient
NAEP Advanced
Proficient State Test 2013
ACT College Ready in US
Advanced State Test 2013
75% Prob of > B college math
75% Prob of A college math
75% Prob of > B in HS Alg II
College Placement test cut score Raw Score =
50% items correct
75% Prob of > B in HS Alg II
MATH HIGH SCHOOL CUT SCORE STUDIES AND IMPACT – NEW MATH TEST 2014
PROFICIENT
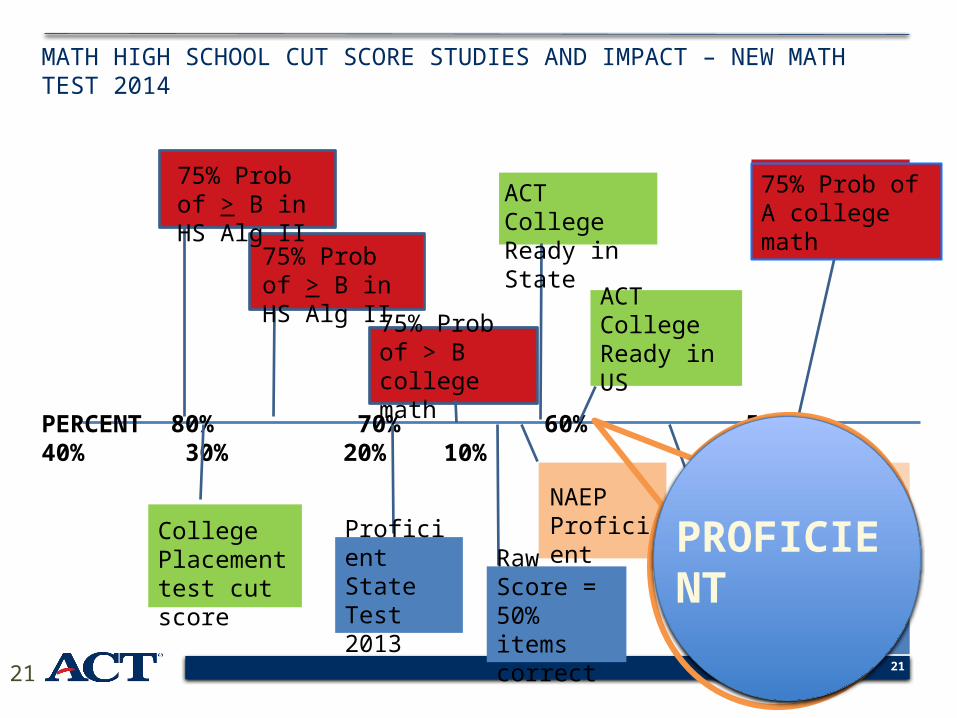
2121
ACT College Ready in State
PERCENT 80% 70% 60% 50% 40% 30% 20% 10%
NAEP Proficient
NAEP Advanced
Proficient State Test 2013
ACT College Ready in US
Advanced State Test 2013
75% Prob of > B college math
75% Prob of A college math
75% Prob of > B in HS Alg II
College Placement test cut score Raw Score =
50% items correct
75% Prob of > B in HS Alg II
MATH HIGH SCHOOL CUT SCORE STUDIES AND IMPACT – NEW MATH TEST 2014
PROFICIENT
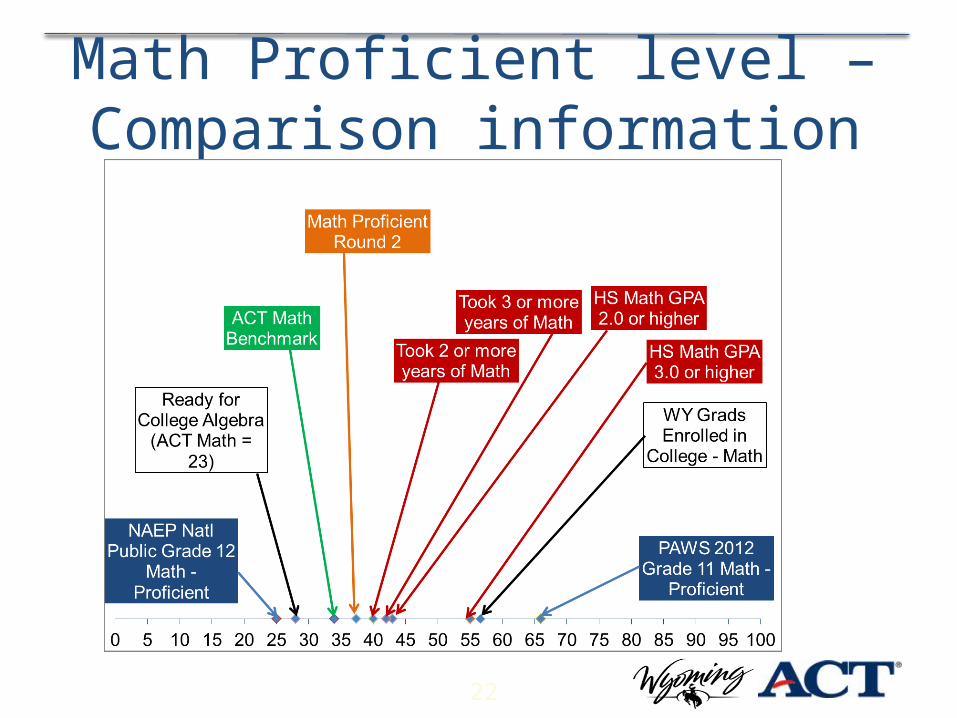
22
Math Proficient level – Comparison information

23
ACT – WY Empirical Standard Setting Results
ACT Score ProbabilityPercentage at or
Above
AB or
higher C or
higherNational
2014Wyoming
2014Mathematics
Advanced 27 0.46 0.73 0.85 16 10Proficient 21 0.16 0.44 0.69 47 39Basic 16 0.05 0.22 0.51 85 83
ReadingAdvanced 28 0.38 0.69 0.85 19 14Proficient 23 0.22 0.53 0.76 39 34Basic 17 0.11 0.33 0.63 75 70
ScienceAdvanced 29 0.47 0.77 0.91 8 6Proficient 23 0.18 0.49 0.77 37 32Basic 18 0.07 0.26 0.59 73 70

24
ACT – WY Empirical Standard Setting Results
Math Reading Science0%
10%
20%
30%
40%
50%
60%
70%
80%
90%
100%
1730 30
4436 38
29 2026
10 14 6
Percent of Students at Each Achievement Level
Below Basic Basic Proficient Advanced