Employer Learning, Labor Market Signaling and the Value of ...conference.iza.org ›...
28
Employer Learning, Labor Market Signaling and the Value of College: Evidence from Resumes and the Truth Daniel Kreisman Georgia State University Jonathan Smith Georgia State University Bondi Arifin Ministry of Finance Republic of Indonesia July, 2018 DRAFT: NOT FOR CIRCULATION Abstract We ask what resume content can teach us about labor market signaling and the value of college credits and degrees. To do so we scrape a large corpus of resumes from an online jobs board and match these with actual records of college attendance and graduation from the National Student Clearinghouse. We then observe whether job seekers strategically omit schools they did not graduate from, and what worker and school characteristics predict this. These exercises serve three purposes. First, they provide novel evidence of job seekers’ valuation of non-completed degrees vis-a-vis the negative value of dropping out by school and job-seeker characteristics. Second, these results allow us to test assumptions relied upon in standard models of returns to schooling, labor market signaling and employer learning. Lastly, they permit a weak test of the signaling vs. human capital value of omitted schooling by observing employment differentials between omitters and non-omitters. Keywords: Returns to Schooling; Signaling; Resume; Employer Learning; Statistical Discrimination; Jobs Board. JEL: J01, J24 This work does not represent opinions of the College Board. Corresponding author: Kreisman at [email protected]. 1
Transcript of Employer Learning, Labor Market Signaling and the Value of ...conference.iza.org ›...

Employer Learning, Labor Market Signaling and the Value of
College: Evidence from Resumes and the Truth
Daniel KreismanGeorgia State University
Jonathan SmithGeorgia State University
Bondi ArifinMinistry of Finance
Republic of Indonesia
July, 2018
DRAFT: NOT FOR CIRCULATION
Abstract
We ask what resume content can teach us about labor market signaling and the value of college creditsand degrees. To do so we scrape a large corpus of resumes from an online jobs board and match these withactual records of college attendance and graduation from the National Student Clearinghouse. We thenobserve whether job seekers strategically omit schools they did not graduate from, and what worker andschool characteristics predict this. These exercises serve three purposes. First, they provide novel evidenceof job seekers’ valuation of non-completed degrees vis-a-vis the negative value of dropping out by schooland job-seeker characteristics. Second, these results allow us to test assumptions relied upon in standardmodels of returns to schooling, labor market signaling and employer learning. Lastly, they permit a weaktest of the signaling vs. human capital value of omitted schooling by observing employment differentialsbetween omitters and non-omitters.
Keywords: Returns to Schooling; Signaling; Resume; Employer Learning; Statistical Discrimination;Jobs Board.JEL: J01, J24
This work does not represent opinions of the College Board. Corresponding author: Kreisman at [email protected].
1
1 Introduction
The degree to which formal schooling imparts skills to potential workers or simply serves as a signal of
pre-existing ability is a perennial question in economics, one that has nearly spawned its own literature.
Policy concerns are not far behind. If schooling does little more than help employers distinguish productive
from unproductive workers, ex ante, one might argue that large public subsidies for post-secondary schooling
are hard to justify (Spence, 1973), even if there are efficiency gains to be had (Stiglitz, 1975). The theory
underlying this story of schooling as screening is relatively intuitive. Employers have limited information
about potential employees’ actual productivity at time of hire, in particular for inexperienced workers. In the
absence of this information, employers rely on observable worker characteristics they believe to be indicative
of productivity; for example schooling. Then, as workers gain experience the market observes increasing
signals of their true productivity and wages converge on marginal product. This intuitive result comes from
the vast employer learning and statistical discrimination literature (EL-SD for short), beginning with seminal
work by Farber and Gibbons (1996) and Altonji and Pierret (2001) [FG and AP hereafter].
We draw out a subtle yet important point. These authors and the many that follow (Araki et al., 2016;
Arcidiacono et al., 2010; Bauer and Haisken-DeNew, 2001; Kahn, 2013; Lange, 2007; Light and McGee,
2015a; Mansour, 2012; Oettinger, 1996; Schönberg, 2007), all assume either implicitly or explicitly that
schooling is readily and accurately observed by employers. We ask whether this is the case, what implications
follow if this assumption is not in fact true, and what we can learn about the value of schooling from
job-seekers who misrepresent their true education. We are primarily concerned about the case of selective
omissions by college dropouts. Among first-time, full-time four-year students, fewer than 60 percent graduate
within six years. Among two-year students, completion within three years is below 30 percent. Rates are even
lower for part-time students.1 In fact, according to the National Student Clearinghouse and the Bureau of
Labor Statistics, over the past 20 years more than 32 million Americans have dropped out of college.2 What
do these former students tell potential employers?
Building on the signaling literature, we assume that attending college but not completing (i.e. dropping
our) gives employers two signals. One positive – attending some schooling and potentially gaining associated
human capital, and one negative – dropping out, which might be indicative of non-cognitive skills correlated
with productivity as in Heckman and Rubinstein (2001) and Heckman et al. (2006). We then make predictions
as to when the negative signal of the latter might outweigh the positive signal of the former. We expect that
the difference between the positive and negative signals is increasing in school/signal quality and duration of
schooling, implying that students who attend lower quality schools or programs, for shorter periods of time,
are more likely to hide these experiences from their employers.
Testing this hypothesis – that some job seekers strategically omit schooling – requires a match of two
sources of data, one showing what job seekers reveal to employers, and another showing the truth. We have
both. For the former we take the most salient and recognizable signal for new hires – resumes, which we
scrape from a large, national online jobs boards. For the latter, we match these resumes to data from National1These statistics come from National Center for Educational Statistics’ 2016 Digest of Education Statistics for the 2009 starting
cohort in four-year colleges and the 2012 starting cohort in two-year colleges.2Shapiro et al. (2014).
2
Student Clearinghouse (NSC) and the College Board. NSC data contain records of college enrollment and
completion, including enrollment that does not result in a degree, which serves as our comparison to the
schooling reported on the resumes. The College Board data provide demographic and test score results on
the millions of students each year between 2004 and 2014 who took the SAT, PSAT or AP exams. We focus
on resumes that list their high schools so we have one more piece of information to match beyond name.
We also focus on males to ensure that whether we match on name is unaffected by marriage. As such, our
analyses focus on somewhat medium-skilled, male job seekers, all of whom started college with the majority
not completing.
We find that fully 29 percent of resumes from our matched sample of early career job seekers omit
the one and only college they attended in administrative schooling records.3 We also find that omission is
systematically related to schooling characteristics, suggesting that omitting schooling is a strategic decision,
but unrelated to characteristics about the individual. More specifically, students who earn a degree or enroll
for two years almost never omit schooling. Students who attend colleges with an average PSAT of enrollees
that is approximately one standard deviation higher than another college are 3 percentage points (10 percent)
less likely to omit the school from their resume. In addition, each year of experience in the labor market
increases the likelihood of omitting. Job-seeker race and scholastic ability have no predictive value. Each
of these results is not only consistent with our theoretical predictions, but also provides novel empirical
information on how former students perceive the value of their (partially completed) schooling. In this view,
the simple takeaway is that students who completed fewer than two years of schooling in lower quality
schools, particularly in two-year colleges, feel they are more likely to get a job if they say they never went in
the first place.
This primary finding – that nearly one-third of our sample omits some post-secondary schooling –
suggests that there are second order implications for the class of EL-SD models in the spirit of FG and AP,
in addition to related literatures on the speed of employer learning, sheepskin effects, returns to credits and
even resume audit studies. More interestingly, it turns out that by testing, and confirming, this assumption
about selective omissions, a weak test of the signaling versus human capital value of (partially completed)
college falls out. The intuition for which is simply an extension of the intuition behind FG and AP. If some
college dropouts omit their college attendance from their resumes, then this portion of their schooling is
observable only to the econometrician, and not the employer. In turn, if this schooling imparted human capital,
then as employers learn over time, the econometrician should observe a less negative relationship between
schooling and wages over time (and a less positive relationship between wages and test scores over time) for
omitters. If in fact these educational experiences imparted little or no human capital, they should not register
in the researcher’s wage equation and wage gradients will be the same between omitters and non-omitters.
We cannot explicitly estimate such a model on wages as we do not observe them, but we can observe the
relationship between omitting and non-employment spells, constructed from work histories on resumes. We
find that conditional on enrolling in similar colleges for similar lengths of time, omitting schooling does not
increase non-employment. This implies that job seekers who omit schooling are not worse off for doing so.
We also consider an additional point – that job seekers can lie; in fact, many do. According to ADP,3We limit our primary analysis to those attending only one school for simplicity, and to those who attended an NSC institution.
3

who conduct background checks, of 2.6 million checks they conducted in 2001, 41 percent lied about their
education with 23 percent falsifying credentials or licenses (Babcock, 2003; Wood et al., 2007). We confirm
this result in our data, finding that 20 percent lie about college, and go further by demonstrating that both
college quality and field of study listed on resumes are statistically related to the probability of lying. For
example, students who actually attend four-year colleges are more likely to lie about earning a degree than
high school graduates are to lie about attending college at all. Moreover, students are least likely to lie about
earning a degree in easily verifiable fields, such as health care, education and technical trades, and are most
likely to lie about a degree in liberal arts and social sciences, and in particular business.
While we frame our results in terms of a broad literature on employer learning and statistical discrim-
ination, and returns to college, at its core this paper demonstrates the power of an untapped resource for
researchers in resumes. While work has begun to emerge using data from online jobs boards (Deming and
Kahn, 2018; Helleseter et al., 2016; Hershbein and Kahn, 2016; Kuhn and Shen, 2012; Marinescu, 2017),
these studies exploit job posting information, providing little insight into what job seekers put on resumes
and hence what employers observe. How job seekers present themselves to employers holds vast potential
for study, and the explosion of online jobs boards provides untold information on tens of millions of job
seekers. In addition to ours, three papers have taken up this opportunity, though in different circumstances.
Shen and Kuhn (2013) and Kuhn and Shen (2015, 2016) use data from a private sector jobs board in a
mid-sized Chinese city to study signaling and hiring dynamics in China, in particular with respect to gender
and migrant status. To our knowledge, ours is the first example of such research in the U.S., the first using a
large, national jobs board, and the first to match resumes to administrative records. Thus, we aim not only to
provide insights into key questions about returns to skill in the labor market, but also to demonstrate that
online resume postings are a potential source of “big data” for future research on employment, skills and
labor market dynamics.
2 Data
We begin with a description of the several sources of data we use throughout the study. Our research requires
both a sample of resumes and a way to verify information on these resumes. We gather the former from a
large online jobs board that makes job seekers’ resumes observable to employers. The latter comes from
National Student Clearinghouse (NSC) and College Board (CB) data. We describe the scraping, matching
and data cleaning procedures below, in addition to information available from each dataset.
2.1 Resumes
We create our corpus of resumes from a large online jobs board. The board allows employers to list vacancies
and also serves as an aggregator of job postings elsewhere on the web. For job-seekers, the service is free to
use. To access the site, job-seekers sign up with their name, location (city and state), an email address and
phone number4 and can then choose whether to make their resume private or public. All resumes made public
can then be searched by potential employers (and researchers).4We do not see email or phone numbers.
4
We collect over 561,000 resumes from the online jobs board. Our scraping procedure takes the most
recent 1,000 resumes from each zip code in each of the largest 100 US cities. We then normalize the number
of unique resumes taken from each city to the size of the city, allowing us to economize on scraping time. We
scrape only males by first extracting names from the web site query and keeping only those which have a
probability near one of being male according to social security files. The reason for this is that women are
more likely to change their surnames in marriage which would make matching to college records difficult
and limit us to females who never changed their name. We also limit to those with fewer than six years of job
experience to limit to early career workers and to get us closer to the sample that is in CB data, which date
back only to the early 2000’s. Because job seekers enter all information into uniform fields, we are able to use
the web site’s metatags to parse out each field, meaning that we are not text scraping, but HTML scraping.
This means we have no errors in the information we take from each resume.
Job seekers are asked to list work experience sequentially, including job title, company, location, start
and end dates and a description of duties and accomplishments. They also asked to create an entry for each
school they attended, including school name, degree, field of study, location, and start and end dates. There
are then several additional fields job seekers can fill out to augment their virtual resumes, including skills,
their objective, their eligibility to work in the US, willingness to relocate, and an option to add additional
information.
2.2 College Board and National Student Clearinghouse Data
We match these to College Board data from the graduating high school cohorts of 2004 to 2014, which
provide demographic and background information on our students who ultimately become job seekers. The
College Board administers PSAT/NMSQT (PSAT), SAT, and Advanced Placement (AP) across the country.
The PSAT is often thought of as a precursor to the SAT, which is one of two college entrance exams, but
it also qualifies students for scholarships and other awards; in many schools it is taken by all students. AP
exams follow a year long high school course in one of over 30 subjects and mastery on the exams can lead to
college credit at most postsecondary institutions. Combined, our data include the approximately three million
students per high school cohort who take at least one of the PSAT, SAT, or an AP exams. We primarily use
data on the PSAT as a measure of students’ academic ability, in addition to race/ethnicity, and high school.
The PSAT consists of three multiple choice sections – math, critical reading, and writing. Each section is
scored between 20 and 80 for a total score range of 60 to 240. The PSAT is offered once a year in October and
most frequently offered at students’ high schools. Race/ethnicity is self-reported but high school is typically
not, since schools often bulk register their students.
Our College Board data is augmented with records from the National Student Clearinghouse (NSC),
which contain information on the college enrollment of approximately 94 percent of college students in the
U.S. The most notable deficiency is for-profit college enrollment, though many are included, included several
of the largest providers. The data track all spells of enrollment at participating colleges, whether students
graduate, and degree recorded if they do. The data are merged to CB data such that we have NSC data for the
over 20 million students who interacted with CB over the sample period.
Lastly, we supplement these with information about the colleges students enrolled in through the Integrated
5
Postsecondary Education Data System (IPEDS). IPEDS is a national database of postsecondary institutions
and we make use of whether the institution is a two or four year college and the average SAT of students
enrolled. We also follow Smith and Stange (2016) for a measure of peer and potentially college “quality” that
is available across the two and four-year sectors- average PSAT of enrolled students. This is calculated from
all PSAT takers in a given year, not just our analytic sample, who first enroll in these colleges.
2.3 Matching Resumes to the Truth
We take a conservative approach to our matching process of resumes to College Board and NSC data in order
to limit false positives. We match on exact first and last name, high school (name and location in case of
duplicate names), and high school graduation year, all of which are listed for students taking any CB product.
We also restrict the high school graduation year from the two sources to be within one year of each other.
Thus, we would obtain a false positive match if two individuals both went to the same high school, graduated
within two years of one another, and had the exact same first and last name. Limiting to exact year limits
matches but has no effect on empirical results.
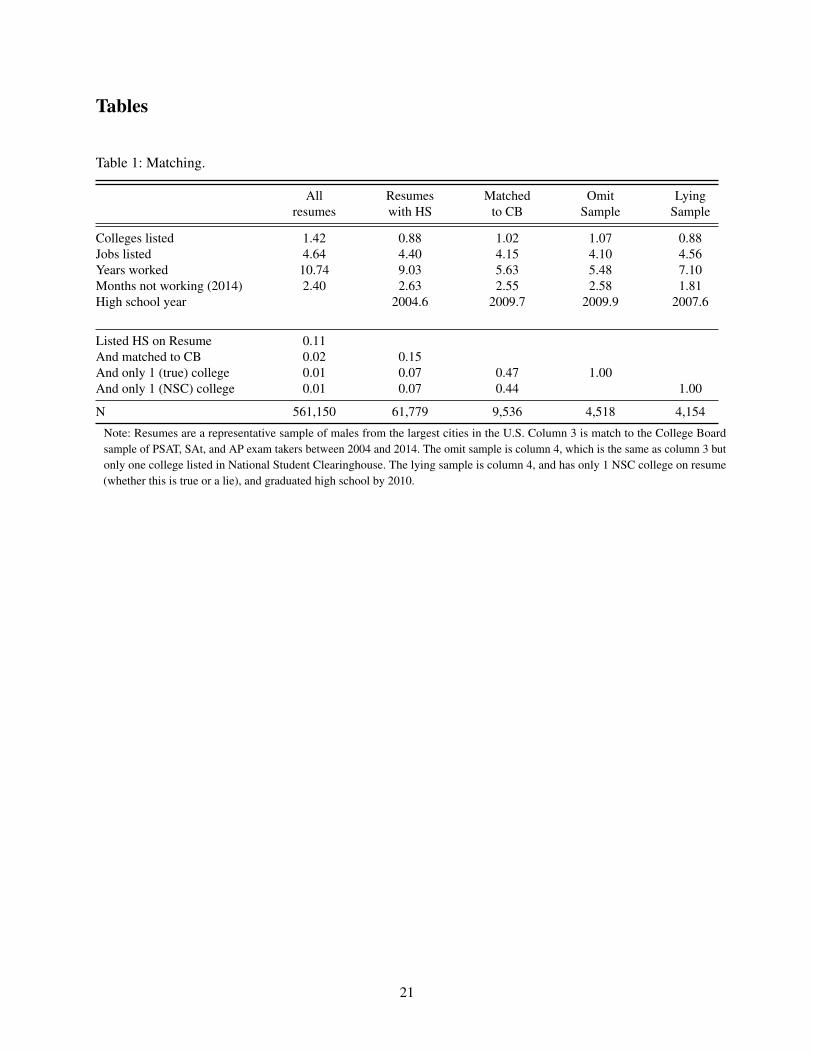
Table 1 shows limited summary characteristics of the full corpus of resumes and our matched sample.
Column 1 shows characteristics for the more than 561,000 resumes we scrape. On average, job seekers
listed 4.6 different jobs, had an average of 10 years of work experience, and listed 1.4 post-high school
experiences, most of which are college. To take a representative year, we found that on average these current
job seekers were not working for 2.4 months on average in 2014. In column 2 we show summary statistics for
the approximately 62,000 (11 percent of the full scrape) who listed a high school and a graduation year on
their resume. These workers have less experience and fewer colleges listed, but are in other respects quite
similar. In column 3 we then restrict to the roughly 9,500 those who listed a high school who also were found
in the college board (2 percent of the full scrape, 15 percent of those with a HS and graduation year listed).
To match, job seekers would have had to have taken the SAT, PSAT or an AP course between 2004 and 2014,
limiting the matched sample to younger applicants. Whether we are able to match resumes to College Board
records depends on several factors. First, many of the non-matches may not have interacted with the College
Board, either because their school did not offer these exams, which is more common in states that take the
ACT over the SAT, or because the students are typically positively selected into such exams and the students
who list high school on their resume are negatively selected. Our match rates are indeed much higher in “SAT
states”. Second, many job-seekers may have interacted with the CB, but before our records begin in 2004. We
try to limit our scrape to resumes with fewer than 6 years of experience to focus on early career workers who
are more likely to match to our data, but this limitation is imperfect and we get older workers as well. Third,
students may list their name differently on the two sources. There may be nicknames or misspellings, each of
which is exacerbated by the fact that the names are entered at different stages in people’s lives and potentially
by different people (e.g., parent or school counselor). We find only a slight decrease in the number of jobs
listed, and little difference in months unemployed in 2014, but a large decrease in working experience, and
increase in the number of colleges listed (one on average). The average and median high school graduation
year for this sample is 2009/10, as opposed to 2004/05.
To form our primary analytic sample, we make two restrictions. First, we only use students who have
6
one college on their NSC record. By doing so, we simplify the thought process of whether to omit or not on
the part of the student. In this case, we are observing whether students omit the one and only college they
attended. This subsequently avoids ambiguity for students who transfer schools. Second, we eliminate a small
fraction of students who could still be enrolled in college, according to NSC. As the fourth column of Table 1
shows, this leaves us with 4,518 observations in our analytic sample on omitting. We then create several key
variables for our analysis from the combined data. Of primary interest is whether a job seeker omitted the
one and only college he attended from his resume. Since our sample size is relatively manageable and typos
and short hand abbreviations are common on resumes, we map each college listed on the resume with each
college listed in NSC records by hand. We define “Omit” equal to one if the resume omits the school from
their resume and zero otherwise.
In addition, we can identify any colleges or other training listed on resumes that are not found in NSC
records. There are a few cases where this arises. The first are colleges not covered by NSC. These are
mostly private and for-profit, though a number of for-profit schools are covered by NSC, including many
of the largest and most well-known. Second, many job seekers list what we call non-collegiate training, for
example Job Corps, or highly specialized job specific training offered by companies or third-party vendors,
for example training on a specific software. We broadly define any such schooling listed on the resume that is
not in NSC as a binary indicator called “Training”. Finally, we create two measures related to unemployment,
taken directly from job seekers’ resumes. First we calculate the number of months not working. To do so,
we take the difference between the last date the resume was updated and the approximate date the student
left college (from NSC), as potential months of work. We then subtract off the work spells as listed in their
work experience, which leaves an estimate of months not working. Second, we take the ratio of months not
working to potential months of work and calculate the “share of months not working”. We note that just
as job-seekers can omit or lie about schooling, job histories are self reported and are similarly subject to
fabrication and omission. If job-seekers who omit schooling are also more likely to inflate work histories,
and if we expect a negative relationship between omitting schooling and employment, our estimates of this
relationship will be biased (upward) toward zero. Because we lack a resource with which we can verify work
histories, we cannot directly address this issue.
3 Omitting Schooling
3.1 Framework
To illustrate our thought process, we begin by assuming that college consists of two periods and those
attending either complete one period of college or two, after which they would earn a degree. We also assume
that job seekers make the decision to put or omit schooling on resumes after schooling is completed. We
characterize the decision to omit schooling on a resume as follows:
Ωij = f(degreeij , qualj , yearsij , experi) (1)
7

where Ωij is the probability job seeker i omits college j from his resume. The question is under what
conditions will someone omit schooling, which is captured by the function f(.). We take this to represent
when job-seekers believe that their chances of employment are higher when schooling is omitted. We assume
that all degree earners, as measured by degreeij , list their highest degree accurately since both the signaling
and human capital components of education incentivize the disclosure of schooling. However, non-completers
are faced with two choices. They can either signal that they completed one period of schooling, simultaneously
signaling that they dropped out, or they can signal that they completed no schooling. By omitting schooling,
omitters hide the dropout signal at the expense of being seen as a high school graduate. This decision will in
part depend on whether (job-seekers believe) employers expect lower productivity from dropouts or high
school graduates. Similarly we can say that job-seekers will omit when they believe employment prospects
are higher by signaling that they are high school graduates, as opposed to college dropouts as below:
1[Ωij ] = PrEmp(hsi, experi) > PrEmp(dropoutij , qualj , yearsij , experi) (2)
First, consider the role of signaling by assuming there is no human capital in schooling. The signaling value
may consists of many of the costs, such as psychic costs, associated with enrolling for one period. Then the
decision to omit depends on the magnitude of the psychic costs. We expect that the psychic costs are larger at
higher quality schools (qualj), since peers and faculty may command, expect, or incentivize more effort to
attain the same grades or outcome relative to lower quality schools. Thus, we expect that the likelihood of
omitting is decreasing in the psychic cost of attending school j. Similarly, within any school we should expect
the likelihood of omitting to be decreasing in years of enrollment (yearsij) since the the psychic costs are
likely cumulative. Similarly, we can consider the role of human capital. Intuitively, if students learn valuable
labor market skills while at school, then human capital increases with the quality and years of education. This
implies that the human capital component of schooling, as measured by qualj and yearsij , would decrease
the likelihood of omitting just as above. Hence, regardless of whether schools impart human capital or not,
omitting should be non-increasing in quality and years enrolled. Finally, drawing from assumptions in FG
and AP that work histories are observable to the entire labor market, and thus the signal value of schooling
declines over time, we can add to the above years of work experience, experi. Those who have more labor
market experience should be more likely to omit schooling.
Note that we have no theoretical predictions concerning the relationship between omitting schooling and
characteristics specific to person i other than experience. The simple framework above describes the decision
simply as a function of characteristics of the signal associated with school j. In our empirical tests below we
can include person level covatiates, such as race and a measure of scholastic ability, to see if this prediction
holds.
8
3.2 Empirical Tests
Here we describe our empirical test of our predictions above. To do so, we estimate the following reduced-form
equation on our matched data:
1[omitij ] = Π(degreeij , 4yearij , psatj , yearsij) + Ψ(experi, train∼j) + Υ(racei, psati) + τt + εij
(3)
where 1[omitij ] is a binary indicator equal to 1 if person i omitted schooling j from his resume. degreeij is
an indicator if i earned a degree from school j. We measure “quality” in two ways – 4yearj is an indicator
if the school i attended is a four-year as opposed to a two-year school, and psatj is the mean PSAT for
attendees of school j. While these are not necessarily measures of quality, they describe some measure of
difficulty or selectivity that employers should be interested in. yearsij are years of schooling set equal to
zero if degreeij is equal to one. Thus the first three coefficients of the vector Π test predictions concerning
school quality, while the last tests a prediction about years attended.
The next set of covariates represent the relationship between experience and omitting, captured in the
coefficient vector Ψ. Our measure of potential experience is years since graduating high school, less years
of schooling. We also include an indicator train∼j if i put any other non-collegiate, post-high school
training/schooling on his resume that are not recorded in our administrative records. Finally, we expect that
conditional on these characteristics, there should be no explanatory power of other individual characteristics,
for example race, on the decision to omit. Similarly, since true ability, which we measure with PSAT score,
psati, is unobserved by employers at time of hire, we can also expect that the decision to omit is uncorrelated
with ability measures observed by the econometrician conditional on qualj , yearsij , and experi. In addition,
we include a set of high school graduation year fixed effects, τt, to capture secular cohort effects.
4 Omitting Results
4.1 Basic Statistics
We begin by showing basic summary statistics for the full sample, and then by omit status. In column 1 of
Table 2 we show means for our 4,518 matched resumes who attend only one school in NSC records. We
find that the sample is largely representative of early career workers in US cities. Our sample is 30% black
and 19% Hispanic. 14% of all scraped resumes are for job seekers who earned a degree. 55% (actually)
attended a four-year institution and the remaining attended a two-year school in our NSC records. This is
higher than the average of all young college attendees, but is likely on par with those who only attend one
school. Additionally, 27% of the sample have some non-NSC schooling listed on their resumes. This can
result either from non-NSC covered colleges, mostly for-profits though the largest of these are covered, or
from other, non-collegiate training such as Jobs Corps, which is more common. The average PSAT score for
the sample is 87.8, which is slightly below the national average. Finally, at the bottom of column 1, we show
that 29% of our sample omit the one and only college they attended listed in our NSC records. We take this
simple statistic as prima facie evidence that a non-trivial share of job seekers omit completed schooling from
9
their resumes. We next ask whether the patterns of omission are selective in a manner predicted by our theory
above.
To this end, in columns 2 and 3 we compare means of omitters and non-omitters respectively. We begin
by noting that 2% of omitters earn a degree, contrary to our prediction, but that these are largely explained by
those who also have other non-NSC training that is a higher degree. We also find that omitters are less likely
to have attended a four-year school in our NSC records, were enrolled for only about 0.7 years on average
(where enrollment is set to 0 for degree recipients), have more experience, went to schools with lower average
SAT scores and were more likely to have other training listed on their resumes. Thus, our mean differences
all correspond to predictions above.
Additionally, we find that omitters were more likely to be minority and had lower SAT scores themselves.
These run counter to our predictions that individual characteristics beyond experience should predict omis-
sions. But, minorities and those with lower SAT scores are more likely to attend lower quality schools, thus
conditional on school quality measures, we expect effects of race and individual SAT score not to predict
omission. This leads us to our reduced form estimation.
4.2 Regression Results
In Table 3, we present the estimates from Equation 3, which shows the relationship between the probability
of omitting with college and student characteristics. Column 1 contains our college enrollment and quality
measures (the vector Π) – degree receipt, years enrolled, potential experience, whether the school is a four-
year college, and the average PSAT of the college’s enrollees. Our coefficient estimates are all in line with
our theoretical predictions. Earning a degree in itself entirely negates the likelihood of omitting schooling,
reducing the likelihood by 42 percentage-points off of a base of roughly 30. Each year of completed schooling
reduces the likelihood of omitting by nearly 18 percentage points for those who did not earn a degree. This
suggests that two years of schooling would negate the 0.3 probability of omitting, i.e. enough schooling to
earn a two-year degree. Next, those who attended a four-year school were 3 percentage-points less likely to
omit, though this is marginally significant. Lastly, we find that each point in the average PSAT of the school,
a proxy for school quality, strongly decreases the probability of omitting.
In column 2 we add an indicator for the presence of other training. This has little impact on the other
coefficients, though attending a four-year school is smaller and no longer significant (much of this relationship
was absorbed by the school average PSAT score). Other training strongly predicts the likelihood of omitting
suggesting that it is more job seekers are more comfortable omitting schooling when there is an alternative
to highlight. In column 3 we add the student’s PSAT score and find a precisely estimated zero. We find the
same result if we use SAT score instead. In column 4 we include indicators for race and omit the student’s
score PSAT to isolate the relationship, then in column 5 we include all student characteristics. Unlike the
sample means, we find no residual differences in omitting by race once we condition on school enrollment
characteristics.
Taken together, we find strong evidence that school quality, and not individual characteristics, explain
selectively omitting schooling in a manner consistent with a positive signal from school quality and a negative
signal from dropping out of schools with low screening value.
10

4.3 Robustness
To ensure that these results are not driven by sample choices or unique populations, we estimate a small
series of robustness checks. Column 1 of Table 4 re-estimates our main specification from Table 3 for
reference. Then, in column 2, we restrict to those who left schooling before 2014 to test whether students
are lingering in school, finding no differences. In columns 3 and 4 we restrict to those who attended two- or
four-year schools respectively. Here we find that school average PSAT has little value for two-year schools,
as there is far less variation. Nonetheless, this suggests that it may be difficult to signal quality from two-year
institutions. We also find that the coefficient on years enrolled is twice as large for two-year schools compared
with four-year, which corresponds with a story where proportional progress toward degree is the salient
mechanism. In column 5 we limit to non-degree earners with little impact on results. Lastly, in column 6
we omit all resumes where any non-NSC school (train∼j was listed as we cannot perfectly classify each of
these. Comparing coefficients in columns 1 and 6 we find no statistical difference in any case from omitting
this group suggesting that our results are quite robust to these concerns.
5 Theoretical and Empirical Implications
In this section we explore some of the theoretical and empirical implications given our previous findings.
From a theoretical standpoint, our research has direct implications for work that involves employers using
some measure of job seekers’ post-secondary schooling. Most notably, this includes literature on returns
to schooling, signaling, employer learning and statistical discrimination in the labor market, in addition to
literature on “sheepskin” effects (Jaeger and Page, 1996) and even resume audits (Bertrand and Mullainathan,
2004). To illuminate the theoretical implications, we start the section with the basic employer learning model
and then incorporate some of our empirical lessons into a more accurate model. This turns out to offer a weak
test of human capital versus signaling models. We then conclude with an empirical analysis on whether their
is a labor market penalty or reward from omitting schooling.
5.1 Basic Employer Learning Model
We start with the basics of employer learning models in Farber and Gibbons (1996) and Altonji and Pierret
(2001). The intuition is as follows. Econometricians (with panel data) observe ability, schooling, tenure, and
wages over time. Employers observe only schooling at initial hire and then observe (noisily) productivity over
time. If our ability measures (unobserved to employers at hire) are predictive of productivity – they should
become more salient in wage determination over time as ability is (slowly) revealed to employers through
(noisily observed) productivity. Similarly, the relationship between schooling and earnings should decline
over time. The model is as follows. True productivity for worker i with t years of labor market experience is:
yit = rsi + αiqi + Λzi + ηi + H(ti) (4)
where s are productive characteristics observable to both employers and the econometrician. The most
common case is years of schooling, though the literature has been extended to consider school quality as well.
11
q are characteristics observable only to employers not seen by the econometrician, for example reference
letters. z are measures of productivity observed by the econometrician but not the employer at time of hire; in
most cases this is a measure of ability such as the AFQT; we will be able to consider PSAT scores which are
more academic in nature than the AFQT. η are measures observable to neither the econometrician nor the
employer. H(t) is then the structural relationship between experience and productivity which, by assumption,
does not depend on either s or z.
Absent information on z and η, employers create conditional expectations, defined as:5
z = E[z|s, q] = γ1q + γ2s+ ν (5a)
η = E[η|s, q] = α2s+ e. (5b)
Substituting Equations (5a) and (5b) into Equation (4) and rearranging gives information available to
employers at time t = 0:
E(yt|z, q) = s(r + Λγ2 + α2) + q(α1 + Λγ1) + (Λν + e) + H(t) (6)
= E[yt|s, q] + (λν + e) + H(t).
Where (Λν + e) is the employer’s initial error in assessment of true log productivity. As employers receive
information about workers’ true productivity over time, call this informationDit = (di1, . . . , dit), they update
their evaluations of z and η. Then their beliefs at time t can be summarized as above, replacing the initial
error with the conditional expectation given observed productivity up to time t, E[(Λν + e|Dt)]. Following
from this, we can write the log-wage setting model for the firm at time t as:
wt = β1s+ β2q + E[(Λν + e|Dt)] + H(t) + ξt, (7)
where wt is log wage at time t, ξt captures idiosyncratic noise in firms’ observation of true ability, and
H(t) = H(t) + log(E(expµt)) with µ defined as the difference between (Λν + e|Dt)− E[(Λν + e|Dt)],
which is uncorrelated with D, s, and q. As AP point out, Equation 7 shows that wages change over time
both due to increasing productivity resulting from experience, H(t), and due to employers’ updating beliefs
about initial errors in evaluation of productivity through observed output in (Λν + e|Dt). Notably, the
econometrician cannot estimate Equation 7 because q and (Λν + e|Dt) are unobserved in the data. Thus the
familiar log-wage equation used by the econometrician corresponds to available data:
E(wt|s, z, t) = b1s+ b2z + H(t). (8)
Then if wages correspond to Equation 7 and the econometrician estimates Equation 8, AP and others show5Consistent with notation in the literature, we normalize the vector α1 allowing us to suppress q in Equation (5b).
12

that the usual least squares omitted variable bias is:
bst = bs0 + Φst
= [r + Λγ2 + α2] + Φqs + Φst (9a)
bzt = bz0 + Φzt
= Φqs + Φzt, (9b)
where Φqs and Φqz are coefficients from regressions of q(α1 + Λγ1) on s and z respectively, and Φst and
Φzt are coefficients from regressions of E[(Λν + e|Dt)] on s and z.
They then take two assumptions. First that cov(Λν + e, ν) > 0 – that relationship between the error
in employers’ expectation of z conditional on s and q is positively correlated with the total error in their
belief about log productivity. In other words if employers think workers have a high z conditional on s
and q, then initially they will also have too high an expectation of their initial productivity. Second, they
assume that cov(s, z) > 0 – that schooling and z are positively correlated. Given these two assumptions,
they show that when s and z are scalars, for example years of schooling and AFQT in the usual case, then
bzt is non-decreasing in t and bst is non-increasing in t. In other words, as employers learn about workers’
productivity over time the importance of schooling (s) in the wage regression will decline over time and the
importance of skill unobserved by the employer at hire but observable to the econometrician (z) will increase.
To opreationalize this, AP estimate Equation 7 interacting s and z with a measure of experience:
wit = b1si + b2zi + b3(si×t) + b4(zi×t) + εit, (10)
where t are interactions with labor market experience and we take s as highest grade completed. This is the
standard models estimated in the EL-SD literature.
5.2 Employer Learning With Omitted Schooling
Our empirical results above demonstrate that job seekers strategically omit schooling. We now consider what
implications follow for the class of EL-SD models as above. To do so, we begin by rewriting the basic model
from Equation 4 as,
yit = r(Ωis0 + (1− Ωi)s∗i ) + αiqi + Λ(zi,Ωis
∗i ) + ηi + H(ti) (11)
where Ω refers to whether the job seeker omits schooling, from Equation 2. If i omits schooling such that
Ω = 1, then employers observe schooling level s0, the base level of schooling (for example high school).
Then for those who omit, true schooling (s∗i ) is now empirically a z variable. This results in a weak test of the
signaling vs. human capital value of (partially completed) college.6. If omitted schooling has productive value
that employers learn about as workers accrue experience, the gradient with respect to experience will be flatter
(less negative) for omitters as will the gradient on ability (less positive), assuming schooling and ability are6Note that this has no predictions as to the signaling vs. human capital value of a degree, which is better captured in work such as
Clark and Martorell (2014) or Lang and Kropp (1986)
13
positively correlated. Similarly, one would expect that the coefficient on schooling when experience is zero to
smaller for omitters as they should receive a starting wage roughly equal to those who only completed high
school. If, on the other hand, the omitted schooling in fact imparted no productive skills, then the experience
profile with respect to schooling and ability will be no different for omitters than non-omitters.
Unfortunately, conducting this empirical exercise requires four pieces of novel information – reported
schooling on resumes, true schooling from administrative data, a measure of productivity such as a test score,
and a panel of wage histories. We have three of these, but not the last. Fortunately, we can create self-reported
employment spells from our scraped resumes, allowing us to estimate a simple version of the test of the
relationship between omitting and non-employment spells in equilibrium in the following regression,
NonEmpi = α+ βOmiti + ΓXi + ∆Educi + ΠSchoolj + τt + εi (12)
In the model above, Omit is an indicator if job-seeker i omitted his one and only NSC college from his
resume, Xi includes race and PSAT score, Educi includes months of school if no degree and an indicator
for earning a degree, τt indicates high school graduation cohort, and Schoolj are school quality measures
including two- or four-year and the average PSAT score of school j’s attendees. Our dependent variable is the
total number of months not employed since entering the labor market. Thus, we are comparing job histories
of observationally similar job-seekers who graduated from the same cohort and attended similar schools who
did or did not omit schooling.
Results from Equation 12 are shown in Table 5. We find that once we control for factors that predict
omitting, including years enrolled, earning a degree and school quality, omitters have not listed more or fewer
months unemployed than those who list the entirety of their schooling history. This result is consistent with a
story where job seekers only omit schooling that, when coupled with the negative signal of dropping out,
has neither signaling value to employers (in terms of employment) nor human capital. We interpret this as
evidence that these schooling experiences provide little value in the labor market and weak evidence that they
provide little or no human capital.
6 Lying
In a final set of statistics we focus on a well known though not deeply explored phenomenon – the decision
to lie about schooling on resumes. Relative to omitting, lying is the flip-side of the same coin, though with
different theoretical predictions. The decision to lie also includes the probability and cost of being caught. If
we assume the cost is uniform (e.g., fired and some period of unemployment), then the interesting predictions
center on the probability of detection, net of benefits from the positive signal. For example, teaching or
medical professions often require certifications, making detection easy and lying worthless. On the other
hand, having claimed enrollment, but not a degree, in a far-away or online college with a major in liberal
arts may be difficult to detect, though may have little value in the labor market. Perhaps somewhere between
those scenarios, claiming a computer programming degree but not being able to program is easily detectable,
whereas a self-taught computer programmer may have an easier time lying and may in fact gain from it. We
carry this thought process to our analysis of lying, and focus on what job-seekers are most likely to lie about.
14

We focus on what types of degrees job-seekers lie about, as lies about degrees are more common, and are
usually accompanied by information about what the job-seekers (said he) studied. Additionally, because most
who lie about a degree from a school they actually attended, we then have information about the true college
as well. We do observe lies about attendance, and touch o this in our analysis as well for completeness. That
said, our findings here are meant to build on the general understanding that people lie about degrees by asking
what degrees they are most likely to lie about. In this vein, we believe that what we uncover will provide
additional insights for the broad literature on employer learning and returns to degrees.
6.1 Sample, Definition of Lying, and Empirical Model
Staring with over 11,000 resumes matched to College Board data on any three pieces of information (full
name, school and graduation year, including match on college), we focus on the set of students who, according
to their resumes, attended zero or one NSC colleges. We also restrict the sample to students in high school
graduating cohorts prior to 2011 so as to give students adequate time to complete their degrees. This leaves
4,154 job seekers. The final column (5) of Table 1 shows resume attributes relative to the larger resume
sample. These job-seekers are older than the omitting sample, and have fewer colleges listed (by definition),
have more work experience and fewer months not working.
We begin by creating two versions of lies by hand checking resumes with our administrative data to
account for differential spellings or abbreviations of school names and degrees. For lies on colleges attended,
each college on the resume is matched to an IPEDS code and we determine whether it participates in NSC.
If it does, we check whether the college on the resume is in the student’s official NSC record. If not, it is
coded as an attendance related lie. For degree completion lies, we compare whether students list a degree on
their resume to whether NSC has a record of them graduating. If not, then we note a degree lie.7 The text
field in the online jobs platform is relatively flexible and fields for degree and field of study are not always
populated, the latter is often empty for non-degree completers but is normally filled for degree earners. In
our hand coding, we look for any reference to a degree or certificate, including abbreviations, though we do
not consider “diploma” a degree. We allow field of study/major to be in non-mutually exclusive categories,
including: business, education, humanities, social science, engineering or computer science, science, arts,
technology (but not computer science), technical/trade, health, communications, criminal justice and general
studies. Table 6 shows summary statistics for the sample we use to learn about lying.
Overall, we find that just over 20% of the sample lies about either attending or graduating from college.
The ADP study we referenced found 23%. 7% of job seekers in our sample never attended the college listed
on their resume and 16% lie about graduating, while a few job seekers lie about both. Truth-tellers and liars
appear quite similar in demographics, the key difference being that resumes with a lie about schooling come
from students with higher PSAT scores on average. Looking at resume attributes on resumes with a lie, we
find that on school quality is lower for falsely claimed schools (degrees or attendance), and lies are more
likely from 4-year institutions. From a descriptive standpoint, we are interested in what pieces of information
on a resume about colleges are associated with lying, in particular field of study. We consider this using the7College Board matches their data with NSC for six years after high school graduation. Therefore, students who take longer than
six years to complete will appear as non-graduates. This is a relatively small set of students.
15

following equation:
1[lieij ] = Π(HSi∗, 2Y ear∗ij , 4Y ear∗ij , PSAT
∗j ) + Θ(Field∗i ) + Υ(Racei, PSATi) + τt + εij (13)
Above, 1[lieij ] is a binary indicator equal to 1 if person i lied about earning a degree from school j from his
resume. The vector of variables associated with coefficient vector Π describe college going characteristics
where the asterisk indicates that it is information from the resume and need not be necessarily true. The
same is true with field of study, Field. As such, when one of these characteristics is seen on a resume in our
sample, the coefficients should be interpreted as the relative likelihood that it is a lie. We estimate a linear
probability model and in some specifications control for student characteristics and characteristics of the
school the student actually attended.
6.2 Lying Results
Table 7 shows our main lying results from Equation 13 for field of study among degree claimants. All
coefficients should be interpreted in relation to business and management, the omitted field of study. Each
column adds in more controls for job seeker characteristics. We find lies are most likely to be about earning a
degree in Business, Social Sciences and the Humanities. This is consistent with a story where these degrees
have few specific and verifiable associated skills, making it easy to list and hard to verify. We also find lies
are least likely to be about General Studies, Health, Technical and Trade, and Education degrees. The former
might suggest that there is no great incentive to lie about a general degree. Health and Education are fields that
often require certifications employers are required to verify by law. Lying here might be counterproductive.8
Similarly, Technical and Trade degrees are often in fields that impart specific skills, for example precision
machining, which employers could easily verify from observing output.These are often accompanied by
certifications as well. Moving from the first to last columns, we sequentially include characteristics from
resumes and about the job-seekers themselves. We find that lies are about marginally lower quality schools,
but that characteristics about the job-seeker himself have no explanatory power in the decision to lie.
Finally we ask whether lying is associated with improved or diminished (self-reported) employment
histories in Table 8 by largely replicating Table 5 for lying, conditional on various controls. Similar to
omitting, we do not observe a statistical relationship between lying and unemployment, conditional on actual
college enrollment and student characteristics. This suggests that on aggregate liars do not appear to have
better (or worse) employment histories than truth-tellers. Still, there is much we cannot rule out here. We
cannot observe whether workers lie about employment histories too. Certainly many do. Whether this is
correlated with lying about degrees we cannot say. Similarly, we cannot rule out heterogeneity in effects
of lying, for example about health vs. business, and do not have the statistical power to test for it. The null
relationship we observe could very well be the result of some workers getting caught and having worse
employment histories, and some not, resulting in gains. We will have to leave these questions for future
research.8Few job-seekers in our sample have education degrees (true or not), likely reflecting the fact that positions in schools are not
normally secured through online jobs board; hence coefficients here are very noisy.
16

7 Summary
Building on a broad literature about employer learning and statistical discrimination we ask whether job-
seekers strategically omit schooling from resumes and what we can learn about returns to schooling from
their behavior. We show that nearly 30 percent of our sample of scraped resumes omit their one and only
college experience, and that this is predicted by school type and quality, duration and experience, and not by
race or ability as we suggest in our theoretical framework. We also find that lying on resumes is relatively
common and that neither omitting or lying translates into fewer spells of non-employment.
Our results have implications for broader work beyond ours, as well as direct policy relevance. From
the research side, we demonstrate that one of the fundamental assumptions in labor economics does not
always hold. That is, employers may not observe schooling. Sometimes employers may believe workers have
too little schooling (omitting) and sometimes too much schooling (lying). This has clear implications for
employer learning models, reduced form estimates of sheepskin effects and returns to schooling models,
and even resume audits. From a policy perspective, we learn something from omitted schooling. Over the
past 20 years, roughly 31 million students have enrolled and subsequently dropped out of US colleges. In
fact, completion conditional on enrollment in the US is approximately 56 percent for four-year schools,
and only 29 percent for two-year institutions; this is the lowest rate of any OECD country. Given that the
typical US college student is a dropout, we believe studying the return to partially completed schooling is an
important endeavor. The fact that a non-trivial share of job-seekers would rather employers not know that they
ever attended college is telling in itself. Moreover, if wages are in part determined by selective disclosure,
then existing estimates may be wrong. Getting these estimates correct are important as we continue to push
students into higher education with state and federal subsidies.
17
References
Altonji, J. G. and Pierret, C. R. (1998). Employer learning and the signalling value of education. In InternalLabour Markets, Incentives and Employment, pages 159–195. Springer.
Altonji, J. G. and Pierret, C. R. (2001). Employer learning and statistical discrimination. The QuarterlyJournal of Economics, 116(1):313–350.
Araki, S., Kawaguchi, D., and Onozuka, Y. (2016). University prestige, performance evaluation, andpromotion: Estimating the employer learning model using personnel datasets. Labour Economics, 41:135–148.
Arcidiacono, P., Bayer, P., and Hizmo, A. (2010). Beyond signaling and human capital: Education and therevelation of ability. American Economic Journal: Applied Economics, pages 76–104.
Arteaga, C. (2017). The effect of human capital on earnings: Evidence from a reform at colombia’s topuniversity. Journal of Public Economics.
Babcock, P. (2003). Spotting lies reference checks alone won’t protect you from a mendacious job applicant.HR MAGAZINE, 48(10):46–53.
Baert, S. (2018). Hiring discrimination: an overview of (almost) all correspondence experiments since 2005.In Audit Studies: Behind the Scenes with Theory, Method, and Nuance, pages 63–77. Springer.
Bauer, T. K. and Haisken-DeNew, J. P. (2001). Employer learning and the returns to schooling. LabourEconomics, 8(2):161–180.
Becker, G. S. (1962). Investment in human capital: A theoretical analysis. Journal of political economy, 70(5,Part 2):9–49.
Bertrand, M. and Mullainathan, S. (2004). Are emily and greg more employable than lakisha and jamal? afield experiment on labor market discrimination. The American Economic Review, 94(4):991–1013.
Black, D., Sanders, S., and Taylor, L. (2003). Measurement of higher education in the census and currentpopulation survey. Journal of the American Statistical Association, 98(463):545–554.
Clark, D. and Martorell, P. (2014). The signaling value of a high school diploma. The Journal of PoliticalEconomy, 122(2):282–318.
Deming, D. and Kahn, L. B. (2018). Skill requirements across firms and labor markets: Evidence from jobpostings for professionals. Journal of Labor Economics, 36(S1):S337–S369.
Farber, H. S. and Gibbons, R. (1996). Learning and wage dynamics. The Quarterly Journal of Economics,111(4):1007–1047.
Heckman, J. J. and Rubinstein, Y. (2001). The importance of noncognitive skills: Lessons from the gedtesting program. American Economic Review, 91(2):145–149.
Heckman, J. J., Stixrud, J., and Urzua, S. (2006). The effects of cognitive and noncognitive abilities on labormarket outcomes and social behavior. Journal of Labor economics, 24(3):411–482.
Helleseter, M. D., Kuhn, P., and Shen, K. (2016). The age twist in employers’ gender requests: Evidencefrom four job boards. National Bureau of Economic Research working paper #22187.
18

Hershbein, B. and Kahn, L. B. (2016). Do recessions accelerate routine-biased technological change?evidence from vacancy postings. Technical report.
Jaeger, D. A. and Page, M. E. (1996). Degrees matter: New evidence on sheepskin effects in the returns toeducation. The review of economics and statistics, pages 733–740.
Kahn, L. B. (2013). Asymmetric information between employers. American Economic Journal: AppliedEconomics, 5(4):165–205.
Kane, T. J., Rouse, C. E., and Staiger, D. (1999). Estimating returns to schooling when schooling ismisreported. National Bureau of Economic Research working paper #w7235.
Krueger, A. and Ashenfelter, O. (1992). Estimates of the economic return to schooling from a new sample oftwins.
Kuhn, P. and Shen, K. (2012). Gender discrimination in job ads: Evidence from china. The Quarterly Journalof Economics, 128(1):287–336.
Kuhn, P. and Shen, K. (2015). Do employers prefer migrant workers? evidence from a chinese job board.IZA Journal of Labor Economics, 4(1):22.
Kuhn, P. and Shen, K. (2016). Gender-targeted job ads in the recruitment process: Evidence from china.Working paper.
Lang, K. and Kropp, D. (1986). Human capital vs. sorting: The effects of compulsory attendance laws. TheQuarterly Journal of Economics, 101(3):609–624.
Lange, F. (2007). The speed of employer learning. Journal of Labor Economics, 25(1):1–35.
Layard, R. and Psacharopoulos, G. (1974). The screening hypothesis and the returns to education. Journal ofPolitical Economy, 82(5):985–998.
Light, A. and McGee, A. (2015a). Does employer learning vary by schooling attainment? the answer dependson how career start dates are defined. Labour Economics, 32:57–66.
Light, A. and McGee, A. (2015b). Employer learning and the “importance” of skills. Journal of HumanResources, 50(1):72–107.
Mansour, H. (2012). Does employer learning vary by occupation? Journal of Labor Economics, 30(2):415–444.
Marinescu, I. (2017). The general equilibrium impacts of unemployment insurance: Evidence from a largeonline job board. Journal of Public Economics, 150:14–29.
Oettinger, G. S. (1996). Statistical discrimination and the early career evolution of the black-white wage gap.Journal of Labor Economics, 14(1):52–78.
Quillian, L., Pager, D., Hexel, O., and Midtbøen, A. H. (2017). Meta-analysis of field experiments showsno change in racial discrimination in hiring over time. Proceedings of the National Academy of Sciences,114(41):10870–10875.
Riley, J. G. (1979). Testing the educational screening hypothesis. Journal of Political Economy, 87(5, Part2):S227–S252.
19

Schönberg, U. (2007). Testing for asymmetric employer learning. Journal of Labor Economics, 25(4):651–691.
Shapiro, D., Dundar, A., Yuan, X., Harrell, A. T., Wild, J. C., and Ziskin, M. B. (2014). Some college, nodegree: A national view of students with some college enrollment, but no completion (signature report no.7). National Student Clearinghouse Research Center.
Shen, K. and Kuhn, P. (2013). Do chinese employers avoid hiring overqualified workers? evidence from aninternet job board. In Labor Market Issues in China, pages 1–30. Emerald Group Publishing Limited.
Smith, J. and Stange, K. (2016). A new measure of college quality to study the effects of college sector andpeers on degree attainment. Education Finance and Policy, 11(4):369–403.
Spence, M. (1973). Job market signaling. The Quarterly Journal of Economics, 87(3):355–374.
Stiglitz, J. E. (1975). The theory of “screening,” education, and the distribution of income. The AmericanEconomic Review, 65(3):283–300.
Wood, J. L., Schmidtke, J. M., and Decker, D. L. (2007). Lying on job applications: The effects of jobrelevance, commission, and human resource management experience. Journal of Business and Psychology,22(1):1–9.
20
Tables
Table 1: Matching.
All Resumes Matched Omit Lyingresumes with HS to CB Sample Sample
Colleges listed 1.42 0.88 1.02 1.07 0.88Jobs listed 4.64 4.40 4.15 4.10 4.56Years worked 10.74 9.03 5.63 5.48 7.10Months not working (2014) 2.40 2.63 2.55 2.58 1.81High school year 2004.6 2009.7 2009.9 2007.6
Listed HS on Resume 0.11And matched to CB 0.02 0.15And only 1 (true) college 0.01 0.07 0.47 1.00And only 1 (NSC) college 0.01 0.07 0.44 1.00
N 561,150 61,779 9,536 4,518 4,154
Note: Resumes are a representative sample of males from the largest cities in the U.S. Column 3 is match to the College Boardsample of PSAT, SAt, and AP exam takers between 2004 and 2014. The omit sample is column 4, which is the same as column 3 butonly one college listed in National Student Clearinghouse. The lying sample is column 4, and has only 1 NSC college on resume(whether this is true or a lie), and graduated high school by 2010.
21

Table 2: Summary statistics, by omit status.
All Non-Omitters Omitters
Degree 0.14 0.19 0.02Attend 4-year 0.55 0.62 0.36Years Enrolled 1.29 1.51 0.74Other Training 0.27 0.21 0.42School Avg. PSAT 90.06 92.06 85.18
White 0.39 0.42 0.31Black 0.30 0.28 0.35Hispanic 0.19 0.17 0.22Other Race 0.12 0.13 0.12Student PSAT 87.80 90.72 80.67
Months Not Working 6.93 5.92 9.38Share Months Not Working 0.09 0.08 0.12
Omit 0.29 0 1N 4,518 3,196 1,322
Notes: Sample includes resumes matched to College Board data for job seekers who onlyattended one college, listed their high school on their resume, and graduated high schoolbetween 2004 and 2014.
22

Table 3: Likelihood of omitting schooling.
(1) (2) (3) (4) (5)
Degree -0.416*** -0.403*** -0.403*** -0.406*** -0.406***(0.021) (0.021) (0.021) (0.021) (0.021)
Years Enrolled -0.183*** -0.173*** -0.173*** -0.174*** -0.173***(0.010) (0.010) (0.010) (0.010) (0.010)
Potential experience 0.022*** 0.018*** 0.018*** 0.018*** 0.018***(0.002) (0.002) (0.002) (0.002) (0.002)
4-Year School -0.027* -0.023 -0.024 -0.021 -0.020(0.015) (0.015) (0.015) (0.015) (0.015)
School Avg. PSAT -0.003*** -0.004*** -0.004*** -0.004*** -0.004***(0.001) (0.001) (0.001) (0.001) (0.001)
Other Training 0.172*** 0.172*** 0.172*** 0.172***(0.014) (0.014) (0.014) (0.014)
Student PSAT 0.000 -0.000(0.000) (0.000)
Black -0.015 -0.017(0.016) (0.017)
Hispanic -0.007 -0.007(0.018) (0.018)
Asian 0.024 0.024(0.027) (0.027)
Other race -0.009 -0.009(0.026) (0.026)
Observations 4,518 4,518 4,518 4,518 4,518R-squared 0.185 0.213 0.213 0.213 0.214
Notes: Linear probability model with omitting school listed in NSC=1 as dependent variable. Sample includes resumes matched toCollege Board data for job seekers who only attended one college,listed their high school on their resume, and graduated high schoolbetween 2004 and 2014.(* p < 0.10, ** p<0.05, *** p<0.01)
23

Table 4: Likelihood of omitting schooling - Robustness tests.
(1) (2) (3) (4) (5) (6)
Degree -0.406*** -0.422*** -0.472*** -0.359*** -0.377***(0.021) (0.022) (0.047) (0.022) (0.023)
Years Enrolled -0.173*** -0.179*** -0.282*** -0.137*** -0.171*** -0.163***(0.010) (0.010) (0.022) (0.010) (0.010) (0.010)
School Avg. PSAT -0.004*** -0.004*** -0.002 -0.004*** -0.004*** -0.003***(0.001) (0.001) (0.002) (0.001) (0.001) (0.001)
4-Year School -0.020 -0.010 -0.013 -0.026(0.015) (0.016) (0.017) (0.018)
Experience 0.018*** 0.018*** 0.019*** 0.017*** 0.020*** 0.019***(0.002) (0.003) (0.004) (0.003) (0.003) (0.003)
Other Training 0.172*** 0.159*** 0.200*** 0.150*** 0.185***(0.014) (0.014) (0.022) (0.017) (0.016)
Student PSAT -0.000 0.000 0.001 -0.001 -0.000 -0.000(0.000) (0.000) (0.001) (0.000) (0.000) (0.000)
Black -0.017 -0.015 -0.009 -0.022 -0.020 -0.015(0.017) (0.018) (0.029) (0.020) (0.019) (0.019)
Sample All pre-2014 2-yr 4-yr ∼Deg. ∼Train.N 4,518 3,973 2,054 2,464 3,898 3,281
Notes: Linear probability model with omitting school listed in NSC=1 as dependent variable. Sample includes resumes matchedto College Board data for job seekers who only attended one college, listed their high school on their resume, and graduated highschool between 2004 and 2014.(* p < 0.10, ** p<0.05, *** p<0.01)
24
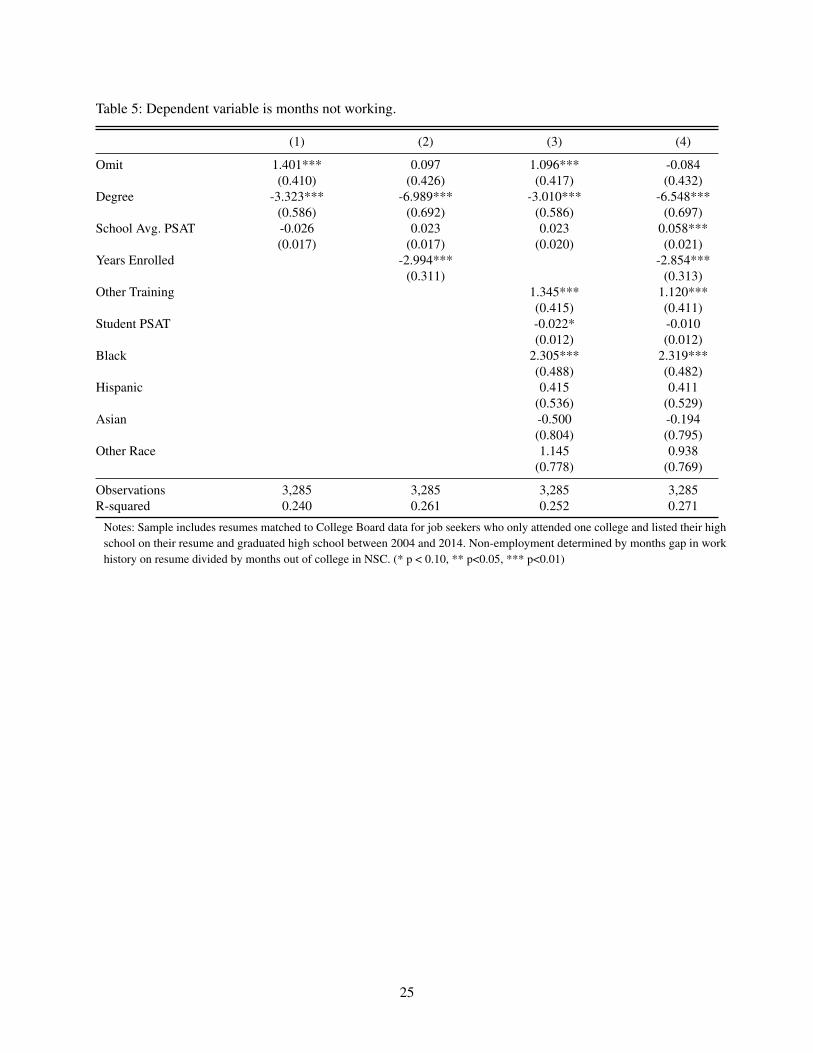
Table 5: Dependent variable is months not working.
(1) (2) (3) (4)
Omit 1.401*** 0.097 1.096*** -0.084(0.410) (0.426) (0.417) (0.432)
Degree -3.323*** -6.989*** -3.010*** -6.548***(0.586) (0.692) (0.586) (0.697)
School Avg. PSAT -0.026 0.023 0.023 0.058***(0.017) (0.017) (0.020) (0.021)
Years Enrolled -2.994*** -2.854***(0.311) (0.313)
Other Training 1.345*** 1.120***(0.415) (0.411)
Student PSAT -0.022* -0.010(0.012) (0.012)
Black 2.305*** 2.319***(0.488) (0.482)
Hispanic 0.415 0.411(0.536) (0.529)
Asian -0.500 -0.194(0.804) (0.795)
Other Race 1.145 0.938(0.778) (0.769)
Observations 3,285 3,285 3,285 3,285R-squared 0.240 0.261 0.252 0.271
Notes: Sample includes resumes matched to College Board data for job seekers who only attended one college and listed their highschool on their resume and graduated high school between 2004 and 2014. Non-employment determined by months gap in workhistory on resume divided by months out of college in NSC. (* p < 0.10, ** p<0.05, *** p<0.01)
25
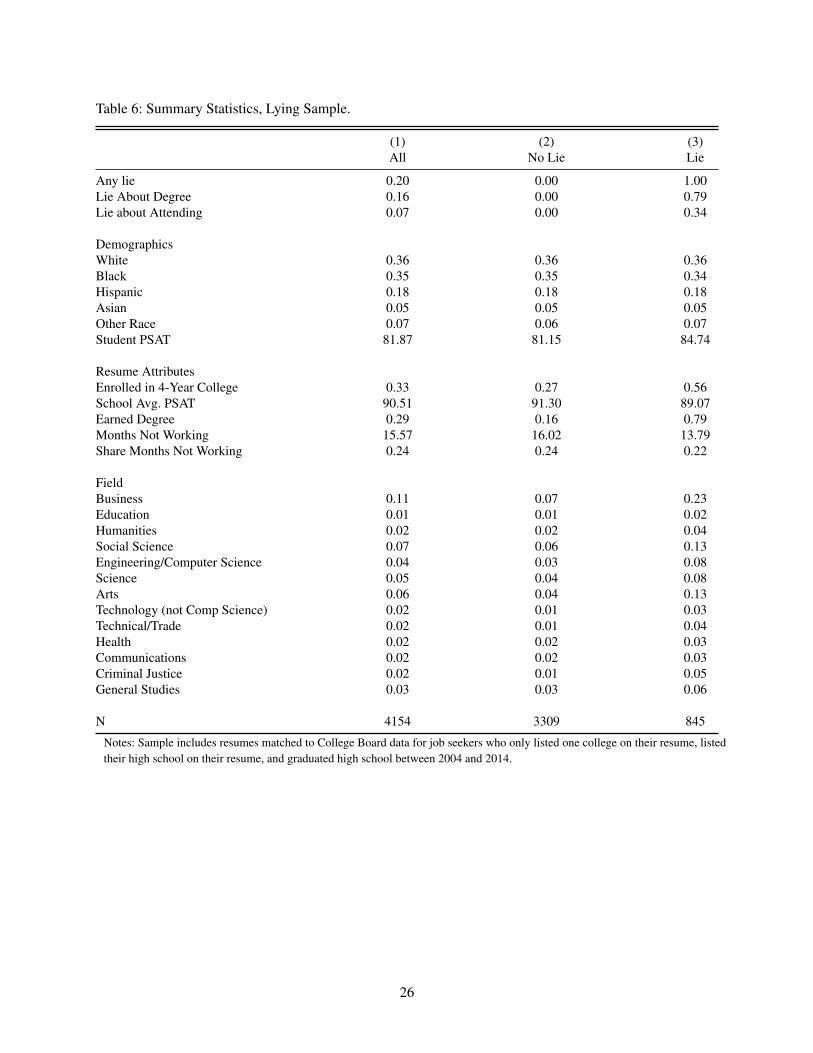
Table 6: Summary Statistics, Lying Sample.
(1) (2) (3)All No Lie Lie
Any lie 0.20 0.00 1.00Lie About Degree 0.16 0.00 0.79Lie about Attending 0.07 0.00 0.34
DemographicsWhite 0.36 0.36 0.36Black 0.35 0.35 0.34Hispanic 0.18 0.18 0.18Asian 0.05 0.05 0.05Other Race 0.07 0.06 0.07Student PSAT 81.87 81.15 84.74
Resume AttributesEnrolled in 4-Year College 0.33 0.27 0.56School Avg. PSAT 90.51 91.30 89.07Earned Degree 0.29 0.16 0.79Months Not Working 15.57 16.02 13.79Share Months Not Working 0.24 0.24 0.22
FieldBusiness 0.11 0.07 0.23Education 0.01 0.01 0.02Humanities 0.02 0.02 0.04Social Science 0.07 0.06 0.13Engineering/Computer Science 0.04 0.03 0.08Science 0.05 0.04 0.08Arts 0.06 0.04 0.13Technology (not Comp Science) 0.02 0.01 0.03Technical/Trade 0.02 0.01 0.04Health 0.02 0.02 0.03Communications 0.02 0.02 0.03Criminal Justice 0.02 0.01 0.05General Studies 0.03 0.03 0.06
N 4154 3309 845
Notes: Sample includes resumes matched to College Board data for job seekers who only listed one college on their resume, listedtheir high school on their resume, and graduated high school between 2004 and 2014.
26

Table 7: Lying About Degree Completion by Field of Study
Outcome = Lied About Degree(1) (2) (3) (4) (5)
Business Reference
Education -0.096 -0.099 -0.094 -0.092 -0.101(0.075) (0.073) (0.072) (0.072) (0.073)
Technical/Trade -0.085 -0.121* -0.124* -0.131* -0.130*(0.066) (0.067) (0.067) (0.067) (0.067)
Health -0.107 -0.118* -0.116* -0.119* -0.116*(0.066) (0.064) (0.064) (0.064) (0.063)
General Studies -0.188*** -0.212*** -0.205*** -0.205*** -0.207***(0.044) (0.046) (0.046) (0.046) (0.046)
Communications -0.094 -0.076 -0.074 -0.075 -0.080(0.065) (0.065) (0.065) (0.065) (0.065)
Humanities -0.016 0.039 0.048 0.047 0.042(0.068) (0.069) (0.069) (0.070) (0.067)
Social Science -0.021 0.018 0.024 0.024 0.022(0.038) (0.039) (0.039) (0.039) (0.039)
Engineering/Computer Science -0.069 -0.064 -0.053 -0.056 -0.057(0.045) (0.045) (0.045) (0.046) (0.046)
Science -0.062 -0.025 -0.014 -0.019 -0.019(0.047) (0.047) (0.047) (0.048) (0.048)
Arts -0.017 -0.017 -0.016 -0.017 -0.018(0.042) (0.042) (0.042) (0.042) (0.042)
Technology (not Comp Science) 0.010 -0.016 -0.010 -0.008 -0.013(0.073) (0.074) (0.075) (0.075) (0.075)
Criminal Justice -0.063 -0.075 -0.082 -0.082 -0.088(0.059) (0.059) (0.058) (0.059) (0.059)
4-year school on resume -0.009 -0.009 -0.007 -0.016(0.031) (0.030) (0.031) (0.042)
PSAT of college on resume -0.004*** -0.003** -0.003** 0.001(0.001) (0.001) (0.001) (0.002)
Student PSAT -0.001 -0.001 -0.001(0.001) (0.001) (0.001)
PSAT of actual college attended -0.005**(0.002)
Controls for Student Demographics x x
Observations 1,643 1,643 1,643 1,643 1,643R-squared 0.036 0.051 0.054 0.056 0.061
Notes: Sample includes resumes matched to College Board data for job seekers who only listed one college on their resume, listedtheir high school on their resume, and graduated high school between 2004 and 2014. Field of study was coded by hand fromresumes. (* p < 0.10, ** p<0.05, *** p<0.01)
27
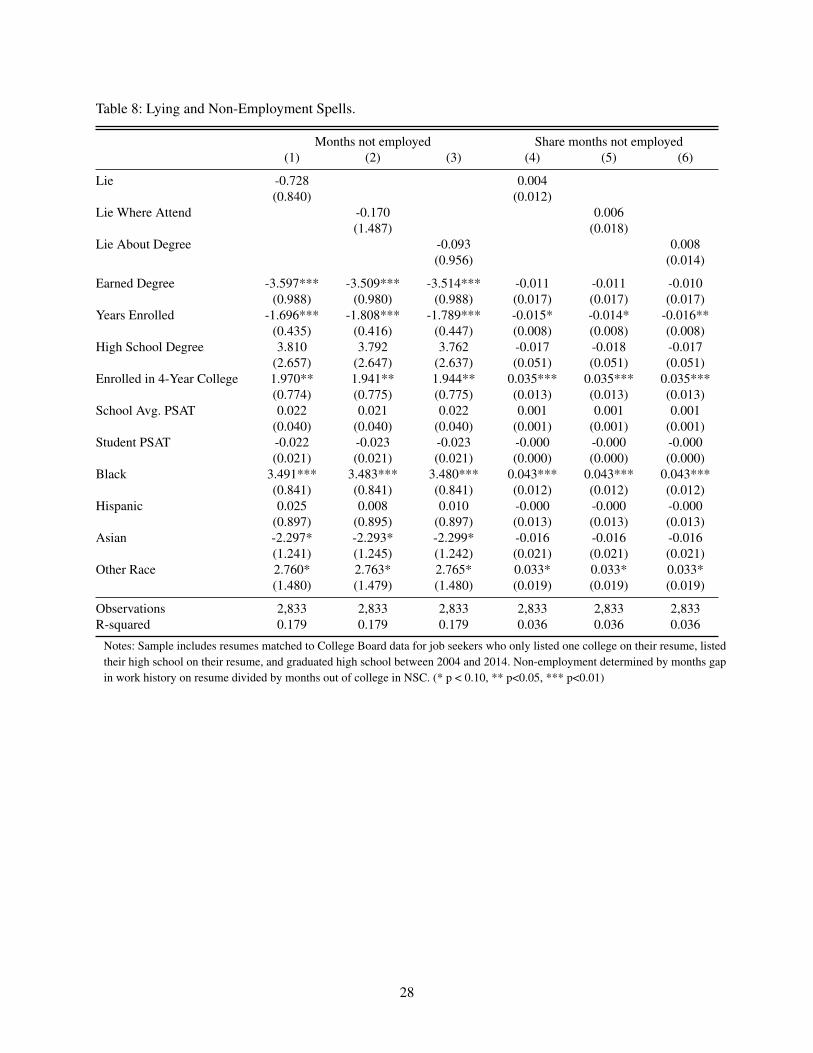
Table 8: Lying and Non-Employment Spells.
Months not employed Share months not employed(1) (2) (3) (4) (5) (6)
Lie -0.728 0.004(0.840) (0.012)
Lie Where Attend -0.170 0.006(1.487) (0.018)
Lie About Degree -0.093 0.008(0.956) (0.014)
Earned Degree -3.597*** -3.509*** -3.514*** -0.011 -0.011 -0.010(0.988) (0.980) (0.988) (0.017) (0.017) (0.017)
Years Enrolled -1.696*** -1.808*** -1.789*** -0.015* -0.014* -0.016**(0.435) (0.416) (0.447) (0.008) (0.008) (0.008)
High School Degree 3.810 3.792 3.762 -0.017 -0.018 -0.017(2.657) (2.647) (2.637) (0.051) (0.051) (0.051)
Enrolled in 4-Year College 1.970** 1.941** 1.944** 0.035*** 0.035*** 0.035***(0.774) (0.775) (0.775) (0.013) (0.013) (0.013)
School Avg. PSAT 0.022 0.021 0.022 0.001 0.001 0.001(0.040) (0.040) (0.040) (0.001) (0.001) (0.001)
Student PSAT -0.022 -0.023 -0.023 -0.000 -0.000 -0.000(0.021) (0.021) (0.021) (0.000) (0.000) (0.000)
Black 3.491*** 3.483*** 3.480*** 0.043*** 0.043*** 0.043***(0.841) (0.841) (0.841) (0.012) (0.012) (0.012)
Hispanic 0.025 0.008 0.010 -0.000 -0.000 -0.000(0.897) (0.895) (0.897) (0.013) (0.013) (0.013)
Asian -2.297* -2.293* -2.299* -0.016 -0.016 -0.016(1.241) (1.245) (1.242) (0.021) (0.021) (0.021)
Other Race 2.760* 2.763* 2.765* 0.033* 0.033* 0.033*(1.480) (1.479) (1.480) (0.019) (0.019) (0.019)
Observations 2,833 2,833 2,833 2,833 2,833 2,833R-squared 0.179 0.179 0.179 0.036 0.036 0.036
Notes: Sample includes resumes matched to College Board data for job seekers who only listed one college on their resume, listedtheir high school on their resume, and graduated high school between 2004 and 2014. Non-employment determined by months gapin work history on resume divided by months out of college in NSC. (* p < 0.10, ** p<0.05, *** p<0.01)
28