Employee Wellness Assessment Survey Amy J. Chamberlain June 27, 2007.
35
Employee Wellness Assessment Survey Amy J. Chamberlain June 27, 2007
-
date post
20-Dec-2015 -
Category
Documents
-
view
219 -
download
1
Transcript of Employee Wellness Assessment Survey Amy J. Chamberlain June 27, 2007.

Employee Wellness Assessment Survey
Amy J. Chamberlain
June 27, 2007

Project Overview
Established to provide information on: Program attendance Program interest Receptivity of future programs Employee physical activity habits Employee barriers to attending programs

Project Overview
Measure Differences Between: Gender Position Type
Faculty, Administration, Support Staff, & Facilities Age
Ranges: 22-35, 36-49, 50-69
Reporting 60% or more of cases, and for interest & intent – a moderate level or higher.

Project Overview
Results to provide guidance on: Program maintenance
What programs “work”, what programs do not Program changes
What changes can be made to increase attendance or usage of programs?
Needs of different employee groups Do some programs apply to one group and not another? Do some groups have more barriers to attending
programs than others? How to better attract certain groups to certain programs

Project Overview Structure of results – differences/similarities
between gender, position type, and age: Misc. - Smoking habits Physical activity habits Future programs
Intent to attend Current/past programs
Attendance Overall interest Prevalence of Barrier Type by group Prevalence of Barrier Type by program

Miscellaneous
Smoking Habits Intent to participate in smoking cessation program
according to smoking frequency

Smoking Cessation Program

Physical Activity Habits
Employees asked: How many days per week do you participate in
exercise? What is the duration of your typical exercise
experience? What is your average level of exertion during a
typical exercise experience?

Physical Activity Habits
Graph types: Days per week - % exercising 3 days or more per
week Exercise Duration - % exercising 30 minutes or
more per experience Exercise Exertion – average physical exertion
level of typical exercise experience 0 = No Exertion, 5 = Moderate Exertion, 10 = Extreme
Exertion

Gender – Days Exercise & Exercise Duration
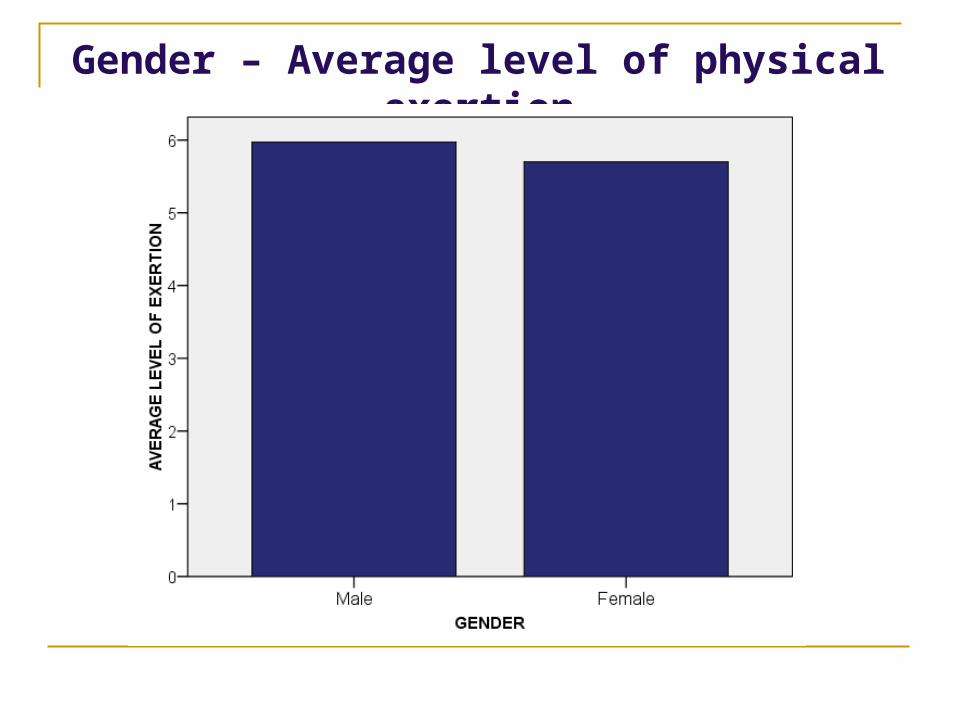
Gender – Average level of physical exertion

Position Type – Days Exercise & Exercise Duration

Position Type – Average level of physical exertion

Age – Days Exercise & Exercise Duration

Age – Average level of physical exertion

Future Programs Employees Asked:
Indicate level of intent to participate or use future wellness programs Setting Wellness Goals Intellectual – Lunch & Learn Social – Celebrate holidays around the world Emotional – Laughter is medicine Physical – Personal fitness training Use of natural remedies Health Screenings Financial Incentives for Participating in Wellness Programs Financial Planning Seminar Smoking Cessation Programs

Future Programs
Graph Type: Average level of intent to participate in wellness
programs

Gender – level of intent
**

Position Type – Level of Intent

Age – Level of Intent

Current/Past Programs Employees Asked:
Did you attend/use the program? Would you be interested in participating in the future? What barriers did you have to participating?
Program List: Lunch & Learn, Health Fair, Shape Up PA, Walking
Challenge 2006, Health Insurance Workshop, Weight Watchers at Work, Flex Spending Workshop, Healthy Living Seminar, Benefits Updates, Carewise – 24 hr Nurse Call Line, Kennedy Sports Center, Obtaining an Annual Physical, Obtaining Screening Labwork, Spiritual Wellness – Labyrinth, Spiritual Wellness – “Spiritualitea” Discussions, Campusfest, Mountain Day

Current/Past Programs:
Graph Types: Attendance - % attended/used current/past programs Interest – average level of interest to continue using
current/past programs Barriers - % having a certain barrier
Conflicts with work demands, transportation barriers, lack of interest, financial cost, conflicts with social activities, conflicts with family/home activities, health risks if engaged in program, lack of motivation, lack of managerial support, did not know how to use program, did not know program existed, lack of ‘fit’ to position on campus, NO barriers
Barriers - % having barriers to a certain program

Gender - Attendance
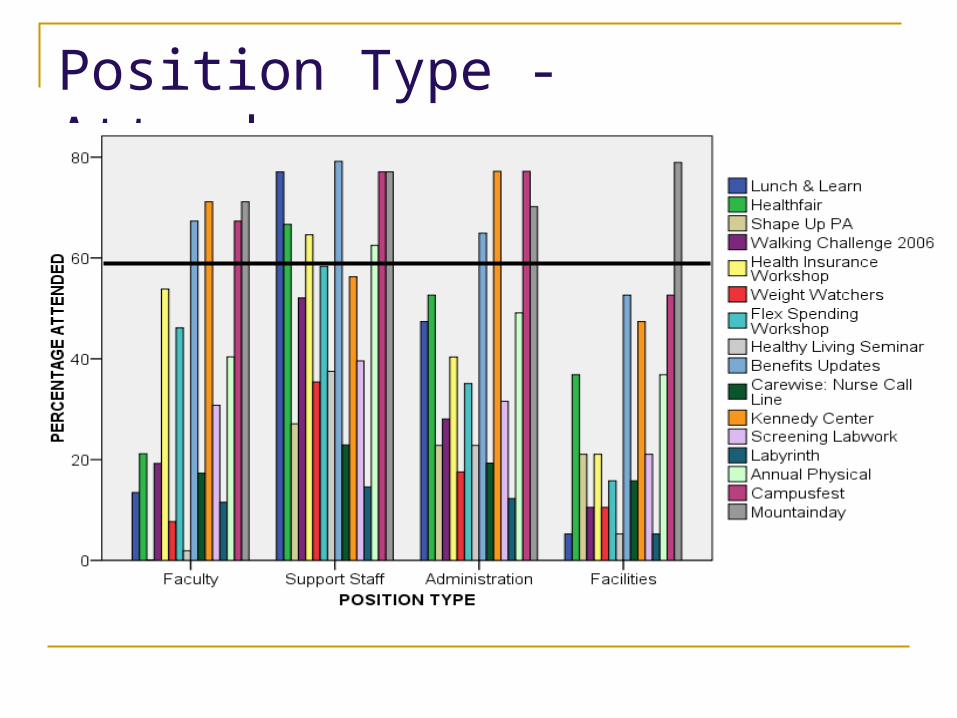
Position Type - Attendance

Age - Attendance

Gender - Interest

Position Type - Interest

Age - Interest

Gender – Barrier Type

Position Type – Barrier Type

Age – Barrier Type

Barrier Type - Program
Overall, no one conflict was reported 60% for more for any one program. Work conflicts, lack of interest, and lack of
motivation were occasionally reported between 40-50% of respondents.

Conclusions – patterns in the data.
Physical Activity Habits Over 60% of respondents in all groups reported
exercising 3 or more days per week and 30 minutes or more per exercise experience.
On average, respondents in all groups reported at least a moderate perceived level of exertion.
Intent to participate in Future Programs Programs reported in all groups:
Personal fitness training, health screenings, financial incentives for participation, financial planning seminar.

Conclusions – patterns in the data.
Attendance: Most popular programs:
Benefits updates, Kennedy Center, Campusfest, Mountainday.
Only Mountainday had over 60% in attendance by facilities/services.
Interest: Most popular programs:
Benefits Updates, Kennedy Center, Screening Labwork, Labyrinth, Campusfest, Mountainday

Conclusions – patterns in the data.
Barriers Overall, conflicts with work and lack of interest
seem to be a problem with many respondents. Almost 60% report conflicts with work to be a barrier, and almost 50% report lack of interest. These trends are similar across programs.