Employee selection Transforming healthcare through innovation
Upload
dennis-campbellCategory
view
219download
0
DOI: 10.1111/j.1475-679X.2012.00457.xJournal of Accounting Research
Vol. 00 No. 0 xxxx 2012Printed in U.S.A.
Employee Selection as a ControlSystem
D E N N I S C A M P B E L L ∗
Received 30 November 2010; accepted 9 March 2012
ABSTRACT
Theories from the economics, management control, and organizational be-havior literatures predict that when it is difficult to align incentives by con-tracting on output, aligning preferences via employee selection may providea useful alternative. This study investigates this idea empirically using person-nel and lending data from a financial services organization that implementeda highly decentralized business model. I exploit variation in this organiza-tion in whether or not employees are selected via channels that are likely tosort on the alignment of their preferences with organizational objectives. Ifind that employees selected through such channels are more likely to usedecision-making authority in the granting and structuring of consumer loansthan those who are not. Conditional on using decision-making authority, theirdecisions are also less risky ex post. These findings demonstrate employee se-lection as an important, but understudied, element of organizational controlsystems.
1. Introduction
This study examines the relationship between employee selection andmanagement control outcomes. Theories from economics, accounting,
∗Harvard Business School. Accepted by Merle Erickson. I thank Srikant Datar, MariaLoumioti, V.G. Narayanan, Tatiana Sandino, Suraj Srinivasan, Michael Toffel, Peter Tufano,and seminar participants at the Harvard Information, Markets, and Organizations Confer-ence, Northwestern University, University of Minnesota, and Tilburg University for helpfulcomments. I acknowledge the financial support of the Division of Research of the HarvardBusiness School. All errors remain my own.
1
Copyright C©, University of Chicago on behalf of the Accounting Research Center, 2012

2 D. CAMPBELL
and organizational behavior predict that when it is difficult to align in-centives by contracting on output, aligning preferences via employee se-lection may provide a useful alternative (Merchant [1985], Cohen andPfeffer [1986], Akerlof and Kranton [2000, 2005], Simons [2000], Pren-dergast [2008]). Moreover, there is considerable evidence that organiza-tions devote significant resources to employee selection in settings whereit is difficult to contract on output (Heskett, Sasser, and Schlesinger [1997,2003], Goodsell [2004]). Despite the long-standing nature of these theo-ries, the diversity of the disciplines in which they are posited, and theirapparent importance within organizations, empirical evidence is generallylacking.
I address this gap using personnel and lending data from a highlydecentralized organization in which there is a basic management con-trol problem—motivating employees to use decision-making authorityeffectively—that is difficult to solve via measuring and contracting on out-put. I exploit variation within this organization in whether or not employ-ees are selected via channels that are likely to sort on the alignment of theirpreferences with organizational objectives.
In particular, I make use of two features of this organization that give riseto such variation. First, the organization underwent a significant changefrom a highly centralized structure to one that is highly decentralized. Manyof the employees working in the decentralized organization were hiredprior to this change whereas many were hired after it. I use the structurethat the employee was hired into as an indirect indicator of the extent towhich his or her preferences are aligned with the decentralized organiza-tion’s objectives. Second, some employees are screened into the organiza-tion via its normal hiring processes whereas others are referred by existingemployees. Prior literature has demonstrated that job candidates referredby the firm’s current workers are more likely to survive the selection pro-cess and tend to have better posthire career outcomes consistent withhires through this channel being better matched to their respective firms(Fernandez, Castilla, and Moore [2000]). In accordance with this litera-ture, I use the referral source of the employee as an additional indirectindicator of the extent to which his or her preferences are aligned with thedecentralized organization’s objectives.
Using these observable indicators, as well as a unique data set linking spe-cific employees to specific lending decisions, I establish a direct empiricallink between the channel of employee selection and both aspects of the ba-sic management control problem in this setting—the use and performanceoutcomes of employee decision-making authority. In particular, I find thatemployees selected through “more aligned” channels are more likely touse decision-making authority in the granting and structuring of consumerloans than those who are not. Conditional on using decision-making au-thority, their decisions are also less risky ex post. I interpret these findingsin the context of prior literature as demonstrating employee selection as animportant, but understudied element of organizational control systems.
EMPLOYEE SELECTION AS A CONTROL SYSTEM 3
This study makes two primary contributions. First, I contribute to therelatively large and multidisciplinary literature on employee selection as amanagement control mechanism by providing, to my knowledge, the firstdirect empirical evidence of a link between employee selection and bettermanagement control outcomes. In particular, my results provide evidencein support of long-standing management accounting–based models thatposit that control in organizations can be obtained by managing “inputs”(e.g., employee selection) rather than “outputs” (e.g., explicit incentivecontracting on financial performance) (see Merchant [1985] or Simons[2000] for an articulation of this model). Similarly, the findings in this pa-per generally lend empirical support to emerging economic theories onpreference alignment as a solution to contracting problems (Akerlof andKranton [2005], Prendergast [2008]).
Second, this paper extends the accounting-based empirical literature onorganization design. Much of this literature has focused on testing theoriesabout the interrelationships between delegation and incentive compensa-tion and on selected determinants of these two choices (Nagar [2002],Abernathy, Bouwens, and van Lent [2004], Moers [2006], Campbell, Datar,and Sandino [2009]). By focusing exclusively on the explicit incentive com-pensation choice, this research has tended to ignore a variety of othermechanisms that firms might use to achieve management control in del-egated decision environments. The findings in this paper demonstrate thatemployee selection can be a solution to a fundamental accounting prob-lem in many contexts—the difficulty of defining and measuring output—that reduces the ability for explicit contracting to solve the delegationproblem.
2. Prior Literature
The link between employee selection and better management controloutcomes is a topic that has been the subject of considerable theoreticalresearch across literatures as varied as accounting, economics, and organi-zational behavior. Within the accounting literature, the classic input, pro-cess, output model of management control has been a mainstay of text-books for decades (Merchant [1985], Simons [2000]). This model, amongother things, posits that control in organizations can be obtained by man-aging “inputs,” including employees, rather than “outputs” by, for exam-ple, explicit incentive contracting on financial performance. In this way,input based controls are fundamentally ex ante control mechanisms thatare likely to be used when ex post mechanisms of management control likeexplicit performance contracting are difficult or unavailable. Such input-based controls have also widely been referred to as “personnel controls”(Simons [2000], Merchant and Van der Stede [2007]).1 The fundamental
1 The particular mechanisms through which this type of control is exercised have typicallynot been well specified. A considerable amount of case-based evidence suggests that these

4 D. CAMPBELL
insight of these models of control is that more effort placed on screen-ing employees at entry means less emphasis need be placed on monitoringthem once in the organization.
In the organizational behavior literature, Ouchi [1979] posits a form ofmanagement control in organizations called “clan control,” which has fun-damentally similar characteristics to input or personnel controls. In partic-ular, his notion of clan control focuses on management control via norms,shared values, and routines that are facilitated, in part, by the careful selec-tion of employees who are likely to internalize the organization’s desiredvalues. In his theory, such clan control will arise when “rational” forms ofcontrol are unavailable due to difficulty in measuring either behavior oroutput.
The economics literature echoes these insights from a different perspec-tive. Akerlof and Kranton [2000, 2005] propose a theory of identity in or-ganizations in which workers lose utility by deviating from norms of higheffort. The model, not surprisingly, predicts that workers who “identify”with a firm require less incentive pay to motivate effort. Similarly, Falkand Kosfeld [2006] provide experimental evidence that control via explicitincentives is costly and likely to be suboptimal relative to trusting agentswhen their “types” are such that they are nonopportunistic and intrinsicallymotivated.
In related work, Prendergast [2008] directly studies the relationship be-tween contractibility and hiring preferences. His agency theoretic modelpredicts that, in the absence of perfectly contractible performance mea-sures, organizations will hire “biased” agents who are disproportionatelymotivated to carry out only a subset of what the firm cares about with thedegree of bias increasing as contracting measures get worse. The funda-mental insight of his model is that when incentives are difficult to align viaexplicit contracting, aligning preferences through employee selection is aviable alternative.
Similar notions can be seen in the economics-based literature on or-ganizational culture as shared values.2 For example, a key insight of Vanden Steen [2010] is that (1) all agency problems essentially arise from dif-ferences in objectives and (2) shared beliefs and values reduce or elim-inate such differences. While not making the link to employee selectionper se, his model does support a mechanism through which the selectionof employees with particular beliefs or values can be a solution to agencyproblems.
mechanisms include but are not limited to: (1) carefully designed interview processes and/orsystems of referral by existing employees (e.g. Heskett, Sasser, and Schlesinger [1997, 2003];(2) training and indoctrination (e.g. Heskett, Sasser, and Schlesinger [1997, 2003], Merchantand Van der Stede [2007]); and (3) deliberate mechanisms that encourage employee self-selection into and out of organizations (e.g. Frei, Ely, and Winig [2011], Ton [2011]).
2 See Van den Steen [2010] for a thorough review of this literature.

EMPLOYEE SELECTION AS A CONTROL SYSTEM 5
It is worth noting that the theoretical economics literature focuses onemployee preferences as the underlying coordination mechanism, butaccounting-based theories define input controls more generally as thosethat regulate “. . . the antecedent conditions of performance—the knowl-edge, skills, abilities, values, and motives of employees’’ (Snell [1992]). Itis difficult to make clear empirical or even theoretical distinctions betweenconstructs such as preferences or ability, and in practice these constructsare likely to be strongly related—those with higher abilities or lower costsof effort are also likely to have stronger preferences for a given type ofwork. These distinctions, however, are not fundamentally important for thisstudy. Irrespective of whether preferences are shaped by or operate inde-pendently of ability, it remains an open empirical question whether or notagency problems can be effectively mitigated through the presence of par-ticular employee types in the absence of incentives for motivating effort.
Although the theoretical literature on the link between employee selec-tion and incentive alignment is large and diverse, empirical evidence isgenerally lacking with the exception of a growing literature on referral asa hiring source. This literature provides evidence that job candidates re-ferred by an organization’s current workers are more likely to survive theselection process and tend to have better posthire career outcomes thannonreferred counterparts. One reason posited is that the referrer screensthe applicant based on superior information, thus providing a more appro-priate match for the organization. Theoretically, referral may be associatedwith nepotism, which could hinder performance (Goldberg [1982]). How-ever, on balance the existing evidence favors the idea that this hiring sourceprovides better matches between employees and firms (Fernandez, Castilla,and Moore [2000]). As described later, I rely on referral source to proxy forthe extent to which employee and organizational preferences are aligned.
3. Research Setting and Data
The research site for this study is a federal credit union with approx-imately $1.3 billion in assets, 130,000 members, 328 employees, and 23branches operating in a single state in the United Nations.3 The organiza-tion offers traditional financial products and services and counts nationalbanks, community banks, and other credit unions as major competitors.The data for this study come from the organization’s personnel and lend-ing records during the period January 2005–May 2010. Throughout thisperiod, this organization, when compared either to a peer group of same-state credit unions or to a national peer group of similar size, has consis-tently ranked in the top 15% in productivity (revenue per employee), loandefault rates (second lowest), and overall performance (return-on-assets).
3 Credit unions are a form of depository institution that function largely like traditionalbanks but differ in that they are mutually owned and organized by their depositors. Due tothis mutual ownership structure, credit unions typically refer to customers as “members.”

6 D. CAMPBELL
The most salient aspect of the organization for this study is a signifi-cant change undertaken in its business model and management controlsystems by the end of 2004. From this period onward, traditional central-ized policies for everything from waiving fees to underwriting loans werereplaced by a framework that radically decentralized decision-making au-thority. Throughout this paper, I refer to the business model implementedin the period after 2004 as the “new system” and that implemented on orbefore 2004 as the “old system.” The new system has many features that areconsistent with the theoretical literature on employee selection and orga-nizational identity discussed earlier. Namely, output is difficult to measureand contract on, alignment of employee and organizational interests is im-portant, and the selection of employees with particular attributes is increas-ingly relied on as a mechanism to solve this alignment problem.
3.1 DIFFICULTY MEASURING AND CONTRACTING ON OUTPUT
The new system has two interrelated characteristics that give rise to chal-lenges in measuring and contracting on output: (1) objectives are statedin relatively intangible terms and (2) financial outcomes are expected tooccur over relatively long time horizons. Underscoring both of these, thenew system was implemented with an objective of “building relationshipsfounded on trust” with a belief that focusing on building relationshipsthrough member advocacy and service would lead to long-term value cre-ation for both the member and the organization.
Attendant with this objective was a focus on putting members first indecision-making. To facilitate this “member-first” philosophy, authority overvirtually any decision involving a member was heavily decentralized. Forexample, a relevant excerpt from internal documents that were used tocommunicate the change to employees read:
No employee will ever get in trouble for doing what is right for the mem-ber [bold emphasis in original document]. . . Do not consider the systemcapability, policy, or procedure—err on doing whatever is necessary for themember and allow your manager or supervisor to take care of the rest. Fi-nally, be prepared to defend your decision! If your intention is to do whatis right for the member, you have the support of management and yourco-workers.
The decentralization of decision-making authority would have its mostimmediate effect on the organization’s lending practices. As one execu-tive explained: “Employees were given full latitude on rates and overridingour underwriting guidelines. Even [tellers] had this authority.” By contrast,automated risk scoring methodologies were used under the old system todetermine who could or could not get a loan with the institution.
As a mechanism for guiding employee decisions, the organization’s“member-first” philosophy was explicitly codified in a framework inter-nally referred to as “Member, Organization, Employee,” or “MOE.” Ex-tensive efforts were undertaken to communicate this framework, and the

EMPLOYEE SELECTION AS A CONTROL SYSTEM 7
following excerpt from one internal document used in these efforts ex-plains the concept:
. . . MOE was introduced as a tool to help you determine what is right forthe member. MOE—Member, Organization, Employee is your guide. Notsure what’s right in a particular situation? Run it through MOE—in prior-ity order—remembering that the member always comes first and trumpsthe other two. In other words, if a solution is right for the employee or the orga-nization but does not position the member for future success, we will not proceed.[Italic emphasis in original communication.]
The most important aspect of this framework is that it explicitly priori-tizes the customer in the decision-making process, yet also asks employeesto consider the organization when making decisions. The implementationof the MOE framework, and the attendant decision-authority delegated toemployees, is a rather explicit recognition by the top executive team that itis difficult to measure and manage centrally in the new system due to theintangible nature of objectives such as “building relationships,” generat-ing “trust” among members, and “putting the member first.” Decentralizeddecision-making authority, along with the MOE framework, places the in-terpretation of these objectives and the assessment of their tradeoffs withorganizational performance in the hands of individual employees. In short,contracting measures are relatively difficult to develop and apply in the newsystem. This is in contrast to the old system in which standard performancemetrics, such as the number of additional products sold, were used to eval-uate individuals and business units.
3.2 ALIGNMENT OF EMPLOYEE AND ORGANIZATIONAL INTERESTS
The new system yields an obvious incentive alignment problem: motivat-ing employees to use decision-making authority in service provision andto do so in a way that leads to better financial performance in the future.Both aspects of this incentive alignment problem can be seen early in theimplementation of the new system.
Speaking to the challenge of getting employees to use decision-makingauthority, the CEO noted that “We communicated to employees extensivelythat you are empowered, you can circumvent controls, and we really wantmore exceptions. Yet, hesitance to deviate from standard protocols was per-vasive.” Another senior executive attributed much of the reluctance amongemployees to the organization’s previous control systems. She elaborated:“Controls were extremely tight here. Our divisions were run as fiefdoms.You couldn’t even get a fee waived for a member without going throughaccounting.”
The second part of the incentive problem, motivating employees to usedecision-making authority effectively, was also apparent early in the new sys-tem. While well intentioned, much of the early decision making by employ-ees was not well directed. One senior executive elaborated: “There was aperiod early on where employees were doing crazy things like driving across

8 D. CAMPBELL
the state to help members . . . and underwriting $18 loans. We had to askourselves: how do we direct this engagement without dampening it?”
Addressing this problem led the organization to adopt many practicesthat prior literature would predict to find in organizations where outcomesare difficult to measure and contract on. Most important from the perspec-tive of this paper is an increasing reliance on employee selection. However,I first describe two other mechanisms here to provide a more completepicture of the research setting.
First, and consistent with literature in both accounting and economics,the use of subjective performance evaluation is relied on extensively(Baker, Gibbons, and Murphy [1994], Ittner, Larcker, and Meyer [2003],Gibbs et al. [2004]). Each of the organization’s business unit “lead-ers” is accountable for ranking the performance of individuals on theirteam. Subjective performance rankings of employees are based on fac-tors such as how well they were making decisions on behalf of mem-bers rather than focusing on policy or procedure and on how wellthey could articulate the rationales for their decisions. Based on this as-sessment, employees are assigned a performance rating ranging from“A+” to “C.” Each business unit leader is then assigned a bonus poolbased on the size and overall performance of his team during that year.Each leader then allocates a dollar amount to each employee basedon the performance ranking. Subjective performance evaluation of thistype has been in place throughout the implementation of the newsystem.4
Second, there is extensive reliance in this organization on norms andshared values to guide employee behavior (Ouchi [1979], Van den Steen[2010]). Norms for decision-making have evolved at this organization viaat least three mechanisms. The first, as discussed earlier, is the articulationof the “MOE” decision-framework. It is worth noting that, at least by 2009,employees seem to have developed a relatively nuanced and sophisticatedinterpretation of how to apply the MOE decision-filter. Qualitative evidenceof this can be seen in appendix A, where I have provided a random sampleof responses to a question on a survey conducted by the organization acrossits entire employee base.
The question, designed to elicit employees’ understanding of the extentof their decision-making authority as well as its proper application, wasposed as follows: “An employee comes to you with a member situation that,if the decision is made to go ahead with the request, will require working‘outside the box.’ What advice would give the employee on decision makingand execution?” Consistent with the development of norms, the answers tothis question reveal several common elements across employees as follows:
4 In unreported tests, I examined these subjective ratings to test for implicit incentives thatmight influence employee decisions. I find no evidence of such implicit incentives. The like-lihood of a lower rating shows no significant relationship to any of my measures of employeeuse of decision-making authority.

EMPLOYEE SELECTION AS A CONTROL SYSTEM 9
(1) Employees by and large view very few, if any, limits on the decisionsthey can make on behalf of members. (2) Employees do not tend to inter-pret the MOE framework naively. Rather than doing whatever the memberasks for, employees carefully deliberate whether a course of action is in thelong-run best interest of the member and believe that doing so will also bein the long-run best interest of the organization. (3) Employees appear tohold themselves accountable for following up with decisions after they aremade, both in the short and long-term, to ensure the desired outcome forboth the member and the organization.
The second mechanism for norm development is straightforward. Basedon my own interviews and direct observation of work at this organization,employees interact extensively with each other when faced with significantexceptions—both to elicit the views of others who have made such excep-tions in the past as well as to sharpen their own rationale for making or notmaking the exception.
The third mechanism for norm development is due to what is referredto internally as a “detection control” model, which functions by allowingemployees to deviate from formal guidelines, but requires them to explainand document their decisions when they do so. One executive captured theworkings of this control system as follows:
We flag loans that are outside of our lending guidelines. If there is a rateexception, then the employee should log the explanation in [our inter-nal IT system]. If they don’t, we will have a discussion with the managerto make sure the documentation is in the system going forward. If theyput the explanation in [the system], then we don’t review the exceptionfurther.
Importantly, this process emphasizes enforcing the documentation ofemployee rationales for deviation from guidelines rather than monitor-ing the outcomes of individual decisions. This was a deliberate choice un-der the assumption that questioning individual outcomes would effectivelyeliminate willingness to exercise decision-making authority.5 The systemdoes, however, maintain a record of the full history of employee explana-tions for any lending or other decisions that deviate from formal guidelines.In this way, the system facilitates the development of norms by maintainingan archive of past rationales that any employee facing the choice to makean exception can access to see how similar decisions have been handled inthe past.
Although this control system does not punish or reward employeesfor loan outcomes, top management does monitor trends in excep-tion rates over time for risk management purposes. An internal risk
5 This assumption is consistent with the literature on “psychological safety” in organizations(Edmondson [1999]) as well as studies on employee behavior under different monitoringregimes (Campbell, Epstein, Martinez-Jerez [2011]).

10 D. CAMPBELL
management committee conducts periodic reviews to identify trends foremployees with severe deviations in either the rate or magnitude of theirexceptions. In these instances, mentorship and coaching are used to instilldecision-making norms that are more aligned with the overall risk toleranceof the organization.
In short, the organization uses a variety of mechanisms to motivate theeffective use of decision-making authority, all of which are consistent withpractices that prior literature would predict to find in organizations whereit is difficult to measure and contract on outcomes. Similarly, and most im-portantly from the perspective of this paper, this organization has increas-ingly relied on employee selection.
3.3 EMPLOYEE SELECTION
The employee selection process at this organization mirrors its basic in-centive alignment problem of motivating employees to use decision-makingauthority and to do so effectively. In particular, the organization has activelysought to select employees with particular attributes that are indicative ofunderlying preferences for these objectives.
In my own interviews with executives and employees, a primary attributethat surfaced as important could best be described as “empathy.” Variouslydescribed in terms such as “a desire to help others” and “wants to makean impact on others,” this attribute is clearly seen as an indicator for apotential employee’s desire to make decisions on behalf of members. Giventhe high degree of decentralization in the new system, other attributes thatare viewed as important are confidence in decision-making, willingness totake ownership and accept accountability, willingness to take risk, and adesire to learn.6 The organization’s interview process naturally attemptsto screen on these attributes. Typical interview questions include “If ourcomputer system was down and a member walked in and asked you for $500in cash for the trip they were leaving on the very next day, how would youmake that decision?”; “How do you want to be remembered by coworkersand by customers?”; and “How have you changed as an employee in thepast couple of positions that you’ve held?”
Considerable emphasis is also placed on screening new hires once in theorganization to quickly identify those who are overconfident or otherwiselikely to be poor fits with the new system. Particular attention is paid toemployees hired from other financial institutions to determine their abilityto change and adapt to the environment of the new system. Commentingon this mechanism, one senior executive noted: “All new employees areassigned a mentor who they work closely with in decision-making duringthe first few months of their employment. Mentors can and have quicklyidentified employees whose behavior does not respond to coaching andmentoring.”
6 Appendix B provides qualitative evidence on employee perceptions of the importance ofthese attributes.

EMPLOYEE SELECTION AS A CONTROL SYSTEM 11
3.4 MEASURING ALIGNMENT OF EMPLOYEE PREFERENCES WITHORGANIZATIONAL OBJECTIVES
A feature of this organization that I exploit in my empirical tests is thatemployees are selected via different channels—some of which are morelikely than others to sort on the alignment of their preferences with or-ganizational objectives. Many employees in the new system are continuingemployees that were initially hired into the old system. The system thatthese employees were selected into is an almost polar opposite manage-ment control environment, and they were screened based on very differ-ent attributes from those considered important in the new system, such asprior experience in financial services. Under the new system, the executiveteam had come to believe that past experience in another financial institu-tion could be detrimental for a candidate attempting to transition to theirmodel. Consistently, the organization recruited new employees from areasas diverse as health care, retail, and education. The implicit assumptionis that employees selected from traditional financial services organizationswill be too influenced by their own previous experience and the controlstructures in which they operated.
For all intents and purposes, employees hired prior to year-end 2004(“old system employees”) were initially selected into a traditional financialservices organization with policy and procedure-oriented controls. Relativeto employees that are hired into the new system, I expect that old systememployees will have preferences that are less aligned with the organization’sobjectives. This is, of course, tempered by the fact that these employeeschose to remain in the new system. However, the fact that an employee washired into the old system should be a reasonable indirect observable in-dicator that his or her preferences are relatively less aligned than those ofemployees directly hired into the new system (“new system employees”).7
There are also several relevant distinctions among new system employees.Some are referred into the organization by existing employees and somecome through the normal screening process without referral. Further, ofthose that are referred, the source of referral can be either an old or newsystem employee. If new system employees generally have preferences thatare more aligned than those of old system employees, then I expect this toextend to referrals as well. Among new system employees, those referred byother new system employees should be most aligned, those referred by oldsystem employees should be least aligned, and employees who are screenedwithout referral are likely to fall in between. Old system employees may alsohave been referred by other employees when hired into the old system. To
7 This is consistent with Van den Steen’s [2010] economic model of culture as shared beliefsin the context of mergers. Predictions from his model suggest the use of a person’s premergerfirm as an indirect, but observable, indicator of his or her beliefs. To the extent that thosewho select or are selected to stay have preferences that are relatively well-aligned with orga-nizational objectives under the “new system,” this should bias against my ability to identifyempirical differences in employee decision-making patterns.

12 D. CAMPBELL
T A B L E 1Retained Versus Exited Employees in the Old System
Mean Hourly Salary Levels by:
Salary Type Job Title
Financial Member “Leader”All Services Service Performance
Employees Annual Hourly Officer Rep. Rating
Stayed $18.80 $32.40 $16.20 $17.86 $15.86 4.56Left 17.28∗ 28.59 15.50∗∗ 14.74∗∗∗ 12.64∗∗∗ 4.31∗∗∗
Columns 1–5 show average salary levels for employees who stayed and those who left the organization asof year-end 2004 (the final year of the “old system”). The final column shows the average performance ratingof the organization’s “Leaders” (executive level employees) as of year-end 2004. The performance ratingranges from 1 to 5 and was intended to be a measure of the degree to which each leader was likely to fit withthe culture of the “new system.” ∗, ∗∗, and ∗∗∗ denote significant difference in means between employees whostayed and those who left within the same employee category at the 10%, 5%, and 1% levels, respectively.For comparison purposes, pay levels for employees paid on an annual basis are expressed on an hourlybasis, assuming eight working hours per day and 264 working days per year. Pay levels for hourly employeescapture the actual hourly wage rate. Financial Services Officers and Member Services Representatives arethe two job titles that had the largest numbers of employees as of year-end 2004.
the extent that this led to the strongest sorting of employees who “fit” withthe old system, I expect such employees to have the least aligned prefer-ences with the new system.
It is worth considering that if old system employees who remain in thenew system are concentrated among those with lower ability—as might beexpected if they have weaker outside opportunities for instance—the struc-ture that the employee was hired into may serve as an indirect indicator ofgeneral skill levels rather than alignment of his or her preferences with theorganization’s objectives. However, table 1 provides evidence that this is notthe case. The table demonstrates that employees who exited the organiza-tion during the final year of the old system tended to be those with loweraverage wages, suggesting that they are not per se higher skilled or moretalented on average than their counterparts who stayed. This remains trueeven within the two largest job categories at year-end 2004—Member Ser-vices Representative and Financial Services Officer. Similarly, the final col-umn of table 1 demonstrates that performance ratings for executive levelemployees (“Leaders”) who left by year-end 2004 are on average lower thanratings for those who stayed.
Figure 1 illustrates some salient facts about the evolution of the em-ployee selection model at this organization. As of 2005, the first full yearof implementation of the new system, those hired directly into this systemalready account for fully 40% of all employees. This pattern is consistentwith a perceived need for a different “type” of employee in the new system.It also indicates significant underlying turnover of old system employeesas the organization transitioned to the new system. Consistent with differ-ent preferences under the old system, interviews with executives and otheremployees suggest that approximately half of this turnover was voluntaryand due to the discomfort of many old system employees with the level ofdecision-making authority inherent in the new system. The remaining

EMPLOYEE SELECTION AS A CONTROL SYSTEM 13
FIG. 1.—Evolution of employee selection model.
turnover was involuntary as senior management used both formal evalu-ations and informal observation to terminate relationships with employeesthey determined to be least likely to fit well in the new decentralized struc-ture. Figure 1 also shows that the percentage of referred employees risesfrom just over 30% to just over 40% during this period. Relevant, but notshown in figure 1, is the fact that by the end of 2009 over 50% of new em-ployees were referred by existing employees. These patterns demonstrateincreasing reliance on this recruitment channel and are consistent with theliterature on employee referrals as a high-quality source of information formatching potential employees to internal labor markets.
In summary, employee selection has played an increasing role at this or-ganization as a mechanism for aligning employee preferences with organi-zational objectives. I expect such alignment to vary systematically with thechannel of employee selection with the ordering from strongest to weak-est alignment as follows: (1) new system employees referred by new systememployees, (2) new system employees who are not referred, (3) new sys-tem employees referred by old system employees, (4) old system employeeswho are not referred, and (5) old system employees referred by old systememployees. If employee selection is an effective solution to the incentivealignment problem, then I expect to see more use of decision-making au-thority, and stronger resulting performance outcomes, in moving from thefifth category of employee to the first.
3.5 THE LENDING DECISION CONTEXT
While decision-making authority under the new system extends to a widerange of decisions that employees might make on behalf of members, I

14 D. CAMPBELL
focus on lending decisions in my analysis. Lending decisions have signif-icant research advantages over other types of decisions for two reasons.First, employee use of decision-making authority is directly observable inthis context and might include, for example, giving a member a loan whenhe does not meet formal credit-score guidelines. Second, and similarly,performance outcomes of these decisions are eventually observable in theform of default and charge-off rates. Lending decisions are also significantin this industry and represent one of the areas in which this organizationwas most impacted by the change to the new system.
Although the context of lending decisions provides several advantagesfor this study, it is worth noting that incentive contracts could technicallybe written on future default rates. However, holding lower level employ-ees accountable for long-term outcomes over which they have little controloutside of the initial risk assessment would expose them to a substantialamount of risk, potentially making them less willing to use decision-makingauthority irrespective of their judgment about the true quality of a loan.
This challenge has been articulated as a major barrier to contractingon outcomes in the context of bank lending, and studies that have beenconducted in this context point to the exceeding rarity of this practicewith typical incentive contracts based on loan originations rather than out-comes (Baker [2002], Agarwal and Wang [2008], Liberti and Mian [2009],Hertzberg, Liberti, and Paravisini [2010]). Irrespective of particular viewson the feasibility of contracting on loan outcomes, the most relevant factis that this organization does not do so, giving rise to a control problemthat must be addressed via other mechanisms. My primary analyses exam-ine whether this can be accomplished via employee selection.
3.6 DATA
The data used for this study are collected from the organization’s person-nel and lending files during the period January 2005–May 2010. The sam-ple used for subsequent analyses consists of observations on loan, borrower,and employee characteristics for 134,121 unique loans, made to 64,540unique borrowers, by 463 unique employees during this period. Summarystatistics are provided in table 2.
3.6.1. Employee Characteristics. Data on employee characteristics includethe employee’s year of hire into the organization, his job title, and the busi-ness unit in which he works.8 Both job title and business unit may vary byyear. For employees who were referred into the organization, I observe theidentity and year of hire of the employee’s referrer. I use employee and re-ferrer hire years to classify employees into the five categories noted earlier,defining new system employees and referrers as those hired after 2004 and
8 For purposes of this study, a business unit can be a branch, a function such as financialaccounting or real estate, or corporate headquarters.

EMPLOYEE SELECTION AS A CONTROL SYSTEM 15
TA
BL
E2
Sum
mar
ySt
atis
tics
for
Empl
oyee
,Bor
row
er,an
dL
oan
Cha
ract
eris
tics
Sam
ple
Size
and
Vari
able
sU
nit
ofA
nal
ysis
Mea
nM
edia
nSt
d.D
ev.
Min
Max
Em
ploy
eeC
har
acte
rist
ics
Num
ber
Uni
que
Empl
oyee
sN
ewsy
stem
empl
oyee
,ref
erre
dby
new
syst
emem
ploy
ee46
30.
080
0.27
01
New
syst
emem
ploy
ee,n
otre
ferr
ed46
30.
270
0.45
01
New
syst
emem
ploy
ee,r
efer
red
byol
dsy
stem
empl
oyee
463
0.13
00.
330
1O
ldsy
stem
empl
oyee
,not
refe
rred
463
0.36
00.
480
1O
ldsy
stem
empl
oyee
,ref
erre
dby
old
syst
emem
ploy
ee46
30.
160
0.37
01
Ten
ure
inor
gan
izat
ion
(yea
rs)
463
4.21
34.
750
32B
orro
wer
Ch
arac
teri
stic
sN
umbe
rU
niqu
eB
orro
wer
sC
redi
tsco
re64
,540
710
720
74.5
939
383
6D
ebt-t
o-in
com
era
tio
64,5
4037
.92
34.9
421
.86
020
0L
oan
Ch
arac
teri
stic
sN
umbe
rU
niqu
eL
oans
Loa
nam
oun
t13
4,12
113
,519
9,00
018
,865
252,
371,
200
Inte
rest
rate
134,
121
8.93
8.10
4.06
326
Term
inm
onth
s13
4,12
169
6036
040
6A
ppro
ved
loan
has
acr
edit
-sco
reex
cept
ion
134,
121
0.13
00.
330
1A
ppro
ved
loan
has
anin
tere
stra
teex
cept
ion
134,
121
0.24
00.
420
1L
oan
appl
icat
ion
appr
oved
wh
ensy
stem
rule
wou
ldde
ny
(200
7on
ly)
13,6
370.
731
0.35
01
Prio
rle
ndi
ng
expe
rien
ceof
empl
oyee
upto
curr
entl
oan
(#pa
stlo
ans
mad
eby
empl
oyee
)13
4,12
136
0.71
254
341.
450
1,75
2
Prio
rcu
stom
er-s
peci
fic
len
din
gex
peri
ence
ofem
ploy
eeup
tocu
rren
tloa
n(#
past
loan
sm
ade
byem
ploy
eeto
asp
ecifi
ccu
stom
er)
134,
121
1.35
00.
920
20
“New
Syst
em”
den
otes
empl
oyee
sh
ired
afte
rth
eor
gan
izat
ion
’sim
plem
enta
tion
ofit
sde
cen
tral
ized
busi
nes
sm
odel
(pos
t-200
4).
“Old
Syst
em”
den
otes
empl
oyee
sh
ired
prio
rto
the
orga
niz
atio
n’s
impl
emen
tati
onof
its
dece
ntr
aliz
edbu
sin
ess
mod
el(2
004
and
earl
ier)
.Su
mm
ary
stat
isti
csfo
rem
ploy
eech
arac
teri
stic
sar
eba
sed
onth
epo
oled
sam
ple
ofem
ploy
ee-y
ears
from
2005
to20
09;s
umm
ary
stat
isti
csfo
rbo
rrow
erch
arac
teri
stic
sar
eba
sed
onth
efu
llsa
mpl
eof
134,
121
loan
s.T
he
min
imum
loan
term
of0
isdu
eto
the
pres
ence
ofre
volv
ing
cred
itlin
essu
chas
cred
itca
rds
and
hom
eeq
uity
lines
ofcr
edit
.

16 D. CAMPBELL
T A B L E 3Summary Statistics and Distribution of Loans by Type
Loan Type Percent of All Loans Amount Interest Rate % Term
Secured vehicle 49 $13,278 6.88 61.24Personal line of credit 37 4,498 12.72 59.90Mortgage and home equity 14 36,654 6.39 114.72
This table reports distribution of loans along with means of selected variables by loan type. Summarystatistics are based on the full sample of 134,121 loans. Term is measured in months.
old system employees and referrers as those hired prior to and including2004.
There are 214 unique job titles in the data, but many of these are redun-dant. For analysis purposes, I broadly categorize employees as “customercontact” or “corporate and back office” based on job titles and their de-scriptions. Customer-contact employees are those whose jobs put them incontact with customers in the regular course of work including, for exam-ple, employees working in branches and call centers. Corporate and back-office employees largely consist of those working in executive or functionalareas at corporate headquarters or business units other than branches orcall centers.
While relatively broad, this is a good categorization for a variety of rea-sons. First, consistent with the decentralization of decision-making author-ity, every employee was expected to be capable of handling all transactionsso that differences in job tasks do not necessarily track well with differencesin job titles in the new system. This is especially true of customer-facing em-ployees operating in branches and call centers as they handle the majorityof transaction activity. Second, and in recognition of this fact, by 2008 theorganization had itself classified all customer-contact employees into onejob title called “Member Service Representative.” Finally, customer-contactemployees operate at the lowest level of the organizational hierarchy. Thesignificant decentralization of decision-making authority even to lower lev-els in the organization is perhaps the most unique aspect of the new sys-tem, and it is reasonable to expect employee selection to have its strongestpotential effects on management control and incentive alignment at thislevel.
3.6.2. Borrower Characteristics. Data on borrower characteristics includethe borrower’s credit score and debt-to-income ratio at the time his loanapplication is processed.
3.6.3. Loan Characteristics. For each loan made during 2005–2010, I ob-serve the type, dollar amount, interest rate, and term at the time the loanwas funded. There are three broad categories of loans in the data: securedvehicle loans, used primarily for automobile purchases; personal lines ofcredit, including credit cards and signature loans; and mortgages and homeequity loans. The distribution of loans and their characteristics by type areprovided in table 3. In addition to these basic characteristics, I also observe

EMPLOYEE SELECTION AS A CONTROL SYSTEM 17
loan exceptions that are direct indicators for whether an employee exer-cised decision-making authority in a particular lending decision. The twobasic types of lending exceptions are those made in approving, and thosemade in funding, a loan.
Loan approval exceptions occur when an employee overrides the orga-nization’s system-based guidelines in approving a potential borrower for aloan. In general, in the absence of decentralized decision-making author-ity at this organization, borrowers with either credit scores less than 620or debt-to-income ratios above 45% would not qualify for approval. Thebenchmark of denying a loan to a borrower that falls short of either ofthese criteria serves as the counterfactual for what the lending decisionwould be in the absence of decision-making authority. This serves as a usefulbenchmark for examining variation in the use and outcomes of decision-making authority across employees. Throughout this paper, I use the term“system-deny” to denote loans that would have been denied in the absenceof decision-making authority.
I observe loan approval exceptions in the data in two different ways. First,for every loan that was approved over the sample period, I can observewhether it is a “system-deny” loan. That is, whether it is a loan for whicha credit-score exception, debt ratio exception, or both were made. This al-lows me to examine whether these types of loans are systematically moreor less concentrated among different types of employees. In essence, thesedata allow me to examine the probability that a system-deny loan would beobserved conditional on having been approved by a particular employee. Aclear drawback of this measure is that it is a joint probability of a system-deny borrower requesting a loan from the employee and the employeemaking the exception to approve the loan conditional on that request. Thefocus of this study is on the latter, and in some of my tests I will attempt todeal with this issue by controlling for factors that would make it more likelyfor an employee to interact with riskier borrowers.
I also address this issue via the second way in which I observe loan ap-proval exceptions. For the period 2006–2009, I was able to obtain data onall applications from potential borrowers who were denied for loans. Thedata on which specific employees made the denial decision are only avail-able for 2007, so most of my analyses of this particular data are restrictedto this year. While only for a limited portion of my sample period, this typeof data is not typically available in studies on lending decisions, and it al-lows me to directly estimate the probability of an employee approving aloan conditional on the potential borrower not meeting system criteria forapproval.
The second type of loan exceptions—those made in the structuringof approved loans—is relatively more straightforward. These consist pri-marily of rate exceptions occurring when employees structure the loanwith a different rate than is recommended on the “rate sheet” for a loanwith similar characteristics. In the vast majority of cases, though not all,the actual interest rate is lower than the rate-sheet rate, consistent with

18 D. CAMPBELL
employees using decision-making authority largely to reduce rates offeredto members.
As additional controls in my analysis of lending decisions, I constructtwo measures of lending experience in the new system. First, I measure theemployee’s general prior experience with lending decisions in the new sys-tem as the cumulative number of loans made by the employee up to andexcluding the current loan. Second, I measure the employee’s experiencelending to a specific member as the number of prior loans made by theemployee to that member. The cumulative number of loans in both cases ismeasured from January 2005 or from the employee’s hire date, whicheveris later. I include these measures as controls for any potential learning ef-fects over time and because employees who repeatedly interact with specificmembers could reasonably be expected to have better “local information”on the member’s creditworthiness independent of the characteristics of theemployee.
3.6.4. Loan Performance Outcomes. I am able to observe whether an out-standing loan is charged off between January 2008 and May 2010. A charge-off occurs when a loan is written off as uncollectible and is clearly the mostextreme outcome of a poor performing loan. It would be ideal to have in-termediate outcomes such as defaults on payments, but I do not observesuch outcomes in these data. Although the performance outcome is rela-tively extreme, these data allow for direct tests of the performance implica-tions of employee use of decision-making authority in lending decisions.
4. Empirical Tests and Results
4.1 DESCRIPTIVE STATISTICS ON THE USE OF DECISION-MAKING AUTHORITY
Before turning to my primary empirical tests, I first examine severalpatterns in the data that illustrate the nature of employee lending deci-sions. Data in table 2 and figures 2–4 provide strong evidence that decision-making authority is “real” rather than simply formal or perceived.9 Table 2shows that 13% of all loans during 2005–2010 were made with credit-scoreexceptions, 24% were structured with interest rate exceptions, and fully73% of loan applications from “system-deny” borrowers were approved in2007.
Figure 2 demonstrates that decision-making authority is also highlydispersed. With the exception of 2008, a year in which overall loanapplications declined, every employee made at least one lending deci-sion and this remained at approximately 90% of all employees even in
9 I use these terms in the sense of Aghion and Tirole [1997]. Real authority would be lim-ited if employees perceived the threat of implicit punishments from superiors’ monitoring oftheir use of formal authority.

EMPLOYEE SELECTION AS A CONTROL SYSTEM 19
FIG. 2.—Concentration of loan decisions over time.
FIG. 3.—Distribution of number of loans per employee per year.
2008.10 Moreover, the top 20% of employees in terms of loan volume ina given year account for less than 60% of all lending decisions. Lendingactivity would have been highly concentrated in few employees in the old
10 “Back office” employees get opportunities to make loans due to an IT system that routesany “overflow” calls in its call centers randomly throughout the organization. Any employeecan receive a randomly routed call from a member regarding lending or other transactionsand is expected to handle the transaction.
20 D. CAMPBELL
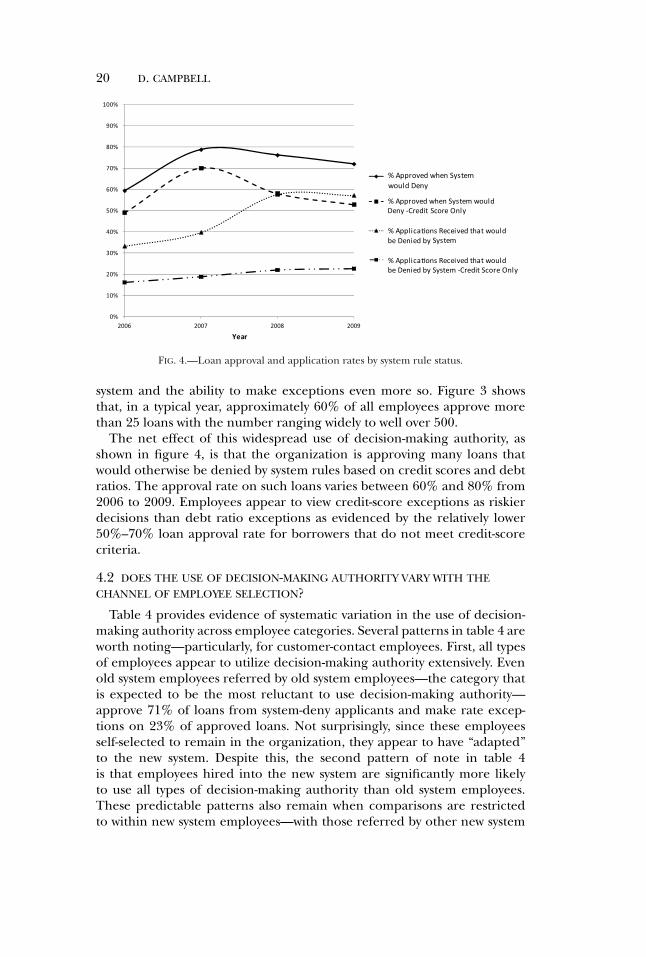
FIG. 4.—Loan approval and application rates by system rule status.
system and the ability to make exceptions even more so. Figure 3 showsthat, in a typical year, approximately 60% of all employees approve morethan 25 loans with the number ranging widely to well over 500.
The net effect of this widespread use of decision-making authority, asshown in figure 4, is that the organization is approving many loans thatwould otherwise be denied by system rules based on credit scores and debtratios. The approval rate on such loans varies between 60% and 80% from2006 to 2009. Employees appear to view credit-score exceptions as riskierdecisions than debt ratio exceptions as evidenced by the relatively lower50%–70% loan approval rate for borrowers that do not meet credit-scorecriteria.
4.2 DOES THE USE OF DECISION-MAKING AUTHORITY VARY WITH THECHANNEL OF EMPLOYEE SELECTION?
Table 4 provides evidence of systematic variation in the use of decision-making authority across employee categories. Several patterns in table 4 areworth noting—particularly, for customer-contact employees. First, all typesof employees appear to utilize decision-making authority extensively. Evenold system employees referred by old system employees—the category thatis expected to be the most reluctant to use decision-making authority—approve 71% of loans from system-deny applicants and make rate excep-tions on 23% of approved loans. Not surprisingly, since these employeesself-selected to remain in the organization, they appear to have “adapted”to the new system. Despite this, the second pattern of note in table 4is that employees hired into the new system are significantly more likelyto use all types of decision-making authority than old system employees.These predictable patterns also remain when comparisons are restrictedto within new system employees—with those referred by other new system

EMPLOYEE SELECTION AS A CONTROL SYSTEM 21
TA
BL
E4
Use
ofD
ecis
ion-
Mak
ing
Aut
hori
tyby
Empl
oyee
Cat
egor
y
Em
ploy
eeC
ateg
ory
Old
Syst
emN
ewSy
stem
New
Syst
emR
efer
red
byO
ldSy
stem
Ref
erre
dby
New
Syst
emR
efer
red
byO
ldSy
stem
Not
Ref
erre
dO
ldSy
stem
Not
Ref
erre
dN
ewSy
stem
Cus
tom
er-C
onta
ctE
mpl
oyee
sN
umbe
rof
uniq
ueem
ploy
ees
2171
3910
146
%lo
ans
wit
hcr
edit
-sco
reex
cept
ion
s11
1115
a,b
16a,
b23
a,b,
c,d
2007
appr
oval
rate
for
syst
emde
nie
dap
plic
ants
7175
a76
a77
a,b
82a,
b,c,
d
%lo
ans
wit
hin
tere
stra
teex
cept
ion
s23
2225
a,b
26a,
b,c
29a,
b,c,
d
Cor
pora
tean
dB
ack
Offi
ceE
mpl
oyee
sN
umbe
rof
uniq
ueem
ploy
ees
4173
2240
9%
loan
sw
ith
cred
it-s
core
exce
ptio
ns
810
a11
a17
a,b,
c15
a,b,
c
2007
appr
oval
rate
for
syst
emde
nie
dap
plic
ants
5457
5981
a,b,
c77
a,b,
c
%lo
ans
wit
hin
tere
stra
teex
cept
ion
s18
23a
2026
a,b,
c21
a,d
“New
Syst
em”
den
otes
empl
oyee
sh
ired
afte
rth
eor
gan
izat
ion
’sim
plem
enta
tion
ofit
sde
cen
tral
ized
busi
nes
sm
odel
(pos
t-200
4).
“Old
Syst
em”
den
otes
empl
oyee
sh
ired
prio
rto
the
orga
niz
atio
n’s
impl
emen
tati
onof
its
dece
ntr
aliz
edbu
sin
ess
mod
el(2
004
and
earl
ier)
.%lo
ans
wit
hcr
edit
scor
ean
din
tere
stra
teex
cept
ion
sar
eba
sed
onth
efu
llsa
mpl
eof
134,
121
appr
oved
loan
s.“S
yste
mD
enie
d”re
fers
tolo
anap
plic
atio
ns
from
appl
ican
tsw
ith
cred
itsc
ores
less
than
620
orde
bt-to
-inco
me
rati
osgr
eate
rth
an45
%or
both
.App
rova
lra
tes
for
syst
emde
nie
dlo
ans
are
base
don
lyon
loan
appl
icat
ion
sre
ceiv
eddu
rin
g20
07.
a,b,
c,an
dd
den
ote
sign
ifica
ntl
ydi
ffer
ent
from
old
syst
em/r
efer
red
byol
dsy
stem
,ol
dsy
stem
/non
refe
rred
,new
syst
em/r
efer
red
byol
dsy
stem
,an
dn
ewsy
stem
/non
refe
rred
empl
oyee
sre
spec
tive
ly,a
tlea
stat
the
10%
leve
lbas
edon
two-
sam
ple
test
sof
prop
orti
on.

22 D. CAMPBELL
T A B L E 5Loan Exception Logits
Credit Score Credit Score Approve | InterestException | Exception | System Would RateApproved Approved Deny (2007) Exception
Panel A: Customer-contact employees
Prior lending experience −0.0002 −0.0002 0.0009 −0.0001(0.0004) (0.0004) (0.0006) (0.00007)
Prior customer-specific 0.059∗∗∗ 0.061∗∗∗ 0.24∗∗ 0.044∗∗∗
lending experience (0.01) (0.01) (0.10) (0.01)Prior year average credit score for −0.009∗∗∗
loans made at business unit (0.00)Credit grade A+ 1.667∗∗∗ −0.503∗∗∗
(0.25) (0.03)Credit grade A 0.487∗∗ 0.02
(0.22) (0.04)Credit grade C −1.018∗∗∗ 0.340∗∗∗
(0.21) (0.04)Credit grade D −1.949∗∗∗ 1.317∗∗∗
(0.18) (0.03)Debt-to-income ratio −0.023∗∗∗ 0.00001∗∗∗
(0.002) (0.000004)Loan amount ($000’s) −0.05∗∗∗ −0.05∗∗∗ −0.018∗∗ 0.01∗∗∗
(0.005) (0.006) (0.007) (0.001)Old system employee, 0.035 0.031 0.262∗∗ −0.038
not referred (0.04) (0.04) (0.13) (0.03)New system employee referred 0.105∗,b 0.127∗∗,b 0.391∗∗ 0.080∗,b,c
by old system employee (0.06) (0.06) (0.17) (0.04)New system employee, 0.143∗∗∗,b 0.131∗∗∗,b 0.502∗∗∗,b −0.052
not referred (0.05) (0.05) (0.13) (0.03)New system employee referred 0.385∗∗∗,b,c,d 0.326∗∗∗,b,c,d 1.776∗∗∗,b,c,d 0.104∗,b,c
by new system employee (0.07) (0.07) (0.42) (0.06)Constant −0.727∗∗∗ 5.688∗∗∗ 20.344 −3.218∗∗∗
(0.19) (0.44) (0.35) (0.14)Observations 112,997 93,751 10,052 112,997
(Continued)
employees showing significantly higher loan exception rates across all ex-ception types.
Some of these general patterns remain for corporate and back office em-ployees, particularly the comparisons between old and new system employ-ees. However, there is little distinction in the use of decision-making au-thority across loan exception types for new system employees who are notreferred when compared to those who are referred by other new systememployees. As noted earlier, it is reasonable to expect employee selectionto have stronger effects in this setting among customer-contact employees,but these weaker patterns may also be due to smaller sample sizes of em-ployees or loans within the corporate and back office employee group.
The patterns documented in table 4 largely remain when lending de-cisions are subjected to a multivariate analysis controlling for factorsother than employee characteristics that are expected to influence thesedecisions. Table 5, panel A, reports estimates from logit models for the

EMPLOYEE SELECTION AS A CONTROL SYSTEM 23
T A B L E 5 — Continued
Credit Score Credit Score Approve | InterestException | Exception | System Would RateApproved Approved Deny (2007) Exception
Panel B: Corporate and back office employees
Prior lending experience −0.0006∗∗ −0.0006∗∗ 0.002 −0.0003(0.0003) (0.0003) (0.0017) (0.0002)
Prior customer-specific 0.02 0.03 −0.72 0.089∗∗∗
lending experience (0.03) (0.03) (0.59) (0.02)Prior year average credit score −0.008∗∗∗
for loans made at business unit (0.00)Credit grade A+ 1.061∗∗∗ −0.670∗∗∗
(0.34) (0.06)Credit grade A 0.841∗∗ 0.025
(0.35) (0.09)Credit grade C −1.549∗∗∗ 0.204∗∗
(0.35) (0.10)Credit grade D −2.723∗∗∗ 1.051∗∗∗
(0.30) (0.08)Debt-to-income ratio −0.031∗∗∗ 0.000003∗∗∗
(0.004) (0.000001)Loan amount ($000’s) −0.03 −0.03 −0.004 0.003∗∗∗
(0.008) (0.008) (0.17) (0.00)Old system employee, 0.288∗∗∗ 0.236∗∗ 0.158 0.096
not referred (0.11) (0.11) (0.22) (0.07)New system employee referred 0.166 0.169 0.725∗∗ −0.125
by old system employee (0.18) (0.18) (0.29) (0.14)New system employee, 0.510∗∗∗ 0.462∗∗∗ 0.058 0.061
not referred (0.14) (0.14) (0.54) (0.09)New system employee referred 0.629∗∗∗ 0.570∗∗∗ 0.444 −0.382∗∗∗
by new system employee (0.18) (0.18) (0.78) (0.13)Constant 0.222 4.332∗∗∗ 25.328∗∗∗ −3.104∗∗∗
(1.28) (1.50) (1.53) (0.29)Observations 21,124 17,526 3,585 21,124
Standard errors in parentheses corrected for clustering within employees. ∗,∗∗, and ∗∗∗ significant at10%, 5%, and 1% levels, respectively. b,c, and d denote significantly different from old system/nonreferred,new system/referred by old system, and new system/nonreferred employees, respectively, at least at the 10%level based on chi-square tests; business unit, year, and loan type indicators included in all specifications.“New System” denotes employees hired after the organization’s implementation of its decentralized busi-ness model (post-2004). “Old System” denotes employees hired prior to the organization’s implementationof its decentralized business model (2004 and earlier). “System Denied” refers to loan applications fromapplicants with credit scores less than 620 or debt-to-income ratios greater than 45% or both. The depen-dent variable in the column labeled “Credit-Score Exception | Approved” is an indicator for whether anapproved loan is one for which a credit-score exception was made in the approval process. The dependentvariable in the column labeled “Approve | System would Deny” is an indicator for whether a loan appli-cation is approved when the system rule based on credit score and debt-to-income ratio would deny theloan. Approval rates for system denied loans are based only on loan applications received during 2007. Thedependent variable in the column labeled “Interest Rate Exception” is an indicator for whether the actualinterest rate is different from the organization’s standard interest rate given the characteristics of the loanand borrower. The excluded category for “Credit Grade” is “B” in all specifications. All models include fixedeffects for loan type, business unit, and year.
different categories of lending exceptions for the sample of customer-contact employees. The excluded category in each model is old systemreferred by old system employees. To control for unobserved heterogene-ity, all models include fixed effects for loan type, business unit, and year.

24 D. CAMPBELL
Reported standard errors are corrected for clustering of observationswithin employees prior to inference.
The first column contains results for the model predicting the probabilityof an approved loan being one for which a credit-score exception was made.The results demonstrate that loans with these exceptions are more likely tobe observed if the employee making the decision has had prior lendingexperience with the borrower, and are less likely for larger loans. Moreimportantly, the predicted patterns in the use of decision-making author-ity across employees remain: conditional rates of credit-score exceptionsare higher for new versus old system employees generally, with the highestrates demonstrated for new system employees referred by other new systememployees.
These results may be confounded if some employee groups are system-atically more likely than others to interact with riskier borrowers. This mayarise if different types of employees are concentrated in particular businessunits due to the hiring preferences of the manager, the local labor market,prior turnover or other factors, and if there are systematic differences inthe types of borrowers that interact with particular business units. By in-cluding business unit fixed effects, I partially control for these potentialconfounding factors. However, the types of borrowers interacting with busi-ness units may change over time. To account for this, the second column inpanel A of table 5 includes the average credit score of borrowers with loansoriginated at the business unit in the prior year. Not surprisingly, increasesin the average credit quality of borrowers interacting with a business unitare negatively associated with the likelihood of observing a loan with anexception. More importantly, the results on differences in conditional ex-ception rates across employee categories are robust to the inclusion of thismeasure.
The results in the first two columns of table 5, panel A, demonstrate thatloans with credit-score exceptions are more likely to be observed amongnew system employees, particularly those referred by other new system em-ployees. The next column shows the flip-side of this, the probability thatthese employees will accept a loan from a borrower who does not meetsystem criteria. In these tests, I control directly for characteristics of theborrower by including the debt-to-income ratio and “credit grade.”11 Thecredit grade, used internally as a way to classify risk, ranges from “A+” to“D.” Cutoff values of credit score are used to grade each borrower, withgrades “C” and “D” consisting of borrowers with scores lower than the sys-tem criteria of 620. I use the credit grade rather than the score in recog-nition of the inherent nonlinearity in credit-score-based lending decisions.The excluded credit grade in these specifications is “B.” Not surprisingly,the results show that employees are more likely to approve loans of lower
11 Variation in credit scores and debt ratios arises in this sample because the system rulewould deny applicants with either credit scores < 620 or debt ratios > 45%.

EMPLOYEE SELECTION AS A CONTROL SYSTEM 25
dollar amounts for borrowers with higher credit scores and lower debtratios.
More notably, the coefficient estimates show that the predicted patternsin the use of decision-making authority across employee categories remain.The coefficient estimates on the employee category indicators from col-umn 3 suggest that, relative to old system employees referred by old systememployees, the implied marginal effects for new system/referred by oldsystem, new system/not referred, and new system/referred by new systememployees are approximately 3%, 4%, and 8%, respectively.
Turning to decisions on the structuring of loans, the last column in panelA of table 5 demonstrates that employees are more likely to make inter-est rate exceptions for loans with higher dollar amounts to borrowers withlower credit scores and higher debt ratios. Borrowers with lower creditscores and/or higher debt ratios would not normally qualify for the or-ganization’s lowest interest rates, so it is not surprising that these are theborrowers for whom employees would offer rate reductions. Results on theuse of this type of decision-making authority across employee categories arenot as strong as those for loan approval decisions. New system employeesreferred by new system employees show the highest conditional rates of in-terest rate exceptions followed by new system employees referred by old sys-tem employees, but nonreferred new system employees show no significantdifferences from either category of old system employee. Relative to oldsystem employees referred by old system employees, the implied marginaleffects for new system/referred by old system and new system/referred bynew system employees are 1.4% and 1.8%. Relative to the 23% mean rateexceptions by old system/referred by old system employees, these implyincreases of approximately 6% and 8%, respectively.
In general, the results on the sample of corporate and back officeemployees in table 5, panel B, are not as strong as those for customer-contact employees. This discrepancy may reflect more significant coordina-tion problems among the numerous and geographically disperse customer-contact employees, but may also arise due to smaller numbers of employeesor loans within the corporate and back office sample.
Overall, the results in this section provide evidence that the use ofdecision-making authority is significantly higher for employees selected viachannels that are likely to sort on the alignment of their preferences withorganizational objectives. I turn next to investigating the effectiveness ofemployee use of decision-making authority.
4.3 DO DECISION-MAKING OUTCOMES VARY WITH THE CHANNEL OFEMPLOYEE SELECTION?
I examine the effectiveness of decision-making outcomes by investigat-ing 18-month charge-off rates for “system-deny” loans approved during theperiod January 2007–November 2008. I am limited to this relatively shorttime frame because I only observe charge-offs occurring during the periodJanuary 2008–April 2010. Summary statistics on charge-off rates, both on
26 D. CAMPBELL
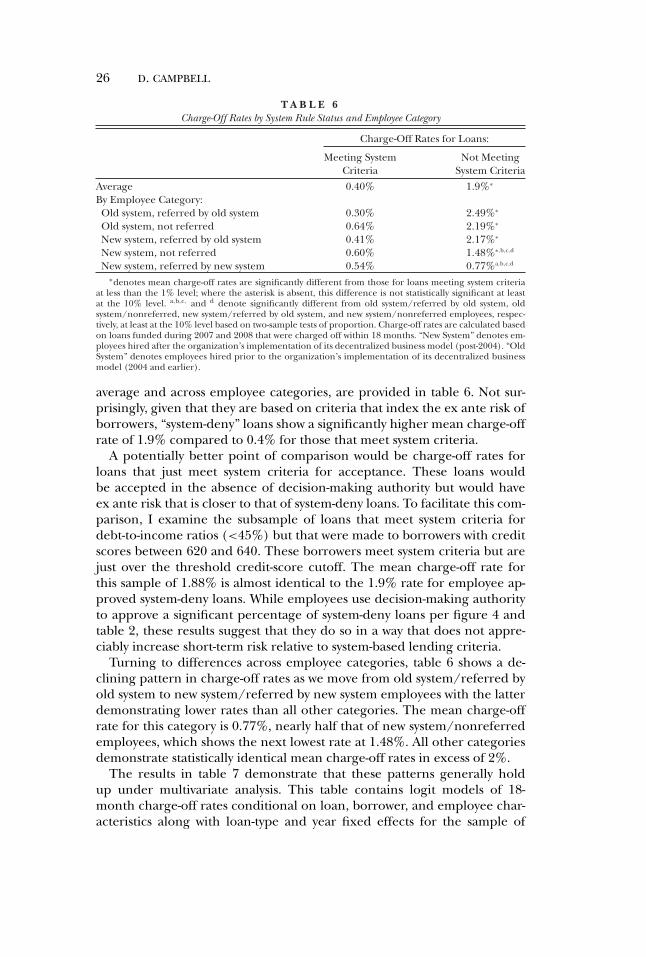
T A B L E 6Charge-Off Rates by System Rule Status and Employee Category
Charge-Off Rates for Loans:
Meeting System Not MeetingCriteria System Criteria
Average 0.40% 1.9%∗
By Employee Category:Old system, referred by old system 0.30% 2.49%∗
Old system, not referred 0.64% 2.19%∗
New system, referred by old system 0.41% 2.17%∗
New system, not referred 0.60% 1.48%∗,b,c,d
New system, referred by new system 0.54% 0.77%a,b,c,d
∗denotes mean charge-off rates are significantly different from those for loans meeting system criteriaat less than the 1% level; where the asterisk is absent, this difference is not statistically significant at leastat the 10% level. a,b,c, and d denote significantly different from old system/referred by old system, oldsystem/nonreferred, new system/referred by old system, and new system/nonreferred employees, respec-tively, at least at the 10% level based on two-sample tests of proportion. Charge-off rates are calculated basedon loans funded during 2007 and 2008 that were charged off within 18 months. “New System” denotes em-ployees hired after the organization’s implementation of its decentralized business model (post-2004). “OldSystem” denotes employees hired prior to the organization’s implementation of its decentralized businessmodel (2004 and earlier).
average and across employee categories, are provided in table 6. Not sur-prisingly, given that they are based on criteria that index the ex ante risk ofborrowers, “system-deny” loans show a significantly higher mean charge-offrate of 1.9% compared to 0.4% for those that meet system criteria.
A potentially better point of comparison would be charge-off rates forloans that just meet system criteria for acceptance. These loans wouldbe accepted in the absence of decision-making authority but would haveex ante risk that is closer to that of system-deny loans. To facilitate this com-parison, I examine the subsample of loans that meet system criteria fordebt-to-income ratios (<45%) but that were made to borrowers with creditscores between 620 and 640. These borrowers meet system criteria but arejust over the threshold credit-score cutoff. The mean charge-off rate forthis sample of 1.88% is almost identical to the 1.9% rate for employee ap-proved system-deny loans. While employees use decision-making authorityto approve a significant percentage of system-deny loans per figure 4 andtable 2, these results suggest that they do so in a way that does not appre-ciably increase short-term risk relative to system-based lending criteria.
Turning to differences across employee categories, table 6 shows a de-clining pattern in charge-off rates as we move from old system/referred byold system to new system/referred by new system employees with the latterdemonstrating lower rates than all other categories. The mean charge-offrate for this category is 0.77%, nearly half that of new system/nonreferredemployees, which shows the next lowest rate at 1.48%. All other categoriesdemonstrate statistically identical mean charge-off rates in excess of 2%.
The results in table 7 demonstrate that these patterns generally holdup under multivariate analysis. This table contains logit models of 18-month charge-off rates conditional on loan, borrower, and employee char-acteristics along with loan-type and year fixed effects for the sample of

EMPLOYEE SELECTION AS A CONTROL SYSTEM 27
T A B L E 7Charge-Off Logits
Customer-ContactEmployees All Employees
SystemDenied:
SystemDenied:
System Credit System CreditDenied Score Only Denied Score Only
Credit grade A+ −1.133∗∗∗ −0.317(0.43) (0.29)
Credit grade A −0.537∗ −0.265(0.30) (0.34)
Credit grade C 1.322∗∗∗ −0.515∗∗∗ 1.449∗∗∗ −0.717∗∗∗
(0.28) (0.18) (0.27) (0.17)Credit grade D 1.377∗∗∗ 1.722∗∗∗
(0.26) (0.25)Debt-to-income ratio −0.003 −0.006 0.00004 0.0005
(0.003) (0.004) (0.00007) (0.0008)Loan amount ($000’s) −0.003 −0.04∗∗ 0.004 −0.02
(0.02) (0.02) (0.01) (0.24)Old system employee, −0.192 −0.168 −0.410∗∗∗ −0.424∗∗∗
not referred (0.15) (0.16) (0.13) (0.14)New system employee referred −0.257 −0.145 −0.433∗∗∗ −0.310∗
by old system employee (0.18) (0.19) (0.16) (0.18)New system employee, −0.383∗∗∗,b,c −0.605∗∗∗,b,c −0.450∗∗∗ −0.594∗∗∗,c
not referred (0.15) (0.17) (0.12) (0.14)New system employee referred −2.249∗∗∗,b,c,d −2.527∗∗∗,b,c,d −2.294∗∗∗,b,c,d −2.377∗∗∗,b,c,d
by new system employee (0.59) (0.72) (0.46) (0.52)Constant −2.624∗∗∗ −1.236∗∗∗ −2.932∗∗∗ −1.261∗∗∗
(0.35) (0.25) (0.31) (0.21)Observations 18,779 7,016 22,356 8,352
Standard errors in parentheses corrected for clustering within employees. ∗,∗∗, and ∗∗∗ significant at10%, 5%, and 1% levels, respectively. b,c, and d denote significantly different from old system/referredby old system, old system/nonreferred, new system/referred by old system, and new system/nonreferredemployees, respectively, at least at the 10% level based on two-sample tests of proportion. Charge-off ratesare calculated based on loans funded during 2007 and 2008 that were charged off within 18 months. “SystemDenied” denotes the sample of loans made to borrowers with either credit scores less than 620 or debt-to-income ratios greater than 45%. “System Denied: Credit Score Only” denotes the sample of loans madeto borrowers with credit scores less than 620 without consideration of the debt-to-income ratio. All modelsinclude fixed effects for loan type and year.
customer-contact employees and for the full sample of all employees.12
Conditional charge-off rates show the same patterns as in the univariateanalysis with the lowest rates for new system/referred by new system em-ployees followed next by new system/nonreferred employees. The coeffi-cients for the remaining employee categories are statistically indistinguish-able from each other.
12 Due to a smaller number of loans in the “Corporate and Back Office” sample and theinfrequent nature of charge-offs, I provide the latter analysis to allow comparison of resultswhen these employees are included.

28 D. CAMPBELL
Overall, the results in this section provide evidence that is consistent withbetter control and alignment via employee selection. In particular, employ-ees selected through channels that are likely to sort on the alignment oftheir preferences with organizational objectives show more effective use ofdecision-making authority.
5. Conclusions
The link between employee selection and better management controloutcomes is a topic that has been the subject of considerable theoretical re-search across literatures as varied as accounting, economics, and organiza-tional behavior. Yet, it is one for which little if any direct empirical evidenceexists. By studying a setting in which there is a basic incentive alignmentproblem—motivating employees to use decision-making authority and todo so effectively—that is difficult to solve via measuring and contracting onoutput, I am able to provide direct evidence of this link.
A limitation of this study is that, while I demonstrate better control out-comes linked to employee selection, I do not investigate the mechanismthrough which this occurs. In delegated decision environments like theone studied here, employees selected through more aligned channels maysimply have better judgment or invest more effort in acquiring local knowl-edge. Alternatively, such employees may invest more in learning about theorganization and the resources available to them in carrying out their work.In this way, some employees may be better than others at allocating organi-zational resources to achieve desired outcomes. The employee commentsin appendix A, many of which focus on the importance of “following up”on decisions, suggest that this is a potentially reasonable interpretation forthe results in my research setting. Future research can make progress byinvestigating the potential mechanisms through which employee selectionleads to better management control outcomes.
A P P E N D I X ARandom Sample of 20 Employee Comments on the Use of Decision-Making Authority
EmployeeComment
An employee comes to you with a member situation that, if the decision ismade to go ahead with the request, will require working “outside the box.”What advice would give the employee on decision making and execution?
1 Consider what the member is requesting first and foremost and make sure whatdirection we are taking it fulfills the request. Always suggest partnership withtheir direct leader to get their perspective on the route taken. Also don’t beafraid to utilize other resources around them as well. Then make sure wehave looked/considered alternatives and that this is the best route all thingsconsidered. Make sure we understand the pros/cons of the choice for us tomake this decision in how it affects [the organization]. I just feel exceptionsare a great thing but we always need to acknowledge what we are risking withthe exception after consideration to how the member is served by our

EMPLOYEE SELECTION AS A CONTROL SYSTEM 29
choice/exception. Make sure the member understands all the pros and consof the direction we are going and that this is their choice for meeting theirfinancial goals. Then set up some reminders to make sure everything isexecuted as intended and the member is informed about where things are at.
2 Depending on what we are doing, I would first ask if the member is aparticipating member. Tell me a little bit about the relationships we havewith them. How will this affect the member and then organization? Why doyou think this is the right thing to do? I would encourage outside the boxthinking what is the members ultimate goal and how can we help get themthere?
3 You always want to put the member first, and start with MOE. I would adviseasking the following questions: “Is this right for the member?” “Will it causesuccess for them?” If you answer “yes” to these questions, you are empoweredto and should do what is necessary for that specific members need. Doingwhat is truly right for someone will build trust and a relationship willblossom.
4 I would first try and understand if the employee had gotten to know themember and truly understands their goals. Sometimes, I find that employeesget carried away with wanting to go “above and beyond” without realizingthat what the member truly wants is a much simpler solution and alreadyavailable and supported by our strategy and products as in—for example thePR rewards program for refunding fee’s or making rate exceptions. Othertimes, employees can get “bullied” into making an out of the box decisionbecause a member “demands” it. This is hard for employees to resist becausethey know that they CAN make what the member is demanding happen andthat they could tell themselves and the organization that they had simply“used their empowerment” to make an exception for the member. This isNOT building relationships founded on trust with a member, rather theopposite.
However, if an employee can articulate that they have really gotten to the heartof the members goal and the solution is beyond what we currently offer Iwould encourage the employee to make the commitment to the memberand “worry” about how we were going to make it happen on the back end.There are some limitations to this of course, but if the goal is reasonable, orwithin the field of possibility—in other words not something like, “I want tobuy a house, but I have no money down and no credit and I can’t afford topay more than $50 a month.”
We have tremendous resources that we can tap to make the impossible possibleif it is right for the member and contributes to their financial success in ameaningful way—not just addressing a “demand” for service per se, butrather being creative in eliminating assumptions about barriers and reachinga positive outcome through thinking differently rather than forcing amember into a box. It is also important, I believe, when making thecommitment to the member, that we are clear that we are going to doeverything possible to creatively make their goal a reality, but that it mightnot look exactly like they want it to—but will hopefully address their ultimategoal. For example, a member may want to buy his girlfriend an engagementring, but the ring he wants is too expensive for him to feasibly afford at thistime. But, he knows it’s the ring for her and he will do just about anything tomake it work. If we have spent time with this member, understand hisintentions and believe in his ultimate ability to take on the debt and hiscommitment and relationship with us is such that we believe he will WANTto pay us back (this is the relationship part—the reciprocal commitment usto member and member to us), we might extend a signature loan term to 7years or we might know that there is a local jeweler who is also a member thatcan make the same ring the member saw in a department store for half the

30 D. CAMPBELL
price, or we might see if we can help the member budget such that he savessome of the money to pay for the ring up front and then we write a signatureloan for the remaining. . . the possibilities are endless.
5 First I would ask them what the impact to the member is? How is this going toaffect the member? Then I would ask them if this is a long-term solution orshort term. Understanding the goals of the member, and the full impact ofthe loan decision will help guide the member advisor as to if this loan isgoing to benefit the member in a positive way. If we can help our membersnot only short term, but also long term, we will begin to solidify therelationship with the member, and build a deeper foundation of trust.
6 The most important thing to consider is to ensure this is setting the memberup for future success—a creative solution is great, but if it’s going to add toproblems down the road we need to keep looking for more solutions. Also,when you are working “outside the box” you are making the commitment tofollow up on your creative solution to ensure that it is working the way it’sintended. Empowerment comes with responsibility and it’s great to be ableto create a solution but you must commit to ensuring that solution works andfollowing up with that member on a regular basis. This is a vital part ofBuilding Relationships founded on Trust because if we come up with a greatsolution, but fall down on the execution or just drop the plan after it’s putinto place, the member is going to lose faith.
7 I would advise the employee to hold the member accountable and follow upwith the member to assure success. Set goals that are realistic for themembers so they can succeed and then slowly tighten up goals once theyshow they are committed and having success with plan. Also by workingoutside the box we need to consider the organization/other members riskwhen we are making decision.
8 Think about: What kind of relationship does the member have with [theorganization]? Do they use us as their primary financial? What is thesurrounding situation and story in relation to what they are requesting from[the organization]? Instead of the quick fix, think long term and if our initialdiagnosis of their situation and the solution we come up with is in themember’s best interest several years from now?
9 There’s no true definition of “outside the box”—it could be taking a leap offaith on a member who on paper has a rocky past, but in talking to them youfind they had some medical issues or a divorce that took a toll on finances.Outside the box could also mean an idea that’s totally out there—a travelingcredit union (think book-mobile) or driving to a member’s house to close amortgage. Regardless of the situation, I would offer the advice to mycoworker to get to know the member—ask them questions, find out what isimportant to them, and ask how they would like to proceed. When you’rethrowing around ideas, don’t think first about the organization and what willhappen to you—think about the MEMBER—how what you’re wanting helpsthem and what you’re willing to do, and the organization will follow.
10 They can’t be afraid to ask the tough questions of the member and theirsituation. If we don’t do that and just become order takers and fulfillers weare not setting the member up for long-term financial success. We need tounderstand why this solution makes sense for their situation. Why is this theright solution and how does this ensure that it not only sets them up forsuccess in this moment but also for future success?
11 I think you can run any “outside the box” situation through MOE to help withyour answer. We, as employees of [the organization] have been given a giftand that gift is empowerment. Empowerment is where we have the

EMPLOYEE SELECTION AS A CONTROL SYSTEM 31
the opportunity to step out of the guidelines and make it work for ourmember. Building relationships founded on trust goes both ways, themember trusts that we will do what is right for them and we trust that themember will in turn do what we have asked them to.
12 My advice in decision making is to strongly encourage the employee to filterthe thought process through MOE. Then, document like there is notomorrow. The documenting should include thought process of everythingconsidered—whether rejected or not. The member should be broughtthrough the thinking process with the employee to ensure we are providingan outcome the member actually desires.
13 I feel that here there is no box, so I don’t feel I really ever work outside of it.I have held firm in that if we do what we feel is right for the member theorganization will be behind us 100%. In terms of the member the executiondepends on the relationship that you create in your interaction.
14 Listen to the need and the want, common sense, being honest, and filter MOE,looking at the short term and long term for the member. Making themember smart, when you start and finish the process or follow up with themember to confirm with information and a direct name and number toreach back to, make notes in Touche.
15 When employees come to me for advice regarding a decision that needs tomade outside the box I stress that the decision and follow through should bebased off the member. When thinking outside the box and transactingbusiness differently for a member the communication and the follow-upabsolutely needs to be there 100%. These variables are extremely importantin any transaction but even more so in situations that are sculpted specificallyfor certain members. In these types of scenarios, the communication needsto be very thorough with our members as well as within the organization soevery person involved or anyone stepping in knows how to transact business.These situations should be closely monitored also not only to ensure themember understands and so that it is smooth for them but also to ensurethat the member is holding up their end of the deal. I tend to give the handholding comparison when thinking out of the box. I find that holding ourmembers hands when they are willing to fulfill their end of deal is verysuccessful in building a relationship on trust and then when they don’t holdup their end of the bargain I get a better picture of the relationship we have.
16 In “outside the box” thinking, two overall factors come to the surface regardingthis issue. The first filter of the two pertains to making sure that what is beingproposed, is within the regulatory and legal parameters. Once a proposedcourse of action passes this first criterion, the next step would be to then runthis decision past the filter of MOE. Given our operational culture, MOEshould not be considered outside the box; however it is through this filterthat we ensure that we stay true to the proper course of action without therigid guardrails of procedure.
17 In engaging the employee, I feel that it would be beneficial to remind theemployee to not get too caught up in procedure until the direction has beendetermined. I have often received calls from other member advisorsregarding the procedures that assist our members in the completion of avoluntary repossession; and what I find is that their concentration andattention is focused upon learning and completing the action itself, then wefail to make the connection to truly understand why a member would belooking at surrendering their auto in the first place. My point being is thatmy advice to that member advisor would be ensure that they run the decisionthrough MOE prior to worrying about how they are going to get there. Withthe M of MOE I would suggest to the member advisor that they begin with

32 D. CAMPBELL
the end in mind, meaning that given the member’s current goal and meansto achieve this goal, where would they ultimately end up and what would thatlook like. Following up with a reasonable assessment of how the attainmentof this goal would impact their overall financial picture. Granted this is a verybasic description but I feel it can be easily overlooked if their initial directionconflicts with a standard procedure or way we typically do things. The goalwould be to start with the perspective of the member by being a memberadvocate first, prior to then running it past the filter of O in MOE. Whilesimultaneously determining where things are at from the member’sperspective one would likely be also laying the foundation for a relationshipfounded upon trust. The skills and actions required, (empathy, activelistening, etc.), to understand the position of the member are also the skillsrequired to cultivate trust in the member/member advisor relationship.I feel that a relationship founded on trust starts with an empathetic andfocused ear on what is being said by the member before we charge forwardwith a proposed action.
18 If I were approached by a coworker facing this situation, I would first askhim/her the way he/she wants to proceed and the reasons he/she believesthat is the right thing to do for the member, the organization, and theemployee. I believe that doing so challenges all of us to be better for themember, encourages us to grow and believe in ourselves and our ability toserve the member, and causes us to take full ownership of the situation andthe outcome for the member. I also think it helps avoid becoming the singlepoint of decision making that an employee comes to depend on. Not tomention, our gut reaction generally offers the best advice. Upon hearinghis/her response, I would likely challenge my peer as well. I might challengehim/her to think differently about his/her decision-making process, askingquestions and providing ideas that use the decision-making filer, MOE.I might challenge him/her to share the way he/she intends to useempowerment to create a meaningful experience for the member and helphim/her brainstorm creative ideas. I might challenge the employee to thinkdifferently about follow-up with the member to ensure they are building therelationship with the member overtime, rather than closing the door andwaiting for the member to come back to us in the future.
19 First and foremost, celebrate the moment with our member! Then go with your“gut.” Follow through with instinct that as more often than not it means youare on the right path. Next, do your homework! Discuss with your peers thebest way to execute your plan and if need be adjust it so that your overallidea comes to fruition. Make sure that you document your reasoning and tieup your loose ends. Until we have signed the last document, sent that lastpayoff, scanned that last sheet you are still serving your member. Do themthe courtesy of following through on their custom tailored plan by ensuringit’s 100% done so they don’t run into any problems down the line.
20 I could answer this question many varying ways depending on the situation,however the generalized response would closest relate to the following: Thefirst thing would be to start with trusting and hearing the member andasking questions in order to better understand what the member is wantingto achieve with the request. Everything has pros and cons, what are they andwhat would make the most sense for the member long term, and does themember understand them? Are there any “red flags” or pieces of thesituation that do make sense? If so, talk with the member, don’t makeassumptions. Gain the knowledge to be able to make a decision with them.Be straight forward—open and honest goes a long way. And finally, takeownership of the long-term success. Follow up with the member down the

EMPLOYEE SELECTION AS A CONTROL SYSTEM 33
road (put something structured in place so that this happens). “Outside thebox” thinking usually means following up with the member. Afterall, how doyou know if you are successful with your “Outside the Box” thought process ifyou are not involved long term?
A P P E N D I X BRandom Sample of 20 Employee Comments on Important Employee Attributes
EmployeeComment
You have been asked to speak with new employees at orientation. Whatpersonal attributes would you say are important for an employee to besuccessful at [the organization] in the months and years ahead?
1 Strong desire to help people. Independent thinker and worker. Someone whois not afraid to think outside the box. Always, always, always starting with whatthe member wants. Make certain you understand what they are requestingand use active listening. Sometimes a member needs our help in this way todetermine what they really want. Then don’t ever feel like anything is “offthe table.” We are empowered people who consistently need to challengeconventional wisdom in what needs to be done. Each member is unique andneed to be treated as such and this sometimes requires help in ways that maynot be considered conventional. Search out as many different resources asyou can here at [the organization] and look to grow professionally utilizingthese resources as we truly control our development here.
2 You have to be able to work with an open mind and an open heart.Preconceived notions of banking or customer service should be eliminatedbecause we operate differently than any other institution I know of. You willhave to be ready to adopt change on the fly and be able to work withoutbeing micromanaged. You will have to trust yourself and be confident in thedecisions you make, because you are empowered to do what is best for ourmembers!
3 Personal attributes that I consider important for someone to be successful at[the organization] include: being open minded and flexible,nonjudgmental, kind, resourceful, being a good listener and communicator.Having the ability to relate to others in some way and having a strongcommitment to the success of our members and the organization.
4 I feel I had one of the best life experiences working at a different financialinstitution gave me a huge insight into what is offered outside of [theorganization]. I would ask new employees to take a few minutes, examinewhere they currently bank, but also seek out information about localinstitutions, so that they can see just how different we are, and howextraordinary our services are for our members.
5 You need to really have empathy and sympathy for the member. After spending12 years at a community bank, I was disgusted with how some bankers treatedless fortunate people or customers that were struggling. We never can havethat attitude with our members. They may have made some poor choices, butbad things happen to good people, and many people have never learnedhow to properly handle finances. By having Empathy and Sympathy forpeople you will want to do what’s right for them. Fortunately, everything isstructured at [the organization] to help us be straight-forward with ourmembers. We tell them what the rate is and why and what ourrecommendation is.

34 D. CAMPBELL
6 Openness to learning new information is key. Although our commitment todoing what is right for the member does not change, how we follow throughon the commitment does. In the last year the changes in e-pay, onlinebanking, regulations for home equity loans, and how we do first mortgagesare examples of how we need to be open to change and learning new thingsto be able to best help our members.
7 You have to care about people—we can teach you all of the process andprocedure pieces we want, but if you don’t have the desire to help peopleyou won’t have success at [the organization]. [The organization] is anawesome organization to work for and you receive a lot of freedom to makedecisions for our members every day, however there is a lot of accountabilitythat comes with that freedom so you need to have a strong desire and passionto push yourself to help others every day and to put others before yourself.
8 My #1 message would be that you need to be excited to help people andexcited to have a direct impact on members. No matter what your role is ifthat is not core to you as a person you will not be successful or enjoy workingat [the organization]. Whether you are in a branch, work in IT, or focus isfinancial accounting you need to have a core belief in what we do. If you donot you will always struggle here and never enjoy what we do resulting inpoor performance?
9 I’d say one of the number one attributes to be a successful long-term employeeis to be a good listener. Our job comes down to a conversation between twopeople—in that conversation you learn so much about the member—whatthey are passionate about, what they are looking to [the organization] forhelp on. If you’re perceptive and listening, you can find out what they’relooking for and the best way to help the member. Another attribute thatbides well is having empathy and also the ability to be creative and know thatnot everything is black and white at Affinity—we care about our member’sfinancial future and need to be willing to do whatever it takes to get them ina good position.
10 Open minded to the difference that we are compared to the last company thatyou worked for. Open to learning—we wear so many hats here that you willwant to make sure that you spend time learning all the roles you that you willbe a part of teller, loan office, mortgage officer, etc. . . . Goodlistener—members, other member advisors, and your leader will need you tolisten to what they are trying to say to you.
11 Love what you do! Trust that the organization has given you the empowermentto make the right decisions for our members, Take pleasure in learningsomething new about our members so we can best meet their needs, Musthave great interpersonal and customer service skills, [the organization] isdifferent from the other places you may have worked!
12 Flexibility, confidence in your own past experiences, willingness to learn on thefly with no formal training classes.
13 To be successful at [the organization] you need to really care about others andbe inspired to connect with them and get to know them as people. Bepassionate about the opportunity and obligation to help make a differencein their lives. You need to enjoy getting outside of yourself to help, fullyunderstanding and believing that everyone will be successful by putting ourmembers first, then the organization and lastly ourselves. When ourmembers are successful that makes for a successful organization and whenan organization is successful you have successful employees.
14 Having fun, working hard, and doing what is right for each member and theirgiven situation. Learn about our members, understand their goals, and yourdecisions and actions will always be correct.

EMPLOYEE SELECTION AS A CONTROL SYSTEM 35
15 Selflessness, openness to change, caring, integrity, being flexible and adaptableto member and organizational needs, self motivation, good work ethic.
16 A strong passion to help others is critical. Employees must be willing to take onrisks, and not be afraid of doing new things. Change is good, even though itis scary at times. I think most importantly, employees need to be themselvesand bring their own unique personality to [the organization]. It is importantto be confident when making decisions, and trust that the decisions madewill be supported.
17 The empowerment that you have also comes with responsibility. You need to beable to make decisions on your own and need to be independent andself-reliant.
18 I personally think that in order to be successful at [the organization] you needto be a passionate person. It is also good to be organized.
19 I think the most important attribute to have is to have self-motivation and theability to look at situations from all different angles. Being able to motivateyourself to learn new things and to think outside the box will allow you to gofar as a member advisor.
20 There are several personal attributes that I would tell an employee they wouldneed to be successful at [the organization]. Here are the ones that I see asmost important: Fight to serve, Connect with people, Take ownership andmaintain accountability without a lot of oversight, Trust our members andthe organization, Be willing to challenge yourself, your peers, and theorganization, asking why for the member, Have confidence, despite not everbeing able to know everything, Know what you can contribute and bring it,Jump in and be willing to learn as you go, Be willing to break from thecomforts and constraints of the status quo, being creative and maintaininghigh-quality performance for our member.
REFERENCES
ABERNATHY, M. A.; J. BOUWENS; AND L. VAN LENT. “Determinants of Control System Design inDivisionalized Firms.” The Accounting Review 79 (2004): 545–70.
AGARWAL, S., AND F. WANG. “Motivating Loan Officers: An Analysis of Salaries and Piece RatesCompensation.” Working paper, Federal Reserve Bank of Chicago and University of IllinoisChicago, 2008.
AGHION, P., AND J. TIROLE. “Formal and Real Authority in Organizations.” Journal of PoliticalEconomy 105 (1997): 1–29.
AKERLOF, G. A., AND R. KRANTON. “Economics and Identity.” The Quarterly Journal of Economics115 (2000): 715–54.
AKERLOF, G., AND R. KRANTON. “Identity and the Economics of Organizations.” Journal of Eco-nomic Perspectives 19 (2005): 9–32.
BAKER, G. “Distortion in Optimal Incentive Contracts,” Journal of Human Resources 37 (1992):728–51.
BAKER, G. P.; R. GIBBONS; AND K. J. MURPHY. “Subjective Performance Measures in OptimalIncentive Contracts,” Quarterly Journal of Economics 109 (1994): 1125–56.
CAMPBELL, D.; S. DATAR; AND T. SANDINO. “Organizational Design and Control Across MultipleMarkets: The Case of Franchising in the Convenience Store Industry.” The Accounting Review84 (2009): 1749–79.
CAMPBELL, D.; M. EPSTEIN; AND F. A. MARTINEZ-JEREZ. “The Learning Effects of Monitoring.”The Accounting Review 86 (2011): 1909–34.
COHEN, Y., AND J. PFEFFER. “Organizational Hiring Standards.” Administrative Science Quarterly31 (1986): 1–24.

36 D. CAMPBELL
EDMONDSON, A. “Psychological Safety and Learning Behavior in Work Teams.” AdministrativeScience Quarterly 44 (1999): 350–83.
FALK, A., AND M. KOSFELD. “The Hidden Costs of Control.” American Economic Review 96 (2006):1611–30.
FERNANDEZ, R. M.; E. CASTILLA; AND P. MOORE. “Social Capital at Work: Networks and Employ-ment at a Phone Center.” American Journal of Sociology 105 (2000): 1288–356.
FREI, F. X.; R. J. ELY; AND L. WINIG. “Zappos.com 2009: Clothing, Customer Service, and Com-pany Culture.” Harvard Business School Case 610-015, 2011.
GIBBS, M.; K. MERCHANT; W. VAN DER STEDE; AND M. VARGUS. “Determinants and Effects ofSubjectivity in Incentives.” The Accounting Review 79 (2004): 409–36.
GOLDBERG, M. “Discrimination, Nepotism, and Long-Run Wage Differentials.” Quarterly Jour-nal of Economics 97 (1982): 307–19.
GOODSELL, C. The Case for Bureaucracy. Washington, DC: CQ Press, 2004.HERTZBERG, A.; J. M. LIBERTI; AND D. PARAVISINI. “Information and Incentives Inside the Firm:
Evidence from Loan Officer Rotation.” Journal of Finance 65 (2010): 795–828.HESKETT, J. L.; W. E. SASSER, Jr.; AND L. A. SCHLESINGER. The Value Profit Chain: Treat Employees
Like Customers and Customers Like Employees. NY: The Free Press, 2003.HESKETT, J.; W. E. SASSER, Jr.; AND L. SCHLESINGER. The Service Profit Chain. NY: Free Press, 1997.ITTNER, C.; D. LARCKER; AND M. MEYER.“Subjectivity and the Weighting of Performance Mea-
sures: Evidence from a Balanced Scorecard.” The Accounting Review 78 (2003): 725–58.LIBERTI, J., AND A. MIAN. “Estimating the effect of hierarchies on information use.” Review of
Financial Studies 22 (2009): 4057–90.MERCHANT, K. A. Control in Business Organizations. Cambridge, MA: Ballinger, 1985.MERCHANT, K. A., AND W. VAN DER STEDE. Management Control Systems: Performance Measurement,
Evaluation, and Incentives, Second edition. London: Prentice Hall, 2007.MOERS, F. “Performance Measure Properties and Delegation.” The Accounting Review 81 (2006):
897–924.NAGAR, V. “Delegation and Incentive Compensation.” The Accounting Review 77 (2002): 379–95.OUCHI, W. “A Conceptual Framework for the Design of Organizational Control Mechanisms.”
Management Science 25 (1979): 833–48.PRENDERGAST, C. “Intrinsic Motivation and Incentives.” American Economic Review: Papers &
Proceedings 98 (2008): 201–5.SIMONS, R. Performance Measurement and Control Systems for Implementing Strategy. Upper Saddle
River, NJ: Prentice Hall, 2000.SNELL, S. A. “Control Theory in Strategic Human Resource Management: The Mediating Ef-
fect of Administrative Information.” Academy of Management Journal 35 (1992): 292–327.TON, Z. “QuickTrip.” Harvard Business School Case 611-045, 2011.VAN DEN STEEN, E. “Culture Clash: The Costs and Benefits of Homogeneity.” Management
Science 56 (2010): 1718–38.