Employee Perceptions of Fairness in Performance Appraisals ...
The Pennsylvania State University
The Graduate School
College of Learning and Performance Systems
EMPLOYEE PERCEPTIONS ABOUT SELF-EFFICACY
AND TRAINING SATISFACTION
A Dissertation in
Learning, Design, and Technology
by
Stephenie S. Schroth
© 2017 Stephenie S. Schroth
Submitted in Partial Fulfillment
of the Requirements
for the Degree of
Doctor of Philosophy
May 2017

ii
The dissertation of Stephenie S. Schroth was reviewed and approved* by the following: Susan M. Land Associate Professor of Learning, Design, and Technology Director of Graduate Studies Kyle L. Peck Professor of Learning, Design, and Technology Dissertation Adviser Committee Chair Gabriela T. Richard Assistant Professor of Learning, Design, and Technology Mark D. Threeton Assistant Professor of Workforce Education Edgar P. Yoder Professor of Agricultural and Extension Education *Signatures are on file in the Graduate School.
iii
ABSTRACT
An expanding convenience store company with over 530 locations in six
states implemented a Trainer Store/Performance Development Specialist (TPDS)
model as part of a pilot program to reduce turnover. The data from the pilot program
demonstrated that the TPDS model was effective in reducing turnover. The purpose
of this study was to better understand how employees perceived self-efficacy and
training satisfaction through the lens of social learning theory which states that
individuals learn in a social context through observation, modeling, and
reinforcement.
An online survey was administered to employees who were recently hired
for the role of salesperson to determine the parallel to social learning theory, self-
efficacy, and training satisfaction, particularly with the training session, training
content, trainer, and transfer of learning from training to work. The study surveyed
98 employees who completed their training in one of three models (Home
Store/Mentor (HM), Trainer Store/Mentor (TM), or TPDS). The researcher
investigated whether the TPDS model was perceived by trainees as better aligned
with social learning theory than the other models. The researcher also examined the
Trainer Store model compared with the Home Store model.
The results indicate that overall there were no apparent differences between
the three models (HM, TM, or TPDS) or the two models (Home Store or Trainer
Store) in terms of the training session, trainer, or transfer of learning from training
to work. However, the results indicate that there may have been a difference

iv
between the models with regard to the trainee’s perceptions of the training content.
Based on the relatively small amount of data that was gathered, the training content
of the TM model appears to have been perceived as better than content in the other
models, HM and TPDS. However, the results of this research should be considered
tentative, given the low number of respondents. More research is warranted.
There were several limitations with this research study. One limitation was
the demographics and locations of the Trainer Stores. The Trainer Stores were
selected based on historical data of areas of high turnover. Another limitation was
the use of a survey tool as the primary instrument, particularly the use of Likert
scales for measuring satisfaction. There is the potential for measurement error by
having wrong, or inappropriately worded, anchors. And, a third limitation was the
low number of respondents. Out of approximately 328 employees, 98 completed
the survey in its entirety, which resulted in a 30% response rate. The TPDS model
had approximately a 5% response rate. The TM model had approximately an 8%
response rate. And, the HM model had approximately a 44% response rate. The
Trainer Store response rate was approximately 45% and the Home Store response
rate was approximately 55%. The limitation and reduction of the population to only
20% of the eligible employees and lower than expected response and completion
rates has reduced the validity of the study.
Keywords: collective efficacy, self-efficacy, social learning theory, survey, training
satisfaction

v
TABLE OF CONTENTS
LIST OF TABLES………....……………………………………………………………………..vi
LIST OF FIGURES……………….......…………………………………………………………vii
ACKNOWLEDGEMENTS…………………………………...………………………………...viii
CHAPTER 1: INTRODUCTION................................................................................................... 1 Social Learning Theory........................................................................................................2 Corporate Training Programs ..............................................................................................7 Research Purpose and Questions .......................................................................................10 Trainer Store/Performance Development Specialist Model ..............................................13
CHAPTER 2: LITERATURE REVIEW...................................................................................... 22
Self-Efficacy and Collective Efficacy ...............................................................................23 Self-Efficacy and Collective Efficacy in Corporate Training Programs ...........................26 Satisfaction Surveys ...........................................................................................................28 Satisfaction Surveys in Corporate Training Programs.......................................................33
CHPATER 3: METHODS............................................................................................................ 38
Study Variables…………………………………………………………………………..38 Quantitative Research……………………………………………………………………38 Design of the Study………………………………………………………………………42 Data Collection……………………………………………………………….………….43 Participants…………………………………………………………….............................45 Statistical Data Analysis…………………………………………...…………………….47
CHAPTER 4: RESULTS.............................................................................................................. 49
Section One: Basic Descriptive Results for the Outcome Measures ……….…….…….50 Section Two: Social Learning Theory Elements ….…………………….……………...51 Section Three: Differences in Four Outcome Scores by Training Method Delivery…...54 Section Four: Differences in Four Outcome Scores by Store Location…….…………...68
CHAPTER 5: DISCUSSION........................................................................................................ 79
Summary of Quantitative Results………………………………………………………..79 Limitations……………………………………………………………………….………80 Further Research…………………………………………………………………………82 Conclusion……………………………………………………………………………….83
REFERENCES…………………………………………………………………………………..86
APPENDIX A: EMAIL COMMUNICATION………………………………………………....91
APPENDIX B: TRAINING AND DEVELOPMENT JOB SATISFACTION SURVEY…...…92
APPENDIX C: EXEMPTION DETERMINATION……………….……….…………………..98

vi
LIST OF TABLES
Table 1: Comparison of TPDS Model and Other Models…………....……………………….….6
Table 2: Location and Trainer Summary…...…………….………………………………….….50
Table 3: Comparison of Open-Ended Responses by Method of Delivery …….…….………….51
Table 4: Comparison of Trainer Store Model and Other Models…...…….…………………….53
Table 5: Summary of Satisfaction with Training Session………………………………………55
Table 6: Summary of Training Content Satisfaction…….……………………...……………....59
Table 7: Summary of Satisfaction with the Trainer……...……….………………………….….61
Table 8: Summary of Transfer of Learning…………….…………………………...……….….65
Table 9: Comparison of Open-Ended Responses by Location …………...….…...…………….69

vii
LIST OF FIGURES
Figure 1: Oneway Analysis of Training Session Summated Score by Location & Trainer…….57
Figure 2: Oneway Analysis of Training Content Summated Score by Location & Trainer.........60
Figure 3: Oneway Analysis of Trainer Summated Score by Location & Trainer........................63
Figure 4: Oneway Analysis of Transfer of Learning Summated Score by Location & Trainer...66
Figure 5: Oneway Analysis of Training Session Summated Score by Training Location...........71
Figure 6: Oneway Analysis of Training Content Summated Score by Training Location...........73
Figure 7: Oneway Analysis of Trainer Summated Score by Training Location..........................75
Figure 8: Oneway Analysis of Transfer of Learning Summated Score by Training Location.....77

viii
ACKNOWLEDGEMENTS
I would like to extend a sincere thank you to all who have assisted me throughout my
education and research. First and foremost, I would like to thank God for giving me knowledge
and understanding (Proverbs 2:6). Also, I would like to thank my parents, Phyllis Koontz-
Schroth and Stephen Schroth, for their love and patience and self-sacrifice in sending me to
private schools for a better education. And, I would also like to thank all of my colleagues and
friends for their encouragement and support. Last, but certainly not least, I would like to thank
my academic advisor, Dr. Kyle Peck, for his mentorship and wisdom, and my doctoral
committee, Dr. Gabriela Richard, Dr. Mark Threeton, and Dr. Edgar Yoder, for their feedback
and insight. Thank you for helping me to accomplish my dreams and goals!

1
CHAPTER 1: INTRODUCTION
This chapter defines and explains social learning theory, prefaces corporate training
programs, states the research purpose and questions, and presents the Trainer Store/Performance
Development Specialist (PDS) model. Social learning theory is a cognitive process that takes
place in a social setting. Within a social setting, individuals learn from others through
observation, modeling, and reinforcement. The idea of a model is important within the confines
of this research study. Three concepts of social learning theory are discussed, which are self-
efficacy, vicarious learning, and self-regulation. Self-efficacy is the belief in ourselves to achieve
goals or tasks. Vicarious learning is learning through observing the actions and/or behaviors of
others. And, self-regulation is setting goals for ourselves and going through the process that leads
to achieving those goals.
Socialization is an important element in the adjustment of a new employee to an
organization. The company’s climate, culture, and environment are all factors that can affect an
employee’s job satisfaction and willingness to stay with an organization. An employee can
experience positive and negative affect which impacts employee engagement. Several companies
with similar characteristics to the company in this research study are presented in this chapter.
The purpose of the research was to better understand how employees perceived self-
efficacy and training satisfaction through the lens of social learning theory. The researcher aimed
to determine if the TPDS model was more aligned with social learning theory than the other
models, which are Home Store/Mentor (HM) and Trainer Store/Mentor (TM). The researcher
also examined the Trainer Store model compared with the Home Store model.

2
Social Learning Theory
Adult learning research and theory have undergone a series of paradigm shifts, from
behaviorist to cognitive, constructivist, and social learning theory (Fenwick, 2008). Behaviorism,
the idea that learning should be understood and explained through what can be directly observed,
was a major influence on past vocational education and the present workplace learning (Hager,
2010). According to Bandura, the behavior of individuals was based on personality principles
and explained by inner drives, impulses, and needs (Bandura, 1971). Bandura (1977a) found that
these psychological changes and procedures were mediated through cognitive events and
processes. These psychological changes and procedures change the expectations of personal
efficacy (Bandura, 1977). An efficacy expectation contrasts with an outcome expectation, in that
the former is the belief that one can perform the behaviors necessary to produce the desired
outcome and the latter is the belief that a behavior will lead to the desired outcome (Bandura,
1977).
Bandura’s social learning theory states that individuals learn through observing other
individuals and their attitudes, behaviors, and the outcomes of those behaviors (1977). To
explain how learning and motivation transpire through observation and modeling, Bandura
structured his ideas within a cognitive perspective as opposed to a behaviorist standpoint
(McShane & Von Glinow, 2015). These beliefs and ideas laid the groundwork for social
cognitive theory which is an approach to understand human action, cognition, emotion, and
motivation (Maddux & Gosselin, 2003). As stated by Maddux and Gosselin (2003), there are
four basic premises of social cognitive theory: 1) individuals observe and evaluate their
behaviors, emotions, and thoughts; 2) individuals respond behaviorally, cognitively, and
emotionally to environmental events; 3) individuals’ perceptions of identity and self can occur in

3
patterns and situations; and 4) individuals select goals and regulate their behavior in the pursuit
of those goals.
Social cognitive theory can be viewed through multiple lenses where actions can be taken
to improve human functioning (Pajares, 2008). It provides a better understanding of what and
how people learn (Ormrod, 2014). The three most important aspects of social cognitive theory
that are most relevant to employee motivation are learning behavior consequences, behavior
modeling, and self-regulation (McShane & Von Glinow, 2015). Social cognitive theory states
that we learn through imitating, observing, and modeling the behavior of other individuals within
our social context (Neck, Houghton, & Murray, 2017). It is an individual’s belief of being
capable of performing a task, and is often referred to as self-efficacy theory, social cognitive
theory, or social learning theory (Robbins & Judge, 2017). Therefore, social cognitive theory can
be applied to both cognitive processes and social learning.
Social learning is important in the setting of the workplace because employees have a
tendency to model the behavior of their managers and/or more capable co-workers (Neck,
Houghton, & Murray, 2017). Teaching by modeling allows the teacher to model behaviors for
the learners to imitate (Knowles, Holton, & Swanson, 2015). According to Bandura, most human
behavior is learned through modeling and observation (1977a). Behaviors that are complex can
only be produced through modeling (Bandura, 1977a). Furthermore, the process of acquiring
new information can be shortened considerably through the use of modeling (Bandura, 1977a).
Bandura (1971) contended that most behaviors that individuals possess are learned either
consciously or unconsciously through the influence of a model. Through hearing and seeing what
happens to other individuals, people learn the consequences of behavior (McShane & Von
Glinow, 2015). Learning through observation involves four components: 1) attentional

4
processes; 2) motivational processes; 3) motor reproduction processes; and 4) retention processes
(Bandura, 1977a). The process of acquiring knowledge and skills can be lessened through an
appropriate model (Bandura, 1971). The role of a model is to demonstrate the desired behaviors,
instruct learners to imitate those desired behaviors, encourage them physically when they do not
succeed, and reward them when they do succeed (Bandura, 1977a). Moreover, a good model is
better than the result of self-guided actions without a model (Bandura, 1971).
There are also several important cognitive concepts and processes of social cognitive
theory. These concepts and processes help to make the argument that the TPDS model is better
than the other models from the standpoint of social cognitive theory. The first concept is self-
efficacy, which is the belief that we have in ourselves that we can achieve (Neck, Houghton, &
Murray, 2017). Individuals with high self-efficacy believe that they possess the ability, clear
expectations, energy, and resources necessary to complete the task (McShane & Von Glinow,
2015). The perception of self-efficacy impacts a learner’s choice of activities, their goals, their
effort, and the persistence in those activities, which ultimately impacts learning and achievement
(Ormrod, 2014). Individuals who are persuaded verbally are more likely to have a greater and
more persistent effort even when difficult problems arise (Bandura, 1994). Learners are more
likely to engage in certain behaviors when they have high self-efficacy or believe that they will
be able to execute the behaviors successfully (Bandura, 1971).
The second concept is vicarious learning, which is the process of learning through
observing the actions or behaviors of another individual or individuals (Neck, Houghton, &
Murray, 2017). Besides observing the actions or behaviors of others, individuals also learn
through imitating and practicing the behaviors of others (McShane & Von Glinow, 2015). An
individual who observes behavior reinforcement through another individual is likely to engage in

5
that same behavior reinforcement (Ormrod, 2014). In essence, the individual is modeling the
behavior of another individual. The term modeling can describe what the model does, such as
demonstrate a behavior, or can describe what the observer does, such as imitate the behavior
(Ormrod, 2014). Individuals who see social models who are similar to themselves increases their
individual beliefs to accomplish similar tasks to succeed (Bandura, 1994).
Lave and Wenger (1991) describe the social world of learning in practice through
legitimate peripheral participation, which “refers both to the development of knowledgeably
skilled identities in practice and to the reproduction and transformation of communities of
practice” (p. 55). It is the process in which newcomers become part of the community of practice
(Lave & Wenger, 1991). In this context, it is the process in which new employees become part of
the team. By participating in communities of practice, individuals learn and master the
knowledge and skills required to transition from newcomers to full participants within the
sociocultural practice (Lave & Wenger, 1991). Lave and Wenger (1991) further describe the
relationship between learning and social situations through situated learning, which “explores the
situated character of human understanding and communication” (p. 14). In other words, learning
is distributed among the individuals within a community of practice.
The third concept is self-regulation, which is the process of setting goals, engaging in
processes that lead to those goals, and attaining those goals through defining the line between the
current state and the desired state (Neck, Houghton, & Murray, 2017). Through self-regulation,
individuals establish short-term and long-term objectives, select achievement standards, plan a
course of action, take into consideration alternative courses of action, and understand the
consequences of an action or actions (McShane & Von Glinow, 2015). Having self-regulation
skills can have a positive influence on achievement (Ormrod, 2014). In other words, grasping the

6
knowledge and skills needed to obtain a high level of performance can have a positive effect on
attaining the desired outcomes. Individuals motivate themselves, form beliefs about their
abilities, anticipate the outcomes of their actions, set goals for themselves, and plan courses of
action to reach a desired or future state (Bandura, 1994).
Table 1: Comparison of TPDS Model and Other Models
Concept TPDS Model Other Models
Self-efficacy The encouragement (and other feedback) comes from a specialist who has been trained to do this well.
Employees are more likely to be encouraged from their mentor or mentors to believe that they have the ability, clear expectations, energy, and resources necessary to complete the task.
Vicarious Learning Employees are more likely to learn from observing the actions or behaviors of a PDS who regularly trains new employees in a small group setting.
Employees are more likely to learn from observing the actions or behaviors of one or more members of the management team.
Self-regulation Trainees’ goals for themselves and for their future can be shared with their PDS and peers.
Trainees are more likely to be supported in setting goals for themselves and for their future. Their goals can be shared with their assigned mentor or mentors.
From the viewpoint of the researcher, the TPDS model was perceived as better than the
other models through the lens of social learning theory for several reasons. First, the employees
have the opportunity to learn in a small group setting. They are encouraged by their PDS and
peers. Second, the employees learn from a dedicated mentor and trainer, a PDS, who regularly
trains new employees. The PDS has received specialized training from the company’s learning
department. And third, the employees have the opportunity to set goals for themselves and to

7
share those goals with their mentor and peers. The TPDS model, which has been more recently
created, has proven much more effective in terms of dollars and training hours saved. The
researcher believed that the model was a better model than the other models based on social
learning theory. However, the Training and Development Job Satisfaction Survey (Appendix B)
demonstrated different results on how employees rated the TPDS model as compared with the
other models in terms of their satisfaction with the content, session, trainer, and transfer of
learning. The researcher further examined the Trainer Store model compared with the Home
Store model. Chapter 4 presents the findings and results in greater detail.
Corporate Training Programs
Socialization is a process to help employees adapt to the organization’s culture (Robbins
& Judge, 2017). Introducing new employees to a company, its policies, strategies, and values is a
determining factor and indicator as to how engaged and how involved new employees will be
with the organization (Levy, Weitz, & Grewal, 2014). Adjusting to a new work role is one model
of socialization (Allen & Shanock, 2012). Along with socialization, employees go through the
most training when they first enter the organization (Feldman & O’Neill, 2014). “Organizational
socialization is defined as the process by which newcomers acquire the attitudes, behaviors, and
knowledge needed to make the transition from being outsiders to becoming effective members of
an organization” (Tang, Liu, Oh, & Weitz, 2014, p. 62). It is the process through which
individuals learn the expected behaviors, social knowledge, and values to perform their roles
within an organization (McShane & Von Glinow, 2015). And, it is the process through which
new employees are integrated into the company’s corporate structure (Neck, Houghton, &
Murray, 2017).
8
The Container Store, selected by Fortune Magazine as one of the best places to work, has
an intensive training program where employees go through a program referred to as Foundation
Week (Levy, Weitz, & Grewal, 2014). Employees receive a handbook and several assignments
to complete throughout the week (Levy, Weitz, & Grewal, 2014). On the first day, the employees
learn about the company’s philosophy and receive a personal visit from the Store Managers
(Levy, Weitz, & Grewal, 2014). Throughout the rest of the week, the employees engage in
hands-on and on-the-floor training (Levy, Weitz, & Grewal, 2014). During the final day, a
ceremony is held where the employees receive an apron, which is a symbol of their membership
into the organization (Levy, Weitz, & Grewal, 2014).
An organization is comprised of more than just individuals. It also includes groups or
teams working together as a collective voice. The strength of a group, organization, or nation
comes from the group’s sense of collective efficacy in problem solving together (Bandura,
1986). Perceived self-efficacy is defined as a group’s shared beliefs in its capabilities to plan and
perform courses of action (Bandura, 1997). Group effectiveness is influenced through social
facilitation which is the tendency for individuals to perform tasks better in the presence of others
(Neck, Houghton, & Murray, 2017).
The term “workplace learning” is replacing the term “training” (Marsick, Watkins, &
O’Connor, 2010). “Workplace learning sits at the intersection of organizational behavior –
theories and knowledge about the workplace – and learning – theories and knowledge about how
people learn, i.e., what causes learning, the nature of its facilitation, or what motivates learners”
(Marsick, Watkins, & O’Connor, 2010, p. 198). The most important issues in workplace learning
are understanding how people solve workplace problems through learning and understanding
how groups of workers learn (Fenwick, 2008).

9
An organizational culture is defined as the “set of values, traditions, and customs of a
firm that guides employee behavior” (Levy, Weitz, & Grewal, 2014, p. 253). Beliefs,
fundamental assumptions, and values are often only visible through the surface level (Feldman &
O’Neill, 2014). Organizational climate, on the other hand, focuses on employee perceptions of
the visible aspects of the organization, such as policies, practices, procedures, rewards, and
routines (Jex, Sliter, & Britton, 2014). Within the context of organizational environment, there
has been little research about the interactions among organizational culture, job satisfaction,
motivation to transfer learning, and turnover.
The idea of a learning organization may have caused a change in how we think about the
process of learning in the workplace (Russ-Eft, 2010). Organizational learning theory focuses on
groups of individuals who learn and solve problems together (Russ-Eft, 2010). Whole Foods
creates an organizational culture through its employees working in teams during the hiring
process (Levy, Weitz, & Grewal, 2014). Ceremonies that welcome new employees help teach
them what is valued by the organization (Feldman & O’Neill, 2014).
There are two basic types of mood dimensions in the context of organizational behavior:
positive affect and negative affect where the former includes emotions of cheerfulness,
excitement, and self-assurance and the latter includes emotions of boredom, lethargy, and
depression (Neck, Houghton, & Murray, 2017). Employee engagement is a connection with the
organization and a passion for the job (Neck, Houghton, & Murray, 2017). More specifically, it
is an individual’s cognitive or logical and emotional motivation toward work-related goals
through a focused, intense, persistent, and purposeful effort (McShane & Von Glinow, 2015).

10
Engaged employees not only work for a paycheck or a promotion. They also work to
achieve the goals of the organization and therefore, are less likely to leave the company (Levy,
Weitz, & Grewal, 2014). To motivate and retain younger generations, it is important to create a
culture of engagement and fun (Lowe, Levitt, & Wilson, 2011). Several of the companies that
have been recognized as one of “The 100 Best Companies to Work for in America” have
incorporated fun in their mission and vision (Karl, Peluchette, Hall, & Harland, 2005). The
company in which the researcher studied has the motto of “work hard, play hard.” With a one-
million-dollar party budget, this organization has been notorious for creating a culture of
engagement and fun through awards, contests, fabulous prizes, parties, recognition events, swag,
etc. The employees of this company work hard, but also play hard through the many different
events that the organization puts together.
Research Purpose and Questions
The aim of this study was to interpret the employee’s perceptions based on the constructs
of social learning theory and self-efficacy, specifically how satisfied employees were with the
training session, training content, trainer, and transfer of learning from training to work. The
purpose of this research was to better understand how employees who have been recently hired
for the role of salesperson felt about their level of satisfaction with training and development and
to better understand the perceived conformity with principles of social learning theory as well. A
salesperson at this company performs all related job functions when working in the food service
area or sales area of the store. This includes preparing quality food products, ringing accurate
register transactions, and maintaining general appearance and cleanliness of store premises. This
information from this research study will be valuable in the training and development of future
employees within this company, as well as within other similar organizations.
11
Through the use of a survey tool, the new employees had the opportunity to indicate their
perceptions with the level of satisfaction with training and development. The survey tool helped
to discover what factors influence employees’ self-efficacy and training satisfaction. The
research helped to uncover the types of training and transfer of learning that helped to promote
higher levels of self-efficacy and work assertiveness with employees at this company and has
implications for other similar organizations.
According to Stajkovic and Luthans (1998), there is a lack of research on the relationship
between self-efficacy and work-related performance. Colquitt, LePine, and Noe (2000) suggest
that further research is needed on other and newer types of training outcomes. Frayne and
Geringer (2000) have found inconsistent results in efficacy and outcome expectancies related to
salesperson performance which warrants additional research involving self-efficacy theory.
Chiaburu and Lindsay (2008) recommend further research on motivation to learn and motivation
to transfer skills and tasks. Latif, Jan, and Shaheen (2011) state that research is needed on the
effect of training on overall job satisfaction.
Do employees leave training feeling readier and more successful to complete the
requirements of the job for which they applied? What elements of the training session, training
content, trainer, or specific type of training contribute to higher levels of self-efficacy among
employees during training?
To discuss the relationships between social learning theory, self-efficacy, and training
satisfaction, the following research questions were addressed in this research study:
Research Question 1: Do employees perceive the TPDS model as being more consistent
with social learning theory principles than the HM and TM models?

12
Research Question 2: Does the TPDS model result in employees being more satisfied
with the training session than the HM and TM models?
Research Question 3: Does the TPDS model result in employees being more satisfied
with the training content than the HM and TM models?
Research Question 4: Does the TPDS model result in employees being more satisfied
with the trainer than the HM and TM models?
Research Question 5: Does the TPDS model result in employees being more satisfied
with the transfer of learning from training to work than the HM and TM models?
Research Question 6: Do employees perceive the Trainer Store model as being more
consistent with social learning theory principles than the Home Store model?
Research Question 7: Does the Trainer Store model result in employees being more
satisfied with the training session than the Home Store model?
Research Question 8: Does the Trainer Store model result in employees being more
satisfied with the training content than the Home Store model?
Research Question 9: Does the Trainer Store model result in employees being more
satisfied with the trainer than the Home Store model?
Research Question 10: Does the Trainer Store model result in employees being more
satisfied with the transfer of learning from training to work than the Home Store model?

13
Trainer Store/Performance Development Specialist Model
An expanding convenience store company with over 530 locations in six states has been
dedicated to increasing the quality of training for its employees. In the fiscal years of 1994 and
1995, the organization created a training center where all new employees were trained. The
center was successful in the enhancement of the quality of training and the reduction of turnover,
however, as the company continued to expand rapidly, the cost to operate the center and the
driving distance increased for the trainers and the trainees. Recently, the organization revisited
this concept with a newer version of a training center model, known as the Performance
Development Specialist (PDS) program which utilized a few select stores, known as Trainer
Stores. The program was piloted in seven locations across four of the six states in which the
company is currently established: 1) Greensboro, North Carolina; 2) Raleigh, North Carolina; 3)
Harrisburg, Pennsylvania; 4) Pittsburgh, Pennsylvania; 5) Roanoke, Virginia; 6) Beckley, West
Virginia; and 7) Morgantown, West Virginia. These locations were selected based on feedback
from the Regional Managers (RMs), growth areas from a geographic standpoint, and historical
turnover data and trends from the past five years.
Each of the locations is led by a PDS from the area. A PDS is considered a highly skilled
and tenured mentor who can provide more consistent and quality training. The PDSs are
essentially an extra set of eyes in the field looking at better ways to train new employees. Each
PDS is primarily responsible for no more than eight stores in a district. The PDS’s roles include
new employee onboarding, salesperson training, and mentor development. The PDS facilitates
the salesperson training and orientation programs for newly hired team members. They partner
with managers and mentors to plan and coordinate salesperson training, to confirm training
completion, and to discuss performance after being in the position for which they were trained.

14
The PDS ensures mentors are prepared to train new team members by providing “train-the-
trainer” sessions and ongoing coaching. They coach and develop store level management
regarding training and development needs of team members to achieve performance. The PDS
measures the performance of new team members and provides a feedback loop to District
Managers (DMs), Store Managers (SMs), and Corporate Support Departments. They partner
with DMs to identify new employees’ skill gaps and provide targeted solutions. Further, the PDS
coordinates and participates in training events, such as webinar sessions, to support the training
and performance of employees. They also assist in the recruitment of new team members
through identifying market trends relating to compensation and benefits, as well as providing
feedback to Corporate Support Departments. The PDS supports the Store Manager in selecting,
interviewing, and hiring new employees. Each PDS is evaluated on the following categories: 1)
Training Hours (training hours, trainer hours, mentor hours saved, manager hours saved, and
hires); 2) Scores (Operation Shops and Quality Assurance); 3) Hospitality Survey; 4) Turnover;
5) Mentors (trained by PDS); and 6) Talent Workz (training completion percentage and training
completion percentage on time).
The concept is a collaborative effort between the PDS and the DM, Training Store
Manager (TSM), and Home Store Manager (HSM). This is important in order for the new
employee to have more follow-up attention throughout the onboarding process. It is often
difficult to find the time to meet with and provide feedback to the new employee. The PDS is
primarily responsible for training, which includes all seven modules of foundational salesperson
training and Training for Intervention Procedures (TIPS). The training curriculum is exactly the
same in both Trainer Stores and Home Stores, and it consists of 11 days or 74 hours total of
training involving the learner, manager, mentor, and PDS. The final day is a transition day,

15
which consists of the PDS and TSM taking the new employee to his or her Home Store to
introduce him or her to the team. It also includes a celebration of the new employee’s successful
completion of training. At the Home Store, the new employee is paired with a mentor. The new
employee gets to tour the store, receive an end of training (EOT) evaluation, meet the team, and
work in the store with the team for about an hour to acclimate to the new setting.
The goals and objectives of the program are to:
● Meet the rapid growth of the organization and the training needs of new
employees
● Provide more consistent training and one-on-one training interactions across the
organization
● Gain more insight into training strengths and opportunities in the store to improve
performance
● Decrease turnover and training hours
● Improve store culture, atmosphere, and engagement survey scores
The Trainer Stores did help to decrease turnover as well as have a positive impact on
customer service and store development. The PDS should be able to deliver training more
efficiently resulting in a decreased amount of training hours, which decreases the training wages
that impacts controllable expenses. A decrease in turnover will also directly and positively
impact the number of training hours, wages, and controllable expenses.
A key component of the program is the Trainer Store, which is a centrally located store
where all new employees are trained in small groups. It brings all of the employees to one place

16
for all of their training. The Trainer Store resonates both a collaborative culture and cohesive
cohort. It sends a message of a one team effort within a district. A store is selected as a Trainer
Store based on four criteria: 1) culture; 2) location; 3) performance; and 4) stability. A Trainer
Store should be centrally located to minimize travel, consistently score high on key performance
metrics (Operations Shops, Quality Assurance, and Hospitality Surveys), constantly have lower
turnover and be fully staffed, and continually exhibit a culture of growth and support to ensure
the committed success to the organization.
The purpose of the Trainer Stores is to develop new employees through a positive culture
which aligns with the company’s seven “DNA” markers: 1) connected; 2) dependable; 3) driven
to win; 4) high energy; 5) pioneering; 6) real; and 7) respect. “Z-Squad,” a superhero theme, was
this year’s culture initiative across the organization. The Trainer Store celebrates all
accomplishments with the new hire. Balloons, capes, certificates, Facebook groups, “Scrapchat
Books”, and selfie-sticks are just a few of the items that are part of the celebration and culture of
a Trainer Store. Through the positive culture, the new employees develop to be strong
contributors to their respective teams. There is a high level of energy and excitement around the
Trainer Store from the company to the store to the team.
The Trainer Store also helps to reduce turnover throughout the training process. The
Store Managers are freed up from training new employees so that they can complete the many
other duties required of them. There is less of a burden on Store Managers of having to train new
employees and still complete the many duties required of them. The PDS program helps to
lighten the load for managers by providing the training. The PDSs provide the majority of the
training by taking on several queues or groups of new employees going through the program.
Training takes place on first shift, however, there are some exceptions. The Trainer Store can

17
support training on second and third shifts through the use of mentors. In some markets,
especially with student workforces, there is a greater need for second shift and weekend shifts.
The PDS program is currently testing a Sunday through Thursday schedule. If a new employee
needs to be trained on another shift due to availability issues, then the PDS ensures that a
member of the management team can train the new employee and schedules regular check-ins
with the trainer. Further, the consistency provided by one professional trainer rather than by
individual Store Managers with many other responsibilities could lead to an experience of higher
quality.
The Trainer Stores are performing well according to the findings from the year-long pilot
program. The data from the initial seven Trainer Stores demonstrated that training efficiencies
improved through consistent, focused training driven by the PDS; utilizing the Trainer Store
program led to high-functioning, engaged employees and reduction in training and manager
hours; and validation of knowledge, skills, and performance were measured through the
salesperson foundational checklist. Further areas of research include building in incentives and
options for compensation for the Trainer Store. The program has an impact on the management
and team members of a Trainer Store, which can affect operational metrics. Additional quarterly
activity for all Trainer Store employees could include celebrations, development opportunities,
and team-building activities.
The first quarter of the pilot program focused on onboarding new employees (New Hire
Orientation) and training and developing store mentors (Mentor Training). The program tested
putting new employees into small groups to determine best practices and feasibility. A schedule
was put into place for the PDS, who held group training and orientation sessions, which saved on

18
training hours. This queuing, however, did not take precedence over hiring needs. The PDS
began with five to seven stores and up to four districts each, including new store openings.
The second quarter of the pilot program included increasing training efficiencies in
foodservice by adding in-store training with a PDS for all foodservice training. The program also
added queuing of new hire training in centralized training locations. A rollout of the Trainer
Store concept initiated in the Beckley, West Virginia and Roanoke, Virginia markets. Also, a
rollout of a collaboration workshop was started in the Pittsburgh, Pennsylvania market. The
program then began expansion of markets that included seven to twelve stores.
The third quarter of the pilot program focused on duplicating the results of the Beckley,
West Virginia Trainer Store in the Harrisburg, Pennsylvania market and defining the Trainer
Store model. A rollout of the collaboration workshop was also initiated in the Harrisburg,
Pennsylvania market. This was revised and expanded from seven to ten stores. At this point in
the program, a decision was made to transition away from recruitment and staffing tasks, such as
reviewing applications and interviewing, and to focus solely on training and development, which
is the primary focus and role of the PDS.
The fourth quarter of the pilot program decreased the number of stores in each market to
five to six stores, which made it more manageable for the PDS. There was also a focus on a
rollout of the Trainer Store concept in all markets.
From the results of the pilot program, the company decided to go live and expand the
program to 15 locations on October 14, 2016. The program features PDS leads, who serve as the
mentors in the field to the new PDS team members that have been hired as a result of the

19
expansion of this program. The PDS leads will provide hands-on training and job shadowing in
the field with established Trainer Stores.
There are several benefits of the PDS program. The impact to ninety day and annual
turnover includes a reduction in expenses related to the cost to fill positions, such as manager
time, drug and background checks, and advertising costs. The reduction in ninety day and annual
turnover also decreased expenses relating to training, such as mentor time and new hire training
time. There were also reductions in the training expenses that were not attributed to turnover,
such as hiring as a result of business growth. Moreover, there was also a reduction in training
expenses related to TIPS training provided by the PDS instead of store management. PDS
efficiencies were also gained as there was a reduction in training expenses by the PDS providing
group training. Other benefits of the program include improvements to culture, engagement,
quality assurance, customer shops, and customer experience.
The PDS program brings great value to the organization. Having more consistent and
one-on-one training will help the new employees acclimate to the organization by feeling more
confident, becoming more knowledgeable, and contributing individually to the team sooner. This
will help to decrease turnover as well as have a positive impact on customer service and store
environment. New team members will be able to perform in their roles and contribute to the team
sooner. The PDS should be able to deliver training more efficiently resulting in decreased
amount of training hours, which decreases the training wages that impacts controllable expenses.
A decrease in turnover will also directly and positively impact the number of training hours,
wages, and controllable expenses. As a result of deliverables, there should be a positive impact to
the store environment.
20
The selection, interviewing, and hiring of new employees was analyzed to compare the
current state to the desired state. The qualitative data collected from focus groups provided
feedback to the DMs about training within the district and provided insight into the program’s
strengths and opportunities for improvement. During the focus groups, the participants were
asked the following questions: 1) Did we make you feel welcome? 2) Do you feel like we
focused on the right things to prepare you? 3) What would you like to have more time with? 4)
What did you like the most about the first month with the company? 5) What was your most
difficult thing to learn? and 6) How can we improve your work life?
The strengths of the program were less stressful training, consistent training, and
dependable and engaged employees. Of the respondents, 60% mentioned that the PDS program
relieved stress on the management team, 50% said that they noticed employees trained by the
PDS were stronger and more dependable, and 40% stated that the PDS program offered more
consistent training for newly hired salespeople.
Opportunities for improvement included group size, connection with Home Store, and
physical aspects, such as equipment, location, etc. Of the respondents, 30% said that they had
concerns about the number of trainees their PDS was working with at one time, 10% stated that
employees were less connected to their Home Store initially because of the Trainer Store
program, and 10% mentioned the physical equipment, location, etc. as a possible concern.
In terms of turnover and training hours, 5,058 training hours and $59,735 training dollars
were saved from January 2016 to April 2016. There was a 12.2% decrease or $51,658 savings in
ninety-day turnover for Trainer Stores from October 2015 to May 2016 as compared to a 14.1%
increase in ninety-day turnover for Home Stores from October 2015 to May 2016. Trainer Stores

21
scored 6% higher over last year as compared with Home Stores which scored only 3% higher
over last year on engagement survey scores on hiring, training, and performance questions.

22
CHAPTER 2: LITERATURE REVIEW
This chapter reviews relevant literature in the areas of self-efficacy, collective efficacy,
and satisfaction surveys and how each of these concepts are embedded within corporate training
programs. Self-efficacy is the belief in ourselves to achieve goals or tasks. Collective efficacy is
a group’s shared belief in themselves to achieve goals or tasks. And, satisfaction surveys are
tools used to measure the responses of individuals in terms of overall satisfaction.
Several meta-analyses and research studies have been conducted on self-efficacy and
performance, self-efficacy and training, and self-efficacy and work-related performance.
Orientation and training and the role of the mentor play an important part in an individual’s level
of self-efficacy. Other studies have been conducted on the positive effects of group efficacy on
group effectiveness in several settings. Individuals with higher levels of self-efficacy are more
motivated; more likely to persist in challenges, roles, and skills; and more likely to transfer those
learned skills and techniques into the workplace.
In this research study, both quantitative and qualitative questions were asked on the
satisfaction survey to better understand how employees feel about the training session, training
content, trainer, and transfer of learning. The quantitative questions were based on a five-point
Likert scale (strongly agree, somewhat agree, neither agree or disagree, somewhat disagree, and
strongly disagree) and the qualitative questions were open-ended and allowed the participant to
share how they felt about their training experience, experience with their trainer, experiences
training with peers, what they enjoyed most about training, and what could have been done
differently during their training.

23
Self-Efficacy and Collective Efficacy
Based on Bandura’s (1986) social learning theory, self-efficacy is defined as an
individual’s belief about his or her capability to perform a particular behavior or to reach a
specific goal. Perceived self-efficacy is defined as individual’s judgements of their capabilities to
plan and perform courses of action (Bandura, 1986). Bandura (1993) explained that perceived
self-efficacy is important in affecting behavior and motivation and influences four major
processes, which include affective, cognitive, motivational, and selection. Further, Bandura
(1977) stated that certain psychological procedures can create and even strengthen expectations
of self-efficacy. These expectations originate from four principle sources of information, which
include: 1) performance accomplishments; 2) physiological states; 3) verbal persuasion; and 4)
vicarious experience (Bandura, 1977). Enactive attainments, or performance accomplishments,
are considered the most influential source of self-efficacy (Bandura, 1986). The physiological
state of an individual is used to judge their capabilities (Bandura, 1986). Social persuasion or
verbal persuasion can be heightened to increase an individual’s self-efficacy (Bandura, 1986).
Self-efficacy is also highly influenced by observing other individuals perform successfully
(Bandura, 1986).
There are five factors that affect the development of self-efficacy: 1) current emotional
state; 2) messages from others; 3) previous successes and failures; 4) successes and failures as
part of a group; and 5) successes and failures of other individuals (Ormrod, 2014). The most
important factor that affects self-efficacy is whether or not a learner succeeded at the activity or a
similar activity (Ormrod, 2014). An example of this would be giving a speech. If an individual
gave a speech in the past and experienced success, then that individual may have higher levels of
self-efficacy than an individual who may have been nervous or may not have experienced
24
success. This individual may have lower levels of self-efficacy. Perceived self-efficacy furthers
engagement in educational competencies and learning activities, as well as affects achievement
and motivation (Zimmerman, 1995).
There have been several meta-analyses conducted on the relationship between self-
efficacy and performance (Stajkovic & Luthans, 1998) and self-efficacy and training (Colquitt,
LePine, & Noe, 2000). “Research has shown that not only is self-efficacy a predictor of training
outcomes, it also explains why trainees engage with learning and acquire knowledge” (Griffin,
2014, pp. 138-139). Individuals with high self-efficacy for completing a skill or task tend to
achieve at higher levels, participate more readily, persist longer, and work harder (Schunk,
2008). Individuals with higher self-efficacy are more inclined to be motivated to perform well in
training and to transfer those learned skills into the workplace setting (Chiaburu & Lindsay,
2008). The stronger the efficacy, the more effort individuals will use and persist in challenges
and obstacles (Bandura, 1977).
Self-efficacy plays an important role in our everyday lives. Self-efficacy beliefs are the
basis of the foundation for human motivation, personal accomplishment, and well-being (Pajares,
2008). Self-efficacy impacts goals and how we strive towards those goals, of which the same can
be said of learning and how we apply behaviors, overcome barriers, and perform new skills and
tasks (Griffin, 2014). Learners who possess some level of overconfidence can benefit in learning
new challenges and skills (Ormrod, 2014). In education, students’ self-efficacy beliefs have a
strong influence on their academic achievements and their self-efficacy facilitates knowledge,
motivation, and skills with academic outcomes (Pajares, 2008). In several research studies on
students’ academic ability, the higher the self-efficacy beliefs, the more successfully the students
performed (Zimmerman, 1995). A strong sense of self-efficacy is important to the competencies

25
and successes of young adults in the demands of careers, lasting partnerships, marital
relationships, and even parenthood (Bandura, 1986). In the workplace, developing a stronger
self-efficacy in their ability to effectively function when changes occur helps employees to
increase their readiness for change (McShane & Von Glinow, 2015). In order to advance within
an organization, an individual requires a mastery of perceived self-efficacy in order to take on
challenging roles and skills of different job assignments and tasks (Bandura, 1997). Difficult
environmental demands and taxing situations require individuals to have a strong sense of self-
efficacy (Bandura, 1995). Moreover, beliefs in one’s self-efficacy can predict the choice of
occupation and the performance in that profession (Maddux & Gosselin, 2003).
Bandura’s social cognitive theory extends to a group level of analysis in which he
referred to as collective efficacy (Stajkovic, Lee, & Nyberg, 2009). Collective efficacy and group
potency or group efficacy are extensions to Bandura’s work on self-efficacy (Jung & Sosik,
2003). Self-efficacy is based on individual capabilities whereas group efficacy is based on group
members’ collective beliefs on their group’s capabilities (Jung & Sosik, 2003). Individuals work
together in what is often referred to as group cohesion to produce that which they are seeking in
collectively oriented systems (Bandura, 1995). Several studies have examined the positive
effects of group efficacy on group effectiveness in several settings (Jung & Sosik, 2003). Meta-
analysis has shown that collective efficacy is positively correlated with group performance
(Stajkovic, Lee, & Nyberg, 2009). “People’s beliefs in their collective efficacy influence the type
of social future they seek to achieve, how much effort they put into it, and their endurance when
collective efforts fail to produce quick results” (Bandura, 1995, p.35).

26
Self-Efficacy and Collective Efficacy in Corporate Training Programs
Stajkovic and Luthans (1998) conducted a meta-analysis investigating the relationship
between self-efficacy and work-related performance. The results signified that approximately
thirty-eight percent of improvement in the performance of work is attributed to self-efficacy.
Chiaburu and Lindsay (2008) performed an empirical test on employee’s training perceptions of
training and development at their organization. The results, based on a sample of 254 employees,
demonstrated that training self-efficacy is a key factor for motivation to learn and training
instrumentality is a key factor for motivation to transfer. Carter, Nesbit, and Joy (2010)
examined both theoretical and practical connections between employee engagement and self-
efficacy. Through self-efficacy-based innovations, employee engagement can be increased. The
study showed that elevating employee’s self-efficacy increases employee engagement as well as
work performance.
Orientation and training are an essential source of self-efficacy for the new employee
(Saks & Gruman, 2010). By feeling good about their ability to perform the required tasks, new
employees are more secure and possess decreased anxiety (Saks & Gruman, 2010). One of the
key factors of a successful training program is the encouragement of learners by managers
(Griffin, 2014). The best method for a manager to use is a form a verbal persuasion referred to as
the Pygmalion effect, which is based on a Greek myth about Pygmalion, a sculptor, who fell in
love with a statue (Robbins & Judge, 2017). It is the notion that believing in something can make
it true. Training is effective because it increases self-efficacy, especially when it is interactive
and feedback is provided (Robbins & Judge, 2017).

27
External support can be used to enhance an individual's low motivation to learn. Mentors
can encourage and support learners who possess a low motivation to learn. Through vicarious or
modeled experiences, individuals can acquire a great deal of self-efficacy information through
the aid of a model (Schunk, 2008). The influence of a model can help to build a sense of self-
efficacy (Bandura, 1997). Learners who depend on others want close supervision, constant
motivation, continuous direction, frequent interaction, and immediate feedback (Grow, 1991).
Cognitive modeling can create a higher level of perceived self-efficacy and performance than
verbal instruction (Gist, 1989).
Individuals must experience success in using what they have learned in training in order
to have success in their work. After understanding new skills, trainees need guidance in
translating abstract concepts into concrete concepts and opportunities to practice their skills
(Bandura, 1997). A transfer program allows individuals to try newly acquired skills on the job in
order to produce best results (Bandura, 1997). As a trainee experiences confidence and gains
skills in easy situations, they are more eager and willing to take on more difficult situations
(Bandura, 1997).
Mastery modeling is being used to help develop competencies in individuals (Bandura,
1997). It allows an individual to experience success with their newly acquired skills in their
natural environment (Bandura, 1997). “When instructive modeling is combined with guided role
rehearsal and a guided transfer program, this mode of organizational training usually produces
excellent results” (Bandura, 1997, p. 444). Trainees have the opportunity to learn and perfect
ways of handling tasks in similar conditions where the transfer of new skills in everyday life
becomes much easier (Bandura, 1997). New employees bring a sense of self-efficacy that

28
continues to develop throughout training which later contributes to a process known as
socialization (Bandura, 1997).
Satisfaction Surveys
A survey is an information collection method that is used to compare, describe, or explain
individual and societal behavior, feelings, knowledge, preferences, or values (Fink, 2013).
“Surveys are fundamentally a matter of asking a sample of people from a population a set of
questions and using the answers to describe that population” (Fowler, 2014, p. ix). There are two
premises of the survey process, which are describing the target population and describing the
characteristics of the respondents (Fowler, 2014). Creswell (2014) explains that the design of a
survey is to study a sample of the population and to provide quantitative descriptions of attitudes,
opinions, or trends. The researcher is able to generalize from sample results inferences about an
attitude, behavior, or characteristic of a particular population. A survey is the preferred tool of
data collection in this research study.
The survey is cross-sectional in that the data will be collected at one point in time. Cross-
sectional surveys are a snapshot of a group of individuals or organizations (Fink, 2013). The
survey in this research study gathered information from a snapshot of a target population of
newly hired employees. The sampling design of the survey is single stage because the researcher
had access to the participants in the population and sampled the employees directly. The use of
stratified sampling ensures that the different groups or strata are represented in the survey
responses (Nesbary, 2000). Stratified sampling is a two-stage process where the population is
divided into subgroups, and then a simple random sample or a systematic sample for each
subgroup (Sue & Ritter, 2012). In this study, the subgroups or strata were employees trained in

29
one of three models. This study was also quasi-experimental because individuals were not
randomly assigned to the treatment variable(s).
The dependent variables were self-efficacy and the satisfaction with the training session,
training content satisfaction, satisfaction with the trainer, and transfer of learning from training to
work. How did the employee feel about the training, the training content, their trainer, and the
transfer of learning from training to work? An online survey was administered to a population of
newly hired salespersons upon completion of their foundational training. The survey was also
administered approximately one to five months after training to determine their level of self-
efficacy after training.
The data collection from surveys can come in many forms, including group
administration, Internet, mail, personal interviews, or telephone. Literature discusses the use of
an Internet survey that is administered online (Nesbary, 2000; Sue & Ritter, 2012). Nesbary
(2000) found that early studies of online surveys showed that email surveys were equally or
more effective in response rate and response time and were quicker than mail surveys. Sue and
Ritter (2012) list the advantages of an online survey: can be low cost, fast, efficient, contingency
questions effective, direct data entry, and wide geographic reach.
Some of the limitations of web surveys include: access to the web, non-representation of
minorities and the poor, and security (Nesbary, 2000). The disadvantages of an online survey
include: coverage bias, reliance on software, and too many digital surveys causing overload (Sue
& Ritter, 2012). Fowler (2014) compares Internet surveys with mail surveys in that there is a
lack of the intervention of an interviewer. The Internet is used for surveys in two ways in which

30
the second way is the preferred method: responding to questions through an email or responding
to questions on a website (Fowler, 2014).
Sue and Ritter (2012) discuss that online surveys are not always appropriate in a research
study, and provide some guidelines as to when it is appropriate to use an online survey in a
research study. When determining the appropriateness of using web-based surveys, Sue and
Ritter (2012) suggest considering the following criteria: 1) large sample size that is
geographically and widely distributed; 2) time constraints and the need for a fast turnaround; 3)
questionnaire contains sensitive information; 4) target population has access to appropriate
technology; 5) access to appropriate lists; 6) selection of a probability sample of respondents; 7)
enhancement of the questionnaire through interactive or multimedia features; and 8) researcher
has technological skills and knowledge.
In this study, an online survey was appropriate because the study characteristics met all
of the above guidelines, except the third and seventh. There was no sensitive information and no
interactive or multimedia features. The other six guidelines justified the use of an online survey
in this research study. Online surveys are optimal for reaching large numbers of individuals.
However, there are a number of problems that could arise, such as lack of incentives, outdated
emails, or unsuspecting respondents (Fink, 2013).
Fowler (2014) suggests steps that can be helpful in enlisting the cooperation of taking
online surveys, which includes identifiable sponsors, well-designed instruments, financial
incentives, and repeated contacts, including trying mail or phone requests for those who do not
respond to an initial email request. The type of survey in this research study was an electronic
survey administered using Qualtrics. This instrument was designed for this research and has been
31
used extensively with employees across the organization. A high response rate has been
consistent with surveys that have been administered using Qualtrics in Talent Workz, the
learning management system. Fowler (2014) states that the least expensive surveys are the ones
that use the Internet.
The purpose of a survey is to produce quantitative statistics or numerical descriptions
about a sample population (Fowler, 2014). The purpose of this survey was to discern any
differences that might exist between the TPDS model and the other models in terms of alignment
with social learning theory and principles of self-efficacy, as well as other attributes of the
training models. The results of the satisfaction survey helped to advance practice and theory in
effective methods of training employees that corresponded with social learning theory.
There are two types of errors associated with a large population. The first kind of error is
the random variation from the characteristics of the sample population (Fowler, 2014). This is
due to the fact that the information was gathered from a sample of the population instead of the
entire population. The second kind of error is the bias between the population and the sample of
respondents (Fowler, 2014). There could be the potential for bias in the way the respondents
responded as compared with the target population.
There are also three sources of error in online surveys, which includes coverage error,
nonresponse error, and sampling error (Sue & Ritter, 2012). Coverage error happens when the
sampling frame does not entirely represent the targeted population (Sue & Ritter, 2012).
Nonresponse error occurs when the selected population does not participate in the survey (Sue &
Ritter, 2012). And, sampling error takes place when statistical estimates were based on the
sample data instead of the population data (Sue & Ritter, 2012). To account for these potential
32
sources of error, the researcher in this study intends to calculate the margin of error, estimate
population parameters, and use standard statistical techniques. In order to improve response
rates, Sue and Ritter (2012) suggest some techniques, such as indicating the importance of the
survey data, keeping the questionnaire simple, and reminding participants of the confidentiality
of the survey.
A survey is reliable if the results show consistent information (Fink, 2013). A survey is
valid if it produces accurate information (Fink, 2013). Creswell (2014) describes three traditional
forms of validity: 1) content validity; 2) predictive or concurrent validity; and 3) construct
validity. The established validity of scores from past experimental research indicates whether or
not a survey instrument is useable. Past scores also indicated reliability with the survey. The
survey used in this research study included fields, such as satisfaction with training and
development and job satisfaction. Reliability and validity of the survey used in this study are
discussed further at the end of this section.
The foundation of ethical research, including survey research, was established with The
Belmont Report: Ethical Principles and Guidelines for the Protection of Human Subjects of
Research (Fink, 2003). Confidentiality, or the safeguarding of information about an individual, is
protected by the Protection of Human Subjects guidelines of the Code of Federal Regulations or
Common Rules (Fink, 2013). The survey researcher was mindful of ethical issues through
avoiding risks to interviewers, participants, and respondents (Fowler, 2014). There are several
ways in which to minimize the risks throughout the research study. An Institutional Review
Board (IRB) reviews research involving human subjects (Fowler, 2014). Surveys minimize risk
through the exempt option for participants, though the IRB is responsible for reviewing the

33
format and questions (Fowler, 2014). This research study was approved by the Pennsylvania
State University’s Institutional Review Board (IRB) on November 11, 2016 (Appendix C).
Satisfaction Surveys in Corporate Training Programs
The survey instrument used in this study was adapted with written permission from a
study conducted by Khawaja Latif, Shahid Jan, and Nasir Shaheen. The study looked at the
relationship between job training satisfaction and learning and development (Latif, Jan, &
Shaheen, 2011). Because the researchers wanted to create a generalized instrument, a thirty-five
item questionnaire was distributed to five hundred marketers and office staff in various
occupations (Latif, Jan, & Shaheen, 2011). The overall response rate was 63% (Latif, Jan, &
Shaheen, 2011). The items were divided into subcategories of satisfaction with training session,
training content satisfaction, satisfaction with trainer, transfer of training, and job satisfaction
(Latif, Jan, & Shaheen, 2011). A five point Likert scale (1 = Strongly Disagree to 5 = Strongly
Agree) was used. The data from the surveys was analyzed using statistical software SPSS, and
the research questions were tested using Independent Sample T-Tests, Oneway Anova,
Correlation, and Regression Analysis (Latif, Jan, & Shaheen, 2011). Exploratory Factor Analysis
was completed on the survey and the article reports the factor structure. The survey exhibited
comparable statistics on reliability with a reliability coefficient of .866 to .943 (Latif, Jan, &
Shaheen, 2011). The correlation matrix for various factors of training satisfaction and the
employee development aspect of job satisfaction as well as the inter-relationship between various
factors of training satisfaction produced a correlation of significance at the 0.01 level (Latif, Jan,
& Shaheen, 2011). The response rate for the survey was significantly low (63%), which was a
limitation of the research study. The survey used in this research study was a modified version of
a survey used by Latif, Jan, and Shaheen to which the researcher added open-ended questions.

34
The results from the study conducted by Latif, Jan, and Shaheen (2011) showed that
several areas of job satisfaction had a positive correlation with one another, and there was a
significant association between employee development aspect of job satisfaction and overall
training satisfaction. Latif, Jan, and Shaheen (2011) stated that “a vital aspect of the learning
experience are the trainers, majority of the respondents did find the training session to be joint
effort where they were given freedom to express, the respondents highly value this kind of
trainer who is helpful and well prepared” (p. 174). The role of the trainer is significant in the
overall success of the training program. Training provides more than just an increase in abilities,
knowledge, and skills, but also an increase in job commitment and satisfaction, which results in
decreases in turnover and motivation of employees (Latif, Jan, & Shaheen, 2011). Employee
training affects more than just business results; it also shapes employee attitudes (Latif, 2012).
Further study is suggested in the area of the effect of training on overall job satisfaction (Latif,
Jan, & Shaheen, 2011).
In order to evaluate the differences among the satisfaction of employees in the Trainer
Stores as compared with employees in the other models, a T-Test was used. The T-Test is a
statistical test of significance that shows the difference between means (Cook & Campbell,
1979). A T-Test allowed the researcher to compare the means of the two groups to determine the
probability of differences, if any, between them (Fink, 2013). A T-Test determines whether the
two means are different enough to be statistically significant (Sue & Ritter, 2012). In evaluating
the relationship between two groups, the researcher can conduct a correlation analysis (Sue &
Ritter, 2012).
Latif, Jan, and Shaheen (2011) found several aspects of job satisfaction to have a positive
and significant correlation with one another and between employee development and training

35
satisfaction. A 35 item questionnaire was distributed to 500 employees. Of the 35 questions, 22
focused on training satisfaction divided into four subscales (satisfaction with training session,
training content satisfaction, satisfaction with trainer, and transfer of learning) and 13 questions
focused on satisfaction with learning and development. The responses were measured on a five-
point Likert scale (1 = Strongly Disagree to 5 = Strongly Agree). The results of the study showed
that training content satisfaction, training session satisfaction, trainer satisfaction, and transfer of
learning are positively related with job satisfaction. Further, a trainer who was helpful and well
prepared played an important role in the overall success of a training program.
Latif (2012) conducted a study on successful training programs which identified four
different yet interrelated aspects of training satisfaction, which include satisfaction with the
training session, training content satisfaction, satisfaction with the trainer, and transfer of
learning. According to Latif (2012), training objectives help trainees understand why they need
the training session. Training content should reflect the abilities, knowledge, and skills to meet
the job requirements. Probably the most important factor and success of a training program is the
trainer. And, the transfer of learning from the training to work is successfully completed through
the learned knowledge and skills.
Kirkpatrick and Kirkpatrick (2016) explain three reasons to evaluate training programs,
which include: 1) to improve the program; 2) to maximize transfer of learning to behavior and
subsequent organizational results; and 3) to demonstrate the value of training to the organization.
Completion of a training program does not describe the effectiveness of the training
(Griffin, 2014). The effectiveness of a training program can be referred to “the level of student
satisfaction, the amount students learn, the extent to which they transfer the learned material to

36
their jobs, and/or the company’s financial return on investments in training” (Robbins & Judge,
2017, p. 613). The success of a training program also depends on the individual (Robbins &
Judge, 2017). The more individuals are motivated, the more they will learn, while comparable
individuals who are unmotivated will learn very little.
Training that is well-designed and well-received is of no value unless the learning is
transferred to behavior (Kirkpatrick & Kirkpatrick, 2016). “Employee perception of the
relevance and applicability of any training to their job and wider work environment increases
their engagement with learning and motivation to transfer” (Griffin, 2014, p.148). One of the
most important factors influencing training transfer is self-efficacy (Griffin, 2014). Training self-
efficacy and training instrumentality have the effect to be powerful motivators to learning and
transfer as well as influencing training transfer (Chiaburu & Lindsay, 2008). Individuals with
higher levels of self-efficacy tend to be more motivated to perform well in training and to
transfer newly acquired knowledge and skills to the workplace (Chiaburu & Lindsay, 2008).
Trainers need to show that training and the on-the-job support from managers are
inseparable (Kirkpatrick & Kirkpatrick, 2016). Employees are able to retain and transfer learning
better when they are supported by their co-workers and managers (Griffin, 2014). The support
that employees can receive from their trainer or mentor is important to their success in the
transfer of learning to work. Mentoring contributes to organizational process and personal
growth (Kram, 1988). Mentoring is a working relationship that represents one avenue through
which individuals may enhance their personal learning (Kram, 1996). Employees are able to
receive feedback about their performance from their mentors. Mentors provide psychosocial
support, role modeling, and vocational support (Kram, 1988). Employees are able to establish a

37
sense of competence, effectiveness, and identity through training and development with a
mentor.

38
CHAPTER 3: METHODS
This chapter explains quantitative research, the design of the study, and the participants
and procedures in this research study. This research study represents a quasi-experimental study
that uses a survey tool as the primary instrument in assessing employees’ perceptions of self-
efficacy and training satisfaction.
Study Variables
The independent variable in this research study was the environment in which the
employees were trained, Home Store or Trainer Store. The dependent variables were both self-
efficacy and satisfaction, including satisfaction with the training session, training content, trainer,
and transfer of learning. The data obtained via the survey were analyzed using statistical
software, SAS JMP Pro 12. Oneway Anova and post hoc T-Tests were used to determine
whether there was a significant difference between the Home Store/Mentor (HM), Trainer
Store/Mentor (TM), or Trainer Store/PDS (TPDS) models. Further tests were used to determine
whether there were significant differences between the Trainer Store and the Home Store on the
dependent variables.
Quantitative Research
A quantitative researcher “decides what to study, poses specific questions or hypotheses,
measures variables to facilitate the finding of answers, uses statistical analysis to obtain
information in order to answer the questions/hypotheses, and makes an interpretation of the
results” (Creswell, 2015, p. 4). According to Creswell (2015), the advantages of quantitative
research include the following: draws conclusions for large numbers of people, analyzes data
efficiently, investigates relationships with data, examines probable causes and effects, controls

39
bias, and appeals to people’s preference for numbers. The disadvantages of quantitative research,
as stated by Creswell (2015), include the following: is impersonal, dry; does not record the
words of participants; provides limited understanding of the context of participants; and is
largely researcher driven. Quantitative research is employed in this research study and uses
statistical analysis to better understand the experience of an employee’s satisfaction with training
and development and to create opportunities for increased training satisfaction.
The type of quantitative research design that was used in this study is quasi-experimental.
Creswell (2015) defines quasi-experimental research as a type of experimental research that does
not randomly assign individuals to groups. Typically, quasi-experimental designs randomly
assign the treatment levels to intact groups. Quasi-experimental design is often used in natural
social settings. The quasi-experimental design involves having control over the scheduling of
data collection procedures and having no control over the scheduling of experimental stimuli
(Campbell & Stanley, 1963). It is meant to estimate the impact of an intervention on a specific
population without random assignment. The researcher must be aware of the specific variables
that are uncontrollable (Campbell & Stanley, 1963). Quasi-experiments have treatments,
outcome measures, and experimental units; however, these experiments do not use random
assignment to compare a treatment group with a non-treatment group (Cook & Campbell, 1979).
The quasi-independent variable was manipulated to affect the dependent variable. The
independent variables or the treatment variables in this study were the environment in which the
newly hired employees were trained, whether it was a Trainer Store or a Home Store, and the
trainer who trained them, whether it was a PDS or a Mentor. The dependent variables in this
study were self-efficacy and the satisfaction with the training session, training content
satisfaction, satisfaction with the trainer, and transfer of learning from training to work. How

40
satisfied were the employees about training, their trainer, and the transfer of learning from
training to work?
According to Campbell and Stanley (1963):
“Internal validity is the basic minimum without which any experiment is uninterpretable:
Did in fact the experimental treatments make a difference in this specific experimental
instance? External validity asks the question of generalizability: To what populations,
settings, treatment variables, and measurement variables can this effect be generalized?”
(p. 5)
The issues of internal validity are potentially partially solvable through probability
statistics whereas the problems of external validity are not logically solvable (Campbell &
Stanley, 1963). Internal validity threats, according to Creswell (2014), include experiences of the
participants, experimental procedures, or treatments that can impede the ability of the researcher
to draw the appropriate conclusions about the population sample from the data. External validity
threats, according to Creswell (2014), occur when the researcher draws inferences that are
incorrect from the sample data and attempts to generalize to a larger population. Statistical
conclusion validity is another possible threat that transpires when the researcher draws inferences
from the data that are inaccurate due to a lack of statistical power or a violation of statistical
assumptions (Creswell, 2014).
There are several factors that affect the internal validity and external validity of
experimental designs. History, maturation, testing, instrumentation, statistical regression,
selection, experimental mortality, and selection-maturation interaction potentially jeopardize
internal validity. Also, reactive or interaction effect of testing, interaction effects of selection bias

41
and experimental variable, reactive effects of experimental arrangements, and multiple-treatment
interface potentially jeopardize external validity (Campbell & Stanley, 1963; Cook & Campbell,
1979). Internal validity denotes that an inference between two variables is causal (Cook &
Campbell, 1979). External validity denotes an inference that the causal relationship can be
generalized across persons, settings, and times (Cook & Campbell, 1979).
The control over these factors affects the interpretability of the results of the experimental
or quasi-experimental study (Campbell & Stanley, 1963). Statistical tests of significance are used
to make the decision as to the whether or not the difference fluctuates by chance above what is to
be expected within a sample size (Campbell & Stanley, 1963).
To better understand trainees’ self-efficacy of training and development in a Trainer
Store compared to trainees’ self-efficacy of training and development in the other models, a
convenience sample was employed with these two naturally formed groups. A convenience
sample is a nonprobability sample where respondents are selected based upon their availability
and convenience (Creswell, 2014). The procedures are quasi-experimental because individuals
were not randomly assigned nor was the treatment randomly assigned to intact groups (Creswell,
2014).
The researcher decided to use an online survey as the instrument because of alignment
with the expanding convenience store company and past work in vocational settings. The use of
a survey also allowed the researcher to conduct the research study within the given timeframe.
The survey was made available to the employees for approximately two weeks. The information
from the results of the study was made available to the company to make additional changes and
modifications to the TPDS model as it continues to evolve across the organization.

42
Design of the Study
The design of the study is illustrated below using commonly used symbols identified by
Campbell and Stanley (1963).
X1 (HM) O1
------------------------
X2 (TM) O2
----------------------------------
X3 (TPDS) O3
---------------------------------
With quasi-experimental research, there are commonly identified shortcomings. A
notable weakness with the posttest-only element with nonequivalent intact groups is the lack of
pretest data, which could result in the possibility of posttest differences being ascribed to
selection differences or a treatment effect between the three groups (Cook & Campbell, 1979).
With this research study, there was no pretest. Another complication with the posttest-only
element with nonequivalent intact groups is multiple groups receiving the treatment in different
doses (Cook & Campbell, 1979).
The goal of the training in each of the models is identical regardless of the method. Each
newly hired salesperson completes all seven modules of the foundational salesperson training
and TIPS. The number of training hours is the same in each model, which consists of 11 days or
74 hours total training. The objectives of the program are the same in each model, which
includes training followed by an end of training (EOT) evaluation. The only difference between
the models is the method of delivery of the training. In the HM model, the training is delivered

43
by a mentor in a Home Store. In the TM model, the training is delivered by a mentor in a Trainer
Store. And, in the TPDS model, the training is delivered by a PDS in a Trainer Store.
Creswell’s design randomly assigns treatments to groups. With this company, it was not
possible to randomly assign the treatment, or method of delivery, to each of the different models.
All of the employees self-selected the model of training based on the location in which they were
hired. Therefore, treatment was caused by location.
There were also several unique aspects of the three treatments. The employees in the
TPDS model received training from a dedicated trainer in a small group setting. Their
accomplishments throughout the training experience were acknowledged and celebrated. On the
other hand, the employees in the Home Store model received training from a member or
members of the management team in a one-on-one setting. Their accomplishments throughout
the training experience may or may not have been acknowledged or celebrated depending upon
the discretion of the management team member and the Home Store. The employees in the
Trainer Store model received training from either a member or members of the management
team or a PDS. The environment of the training took place in a Trainer Store.
Data Collection
A survey instrument was selected for this research study for several reasons. The use of a
survey allowed the researcher to elicit both quantitative and qualitative information on employee
satisfaction of training. It also allowed the researcher to assess whether the TPDS model was
perceived by trainees as better aligned with social learning theory than the Home Store model.
The particular survey tool that was selected for this research study was adapted from a similar
research study conducted by Latif, Jan, and Shaheen (2011). The survey in their research study

44
was developed for use in office settings. The survey had good reliabilities (Cronbach alpha), so
the researcher adapted the questions from their research study as well as added qualitative open-
ended questions for this specific research study. The survey fits the population of this research
study because the researcher sought information from the employees regarding training
effectiveness, particularly satisfaction with the training session, training content, trainer, and
transfer of learning.
To help interpret and understand the results derived from the quantitative data, the
researcher included qualitative data gathered through open-ended responses at the end of the
survey. This allowed the participants the opportunity to express their feelings and thoughts about
their training experience, specifically with their trainer and training with peers, as well as what
they enjoyed the most about their training and what could have been done differently during their
training. The responses from the open-ended questions were reviewed to identify possible
explanations or interpretations of the quantitative data.
The online survey was completely anonymous and voluntary. Participation or
nonparticipation did not have any effect on employment status. All eligible salespersons received
the online survey on their individual learning plan through Talent Workz on January 6, 2017 and
the online survey was available until 11:59pm on January 23, 2017. The company did not have
access to any of the data.
The researcher allowed the participants to complete the survey within an approximately
two-week timeframe. This is the typical amount of time that is given for employees at this
company to complete surveys. An email communication was sent to the participating districts at
the beginning of the two-week timeframe. After about one week, a reminder email was sent to

45
the participating districts reminding them that the survey will close in approximately one week.
Moreover, the survey was placed on all eligible employees’ learning plans, which served as a
daily reminder for the employees.
Participants
In this research study, all of the participants were employees in nine participating districts
who were newly hired salespersons to the organization from August 1, 2016 to November 30,
2016. The participants were recruited based on the constituents of having never worked for the
organization and going through the training in one of the Home Store locations or Trainer Store
locations. The 15 Trainer Store locations are dispersed across five of the six states: 1)
Pennsylvania (East Pittsburgh, West Pittsburgh, Harrisburg East, Harrisburg West, Reading, and
Northeast); 2) Maryland (Northern); 3) Virginia (Roanoke, Leesburg/Manassas, and Richmond);
4) West Virginia (Beckley and Morgantown); 5) North Carolina (Greensboro, Raleigh North,
and Raleigh South). The Home Store locations are dispersed across all six states: (Pennsylvania,
Maryland, Virginia, West Virginia, North Carolina, and Ohio).
In this study, participants were selected from nine of the 50 districts within the company
because this was the population identified by the organization to participate in the research study.
The nine districts included 1) Greensboro, North Carolina; 2) Hickory, North Carolina; 3)
Raleigh North, North Carolina; 4) Raleigh South, North Carolina; 5) Scranton, Pennsylvania; 6)
State College, Pennsylvania; 7) Roanoke Virginia; 8) Beckley, West Virginia; and 9)
Morgantown, West Virginia. The participants were not randomly assigned to the treatment
levels, but selected from a stratified random sample. There were three models, which included
HM, TM, and TPDS. The sample size of the population was important, because the larger the

46
size, potentially the less room there was for error in the representation of the characteristics of
the population (Creswell, 2015). From the results of the survey, there were seven respondents in
the TPDS model. There were 11 respondents in the TM model. And, there were 80 respondents
in the HM model. In the Trainer Store model, there were 18 respondents and in the Home Store
model, there were 81 respondents. Overall, there were 98 respondents that had completed the
survey.
All possible participants were invited, based on the treatments they experienced. The key
independent variable in this study was the environment in which employees were trained –
Trainer Store or Home Store – using all trained from nine districts in each model during August
1st to November 30th. During this period, the researcher estimated that there were approximately
328 trainees, with approximately 146 in the Trainer Store model and 182 in the Home Store
model. After this proposal was approved (IRB approval was in hand), all trainees trained during
this period were contacted through an email communication to the Store Manager (Appendix A)
who also posted the communication in the break room. The trainees were asked to complete the
survey. All eligible salespersons were adequately informed of the research study. Potential
participants were screened for eligibility requirements through the learning management system,
Talent Workz. The system generated a list of employees based on hire date and job code of
individuals who were hired for the role of salesperson from August 1, 2016 to November 30,
2016. The researcher had requested from the organization that the survey be administered
company wide, which included over 50 districts. The organization determined that only nine
districts would participate in the research study. Out of approximately 328 employees, 98
completed the survey in its entirety, which resulted in a 30% response rate. The TPDS model had
approximately a 5% response rate. The TM model had approximately an 8% response rate. And,
47
the HM model had approximately a 44% response rate. The Trainer Store response rate was
approximately 45%, and the Home Store response rate was approximately 55%. The limitation
and reduction of the population to only 20% of the eligible employees and a lower than expected
response rate and completion rate has threatened the validity of the study. Moreover, the
researcher requested that the names of the PDSs be made available to the employees. The
organization determined that the names were not to be made available. An employee going
through training, in the researcher’s experience and opinion, would be more likely to remember
the name of their trainer as opposed to the title of their trainer. This may have caused some
confusion in the selection of the responses. This process may have resulted in a lower than
average participation rate, perhaps causing the sample to be less representative of the total
population.
Statistical Data Analysis
Data analysis included using basic descriptive statistics, reliability analysis (Cronbach’s
alpha), and inferential statistics (Oneway Anova and the Independent Sample Median Test).
Prior to conducting the actual analysis, the summated Likert scale scores for the four
outcome measures were examined for reliability of the summated score, normality of the scores,
and potential outliers. This was especially important because there were substantive differences
in the number of people in the three levels of the independent variable (mode of delivery) when
examining for differences in the Likert scores between the three levels of the independent
variable. The first level of the independent variable was Home Store delivered by a Mentor (HM
= 80 people). The second method of delivery was training delivered at a Trainer Store by a
Mentor (TM = 11 people). The third method of delivery was delivered at a Trainer Store by a
48
Performance Development Specialist (TPDS = 7 people). This exploratory data analysis
identified that the scores for the TPDS method of delivery level had a negatively skewed
distribution.
Oneway Anova was used to determine if there were differences in the summated Likert
scores for each of the outcome measures (Training Session, Training Content, Trainer, and
Transfer of Learning). Oneway Anova was appropriate to use because the summated scores
represented interval type data, and there were three levels of the independent variable. The
Oneway Anova equal variance assumption was not met, and therefore, the pooled variance
estimate was used in calculating the Oneway Anova. An alpha level of .05 was used as the
criterion for statistical significance.
The Independent Samples Median Test was used to examine whether the median values
of each of the four outcome measures (Training Session, Training Content, Trainer, and Transfer
of Learning) differed by location of the training (Home Store or Trainer Store). The Independent
Samples Median Test was appropriate because there were two levels of the independent variable
and the median values of each of the outcome measures (Training Session, Training Content,
Trainer, and Transfer of Learning) represented ordinal data. The Median Test is a non-parametric
test, and thus, there are no assumptions regarding normality or equal variance. An alpha level of
.05 was used as the criterion for statistical significance.

49
CHAPTER 4: RESULTS
This chapter presents the detailed findings and overall results of the data analyses
conducted. The responses were analyzed by location which had two levels, Home Store or
Trainer Store, and by trainer which had two levels, Mentor or PDS. The researcher hypothesized
that the TPDS model trainees (Trainer Store location with a Performance Development
Specialist), would, through their responses, provide evidence that the TPDS method of training
was more closely aligned with the principles of social learning theory and positively correlated
with higher satisfaction with the training session, training content, trainer, and transfer of
learning to work scores.
Method of training delivery considers both the store location and the trainer position.
Thus, there were three methods of training delivery in this study. First, there was training
delivered at the trainee’s Home Store delivered by a Mentor (HM). The second method of
delivery was training delivered at a Trainer Store by a Mentor (TM). The third method of
delivery was delivered at a Trainer Store by a Performance Development Specialist (TPDS). The
small number of respondents in the TM (N = 11) and TPDS (N = 7) training delivery methods is
an issue and may have affected the results of this research study.
The findings are organized in the following sequence. First, descriptive statistics for the
four dependent variables (outcome measures) are presented by method of training delivery (HM,
TM, and TPDS). The second section summarizes information regarding trainees’ responses to
open ended questions which formed the basis for the investigator assessing the extent responses
aligned with the elements of social learning theory. The third section summarizes results when
assessing whether there were significant differences in the scores for the four dependent outcome

50
variables between the three methods of training delivery. The fourth section summarizes results
when assessing differences in the scores for the four outcome variables between store locations.
Section One: Basic Descriptive Results for the Outcome Measures
Table 2 is a summary of both the location and trainer. The number of respondents was
substantially higher in the HM model (80) than in the TM (11) and TPDS (7) models. The total
number of respondents that completed the entire survey was 98. The TM model had average
scores that were slightly higher (4.8) in all four outcome measures (training session, training
content, trainer, and transfer of learning) of the survey as compared with the HM and TPDS
models. The TPDS model had slightly lower average scores (3.9, 3.6, 4.0, and 4.3) in each of the
four outcome measures respectively as compared with the HM and TM models.
Table 2: Location and Trainer Summary
Location and Trainer
Respondents Average Training Session Score
Average Training Content
Score
Average Trainer Score
Average Transfer of Learning
Score
Standard Deviation
HM 80 4.4 4.7 4.6 4.5 .103
TM 11 4.8 4.8 4.8 4.8 .004
TPDS 7 3.9 3.6 4.0 4.3 .276
Total 98 4.4 4.4 4.5 4.5 .058
Response scale: 1 = Strongly disagree; 2 = Somewhat disagree; 3 = Neither agree nor disagree; 4 = Somewhat agree; and 5 = Strongly agree.

51
Section Two: Social Learning Theory Elements
The investigator was especially interested in assessing whether those participants that
received training via the TPDS model would identify through their responses greater numbers of
comments reflecting social learning theory principles. Table 3 represents the categorization of
the open-ended responses from employees in the HM, TM, and TPDS models. Examining the
open-ended responses, the researcher discovered elements of social learning theory present from
the responses of the employees in each of three different models. The first three questions are
categorized in terms of positive response, negative response, and neutral/no response. The fourth
question is categorized in terms of enjoyed something, enjoyed nothing, or no response. And, the
fifth question is categorized in terms of something different, nothing different, and no response.
The results show that there were more positive responses from each of the three models
in the first three questions. For the fourth question, the responses from each of the three models
indicate that the employees enjoyed something from their training. And, from the fifth question,
the responses from each of the three models reveal a somewhat even distribution among
something different, nothing different, and no response to what (if anything) could have been
done differently during training.
Table 3: Comparison of Open-Ended Responses by Method of Delivery
1. How would you describe your training experience?
Positive Response
Negative Response
Neutral/ No Response
Total
HM 56/70% 6/7% 18/23% 80/100%
TM 10/91% 1/9% 0/0% 11/100%
TPDS 5/71% 2/29% 0/0% 7/100%

52
Total 71/72% 9/9% 18/19% 98/100%
2. How would you describe your experience with your trainer?
Positive Response
Negative Response
Neutral/ No Response
Total
HM 61/76% 4/5% 15/19% 80/100%
TM 9/82% 0/0% 2/18% 11/100%
TPDS 5/71% 1/14% 1/14% 7/100%
Total 75/77% 5/5% 18/18% 98/100%
3. How would you describe your experiences training with your peers?
Positive Response
Negative Response
Neutral/ No Response
Total
HM 59/74% 3/4% 18/23% 80/100%
TM 10/91% 0/0% 1/9% 11/100%
TPDS 6/86% 0/0% 1/14% 7/100%
Total 75/77% 3/3% 20/20% 98/100%
4. What (if anything) did you enjoy the most about your training?
Enjoyed Something
Enjoyed Nothing
No Response Total
HM 58/73% 2/3% 20/25% 80/100%
TM 10/91% 0/0% 1/9% 11/100%
TPDS 6/86% 0/0% 1/14% 7/100%
Total 74/76% 2/2% 22/22% 98/100%
5. What (if anything) could have been done differently during your training?
Something Different
Nothing Different
No Response Total
HM 24/30% 28/35% 28/35% 80/100%
TM 2/18% 8/73% 1/9% 11/100%
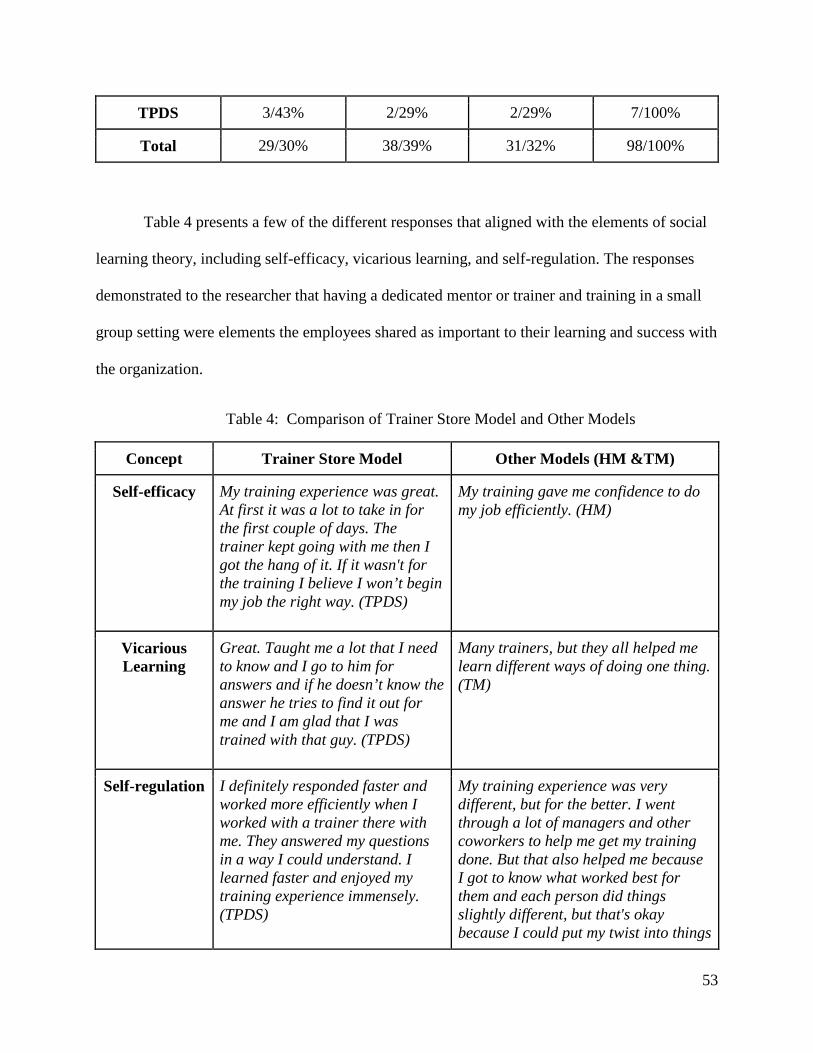
53
TPDS 3/43% 2/29% 2/29% 7/100%
Total 29/30% 38/39% 31/32% 98/100%
Table 4 presents a few of the different responses that aligned with the elements of social
learning theory, including self-efficacy, vicarious learning, and self-regulation. The responses
demonstrated to the researcher that having a dedicated mentor or trainer and training in a small
group setting were elements the employees shared as important to their learning and success with
the organization.
Table 4: Comparison of Trainer Store Model and Other Models
Concept Trainer Store Model Other Models (HM &TM)
Self-efficacy My training experience was great. At first it was a lot to take in for the first couple of days. The trainer kept going with me then I got the hang of it. If it wasn't for the training I believe I won’t begin my job the right way. (TPDS)
My training gave me confidence to do my job efficiently. (HM)
Vicarious Learning
Great. Taught me a lot that I need to know and I go to him for answers and if he doesn’t know the answer he tries to find it out for me and I am glad that I was trained with that guy. (TPDS)
Many trainers, but they all helped me learn different ways of doing one thing. (TM)
Self-regulation
I definitely responded faster and worked more efficiently when I worked with a trainer there with me. They answered my questions in a way I could understand. I learned faster and enjoyed my training experience immensely. (TPDS)
My training experience was very different, but for the better. I went through a lot of managers and other coworkers to help me get my training done. But that also helped me because I got to know what worked best for them and each person did things slightly different, but that's okay because I could put my twist into things
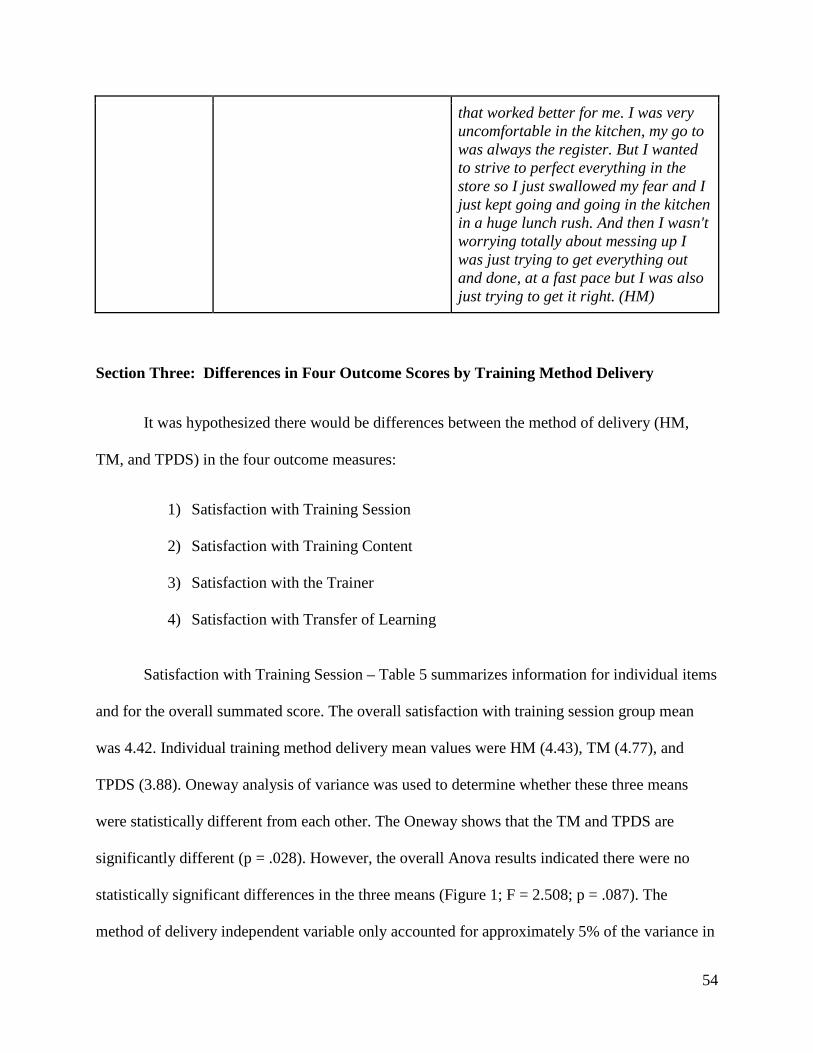
54
that worked better for me. I was very uncomfortable in the kitchen, my go to was always the register. But I wanted to strive to perfect everything in the store so I just swallowed my fear and I just kept going and going in the kitchen in a huge lunch rush. And then I wasn't worrying totally about messing up I was just trying to get everything out and done, at a fast pace but I was also just trying to get it right. (HM)
Section Three: Differences in Four Outcome Scores by Training Method Delivery
It was hypothesized there would be differences between the method of delivery (HM,
TM, and TPDS) in the four outcome measures:
1) Satisfaction with Training Session
2) Satisfaction with Training Content
3) Satisfaction with the Trainer
4) Satisfaction with Transfer of Learning
Satisfaction with Training Session – Table 5 summarizes information for individual items
and for the overall summated score. The overall satisfaction with training session group mean
was 4.42. Individual training method delivery mean values were HM (4.43), TM (4.77), and
TPDS (3.88). Oneway analysis of variance was used to determine whether these three means
were statistically different from each other. The Oneway shows that the TM and TPDS are
significantly different (p = .028). However, the overall Anova results indicated there were no
statistically significant differences in the three means (Figure 1; F = 2.508; p = .087). The
method of delivery independent variable only accounted for approximately 5% of the variance in
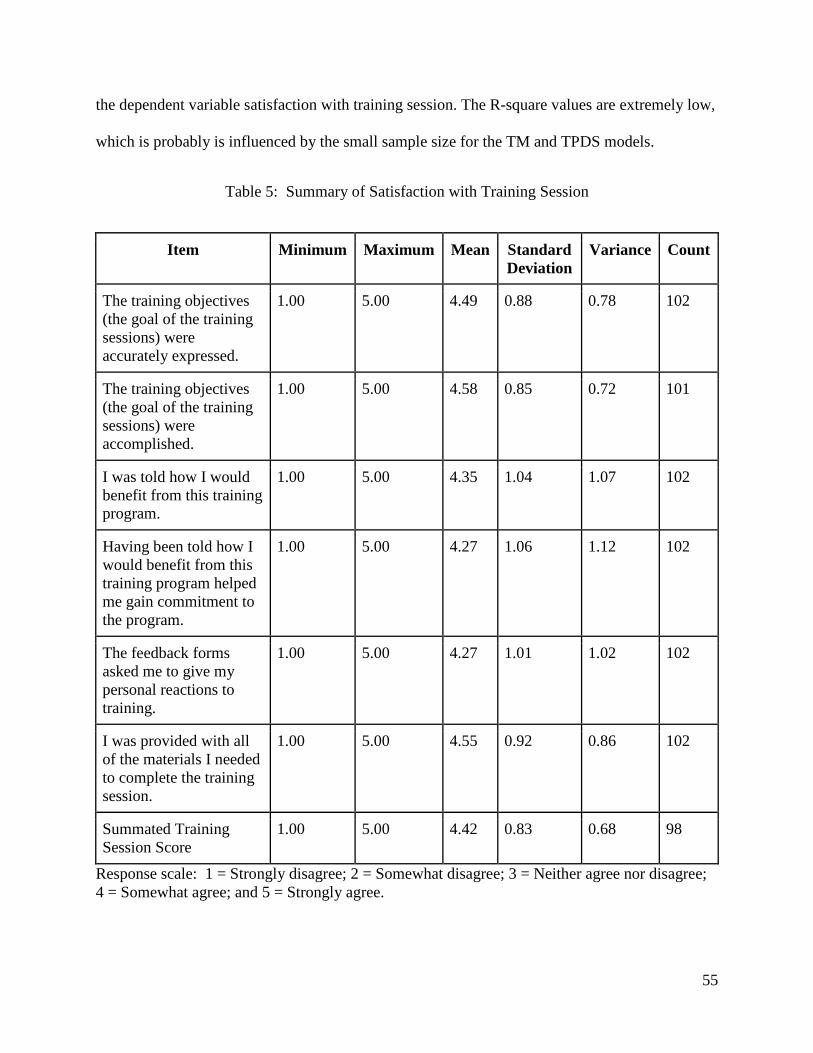
55
the dependent variable satisfaction with training session. The R-square values are extremely low,
which is probably is influenced by the small sample size for the TM and TPDS models.
Table 5: Summary of Satisfaction with Training Session
Item Minimum Maximum Mean Standard Deviation
Variance Count
The training objectives (the goal of the training sessions) were accurately expressed.
1.00 5.00 4.49 0.88 0.78 102
The training objectives (the goal of the training sessions) were accomplished.
1.00 5.00 4.58 0.85 0.72 101
I was told how I would benefit from this training program.
1.00 5.00 4.35 1.04 1.07 102
Having been told how I would benefit from this training program helped me gain commitment to the program.
1.00 5.00 4.27 1.06 1.12 102
The feedback forms asked me to give my personal reactions to training.
1.00 5.00 4.27 1.01 1.02 102
I was provided with all of the materials I needed to complete the training session.
1.00 5.00 4.55 0.92 0.86 102
Summated Training Session Score
1.00 5.00 4.42 0.83 0.68 98
Response scale: 1 = Strongly disagree; 2 = Somewhat disagree; 3 = Neither agree nor disagree; 4 = Somewhat agree; and 5 = Strongly agree.

56
In the figures below, separated circles would imply the means are significantly different
at the t-value significance level of .05. The R-square value is a measure of the reliability of the
Oneway Analysis of the variance model. The F-ratio is another measure of the power of the
model. For a significant model, this number would have to be less than .05. The Connecting
Letters Report is part of the employee’s t means comparison. Levels with different letters are
significantly different. In this case, if all three models (HM, TM, and TPDS) were connected
with “A”s, they would not found to be significantly different.
According to the R-square values for the Training Session (0.050147), Trainer
(0.038999), and Transfer of Learning (0.022558) sections, there are no statistically significant
differences between the different models. The R-square values are extremely low, which is
probably driven by the small sample size for the TM and TPDS models. The only section that is
significant is the Training Content (0.131547) section.

57
Figure 1: Oneway Analysis of Training Session Summated Score by Location & Trainer

58
Satisfaction with Training Content – Table 6 summarizes information for individual
items and for the overall summated score for satisfaction with training content. The overall
satisfaction with training session content group mean was 4.61. Individual training method
delivery mean values were HM (4.68), TM (4.77), and TPDS (3.64). Oneway analysis of
variance was used to determine whether these three means were statistically different from each
other. The Anova results indicated there was a statistically significant differences in the three
means (Figure 2; F = 7.195; p = .002). The post hoc test (Figure 2 revealed that the TPDS mean
of 3.64 was significantly lower than the mean of both the HM group (4.68) and TM group (4.77).
The method of delivery independent variable only accounted for approximately 13% of the
variance in the dependent variable satisfaction with training session.
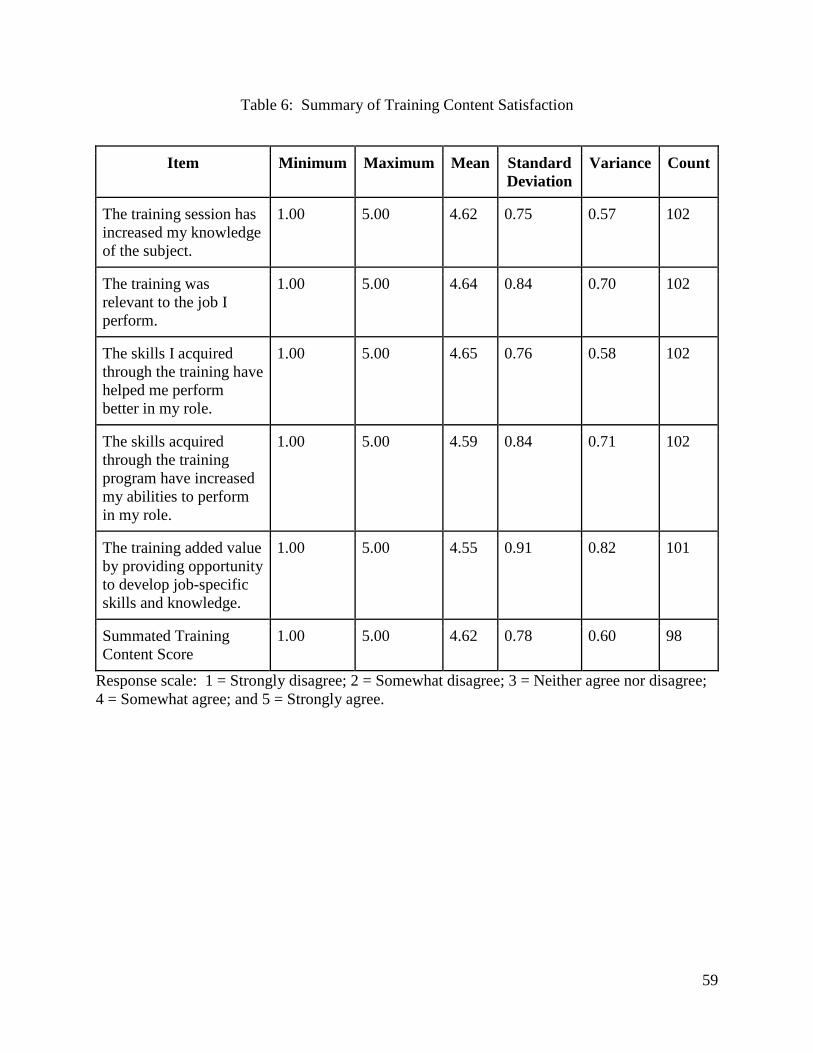
59
Table 6: Summary of Training Content Satisfaction
Item Minimum Maximum Mean Standard Deviation
Variance Count
The training session has increased my knowledge of the subject.
1.00 5.00 4.62 0.75 0.57 102
The training was relevant to the job I perform.
1.00 5.00 4.64 0.84 0.70 102
The skills I acquired through the training have helped me perform better in my role.
1.00 5.00 4.65 0.76 0.58 102
The skills acquired through the training program have increased my abilities to perform in my role.
1.00 5.00 4.59 0.84 0.71 102
The training added value by providing opportunity to develop job-specific skills and knowledge.
1.00 5.00 4.55 0.91 0.82 101
Summated Training Content Score
1.00 5.00 4.62 0.78 0.60 98
Response scale: 1 = Strongly disagree; 2 = Somewhat disagree; 3 = Neither agree nor disagree; 4 = Somewhat agree; and 5 = Strongly agree.

60
Figure 2: Oneway Analysis of Training Content Summated Score by Location & Trainer

61
Satisfaction with Trainer – Table 7 summarizes information for individual items and for
the overall summated score for satisfaction with trainer. The overall satisfaction with trainer
group mean was 4.54. Individual training method delivery mean values were HM (4.55), TM
(4.76), and TPDS (3.97). Oneway analysis of variance was used to determine whether these three
means were statistically different from each other. The Anova results indicated there were no
statistically significant differences in the three means (Figure 3; F = 1.927; p = .151). The
method of delivery independent variable only accounted for approximately 3.8% of the variance
in the dependent variable satisfaction with the trainer.
Table 7: Summary of Satisfaction with the Trainer
Item Minimum Maximum Mean Standard Deviation
Variance Count
The trainer was helpful in answering any questions that I had.
1.00 5.00 4.65 0.85 0.72 102
The trainer was well prepared.
1.00 5.00 4.58 0.96 0.93 102
The trainer encouraged and motivated me to learn.
1.00 5.00 4.61 0.83 0.69 101
The trainer used varied learning methods for different types of learners (e.g. slides, images, videos, practical demos).
1.00 5.00 4.25 1.22 1.48 102
The trainer encouraged collaboration and teamwork.
1.00 5.00 4.58 0.90 0.82 101
Summated satisfaction with Trainer Score
1.00 5.00 4.55 0.88 0.77 98

62
Response scale: 1 = Strongly disagree; 2 = Somewhat disagree; 3 = Neither agree nor disagree; 4 = Somewhat agree; and 5 = Strongly agree.
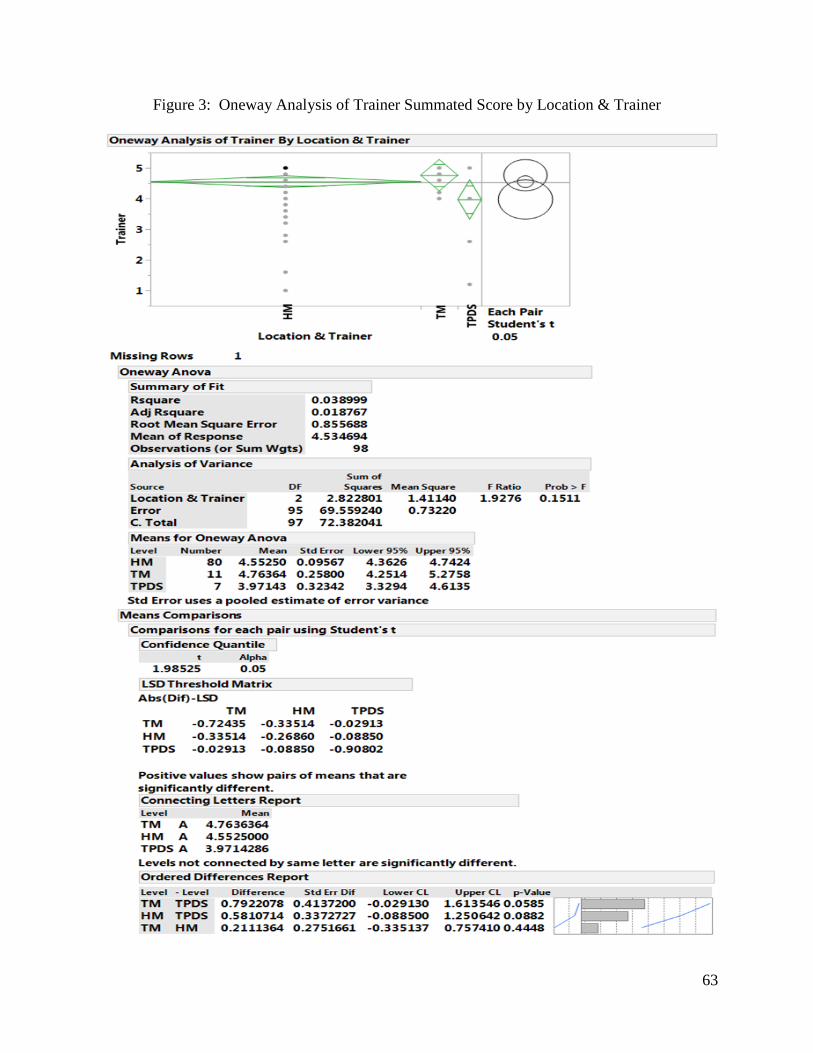
63
Figure 3: Oneway Analysis of Trainer Summated Score by Location & Trainer
64
Satisfaction with Transfer of Learning – Table 8 summarizes information for individual
items and for the overall summated score for satisfaction with transfer of learning. The overall
satisfaction with transfer of learning group mean was 4.56. Individual training method delivery
mean values were HM (4.53), TM (4.77), and TPDS (4.31). Oneway analysis of variance was
used to determine whether these three means were statistically different from each other. The
Anova results indicated there were no statistically significant differences in the three means
(Figure 4; F = 1.073; p = .346). The method of delivery independent variable only accounted for
approximately 2.3% of the variance in the dependent variable satisfaction with transfer of
learning.

65
Table 8: Summary of Transfer of Learning
Field Minimum Maximum Mean Standard Deviation
Variance Count
My Manager or PDS supported me in transferring what I learned in my daily work.
1.00 5.00 4.64 0.74 0.55 101
I was able to transfer what I learned from training to work.
1.00 5.00 4.63 0.79 0.63 101
I was in control of how to implement what I learned.
1.00 5.00 4.60 0.72 0.52 100
I made mistakes when transferring what I learned to the job.
1.00 5.00 4.02 1.09 1.18 100
I was allowed to learn from these mistakes, rather than being punished or looked down on for having made them.
1.00 5.00 4.66 0.76 0.58 101
The training has put me in better control over my job.
1.00 5.00 4.67 0.78 0.62 101
The training has increased my work efficiency and effectiveness.
1.00 5.00 4.64 0.82 0.67 101
Summated satisfaction with transfer of learning score
1.00 5.00 4.56 0.65 0.42 96
Response scale: 1 = Strongly disagree; 2 = Somewhat disagree; 3 = Neither agree nor disagree; 4 = Somewhat agree; and 5 = Strongly agree.

66
Figure 4: Oneway Analysis of Transfer of Learning Summated Score by Location & Trainer

67
The most important metrics are the F-ratio and Prob > F values which show the statistical
significance of the Anova model. F probability values of less than 0.05 means the model is
significant and indicates there are significant differences in the dependent variable scores that are
attributable to the independent variable. The only model that turned out to be significant was the
Training Content score by HM model versus TM model versus TPDS model (p = 0.001). The
Anova model showed that the Training Content scores for employees in the TPDS group were
significantly less than the scores in the other two groups.
This was not what the researcher had expected or hypothesized. Out of approximately
328 employees, 98 completed the survey in its entirety, which resulted in a 30% response rate.
The TPDS model had approximately a 5% response rate. The TM model had approximately an
8% response rate. And, the HM model had approximately a 44% response rate. The Trainer Store
response rate was approximately 45%, and the Home Store response rate was approximately
55%. However, the results must be interpreted with caution, given the extremely small sample
sizes in both the TM and TPDS groups, which may have been due to the research being limited
to only 20% of eligible employees and a lower than expected response rate and completion rate.
The post hoc tests showed that there was no significant difference between the different groups
perhaps because of the small sample size. Because of this, the one outlier in the TPDS model had
a major impact on the overall average of scores within that model. The small sample size greatly
impacted the results, and one set of bad scores (containing outliers), especially in the TPDS
model, skewed the averages. Therefore, an additional analysis was completed to potentially
reduce the impact of the small number of participants in the HM and TM groups in combination
with the outlier issue. The following section summarizes the additional analysis.

68
Section Four: Differences in Four Outcome Scores by Store Location
The Wilcoxon Test 1 performs the test based on Wilcoxon rank scores. The Wilcoxon
rank scores are the simple ranks of the data. The Wilcoxon test is the most powerful rank test for
errors with logistic distributions. If the factor has two or more levels, the Kruskal-Wallis test is
performed.
The Median Test performs the test based on median rank scores. The median rank scores
are either 1 or 0, depending on whether a rank is above or below the median rank. The Median
test is the most powerful tests for errors with double-exponential distributions.
The Score Sum and Expected Score calculates the number of scores that are above the
median for each group, then compares that to their expected values (Home Store had more than
expected, while Trainer Store had less than expected). The mean and standard deviation are
standardized test scores for the evaluation below. The 2-Sample Test, Normal Approximation
must be less than a significance level of 0.05 to say that there is a significant difference in
medians for the two groups. The Oneway Test, Chi Square Approximation is similar to the
results above (not less than 0.05, but closest of any other variable score).
Table 9 represents the categorization of the open-ended responses from employees in the
Trainer Store and Home Store models. Examining the open-ended responses, the researcher
discovered elements of social learning theory present from the responses of the employees in
both models. The first three questions are categorized in terms of positive response, negative
response, and neutral/no response. The fourth question is categorized in terms of enjoyed
something, enjoyed nothing, or no response. And, the fifth question is categorized in terms of
something different, nothing different, and no response.

69
The results show that there were proportionately more positive responses from both
models in the first three questions. For the fourth question, the responses from each of the three
models indicate that the employees enjoyed something from their training. And, from the fifth
question, the responses from each of the three models reveal a somewhat even distribution
among something different, nothing different, and no response to what (if anything) could have
been done differently during training.
Table 9: Comparison of Open-Ended Responses by Location
1. How would you describe your training experience?
Positive Response
Negative Response
Neutral/ No Response
Total
HS 56/70% 6/8% 18/23% 80/100%
TS 15/83% 3/17% 0/0% 18/100%
Total 71/72% 9/9% 18/18% 98/100%
2. How would you describe your experience with your trainer?
Positive Response
Negative Response
Neutral/ No Response
Total
HS 61/76% 4/5% 15/19% 80/100%
TS 14/78% 1/6% 3/17% 18/100%
Total 75/77% 5/5% 18/18% 98/100%
3. How would you describe your experiences training with your peers?
Positive Response
Negative Response
Neutral/ No Response
Total
HS 59/74% 3/4% 18/23% 80/100%
TS 16/89% 0/0% 2/11% 18/100%
Total 75/77% 3/3% 20/20% 98/100%

70
4. What (if anything) did you enjoy the most about your training?
Enjoyed Something
Enjoyed Nothing
No Response Total
HS 58/73% 2/3% 20/25% 80/100%
TS 16/89% 0/0% 2/11% 18/100%
Total 74/76% 2/2% 22/22% 98/100%
5. What (if anything) could have been done differently during your training?
Something Different
Nothing Different
No Response Total
HS 24/30% 28/35% 28/35% 80/100%
TS 5/28% 10/56% 3/17% 18/100%
Total 29/30% 38/39% 31/32% 98/100%
According to Figure 5: Oneway Analysis of Training Session by Training Location, the
Median Test indicates a Chi Square of 0.006 and a probability of 0.937 which indicates that there
is not a significant difference in medians for the two groups.

71
Figure 5: Oneway Analysis of Training Session Summated Score by Training Location

72
According to Figure 6: Oneway Analysis of Training Content by Training Location, the
Median Test indicates a Chi Square of 1.633 and a probability of 0.201 which indicates that there
is not a significant difference in medians for the two groups.
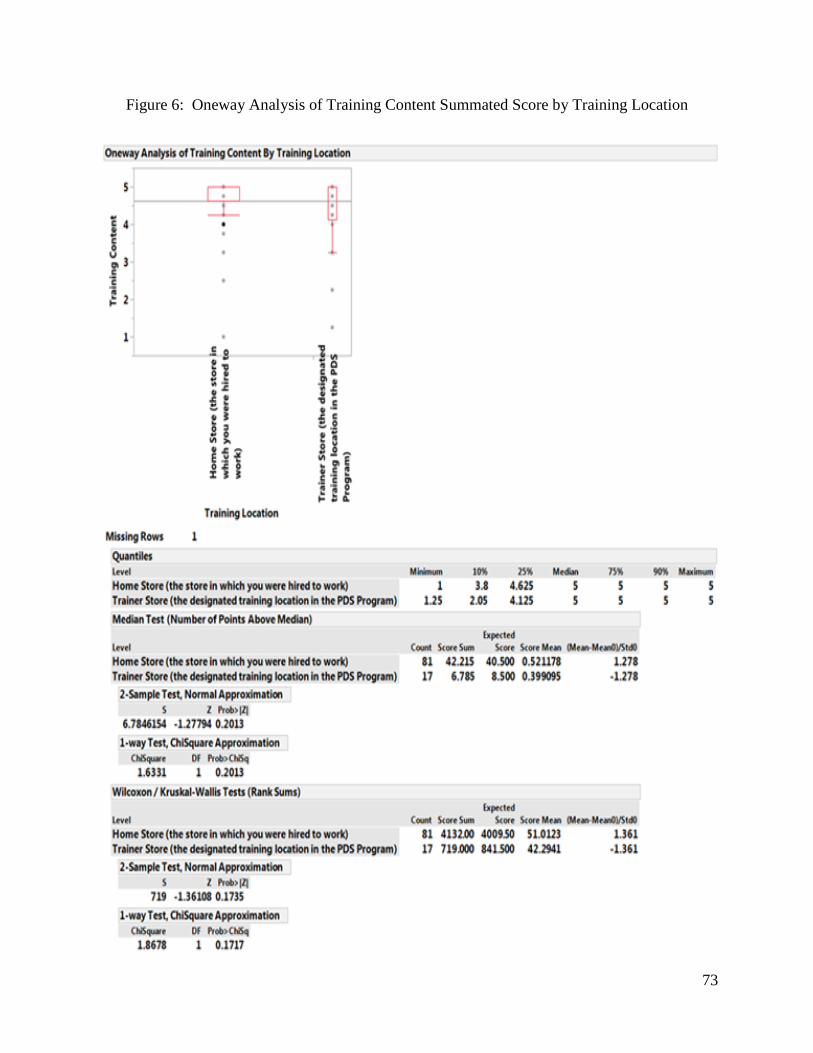
73
Figure 6: Oneway Analysis of Training Content Summated Score by Training Location

74
According to Figure 7: Oneway Analysis of Trainer by Training Location, the Median
Test indicates a Chi Square of 0.178 and a probability of 0.673 which indicates that there is not a
significant difference in medians for the two groups.

75
Figure 7: Oneway Analysis of Trainer Summated Score by Training Location

76
According to Figure 8: Oneway Analysis of Transfer of Learning by Training Location,
the Median Test indicates a Chi Square of 0.297 and a probability of 0.586 which indicates that
there is not a significant difference in medians for the two groups.

77
Figure 8: Oneway Analysis of Transfer of Learning Summated Score by Training Location

78
These tests show that there is almost a significant difference between the median values
of Trainer Stores versus Home Stores in terms of Training Content (Trainer Stores being worse),
but not quite. All tests with other variables were not really close to being statistically significant,
so they were all found to have similar medians between the two groups.
79
CHAPTER 5: DISCUSSION
This chapter summarizes the findings and discusses the limitations of the research study
and the opportunities for further research, and offers an overall conclusion. The aim of this study
was to interpret the employee’s perceptions based on the constructs of social learning theory and
self-efficacy, specifically how satisfied employees were with the training session, training
content, trainer, and transfer of learning from training to work. The purpose of this research was
to better understand how employees who have been recently hired for the role of salesperson felt
about their level of satisfaction with training and development and to better understand the
perceived conformity with principles of social learning theory as well.
Summary of Quantitative Results
Employees’ self-reported satisfaction with the training was assessed using four outcome
indicators (Training Session, Training Content, Trainer, and Transfer of Learning). The average
satisfaction scores were based on summated Likert scale average item values.
When examined by the method of training delivery (HM, TM, or TPDS), the average
scores showed a similar pattern. Satisfaction scores for each of the four outcome indicators were
higher for employees trained in the TM method of delivery, followed in order by those trained in
the HM method and then those trained in the TPDS method of training. Generally, those mean
values qualitatively would be described as ranging from “somewhat agree” to “strongly agree.”
The Oneway Anova results indicated there were no statistical differences among the three
methods of delivery for three of the outcome indicator scores (Training Session, Trainer, and
Transfer of Learning). There was a statistical difference in the Training Content score by method
of delivery. Those employees receiving training via the HM (mean = 4.7) and TM (mean = 4.8)
80
methods reported significantly higher satisfaction scores with the content than did employees in
the TPDS (mean = 3.6) method of delivery.
The researcher also examined differences in the satisfaction scores for the four outcome
measures by store (Trainer Store or Home Store). There were no statistical differences when
examined by store location.
The results of this research study compared similarly to the results of the study by Latif,
Jan, and Shaheen. Their study showed that the most important aspect of a training program is the
trainer. Trainers were a vital aspect of the learning experience. Having a trainer who was helpful
and well-prepared played an important role in the overall success of a training program. The role
of the trainer played a significant part in the overall success of the program.
Overall, the results showed that the TM model was the “best” model for training at this
company. Having a dedicated mentor or trainer that provided excellent training was important to
the employees at this organization. The study may have produced different results if there were a
greater representation from all three models or at least for the TM and TPDS models. The
researcher would have liked to have seen more responses, particularly from the TPDS model. As
the company continues to invest resources and time into the TPDS model, the researcher
recommends additional research be used to determine the effectiveness of this model.
Limitations
While this research study provided some insight into employee perceptions of self-
efficacy and training effectiveness, there were also limitations that will provide opportunities for
further research either at this company or at similar organizations.

81
One limitation of this research study was the demographics and locations of the Trainer
Stores. The Trainer Stores were selected based on historical data of areas of high turnover, so the
demographics of the population of participants in Trainer Store locations may have differed than
those in the Home Store locations. The survey looked at only nine districts out of 50 districts.
The company is located in six states, however the nine districts selected were only located in
four of the six states. The entire population of trainees was not represented in the results of the
survey which limited the responses to those employees located with a small population of the
company.
Another limitation of this study was the use of a survey tool as the primary instrument,
particularly the use of Likert scales for measuring satisfaction. “Likert scale anchors to the left of
the middle one (which, it can be reasonably argued, stands for “I do not know,” and/or “I do not
care,” and/or “I am indifferent”) are incongruent with the “can do” (up to 100% certainty)
efficacy belief” (Stajkovic, Lee, & Nyberg, 2009, p.823). There is the potential for measurement
error by having wrong, or inappropriately worded, anchors. The survey instrument was also
originally developed with office employees. In this research study, the survey instrument was
modified for store employees. If a survey does not contain a good reliability, the researcher
should use individual items, such as open-ended responses, which the researcher did with this
research study. However, the majority of the questions on the survey were limited to responses
on a Likert scale.
Another limitation of this study was the low number of respondents. Out of
approximately 328 employees, 98 completed the survey in its entirety, which resulted in a 30%
response rate. The TPDS model had approximately a 5% response rate. The TM model had
approximately an 8% response rate. And, the HM model had approximately a 44% response rate.
82
The Trainer Store response rate was approximately 45%, and the Home Store response rate was
approximately 55%. The limitation and reduction of the population to only 20% of the eligible
employees and a lower than expected response rate and completion rate has threatened the
validity of the study.
Because of the limitations associated with this research, the results should be viewed with
caution. The resulting sample may not be representative of the overall organization. Further
research could help uncover what is taking place.
Further Research
Despite these limitations, the study resulted in several opportunities for further research.
The results were insignificant, which may have been due to a number of factors outside of the
researcher’s control. The results would likely be different had the researcher been permitted to
administer the survey company wide and to provide additional descriptions of the PDSs in the
respective markets and to follow up with subjects in an attempt to increase response rates. This
presents the opportunity to further the research at this company or other similar organizations.
Further research is recommended at either this company or similar organizations to gather
additional information on employee’s perceptions of self-efficacy and training satisfaction. The
first opportunity is the redistribution of the survey company wide. Another opportunity is the
replication and extension of employee perceptions of self-efficacy and training satisfaction in
similar settings. Further study may uncover other parallels to social learning theory, self-
efficacy, collective efficacy, and training satisfaction, particularly with the training session, the
training content, the trainer, and the transfer of learning from training to work.

83
Future research and studies could include an expanded quantitative study. The survey
could be distrusted across the company to include a representative sample of the 50 districts and
the six states where the organization is located. Future research and studies could also include an
expanded qualitative study. Interviews could be conducted with employees, mentors, and trainers
to gain a deeper understanding of training satisfaction.
This study had made a contribution to the theoretical knowledge base and related
literature on social learning theory, self-efficacy, and training satisfaction. The results of this
study could suggest additional research and could offer practical implications for business
organizations and corporate training programs with regard to new employee training and
development through better understanding the readiness and success of employees recently hired.
Conclusion
This study aimed to better understand how employees who have been recently hired for
the role of salesperson perceived self-efficacy and training satisfaction through the lens of social
learning theory. Social learning theory states that individuals learn in a social context or setting
through modeling, observation, and reinforcement. Based on this theory, this study sought to
determine the extent to which learning in the TPDS model, which embeds training in a social
setting, and uses self-efficacy, vicarious learning, and self-regulation was perceived by new
employees as having the elements of social learning theory and was perceived differently by
employees who were trained in the other models, which have been the company’s traditional
models of training.
The metrics and statistics from the TPDS model showed that engagement scores
increased, training hours were saved, and turnover was decreased, however, there was a lack of

84
information and understanding on how the new employees feel about the training session, the
training content, their trainer, and the transfer of training to work. By better understanding
employees’ perceptions on self-efficacy and training satisfaction, the research uncovered
potential reasons for increased engagement and reduced turnover within the TPDS model across
the organization. The results of the research study revealed differences and similarities between
the employees who were trained in the TPDS model and the employees who were trained in the
other models.
This quasi-experimental study provided opportunities to examine how employees hired
for the role of salesperson felt about training and development and the transfer of learning to
work through the lens of social learning theory. Specifically, the study administered an online
survey to a sample of new employees going through the salesperson training in both the TPDS
model and other models to gather information on how trainees felt about the training session, the
training content, their trainer, and the transfer of learning from training to work.
External to the study, there are some possible explanations of why the TPDS model may
have performed according to expectations. First of all, the program was recently implemented
and within only certain areas across the company. Also, there may have been confusion around
the role of Performance Development Specialist. The role of the PDS is evolving as the program
continues to expand across other states within the organization. Moreover, it may not be the
same as having a mentor that has been with the company for several years. It is likely that there
are existing relationships between trainees and the employees in the store before they seek
employment. Knowing this information may have influenced the results of the survey.

85
Contrary to expectations, the results of this research showed that, overall, there is no
significant difference between each of the models. In only one of the areas, training content,
there was a slight difference favoring the TM model. Having a dedicated mentor that provided
excellent training was important to the employees at this organization. And, having the
opportunity to learn in small groups was also a benefit to newly hired trainees. All of the results
of this research study should be considered tentative, given the low number of respondents,
however, the results indicate that more research is warranted.
These results represent opportunities to learn and to think about where to go from here.
This research study resulted in new ways of gathering information at this particular company.
Rather than looking at the figures and numbers of the training dollars and training hours saved,
there is a great opportunity to better understand the impact of training and development on the
employees, mentors, and trainers within the organization.

86
REFERENCES
Allen, D. G., & Shanock, L. R. (2012). Perceived organizational support and embeddedness as
key mechanisms connecting socialization tactics to commitment and turnover among new
employees. Journal of Organizational Behavior, 34(3), 350-369. doi:10.1002/job.1805
Bandura, A. (1971). Social learning theory. Morristown, N.J.: General Learning Press.
Bandura, A. (1977). Self-efficacy: Toward a unifying theory of behavioral change.
Psychological Review, 84(2), 191-215. doi:10.1037//0033-295X.84.2.191
Bandura, A. (1977a). Social learning theory. Englewood Cliffs, N.J.: Prentice Hall.
Bandura, A. (1986). Social foundations of thought and action: A social cognitive theory.
Englewood Cliffs, N.J.: Prentice Hall.
Bandura, A. (1993). Perceived self-efficacy in cognitive-development and functioning.
Educational Psychologist, 28(2), 117-148. doi:10.1207/s15326985ep2802_3
Bandura, A. (1994). Self-efficacy. In V. S. Ramachaudran (Ed.), Encyclopedia of human
behavior (Vol. 4, pp. 71-81). New York: Academic Press. (Reprinted in H. Friedman
[Ed.], Encyclopedia of mental health. San Diego: Academic Press, 1998).
Bandura, A. (1995). Exercise of personal and collective efficacy in changing societies. In A.
Bandura (Ed), Self-efficacy in changing societies. Cambridge, N.Y.: Cambridge
University Press.
Bandura, A. (1997). Self-efficacy: The exercise of control. New York: W.H. Freeman.
Campbell, D. T., & Stanley, J. C. (1963). Experimental and quasi-experimental designs for
research. Boston: Houghton Mifflin.
Carter, A., Nesbit, P., & Joy, M. (2010). Using theatre-based interventions to increase employee
self-efficacy and engagement. In S. L. Albrecht (Ed), Handbook of employee
engagement: Perspectives, issues, research and practice, 416-424. Northampton,
M.A.; Cheltenham, UK: Edward Elgar.
Chiaburu, D. S., & Lindsay, D. R. (2008). Can do or will do? The importance of self-efficacy
and instrumentality for training transfer. Human Resource Development International,

87
11(2), 199-206. doi:10.1080/13678860801933004
Colquitt, J. A., LePine, J. A., & Noe, R. A. (2000). Toward an integrative theory of training
motivation: A meta-analytic path analysis of 20 years of research. Journal of Applied
Psychology, 85(5), 678-707. doi:10.1037/0021-9010.85.5.678
Cook, T. D., & Campbell, D. T. (1979). Quasi-experimentation: Design & analysis issues for
field settings. Chicago: Rand McNally College Publishing Company.
Creswell, J. W. (2014). Research design: Qualitative, quantitative, and mixed methods
approaches (4th ed.). Thousand Oaks, C.A.: SAGE Publications.
Creswell, J. W. (2015). A concise introduction to mixed methods research. Los Angeles: SAGE
Publications.
Feldman, D. C., & O’Neill, O. A. (2014). The role of socialization, orientation, and training
programs in transmitting culture and climate and enhancing performance. In B. Schneider
& K. M. Barbera (Eds). The oxford handbook of organizational climate and culture.
Oxford: Oxford University Press.
Fenwick, T. (2008). Workplace learning: Emerging trends and new perspectives. New
Directions for Adult and Continuing Education, 2008(119), 17-26. doi:10.1002/ace.302
Fink, A. (2003). The survey handbook (2nd ed.). Thousand Oaks, C.A.; London: SAGE
Publications.
Fink, A. (2013). How to conduct surveys: A step-by-step guide (5th ed.)? Thousand Oaks, C.A.:
SAGE Publications.
Fowler, F. J. (2014). Survey research methods (5th ed.). Los Angeles: SAGE Publications.
Frayne, C. A., & Geringer, J. M. (2000). Self-management training for improving job
performance: A field experiment involving salespeople. Journal of Applied Psychology,
85(3), 361-372. doi:10.1037/0021-9010.85.3.361
Gist, M. E. (1989). The influence of training method on self-efficacy and idea generation among
managers. Personnel Psychology, 42(4), 787. doi:10.1111/j.1744-6570. 1989.tb00675.x
Griffin, R. (2014). Complete training evaluation: The comprehensive guide to measuring return

88
on investment. London: Kogan Page.
Grow, G. O. (1991). Teaching learners to be self-directed. Adult Education Quarterly, 41(3),
125-149. doi:10.1177/0001848191041003001
Hager, P. (2010). Theories of workplace learning. In M. Malloch, L. Cairns, K. Evans, & B. N.
O'Connor (Eds). The SAGE handbook of workplace learning. London: SAGE
Publications.
Jex, S. M., Sliter, M. T., & Britton, A. (2014). Employee stress and well-being. In B. Schneider
& K. M. Barbera (Eds). The oxford handbook of organizational climate and culture.
Oxford: Oxford University Press.
Jung, D. I., & Sosik, J. J. (2003). Group potency and collective efficacy examining their
predictive validity, level of analysis, and effects of performance feedback on future group
performance. Group & Organization Management, 28(3), 366-391.
Karl, K., Peluchette, J., Hall, L., & Harland, L. (2005). Attitudes toward workplace fun: A three
sector comparison. Journal of Leadership & Organizational Studies, 12(2), 1.
Kirkpatrick, J. D., & Kirkpatrick, W. K. (2016). Kirkpatrick's four levels of training evaluation.
Alexandria, V.A.: ATD Press.
Knowles, M. S., Holton, E. F., & Swanson, R. A. (2015). The adult learner: The definitive
classic in adult education and human resource development (8th ed.). New York;
London: Routledge.
Kram, K. E. (1988). Mentoring at work: Developmental relationships in organizational life.
Lanham [Md.]: University Press of America.
Kram, K. E. (1996). A relational approach to career development. In D. Hall & Associates (Eds)
The career is dead--long live the career: A relational approach to careers (1st ed.). San
Francisco: Jossey-Bass Publishers.
Latif, K. F., Jan, S., & Shaheen, N. (2011). Association of training satisfaction with employee
development aspect of job satisfaction. Journal of Managerial Sciences, 7(1), 160-178.
Latif, K. F. (2012). An integrated model of training effectiveness and satisfaction with employee

89
development interventions. Industrial and Commercial Training, 44(4), 211-222.
doi:10.1108/00197851211231487
Lave, J., & Wenger, E. (1991). Situated learning: Legitimate peripheral participation. New
York; Cambridge [England]: Cambridge University Press.
Levy, M., Weitz, B. A., & Grewal, D. (2014). Retailing management (9th ed.). New York,
N.Y.: McGraw-Hill Education.
Lowe, D., Levitt, K. J., & Wilson, T. (2011). Solutions for retaining generation Y employees in
the workplace. IEEE Engineering Management Review, 39(2), 46-52.
doi:10.1109/EMR.2011.5876174
Maddux, J. E., & Gosselin, J. T. (2003). Self-efficacy. In M. R. Leary & J. P. Tangney (Eds).
Handbook of self and identity (2nd ed.). New York: Guilford Press.
Marsick, V., Watkins, K., & O’Connor, B. N. (2010). Researching workplace learning in the
United States. In M. Malloch, L. Cairns, K. Evans, & B. N. O'Connor (Eds). The SAGE
handbook of workplace learning. London: SAGE Publications.
McShane, S. L., & Von Glinow, M. Y. (2015). Organizational behavior (7th ed.). New York:
McGraw-Hill/Irwin.
Neck, C. P., Houghton, J. D., & Murray, E. L. (2017). Organizational behavior: A
critical-thinking approach. Los Angeles: SAGE Publications.
Nesbary, D. (2000). Survey research and the world wide web. Boston: Allyn and Bacon.
Ormrod, J. E. (2014). Educational psychology: Developing learners (8th ed.). Boston:
Pearson.
Pajares, F. (2008). Motivational role of self-efficacy beliefs in self-regulated learning. In D. H.
Schunk, & B. J. Zimmerman (Eds). Motivation and self-regulated learning: Theory,
research, and applications. New York: Lawrence Erlbaum Associates.
Robbins, S. P., & Judge, T. (2017). Organizational behavior (17th ed.). Boston: Pearson.
Russ-Eft, D. (2010). Towards a meta-theory of learning and performance. In M. Malloch, L.
Cairns, K. Evans, & B. N. O'Connor (Eds). The SAGE handbook of workplace learning.

90
London: SAGE Publications.
Saks, A. M., & Gruman, J. A. (2010). Organizational socialization and newcomer engagement.
In S. L. Albrecht (Ed), Handbook of employee engagement: Perspectives, issues,
research and practice, 416-424. Northampton, M.A.; Cheltenham, UK: Edward Elgar.
Schunk, D. H. (2008). Attributions as motivators of self-regulated learning. In D. H. Schunk, &
B. J. Zimmerman (Eds). Motivation and self-regulated learning: Theory, research, and
applications. New York: Lawrence Erlbaum Associates.
Stajkovic, A. D., Lee, D., & Nyberg, A. J. (2009). Collective efficacy, group potency, and group
performance: Meta-analyses of their relationships, and test of a mediation model.
Journal of Applied Psychology, 94(3), 814.
Stajkovic, A. D., & Luthans, F. (1998). Self-efficacy and work-related performance: A
meta-analysis. Psychological Bulletin, 124(2), 240-261.
doi:10.1037/0033- 2909.124.2.240
Sue, V. M., & Ritter, L. A. (2012). Conducting online surveys (2nd ed.). Thousand Oaks,
C.A.: SAGE Publications.
Zimmerman, B. J. (1995). Self-efficacy and educational development. In A. Bandura (Ed).
Self-efficacy in changing societies. Cambridge; New York: Cambridge University Press.

91
APPENDIX A: EMAIL COMMUNICATION
January 6, 2017 Hello Store Manager Team, Please read the following letter at your next store meeting and then post this letter in the breakroom from January 6, 2017 to January 23, 2017: Hello. My name is Stephenie Schroth. I am an Instructional Designer II at Sheetz, Inc. I am also a graduate student in the Ph.D. Learning, Design, and Technology program at Penn State. I am conducting a Penn State research study on employee perceptions about self-efficacy, one’s beliefs in one’s ability to succeed in specific situations or to accomplish a task, and training satisfaction. A survey through Talent Workz will be administered to employees who were recently hired for the role of salesperson from August 1, 2016 to November 30, 2016 to determine their level of satisfaction with the training session, the training content, the trainer, and the transfer of learning from training to work. The research will help to uncover the types of training and transfer of learning that helps to promote higher levels of self-efficacy and work assertiveness with employees at this company and has implications for other similar organizations. Sheetz, Inc. does not have access to any of the data. The online survey is completely anonymous and voluntary. Participation or nonparticipation will not have any effect on employment status. All eligible salespersons will receive the online survey on their individual learning plan through Talent Work from January 6 to January 23. Please complete it to help improve training experiences. You are not obliged to answer every question, but doing so will help better understand your experience and how to improve it. If you have any questions, please contact me in Workforce Development at 814-941-5500 or [email protected]. Thank you, Stephenie Schroth

92
APPENDIX B: TRAINING AND DEVELOPMENT JOB SATISFACTION SURVEY
Sheetz, Inc. does not have access to any of the data. The online survey is completely anonymous and voluntary. Participation or nonparticipation will not have any effect on employment status. All eligible salespersons will receive the online survey on their individual learning plan through Talent Workz beginning 1/6/17 and will close at 11:59pm 1/23/17. Please complete it to help improve training experiences. You are not obliged to answer every question, but doing so will help better understand your experience and how to improve it.
If you have any questions, please contact Stephenie Schroth in Workforce Development at 814-941-5500 or [email protected].
Select the best response to each of the following statements:
I am located in the following state:
● Pennsylvania ● Ohio ● Maryland ● Virginia ● West Virginia ● North Carolina
I was trained at a:
● Home Store (the store in which you were hired to work) ● Trainer Store (the designated training location in the PDS Program) ● Unsure (by selecting this response, this survey will not be able to be used in this research
study)
The majority of my training was conducted by a:
● Mentor (training provided by co-worker or management team member) ● Performance Development Specialist (designated trainer for a market) ● Unsure (by selecting this response, this survey will not be able to be used in this research
study)

93
Satisfaction with Training Session
Strongly agree
Somewhat agree
Neither agree or disagree
Somewhat disagree
Strongly disagree
The training objectives (the goal of the training sessions) were accurately expressed.
The training objectives (the goal of the training sessions) were accomplished.
I was told how I would benefit from this training program.
Strongly agree
Somewhat agree
Neither agree or disagree
Somewhat disagree
Strongly disagree
Having been told how I would benefit from this training program helped me gain commitment to the program.
The feedback forms asked me to give my personal reactions to training.
I was provided with all of the materials I needed to complete the training session.

94
Training Content Satisfaction
Strongly agree
Somewhat agree
Neither agree or disagree
Somewhat disagree
Strongly disagree
The training session has increased my knowledge of the subject.
The training was relevant to the job I perform.
The skills I acquired through the training have helped me perform better in my role.
Strongly agree
Somewhat agree
Neither agree or disagree
Somewhat disagree
Strongly disagree
The skills acquired through the training program have increased my abilities to perform in my role.
The training added value by providing opportunity to develop job-specific skills and knowledge.

95
Satisfaction with Trainer
Strongly agree
Somewhat agree
Neither agree or disagree
Somewhat disagree
Strongly disagree
The trainer was helpful in answering any questions that I had.
The trainer was well prepared.
The trainer encouraged and motivated me to learn.
Strongly agree
Somewhat agree
Neither agree or disagree
Somewhat disagree
Strongly disagree
The trainer used varied learning methods for different types of learners (e-g, slides, images, videos, practical demos).
The trainer encouraged collaboration and teamwork.

96
Transfer of Learning
Strongly agree
Somewhat agree
Neither agree or disagree
Somewhat disagree
Strongly disagree
My Manager or PDS supported me in transferring what I learned in my daily work.
I was able to transfer what I learned from training to work.
I was in control of how to implement what I learned.
I made mistakes when transferring what I learned to the job.
Strongly agree
Somewhat agree
Neither agree or disagree
Somewhat disagree
Strongly disagree
I was allowed to learn from these mistakes, rather than being punished or looked down on for having made them.
The training has put me in better control over my job.
The training has increased my work efficiency and effectiveness.

97
How would you describe your training experience?
How would you describe your experience with your trainer?
How would you describe your experiences training with your peers?
What (if anything) did you enjoy most about your training?
What (if anything) could have been done differently during your training?

98
APPENDIX C: EXEMPTION DETERMINATION

CURRICULUM VITAE
Stephenie S. Schroth
Education Ph.D. Learning, Design, and Technology Pennsylvania State University, University Park August 2014-May 2017 Instructional Technology Specialist Certificate Pennsylvania State University, World Campus May 2012 M.Ed. Instructional Systems and Educational Technology Pennsylvania State University, World Campus May 2010-May 2012 B.S. Elementary and Kindergarten Education Pennsylvania State University, Altoona College August 2000-May 2004 Experience Instructional Designer II Pennsylvania State University November 2014-present Adjunct Faculty in Education and Technology; Workforce Education Instructor Pennsylvania Highlands Community College August 2013-present Publications
Boys and The Common Core: Video Games to Improve Literacy
Leading a Cyber Charter and Leading a Virtual Academy