Employee Health & Wellness Survey 2012 H... · Overview of 2012 Employee Health and Wellness Survey...
50
Employee Health & Wellness Survey 2012
Transcript of Employee Health & Wellness Survey 2012 H... · Overview of 2012 Employee Health and Wellness Survey...

Employee Health & Wellness Survey 2012

Top 5 Responses When Employees
of U of L Think About Wellness!
• Health
• Exercise
• Happiness
• Balance
• Wellbeing

Table of Contents
• Overview
• Demographics
• Wellness for U
• Overall Health
• Physical Activity and Nutrition
• Worry or Stress
• Workplace
• Barriers
• Recommendations

Overview of 2012 Employee
Health and Wellness Survey
• The Wellness Committee conducted an online
survey of 1258 employees of the U of L
• 704 employees responded for a total response
rate of 56% which is considered robust and
viable by survey experts.
• The Wellness Committee worked with an
independent survey company to administer the
survey – ensured confidentiality and anonymity
Overview
Demographics
Wellness for U
Overall Health
Physical Activity and Nutrition
Worry or Stress
Workplace
Barriers
Recommendations

Overview of 2012 Employee Health
and Wellness Survey
Goals of the Survey:
– Determine employees’
perceptions
– Identify gaps and target
programming
– Raise awareness
– Benchmark metrics of health
and wellness indicators
Outcomes:
– Health, exercise,
happiness, balance,
wellbeing
– Able to develop health and
wellness programming
– Plan to improve the survey
and offer it every 2 – 3
years
Overview
Demographics
Wellness for U
Overall Health
Physical Activity and Nutrition
Worry or Stress
Workplace
Barriers
Recommendations

Demographics
• Survey participants represented a
diverse cross section of employees
• 704 employees responded
• 94% full time
• Most employees work M – F regular day
shifts
• 59% female; 41% male respondents
• 58% employed < 10 years Overview
Demographics
Wellness for U
Overall Health
Physical Activity and Nutrition
Worry or Stress
Workplace
Barriers
Recommendations

Wellness For U
What does wellness
mean to you?
Overview
Demographics
Wellness for U
Overall Health
Physical Activity and Nutrition
Worry or Stress
Workplace
Barriers
Recommendations

Perceptions of Wellness
• Top 5 Survey
Responses:
– Health 63%
– Exercise 24%
– Happiness 22%
– Balance 10%
– Wellbeing 8%
• Living Well at the
U of L vision and
mission:
– Balance of
Individual health
and wellbeing
– Highest level of
lifestyle balance
Overview
Demographics
Wellness for U
Overall Health
Physical Activity and Nutrition
Worry or Stress
Workplace
Barriers
Recommendations

Never, 1%
Seldom, 7%
Sometimes, 29%
Often , 50%
Always, 14%
U of L Encourages Positive Health & Wellness Practices
Overview
Demographics
Wellness for U
Overall Health
Physical Activity and Nutrition
Worry or Stress
Workplace
Barriers
Recommendations

Wellness Information, Education or Training Interests
% of Total Respondents
Overview
Demographics
Wellness for U
Overall Health
Physical Activity and Nutrition
Worry or Stress
Workplace
Barriers
Recommendations

Wellness for U – Summary
• Employees consistently think of Wellness in the
same manner as current Wellness
Vision/Mission
• Overall, employees believe U of L encourages
positive health and wellness practices
• Awareness campaign should be undertaken on
current health and wellness activities
• Most employees would prefer to attend wellness
activities Tuesdays, Wednesdays or Thursdays
• Best times are lunch or evening
(starting at 5 PM)
Overview
Demographics
Wellness for U
Overall Health
Physical Activity and Nutrition
Worry or Stress
Workplace
Barriers
Recommendations

Overall Health
Overview
Demographics
Wellness for U
Overall Health
Physical Activity and Nutrition
Worry or Stress
Workplace
Barriers
Recommendations
Overview
Demographics
Wellness for U
Overall Health
Physical Activity and Nutrition
Worry or Stress
Workplace
Barriers
Recommendations
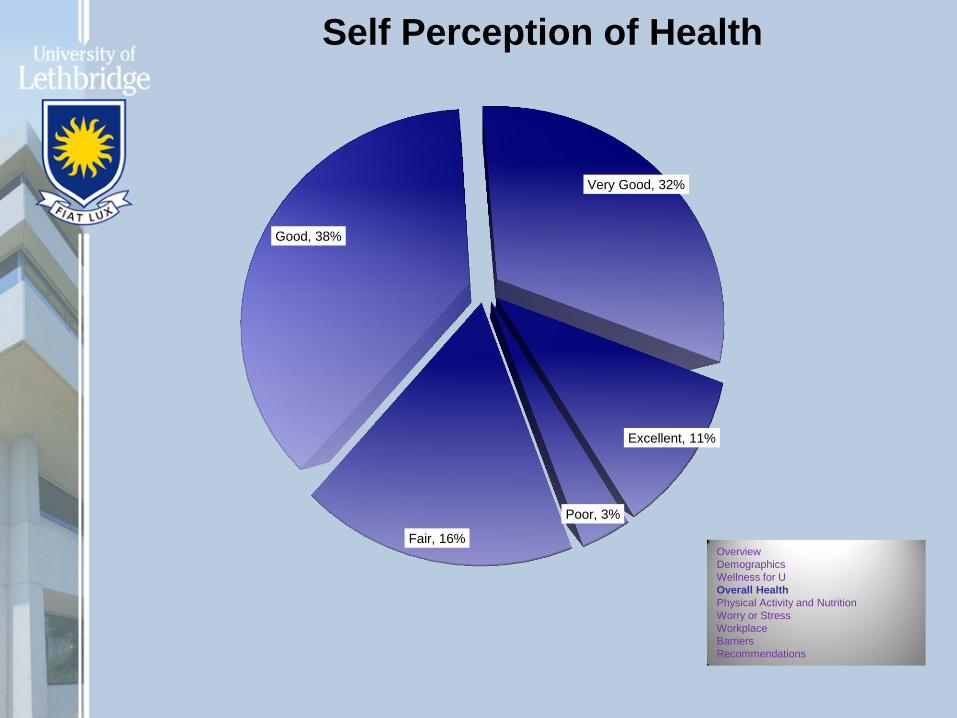
Poor, 3%
Fair, 16%
Good, 38%
Very Good, 32%
Excellent, 11%
Self Perception of Health

Overview
Demographics
Wellness for U
Overall Health
Physical Activity and Nutrition
Worry or Stress
Workplace
Barriers
Recommendations
1%
2%
5%
6%
7%
8%
9%
11%
12%
18%
22%
39%
60%
71%
Reduce non-medical drug use
Seek medical treatment
Quit smoking, or smoke less
Reduce use of painkillers, anti-depressants, sleeping, calmingmedications or other medications
Reduce alcohol intake
Nothing – I feel I manage my health effectively
Change jobs
Effectively manage a chronic health issue
Skip fewer meals
Drink less caffeinated beverages
Change conditions of work
Improve sleep habits
Eat healthier
Be more physically active
What would you like to do in the next year to improve your health?

43%
10%
3%
4%
10%
12%
13%
17%
23%
None of the above
Other (specify)
Diabetes
Bowel disease
Arthritis
Migraines
High blood cholesterol
High blood pressure
Asthma or allergies
Chronic Illnesses
Overview
Demographics
Wellness for U
Overall Health
Physical Activity and Nutrition
Worry or Stress
Workplace
Barriers
Recommendations

Overall Health – Summary
• 81% of employees feel they are healthy
• Top things employees feel they can do to
improve their health: – Physical activity
– Eat healthier
– Improve sleep habits
• Factors that interfere with making changes:
– No time, no energy, stress, money, don’t know how to begin
• 49% of employees feel their Supervisors
don’t assist when dealing with stress
Overview
Demographics
Wellness for U
Overall Health
Physical Activity and Nutrition
Worry or Stress
Workplace
Barriers
Recommendations

What % of Employees are Exposed to
Second Hand Smoke at Work or at
Home?
• 8 % of employees are exposed to
second hand smoke at work or
home.
• 8 % of respondents use tobacco

Overall Health – Summary • Health Risk Indicators:
• Smoking – 92% of employees that completed the
survey don’t smoke or recently quit and plan to
stay that way
– 2% use tobacco and don’t want to quit
– 30% of respondents would prefer designated smoking
areas
– 69% would prefer a smoke free campus Alcohol – 12%
of respondents drink six or more alcoholic
drinks on one occasion at least once per year.
• Chronic illness – 42% no chronic illness
– Asthma and allergies – 23% of employees
– Cardiovascular or Related diseases – 32% (high blood
pressure, high blood cholesterol, diabetes)
Overview
Demographics
Wellness for U
Overall Health
Physical Activity and Nutrition
Worry or Stress
Workplace
Barriers
Recommendations

Physical Activity and
Nutrition
Overview
Demographics
Wellness for U
Overall Health
Physical Activity and Nutrition
Worry or Stress
Workplace
Barriers
Recommendations

I'm active and I want to stay that way, 29%
I'm trying to become more active, 39%
I want to start being more active in the next few
weeks, 19%
I would like to get more active within the next 6
months, 13% I’m inactive and I don’t want
to change anything, 1%
Belief Regarding Current Physical Activity Level
Overview
Demographics
Wellness for U
Overall Health
Physical Activity and Nutrition
Worry or Stress
Workplace
Barriers
Recommendations

Physical Activity and Nutrition–
Summary
• 99% of employees are active or are
trying to increase physical activity levels
• Top things employees feel they can do to
improve their nutrition habits: – Eat more fruit and vegetables – 62%
– Drink more water – 56%
– Limit unhealthy foods – 48%
• 94% either eat healthy or plan to in the
next 6 – 12 months
Overview
Demographics
Wellness for U
Overall Health
Physical Activity and Nutrition
Worry or Stress
Workplace
Barriers
Recommendations

Worry or Stress
Overview
Demographics
Wellness for U
Overall Health
Physical Activity and Nutrition
Worry or Stress
Workplace
Barriers
Recommendations

How Many Employees are Aware of the
Employee and Family Assistance
Program?
• 73% of employees are aware of the Employee
Family Assistance program through Homewood
Human Solutions
www.Homewoodhumansolutions.com
• 26% have used the services – which include: – Counselling Services – including in person, e-Counselling, and telephone
counselling
– E-learning – Stress mgmt, embracing workplace change, resilience, Taking
control of alcohol use, respect in the workplace and more
– Health and Wellness Companion – you will have the opportunity to evaluate
your health, get a better understanding of your health risk factors and create a
personal health improvement plan
• Call toll-free at 1.800.663.1142
Or for the hearing impaired (TTY):
1.888.384.1152

Overview
Demographics
Wellness for U
Overall Health
Physical Activity and Nutrition
Worry or Stress
Workplace
Barriers
Recommendations
7%
8%
10%
10%
11%
12%
14%
14%
15%
17%
Too many changes within my job
I don’t get enough feedback on how I’m doing
Conflict with other people at work
Other (specify)
Work hours are too long
Nothing
Having to bring work home too often
Deadlines
My work tires me mentally
Too much time pressure
Top 10 Work Stressors That Are Interpreted As Both Frequent and Impactful

Overview
Demographics
Wellness for U
Overall Health
Physical Activity and Nutrition
Worry or Stress
Workplace
Barriers
Recommendations
8%
8%
8%
9%
13%
13%
16%
19%
24%
25%
Other (specify)
Behavioral difficulties with children
A close family member or friend has died
Child care and/or elder care problems
Arguments with my spouse, partner, children or roommates
Nothing
I have trouble balancing home and work responsibilities
A close family member or friend has been ill or injured
I don’t have enough money
I have too much to do
Top Ten Non-Work Stressors That Are Interpreted as Both Frequent and Impactful

WHAT ARE YOUR CO-WORKERS’
STRESS MANAGEMENT STRATEGIES?
• Increase physical activity
• Sleep more or better
• Eat healthier
• Socialize more
• Learn to relax
• Manage time better

Overview
Demographics
Wellness for U
Overall Health
Physical Activity and Nutrition
Worry or Stress
Workplace
Barriers
Recommendations
Learn more about coping with worry or stress, 21%
Manage money better , 24%
Get more money, 25%
Spend more time with my family, 29%
Manage time better, 30%
Learn to relax, 34%
Get out more often, make new friends, socialize,
38%
Eat healthier, 40%
Sleep more or sleep better, 50%
Be more physically active, 64%
Top Preferred Coping Strategies

Never 5%
Not Often 27%
Occasionally 36%
Sometimes 25%
Always 7%
Frequency of Signs and Symptoms of Worry and Stress
Overview
Demographics
Wellness for U
Overall Health
Physical Activity and Nutrition
Worry or Stress
Workplace
Barriers
Recommendations

Worry and Stress – Summary Both have impacts on work
• Work
– Too much time
pressure
– Mentally tiring
– Bring work home
– Deadlines
• Outside of Work
– Too much to do
– Not enough $$
– Ill/injured family
members
– Balance of work/home
life responsibilities
Overview
Demographics
Wellness for U
Overall Health
Physical Activity and Nutrition
Worry or Stress
Workplace
Barriers
Recommendations

Worry and Stress – Summary
• 63% of employees wake feeling unrested
occasionally or often
• Challenges to balancing work/home life – Time
Management, Career and Personal Goal
Management
• 45% feel work stress is reasonable given their
job demands.
Overview
Demographics
Wellness for U
Overall Health
Physical Activity and Nutrition
Worry or Stress
Workplace
Barriers
Recommendations

Workplace
Overview
Demographics
Wellness for U
Overall Health
Physical Activity and Nutrition
Worry or Stress
Workplace
Barriers
Recommendations
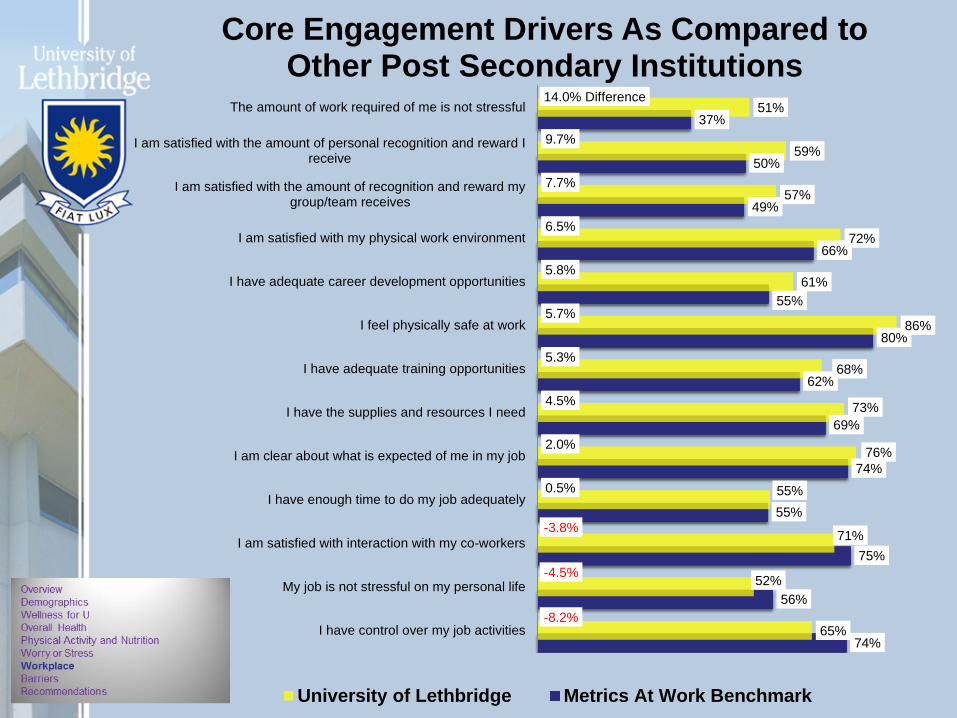
74%
56%
75%
55%
74%
69%
62%
80%
55%
66%
49%
50%
37%
65%
52%
71%
55%
76%
73%
68%
86%
61%
72%
57%
59%
51%
-8.2%
-4.5%
-3.8%
0.5%
2.0%
4.5%
5.3%
5.7%
5.8%
6.5%
7.7%
9.7%
14.0% Difference
I have control over my job activities
My job is not stressful on my personal life
I am satisfied with interaction with my co-workers
I have enough time to do my job adequately
I am clear about what is expected of me in my job
I have the supplies and resources I need
I have adequate training opportunities
I feel physically safe at work
I have adequate career development opportunities
I am satisfied with my physical work environment
I am satisfied with the amount of recognition and reward mygroup/team receives
I am satisfied with the amount of personal recognition and reward Ireceive
The amount of work required of me is not stressful
Core Engagement Drivers As Compared to Other Post Secondary Institutions
University of Lethbridge Metrics At Work Benchmark

Get more employee input on how work is done here
Communicate more openly with employees
Train supervisors or managers to be more sensitive to employees’ concerns
Provide or support stress control program
Support use of external fitness facilities by helping with cost
Introduce or extend flexible hours
Provide or support healthy eating program
Encourage employees to spend time improving their health
Support use of fitness facilities by making time available for thispurpose
Make it easier for employees to be physically active at work
Provide (better) health benefits
20%
20%
25%
25%
26%
27%
29%
31%
35%
37%
38%
What Could the U of L Provide That Would Help Maintain or Improve Health
Overview
Demographics
Wellness for U
Overall Health
Physical Activity and Nutrition
Worry or Stress
Workplace
Barriers
Recommendations

Soreness, pain, burning, tightness, achiness,
numbness, or tingling in your hands, arms,
shoulder, neck, or back, 62%
Weakness, 13%
Lack of endurance: early fatigue, feeling of heaviness in arms, 20%
Clumsiness: constantly dropping or fumbling
with items, 11%
Experienced Warning Signs of Repetitive Strain Injury
Overview
Demographics
Wellness for U
Overall Health
Physical Activity and Nutrition
Worry or Stress
Workplace
Barriers
Recommendations

Workplace – Summary
• Overall, U of L is above average on 10 of the 13
Employee Engagement drivers found on previous
slide
• Job control, however, is more than 5% lower than
the average, and so is a "notably" lower score
• Ergonomics –
– 25% have had an assessment – has helped
– 7% had an assessment – not helped
– 21% not aware of service
– Almost 100% of respondents have experienced
a warning sign of repetitive strain
injury at some time or other
Overview
Demographics
Wellness for U
Overall Health
Physical Activity and Nutrition
Worry or Stress
Workplace
Barriers
Recommendations

Barriers
Overview
Demographics
Wellness for U
Overall Health
Physical Activity and Nutrition
Worry or Stress
Workplace
Barriers
Recommendations

Barriers to improving own
health • Lack of time was consistently named as a major barrier to
engagement.
• Lack of motivation is highly cited as a reason for not
participating or not achieving fitness and weight loss
goals.
• Fun and excitement are missing from corporate wellness
programs, according to many employees.
• People who don’t participate in their company’s exercise
programs say that on-site availability and more time
during the day would make them more likely to do so.
Overview
Demographics
Wellness for U
Overall Health
Physical Activity and Nutrition
Worry or Stress
Workplace
Barriers
Recommendations

Employees get specific about why the U of L wellness
programs have or have not helped them to reach their
personal health goals
• Yes, the wellness program helped: – 74% said they have benefited from the wellness
programs
– ‘Important to train and stress to managers the importance of
health and wellness so they support their staff when wanting
to participate’
• No the wellness program did not help: – 26% say they have not benefited from the Wellness
programs.
– ‘Recognition that we consistently are
doing more with less (time and resources)’
Overview
Demographics
Wellness for U
Overall Health
Physical Activity and Nutrition
Worry or Stress
Workplace
Barriers
Recommendations

Yes 74%
No 26%
Have You Personally Benefited From The University's Wellness
Activities?
Overview
Demographics
Wellness for U
Overall Health
Physical Activity and Nutrition
Worry or Stress
Workplace
Barriers
Recommendations

Key Takeaways – Are Employees
Satisfied with the Wellness programs
offered here?
Likes:
• Accessibility of fitness and
wellness programs
• Convenience of programs
• Fitness and Health Centers
• Updated, maintained and clean
facilities
• Blue Cross spending accounts
provide flexibility
• Health screening
• Ergonomic assessments
• Access to onsite Wellness
Coordinator
Dislikes:
• Work and home stressors
• Loss of on-campus counselor
• Workload
• After hour expectations
• Dental coverage – some employee
groups
• Lack of flexible work arrangements
• Lack of socialization opportunities
• Satellite campuses have limited
access to services offered on the
main campus, etc. Overview
Demographics
Wellness for U
Overall Health
Physical Activity and Nutrition
Worry or Stress
Workplace
Barriers
Recommendations

Overall Results and
Recommendations
Overview
Demographics
Wellness for U
Overall Health
Physical Activity and Nutrition
Worry or Stress
Workplace
Barriers
Recommendations

Plan of Action
Wellness for U • Continue to provide lunch and learns;
– Provide alternate locations for lunch and learns (upper and
lower campus)
– Investigate videotaping lunch and learns for availability on
website
– Develop annual wellness lunch and learn programming
based on preferences and chronic health issues (Overall
Health)
• Provide info on preferred fitness scheduling times to
Fitness Centre
• Develop Communication plan re: Wellness vision/ mission
– Living Well at the U of L
Overview
Demographics
Wellness for U
Overall Health
Physical Activity and Nutrition
Worry or Stress
Workplace
Barriers
Recommendations

Plan of Action
Overall Health • Promote ‘Health Check for U’ screening program –
diabetes, high blood pressure, high blood cholesterol – Arrange lifestyle/fitness assessment as part of Health Check for U –
partnership with Fitness Centre
– Offer monthly draw prizes to those employees who engage in wellness activity
that month (eg; free fitness pass or class, free massage, free session with
dietitian)
• Provide survey info to HR – for training sessions for
supervisors with regards to stress and
time management resources for employees
Overview
Demographics
Wellness for U
Overall Health
Physical Activity and Nutrition
Worry or Stress
Workplace
Barriers
Recommendations

Plan of Action
Physical Activity and Nutrition
• Work with walking champion to set up a
‘Wellness Walking group’
• Increase opportunity for availability of
healthy snacks (fruit and vegetables,
energy snack packs – fiber, protein,
carbohydrate) Overview
Demographics
Wellness for U
Overall Health
Physical Activity and Nutrition
Worry or Stress
Workplace
Barriers
Recommendations

Plan of Action
Worry and Stress
• Series of Workshops/Lunch and Learns
– Mental Health in the Workplace • October 18 – Lunch and Learn – Beyond Stigma – increasing our knowledge of
mental health in the workplace
• October 30 – Mindful Meditation
• November 7 – Life Balance Fair – • Stress Busters I – 10:00 AM;
• Stress Busters II 1:00 PM
• Mini-massage – 2:30 – 4:30
• Week of November 26 - Lunch and Learn – Recognizing and dealing with
Alzheimer’s and Dementia – At work and at home – Alzheimer’s Society
• December 5 – Lunch and learn - Building Resilience
• January 2013 - 2 hour workshop – Mental Illness in the Workplace for supervisors
and managers and anyone interested.
• February – Lunch and Learn – Sleep
Overview
Demographics
Wellness for U
Overall Health
Physical Activity and Nutrition
Worry or Stress
Workplace
Barriers
Recommendations

Plan of Action
Workplace
• Develop a “Living Well at U of L”
employee orientation package
– Include ‘Stretch and Strengthen’
program, ergonomics handout, Health
Check for U door-hanger, Health
Centre brochure
Overview
Demographics
Wellness for U
Overall Health
Physical Activity and Nutrition
Worry or Stress
Workplace
Barriers
Recommendations
Recommendations – What Wellness
Programs Offer to Employees
• Focus on employees’ three main health goals: physical activity,
nutrition and stress /time management/sleep.
• Physical activity-related offerings are the most popular wellness
programs, variety is important!
• Onsite exercise facilities are in high demand. Continue to invest
in office gyms
• Employees value preventive screenings, indicating a desire to
“know their numbers” and identify potential future health
problems. Continue to invest in biometric screenings and
preventive care options.
• Opportunities to engage with co-workers are cherished -
promote programs that are group-facilitated or team-based.
Overview
Demographics
Wellness for U
Overall Health
Physical Activity and Nutrition
Worry or Stress
Workplace
Barriers
Recommendations

Recommendations – How To Drive
Higher Employee Engagement
• Employees say they most want to improve their health, so
continue to use this as the main call to action when
marketing wellness programs to them.
• Focus on making wellness program communications
bolder and simpler, since many employees say they don’t
know what is offered.
• Employees frequently cite fitness tracking devices as a
popular program feature, so consider investing in these
tools as incentives for enrollment.
• Help employees to increase their motivation to engage
through the use of financial incentives, competitions, and
public recognition. Overview
Demographics
Wellness for U
Overall Health
Physical Activity and Nutrition
Worry or Stress
Workplace
Barriers
Recommendations

Recommendations – How To Help
Employees Reach Their Goals
• Lack of time is a major barrier to health improvement, so
promote exercise breaks and help employees to prioritize
healthy activities during the day.
• Find ways to build in more exercise opportunities at work,
such as organizing walking groups, designing walking
trails, and hosting sports tournaments.
• Try to offer as many programs as possible free-of-charge
and more employees will take advantage of the
programming.
• Find ways to add fun and excitement to the wellness
program through games, technology, competitions, prizes,
edgier marketing, and humor.
• To find out more go to:
http://www.uleth.ca/hr/wellness/
Overview
Demographics
Wellness for U
Overall Health
Physical Activity and Nutrition
Worry or Stress
Workplace
Barriers
Recommendations

• Thank you to those who responded to the
1st Employee Health and Wellness
Survey
• You were heard!!