Empirical vulnerability assessment and damage for ...
10
Empirical vulnerability assessment and damage for description natural hazards following the principles of modern macroseismic scales J. Schwarz, H. Maiwald Earthquake Damage Analysis Center, Bauhaus University Weimar, EDAC, Marienstrasse 13, 99421 Weimar, Germany, contact: [email protected], http://www.edac.biz SUMMARY: Empirical vulnerability assessment is connected with the outcome of macroseismic studies and the development of intensity scales. The EMS-98 - as its recent state, including new types of buildings, especially those including earthquake-resistant design features - provides the basic principles, which can be used as the model for other natural hazard phenomena. Maintaining the basic elements, the earthquake-originated concept is adapted to the particularities of flood, tsunami and storm impact. Within a step-by step procedure the transformation of recently elaborated databases into the vulnerability table of buildings types is explained and extended to the elaboration of hazard-specific damage or vulnerability functions. The developed tools are applied to the revaluation of the 2010 Dichato (Chile) tsunami generated damage. Finally, a concept for a multi-hazard vulnerability assessment is presented, where the building stock of test areas is classified with respect to the typical earthquake, flood and storm vulnerability classes. Keywords: natural hazards, multi-hazard approach, damage grades, vulnerability classes and functions. 1. INTRODUCTION Empirical vulnerability assessment is connected with the outcome of macroseismic studies and the development of intensity scales. The concept of intensity itself has been adopted and modified through the course of the last century. The EMS-98 - as its recent state - is one of a family of intensity scales. The European Macroseismic Scale incorporates a compromise, in which a simple differentiation of the resistance of buildings to earthquake generated shaking (vulnerability) has been employed in order to give the demanded robust way of distinguishing the behavior in which buildings respond to earthquake shaking. The Vulnerability Table is an attempt to categorize (in a manageable and simple way) the strength of structures, taking both building type or structural system and other (vulnerability affecting) factors (quality of workmanship, state of disrepair, irregularities of shape, layout, design “defects”) into account. This is one of the main developments from previous scales, which defined building classes solely by the type of construction (as an analogue of vulnerability). With the EMS, it has been decided to move to classes directly representing vulnerability. Six classes of decreasing vulnerability (A to F) are proposed. The first three classes should be compatible with previous commonly used building categories, representing the strength (or vulnerability) of a adobe (earth brick) house (vulnerability class VC A), brick masonry building (VC B) and reinforced concrete (RC) type structures (here: RC without earthquake-resistant design ERD). In assessing the vulnerability of an ordinary structure in the field, the first step is to assess the building type. This provides the basic (“most likely”) vulnerability class. In previous scales, it was neglected that the different types of buildings respond and fail in different ways; this fact becomes visible by the different types of damage patterns or failure mechanisms. This has been addressed in both EMS versions by giving separate, illustrated accounts of damage to both masonry (see Table 2.1) and R.C. structures.
Transcript of Empirical vulnerability assessment and damage for ...
Empirical vulnerability assessment and damage for
description
natural hazards following the principles of modern
macroseismic scales
J. Schwarz, H. Maiwald Earthquake Damage Analysis Center, Bauhaus University Weimar, EDAC, Marienstrasse 13,
99421 Weimar, Germany, contact: [email protected], http://www.edac.biz
SUMMARY:
Empirical vulnerability assessment is connected with the outcome of macroseismic studies and the development
of intensity scales. The EMS-98 - as its recent state, including new types of buildings, especially those including
earthquake-resistant design features - provides the basic principles, which can be used as the model for other
natural hazard phenomena. Maintaining the basic elements, the earthquake-originated concept is adapted to the
particularities of flood, tsunami and storm impact. Within a step-by step procedure the transformation of recently
elaborated databases into the vulnerability table of buildings types is explained and extended to the elaboration
of hazard-specific damage or vulnerability functions. The developed tools are applied to the revaluation of the
2010 Dichato (Chile) tsunami generated damage. Finally, a concept for a multi-hazard vulnerability assessment
is presented, where the building stock of test areas is classified with respect to the typical earthquake, flood and
storm vulnerability classes.
Keywords: natural hazards, multi-hazard approach, damage grades, vulnerability classes and functions.
1. INTRODUCTION
Empirical vulnerability assessment is connected with the outcome of macroseismic studies and the
development of intensity scales. The concept of intensity itself has been adopted and modified through
the course of the last century. The EMS-98 - as its recent state - is one of a family of intensity scales.
The European Macroseismic Scale incorporates a compromise, in which a simple differentiation of the
resistance of buildings to earthquake generated shaking (vulnerability) has been employed in order to
give the demanded robust way of distinguishing the behavior in which buildings respond to earthquake
shaking.
The Vulnerability Table is an attempt to categorize (in a manageable and simple way) the strength of
structures, taking both building type or structural system and other (vulnerability affecting) factors
(quality of workmanship, state of disrepair, irregularities of shape, layout, design “defects”) into
account. This is one of the main developments from previous scales, which defined building classes
solely by the type of construction (as an analogue of vulnerability). With the EMS, it has been decided
to move to classes directly representing vulnerability. Six classes of decreasing vulnerability (A to F)
are proposed. The first three classes should be compatible with previous commonly used building
categories, representing the strength (or vulnerability) of a adobe (earth brick) house (vulnerability
class VC A), brick masonry building (VC B) and reinforced concrete (RC) type structures (here: RC
without earthquake-resistant design ERD). In assessing the vulnerability of an ordinary structure in the
field, the first step is to assess the building type. This provides the basic (“most likely”) vulnerability
class.
In previous scales, it was neglected that the different types of buildings respond and fail in different
ways; this fact becomes visible by the different types of damage patterns or failure mechanisms. This
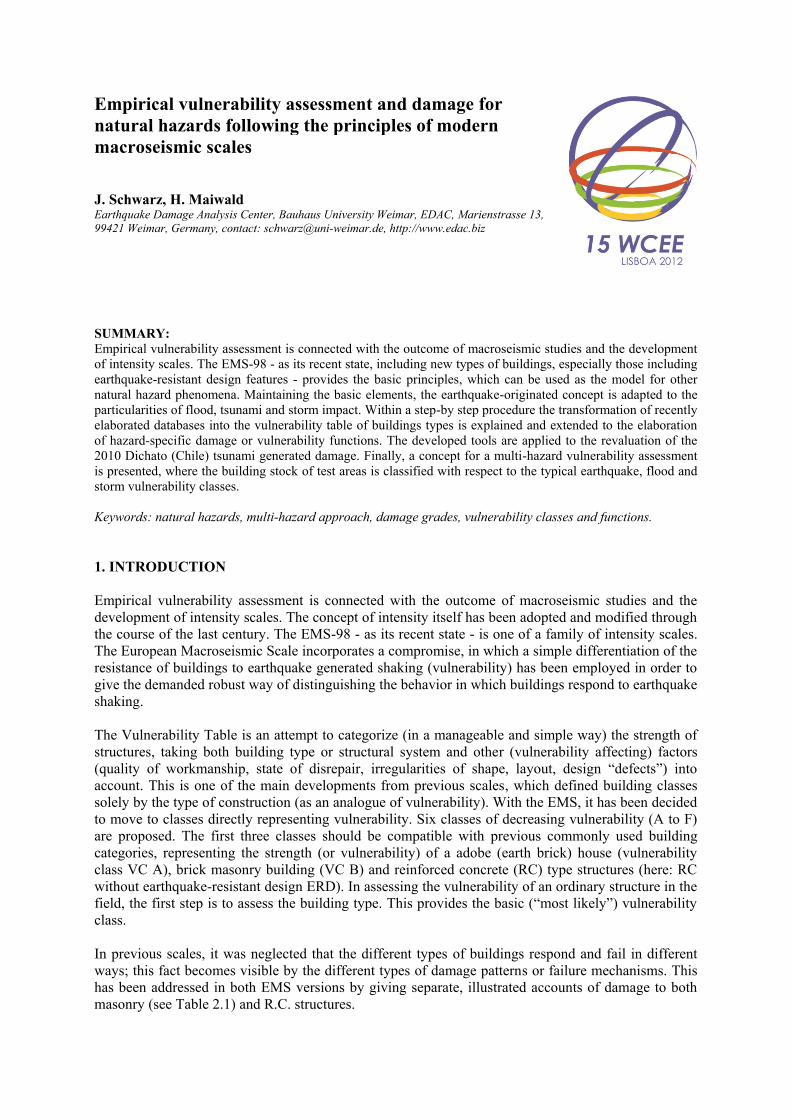
has been addressed in both EMS versions by giving separate, illustrated accounts of damage to both
masonry (see Table 2.1) and R.C. structures.
2. DEFINITION OF DAMAGE GRADES
2.1. Earthquake (EMS-98)
It is a major advance of modern scales that both a qualitative and quantitative approach to damage is
introduced. The qualitative aspect deals with the type of building and its vulnerability, while the
quantitative aspect deals with the probabi1ity of different grades of damage occurring at a certain
intensity level.
Different representations of damage are in use and have to be distinguished carefully. For the same
database, different forms of elaboration lead to different graphical formats and curves. They are
known as damage, vulnerability or fragility functions, indicating the frequency distribution of the
individual damage grades (including no damage) as a percentage related to the unity of all buildings of
one class (Schwarz, 2011). The damage grades should ideally represent a linear increase in the
strength of shaking (cf. Table 2.1). They do this only approximately, and are influenced by the need to
provide descriptions, which can be readily distinguished by the (often non-experienced) operator.
Table 2.1: Definition of damage grades Di in EMS-98 for masonry buildings and assignment to damage cases
from the Albstadt-Earthquake 1978 in Germany [Schwarz et. al., 2010]
Di
Damage
Description Drawing Example Structural
Non-
structural
D1 no slight
Hair-line cracks in very
few walls. Fall of small
pieces of plaster only. Fall
of loose stones from upper
parts of buildings in very
few cases
D2 no to slight moderate
Cracks in many walls. Fall
of fairly large pieces of
plaster. Partial collapse of
chimneys.
D3 moderate heavy
Large and extensive cracks
in most walls. Roof tiles
detach. Chimneys fracture
at the roof line; failure of
individual non-structural
elements (partitions, gable
walls).
D4 heavy very heavy
Serious failure of walls;
partial structural failure of
roof and floors.
D5 very heavy (very
heavy)
Total or near total
collapse.
Not observed
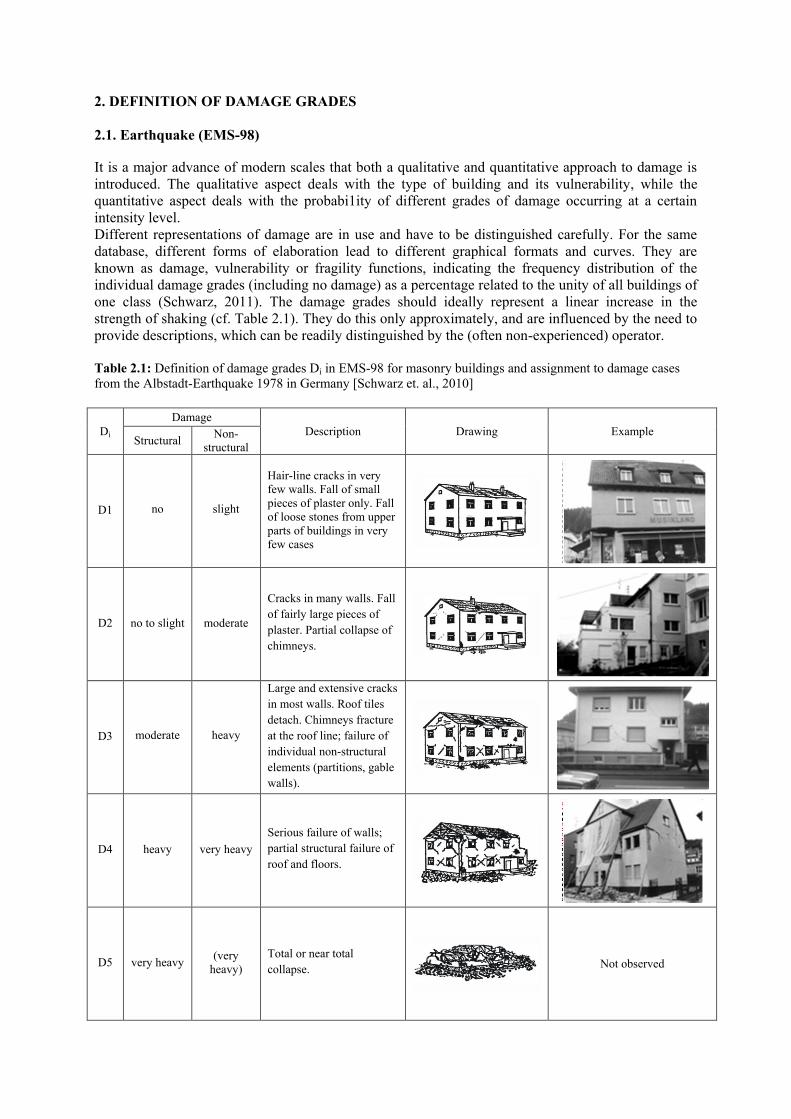
2.2. Flood
Repeatedly observed effects can be regarded as typical building response indicators for a comparable
level of damage, loss of integrity, stability etc. Table 2.2 provides the background for the necessary
generalization of any damage classification. By the definition of damage grades (Di), a unified
evaluation of all damage data and reports is guaranteed. Damage grades enable the logical link
between flood impact (with hazard describing inundation level) and loss in an innovative way. In all
cases a minimum damage grade D1 (without the occurrence of structural damage) has to be assigned
due to humidity penetration effects. The generalized damage definitions are related to the quality of
structural damage and non-structural damage as well as to the required extent of rehabilitation or other
repair measures (cf. Table 2.2).
Table 2.2: Definition of flood damage grades Di and assignment to damage cases from the flood 2002 in Saxony
(Schwarz & Maiwald, 2007)
Di
Damage
Description Drawing Example Structural
Non-
structural
D1 no slight only penetration and
pollution
D2 no to slight moderate
slight cracks in supporting
elements
impressed doors and
windows
contamination
replacement of extension
elements
D3 moderate heavy
major cracks and / or
deformations in supporting
walls and slabs
settlements
replacement of non
supporting elements
D4 heavy very heavy
structural collapse of
supporting walls, slabs
replacement of supporting
elements
D5 very heavy very heavy
collapse of the building or
of major parts of the
building
demolition of building
required
3. DEFINITION OF VULNERABILITY CLASSES AND VULNERABILITY FUNCTIONS
3.1. Basic procedure
During the last years, and as outcomes of practical requests, several research projects of the
Earthquake Damage Analysis Center (EDAC) have concentrated on the development of an
engineering evaluation system of buildings subjected to natural hazards and the elaboration of more
refined tools to link elements of hazard, action, vulnerability, damage and loss (Schwarz & Maiwald,
2007, Maiwald & Schwarz, 2009, Maiwald & Schwarz, 2011). The procedures and the processing
levels implemented in the model are structured transparently and can be used for different hazard
types (earthquake, storm, flood, tsunami etc.) in a modular way (Kaufmann & Schwarz, 2008).
Basics steps of the procedure are derived from analogous considerations to the empirical, intensity-
oriented method introduced for the earthquake damage and loss model on the basis of EMS-98
(Grünthal et al., 1998). Mainly focusing the consideration on structural damage due to flood impact,
characteristic vulnerability classes are determined for the different building types. The main
innovations and key elements can be summarized as follows:
Repeatedly observed damage patterns are transformed into a classification scheme of damage
grades enabling the interpretation of all damage cases in a systematic way. For supporting the
harmonized damage assignment, examples should be given; in the best way, drawings and/or
photos are complied illustrating the damage grades of typical building types (cf. Tables 2.1, 2.2).
The resistance of buildings is differentiated by a Vulnerability Table, which can be regarded as an
attempt to categorize the strength of structures, taking both building type or structural system and
other (vulnerability affecting) factors into account (cf. Table 3.1).
Characteristic vulnerability classes have to be determined for the different building types, where
most likely, still probable and also exceptional cases have to be considered. For the individual
vulnerability classes, characteristic grades of structural damages can be assigned in dependence
on the level of hazard impact. The use of “quantities” and the quantitative terms (like "few",
"many", "most") provides an important statistical element, which should enable the link to
vulnerability functions.
The empirical-statistical approach – in principle valid for all natural hazards – can be described by a
four-step procedure; which will be illustrated on the basis of an idealized correlation between damage
and impact level, subsequently:
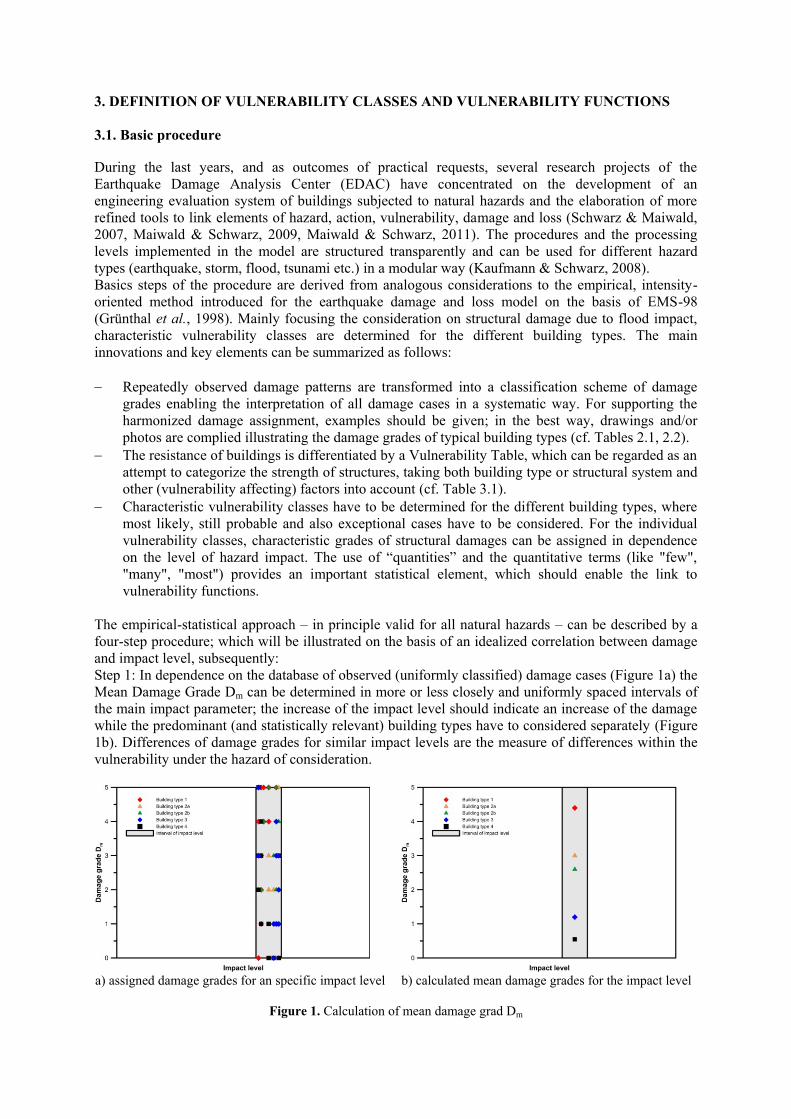
Step 1: In dependence on the database of observed (uniformly classified) damage cases (Figure 1a) the
Mean Damage Grade Dm can be determined in more or less closely and uniformly spaced intervals of
the main impact parameter; the increase of the impact level should indicate an increase of the damage
while the predominant (and statistically relevant) building types have to considered separately (Figure
1b). Differences of damage grades for similar impact levels are the measure of differences within the
vulnerability under the hazard of consideration.
a) assigned damage grades for an specific impact level b) calculated mean damage grades for the impact level
Figure 1. Calculation of mean damage grad Dm
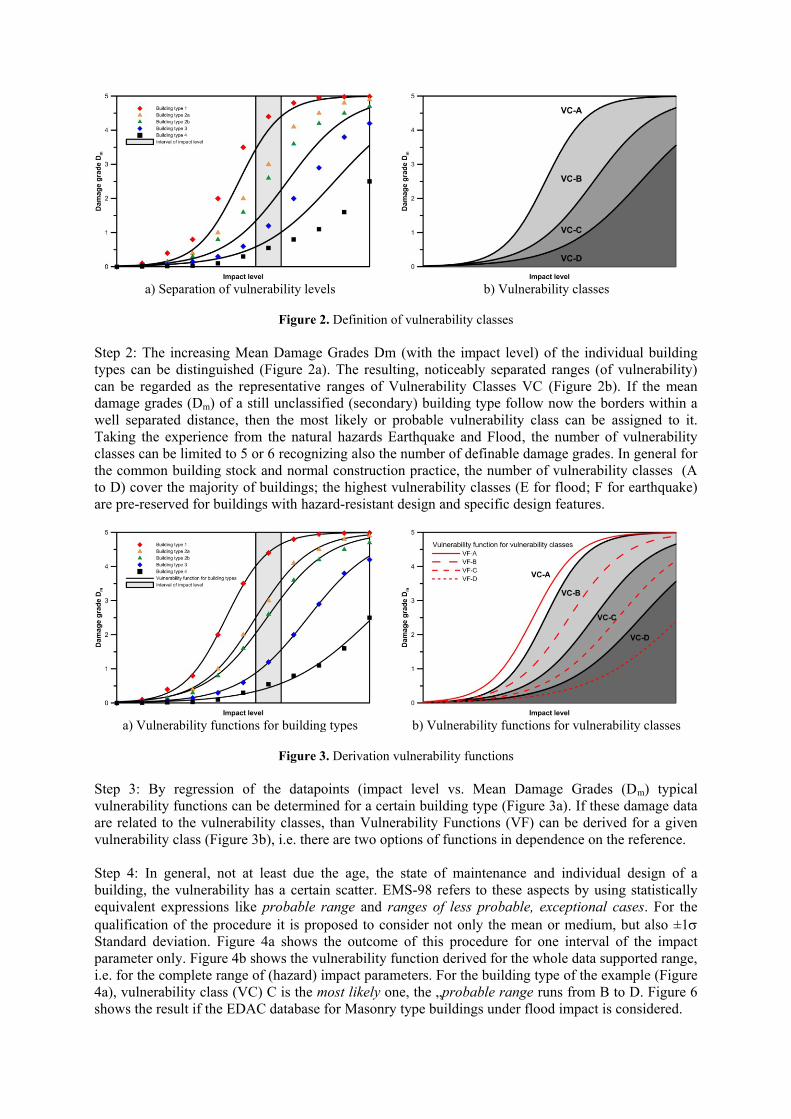
a) Separation of vulnerability levels b) Vulnerability classes
Figure 2. Definition of vulnerability classes
Step 2: The increasing Mean Damage Grades Dm (with the impact level) of the individual building
types can be distinguished (Figure 2a). The resulting, noticeably separated ranges (of vulnerability)
can be regarded as the representative ranges of Vulnerability Classes VC (Figure 2b). If the mean
damage grades (Dm) of a still unclassified (secondary) building type follow now the borders within a
well separated distance, then the most likely or probable vulnerability class can be assigned to it.
Taking the experience from the natural hazards Earthquake and Flood, the number of vulnerability
classes can be limited to 5 or 6 recognizing also the number of definable damage grades. In general for
the common building stock and normal construction practice, the number of vulnerability classes (A
to D) cover the majority of buildings; the highest vulnerability classes (E for flood; F for earthquake)
are pre-reserved for buildings with hazard-resistant design and specific design features.
a) Vulnerability functions for building types b) Vulnerability functions for vulnerability classes
Figure 3. Derivation vulnerability functions
Step 3: By regression of the datapoints (impact level vs. Mean Damage Grades (Dm) typical
vulnerability functions can be determined for a certain building type (Figure 3a). If these damage data
are related to the vulnerability classes, than Vulnerability Functions (VF) can be derived for a given
vulnerability class (Figure 3b), i.e. there are two options of functions in dependence on the reference.
Step 4: In general, not at least due the age, the state of maintenance and individual design of a
building, the vulnerability has a certain scatter. EMS-98 refers to these aspects by using statistically
equivalent expressions like probable range and ranges of less probable, exceptional cases. For the
qualification of the procedure it is proposed to consider not only the mean or medium, but also ±1
Standard deviation. Figure 4a shows the outcome of this procedure for one interval of the impact
parameter only. Figure 4b shows the vulnerability function derived for the whole data supported range,
i.e. for the complete range of (hazard) impact parameters. For the building type of the example (Figure
4a), vulnerability class (VC) C is the most likely one, the „probable range runs from B to D. Figure 6
shows the result if the EDAC database for Masonry type buildings under flood impact is considered.

a) Standard Deviation in for an specific impact level b) Standard Deviation of a vulnerability function
(definition of the probable range)
Figure 4. Classification of probable range for vulnerability classes
3.2. Application for flood
As a whole, five Flood Vulnerability Classes (here: HW-A to HW-E) are distinguished by definition
covering the range from low flood resistance/higher vulnerability (A - very sensitive; B - sensitive), to
normal (C) and increased flood resistance (D). The first engineering experience based proposal is
published in Schwarz & Maiwald (2007) and Schwarz & Maiwald (2008). A revised classification
scheme based on the mathematical approach is given in Table 3.1.
Table 3.1: Revised classification of building types in vulnerability classes and identification of ranges of scatter
(cf. Schwarz & Maiwald, 2007, Schwarz & Maiwald, 2008)
Classification of building type Flood vulnerability class HW-VC
Main building type short A B C D E
Clay C
Prefabricated PF
Framework FW
Masonry MW
Reinforced concrete RC
Flood resistant designed buildings FRD
The key elements of the procedure are replaced by simple symbols representing the outcome of the
observed effects and more or less classified database (see Figures 1 to 4):
Most likely vulnerability class
Probable range
Range of less probable, exceptional cases.
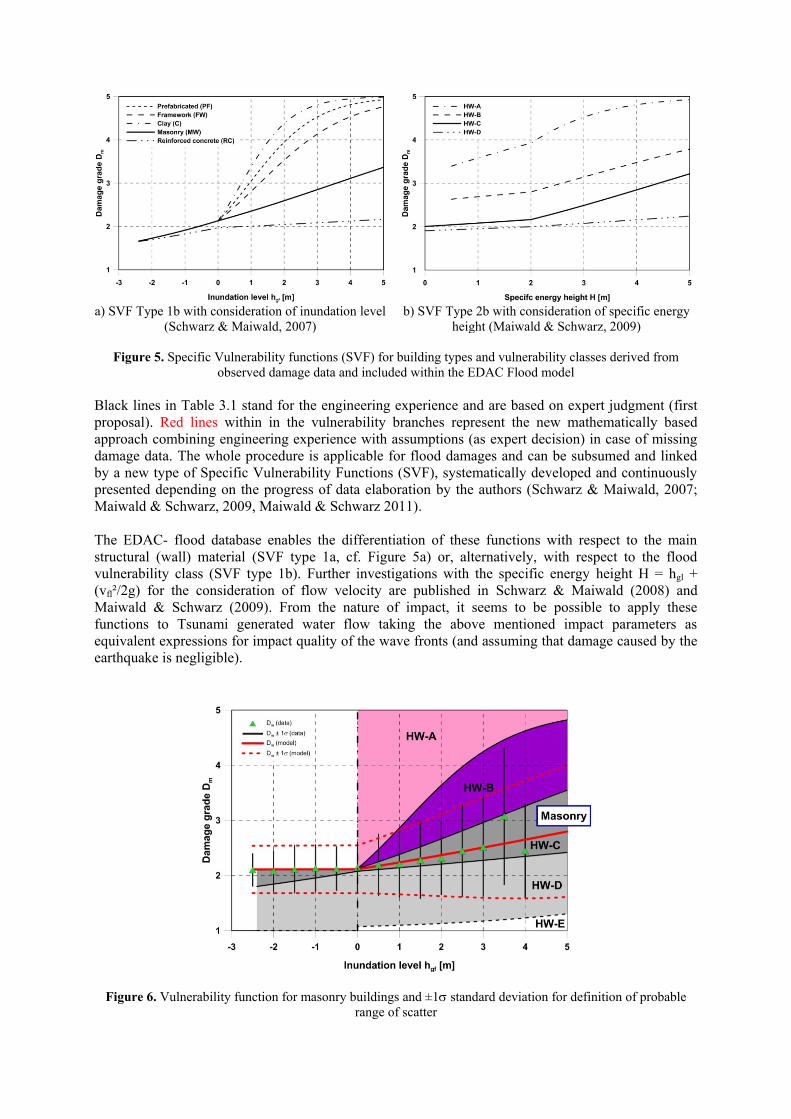
a) SVF Type 1b with consideration of inundation level
(Schwarz & Maiwald, 2007)
b) SVF Type 2b with consideration of specific energy
height (Maiwald & Schwarz, 2009)
Figure 5. Specific Vulnerability functions (SVF) for building types and vulnerability classes derived from
observed damage data and included within the EDAC Flood model
Black lines in Table 3.1 stand for the engineering experience and are based on expert judgment (first
proposal). Red lines within in the vulnerability branches represent the new mathematically based
approach combining engineering experience with assumptions (as expert decision) in case of missing
damage data. The whole procedure is applicable for flood damages and can be subsumed and linked
by a new type of Specific Vulnerability Functions (SVF), systematically developed and continuously
presented depending on the progress of data elaboration by the authors (Schwarz & Maiwald, 2007;
Maiwald & Schwarz, 2009, Maiwald & Schwarz 2011).
The EDAC- flood database enables the differentiation of these functions with respect to the main
structural (wall) material (SVF type 1a, cf. Figure 5a) or, alternatively, with respect to the flood
vulnerability class (SVF type 1b). Further investigations with the specific energy height H = hgl +
(vfl²/2g) for the consideration of flow velocity are published in Schwarz & Maiwald (2008) and
Maiwald & Schwarz (2009). From the nature of impact, it seems to be possible to apply these
functions to Tsunami generated water flow taking the above mentioned impact parameters as
equivalent expressions for impact quality of the wave fronts (and assuming that damage caused by the
earthquake is negligible).
Figure 6. Vulnerability function for masonry buildings and ±1 standard deviation for definition of probable
range of scatter
4. APPLICATION TO TSUNAMI IMPACT
The Maule (Chile) February 27, 2010 Earthquake is regarded as one of the strongest earthquakes ever
recorded worldwide. The seismic event triggered a tsunami, which caused serious damage by several
wave fronts along the coastal border. Event-specific characteristics from the overlay of the effects
from earthquakes and following flood wave (Tsunami) were examined in the context of a
reconnaissance mission of the engineering group of the German Task Force in different locations (cf.
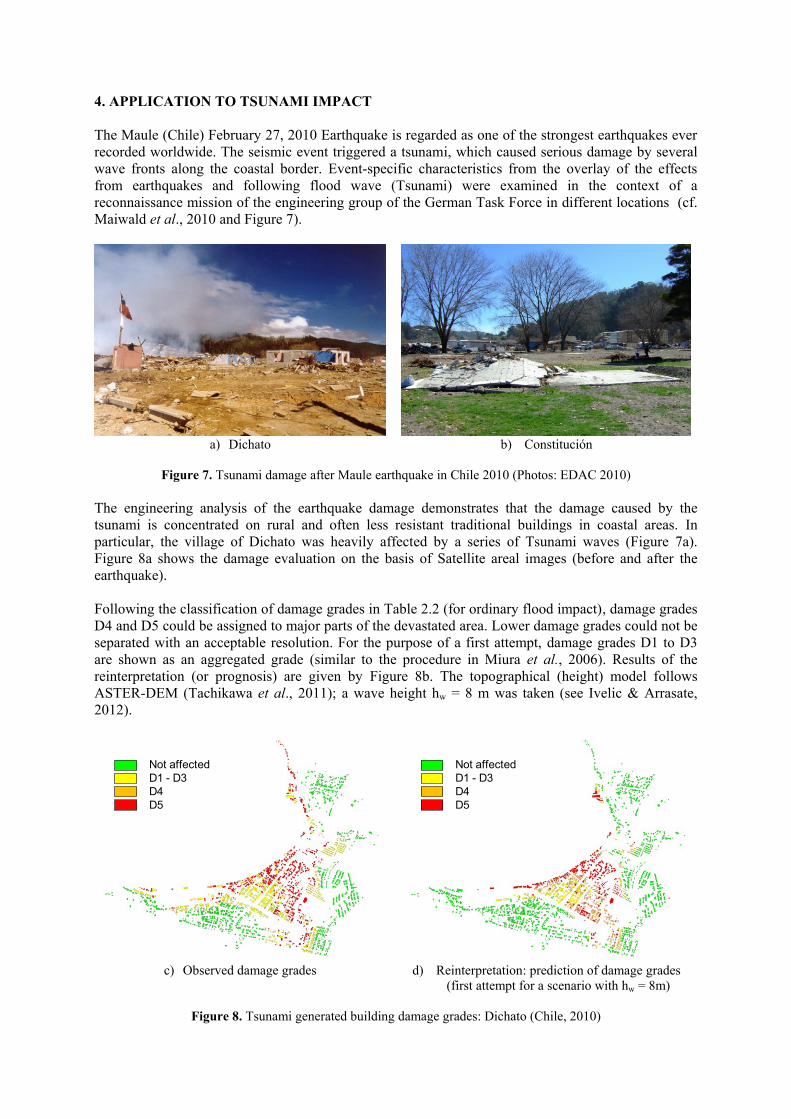
Maiwald et al., 2010 and Figure 7).
a) Dichato b) Constitución
Figure 7. Tsunami damage after Maule earthquake in Chile 2010 (Photos: EDAC 2010)
The engineering analysis of the earthquake damage demonstrates that the damage caused by the
tsunami is concentrated on rural and often less resistant traditional buildings in coastal areas. In
particular, the village of Dichato was heavily affected by a series of Tsunami waves (Figure 7a).
Figure 8a shows the damage evaluation on the basis of Satellite areal images (before and after the
earthquake).
Following the classification of damage grades in Table 2.2 (for ordinary flood impact), damage grades
D4 and D5 could be assigned to major parts of the devastated area. Lower damage grades could not be
separated with an acceptable resolution. For the purpose of a first attempt, damage grades D1 to D3
are shown as an aggregated grade (similar to the procedure in Miura et al., 2006). Results of the
reinterpretation (or prognosis) are given by Figure 8b. The topographical (height) model follows
ASTER-DEM (Tachikawa et al., 2011); a wave height hw = 8 m was taken (see Ivelic & Arrasate,
2012).
Not affected
D1 - D3
D4
D5
Not affected
D1 - D3
D4
D5
c) Observed damage grades d) Reinterpretation: prediction of damage grades
(first attempt for a scenario with hw = 8m)
Figure 8. Tsunami generated building damage grades: Dichato (Chile, 2010)
The impact level (height) and a reliable vulnerability class are determined for each of the identifiable
buildings. The flow velocity was estimated using the formulae by Yeh (2006). With all this
information of input parameters, the damage grades could be predicted by using and extrapolating the
vulnerability functions given by Figure 5b. The reinterpretation matches the observed damage with
surprisingly good quality, taking in mind that the accuracy (resolution) of topographical model is
limited, and that the effect of debris and the sequence of generated waves are not considered at this
phase.
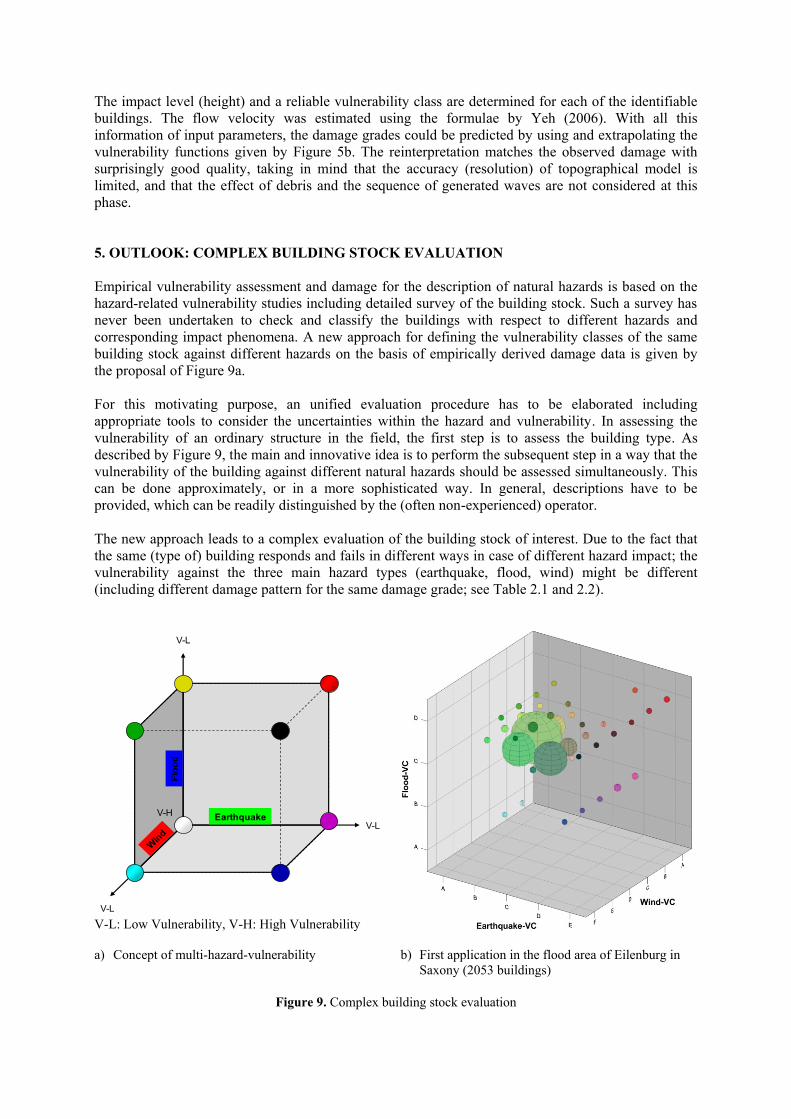
5. OUTLOOK: COMPLEX BUILDING STOCK EVALUATION
Empirical vulnerability assessment and damage for the description of natural hazards is based on the
hazard-related vulnerability studies including detailed survey of the building stock. Such a survey has
never been undertaken to check and classify the buildings with respect to different hazards and
corresponding impact phenomena. A new approach for defining the vulnerability classes of the same
building stock against different hazards on the basis of empirically derived damage data is given by
the proposal of Figure 9a.
For this motivating purpose, an unified evaluation procedure has to be elaborated including
appropriate tools to consider the uncertainties within the hazard and vulnerability. In assessing the
vulnerability of an ordinary structure in the field, the first step is to assess the building type. As
described by Figure 9, the main and innovative idea is to perform the subsequent step in a way that the
vulnerability of the building against different natural hazards should be assessed simultaneously. This
can be done approximately, or in a more sophisticated way. In general, descriptions have to be
provided, which can be readily distinguished by the (often non-experienced) operator.
The new approach leads to a complex evaluation of the building stock of interest. Due to the fact that
the same (type of) building responds and fails in different ways in case of different hazard impact; the
vulnerability against the three main hazard types (earthquake, flood, wind) might be different
(including different damage pattern for the same damage grade; see Table 2.1 and 2.2).
V-L
V-L
V-L
V-HEarthquake
Flood
V-L: Low Vulnerability, V-H: High Vulnerability
a) Concept of multi-hazard-vulnerability b) First application in the flood area of Eilenburg in
Saxony (2053 buildings)
Figure 9. Complex building stock evaluation

Figure 9b compares for a real building stock (here: for the area of the town Eilenburg flooded by the
extreme 2002 Saxony event) the vulnerability against earthquake, flood and storm. The size of the
spheres represents the number of buildings belonging to the combined vulnerability classes. The
outcome of this basic study (for any multi-hazard or multi-risk approach, cf. Siddique & Schwarz,
2012) and for test site (of about 2000 buildings) lead to the conclusion that the majority of buildings
belongs to a few number of complex vulnerability classes.
REFERENCES
Earthquake Damage Analysis Center (2011). EDAC-Flood Damage Model (prepared by Maiwald, H. and
Schwarz, J). http://www.edac.biz/research/floods/ edac_hochwasserschadensmodell.html
Grünthal, G. (ed.), Musson, R., Schwarz, J., Stucchi, M. (1998). European Macroseismic Scale 1998. Cahiers de
Centre Européen de Géodynamique et de Seismologie, Volume 15, Luxembourg
Ivelic, P., Arrasate, M. I. (2012). The case of Chilean coastal cities reconstruction after the earthquake and
tsunami of February 27th, 2010. Special Joint G20 Publication by the Government of Mexico and the
World Bank. Ministry of Housing and Urban Development. Government of Chile.
Kaufmann, Ch., Schwarz, J. (2008). Modular System for Seismic Risk Analysis considering Uncertainties of
basic Input Parameters. 14th World Conference on Earthquake Engineering, 12-17 October 2008, Beijing,
China, Paper ID: S01-02-024,.
Maiwald, H. (2007). Ingenieurmäßige Ermittlung von Hochwasserschadenspotentialen im mikroskaligen
Maßstab. Dissertation, Department of Civil Engineering, Bauhaus-Universität Weimar
Maiwald, H., Schwarz, J. (2009). Berücksichtigung der Fließgeschwindigkeit bei Hochwasser-
Schadensmodellen, Bautechnik 86:9, 550 - 565.
Maiwald, H., Schwarz, J. (2011). Ermittlung von Hochwasserschäden unter Berücksichtigung der
Bauwerksverletzbarkeit. EDAC-Hochwasserschadensmodell. scientific technical reports 01-11, Zentrum
für die Ingenieuranalyse von Erdbebenschäden, Universitätsverlag, Bauhaus-Universität Weimar, 2011.
Maiwald, H.; Schwarz, J.; Abrahamczyk, L.; Lobos, D. (2010): Das Magnitude 8.8 Maule (Chile)-Erdbeben vom
27. Februar 2010 – Ingenieuranalyse der Tsunamischäden. Bautechnik 87:10, 614–622
Miura, H., Wijeyewickrema, A.; Inoue, S. (2006). Evaluation of tsunami damage in the eastern part of Sri Lanka
due to the 2004 Sumatra earthquake using remote sensing technique, 8th U.S. National Conference on
Earthquake Engineering, Paper No.856.
Schwarz, J. (2011). Empirical vulnerability assessment - a review of contributions to the damage description for
the European Macroseismic Scale, Proceedings Workshop: Earthquake Engineering and Engineering
Seismology: Past Achievements and Future Prospects, Honoring Polat Gülkan, Ankara , October 2011.
Schwarz, J., Maiwald, H. (2007). Berücksichtigung struktureller Schäden unter Hochwassereinwirkung,
Bautechnik 84:7, 450 – 46.
Schwarz, J., Maiwald, H. (2008). Damage and loss prediction model based on the vulnerability of building types.
Proceedings 4th International Symposium on Flood Defence, 6 – 8 May 2008, Toronto, Canada.
Schwarz, J., Beinersdorf, S., Langhammer, T., Leipold, M., Kaufmann, Ch. (2010). Vulnerability functions for
masonry structures derived from recent earthquakes in Germany. 14th European Conference on Earthquake
Engineering, August 30 - September 03, 2010, Ohrid, Macedonia. (Paper ID: 606)
Siddique, M.S., Schwarz, J. (2012). Multi-hazard approach to assess vulnerability of the building stock in
Pakistan. 15th World Conference on Earthquake Engineering, September 2012, Lisboa.
Tachikawa, T., Kaku, M., Iwasaki, A., Gesch, D., Oimoen, M., Zhang, Z., Danielson, J., Krieger, T., Curtis, B.,
Haase, J., Abrams, M., Crippen, R., Carabajal, C. (2011). ASTER Global Digital Elevation Model Version
2 - https://igskmncnwb001.cr.usgs.gov/aster/GDEM/Summary_GDEM2_validation_report_final.pdf
Yeh, H. H. (2006). Maximum Fluid Forces in the Tsunami Runup Zone. Journal of Waterway, Port, Coastal and
Ocean Engineering 132:6, 496-500.