Empirical Study: Failure of Glass-to-Metal Seals During ...
78
Clemson University TigerPrints All eses eses 12-2011 Empirical Study: Failure of Glass-to-Metal Seals During Shock Loading William Horton Clemson University, [email protected] Follow this and additional works at: hps://tigerprints.clemson.edu/all_theses Part of the Materials Science and Engineering Commons is esis is brought to you for free and open access by the eses at TigerPrints. It has been accepted for inclusion in All eses by an authorized administrator of TigerPrints. For more information, please contact [email protected]. Recommended Citation Horton, William, "Empirical Study: Failure of Glass-to-Metal Seals During Shock Loading" (2011). All eses. 1246. hps://tigerprints.clemson.edu/all_theses/1246
Transcript of Empirical Study: Failure of Glass-to-Metal Seals During ...
Clemson UniversityTigerPrints
All Theses Theses
12-2011
Empirical Study: Failure of Glass-to-Metal SealsDuring Shock LoadingWilliam HortonClemson University, [email protected]
Follow this and additional works at: https://tigerprints.clemson.edu/all_theses
Part of the Materials Science and Engineering Commons
This Thesis is brought to you for free and open access by the Theses at TigerPrints. It has been accepted for inclusion in All Theses by an authorizedadministrator of TigerPrints. For more information, please contact [email protected].
Recommended CitationHorton, William, "Empirical Study: Failure of Glass-to-Metal Seals During Shock Loading" (2011). All Theses. 1246.https://tigerprints.clemson.edu/all_theses/1246
EMPIRICAL STUDY: FAILURE OF GLASS-TO-METAL SEALS DURING SHOCK LOADING
A Thesis Presented to
the Graduate School of Clemson University
In Partial Fulfillment For the requirements of the Degree
Masters of ScienceMaterials Science and Engineering
With a Specialization in Metals and Ceramics
Prepared ByW. Nathaniel Horton
December, 2011
Accepted ByCommittee Chair: Dr. Eric C. Skaar, P.E.
Dr. John P. SandersDr. Theodore D. Taylor
ABSTRACT
! The goal of this thesis was to determine the empirical failure mechanisms and
sequence of cartridge actuated devices (CADs) experiencing failure of the glass-
to-metal (G/M) seal. Impact loading was conducted with a drop weight machine
at room temperature and 300°F, and then empirically analyzed with high speed
video. Resulting peak overload force, shear stress, and impulse were all
calculated. The room temperature samples were found to absorb twice the
impulse upon failure as the elevated temperature G/M seals. Closed-form and
three-dimensional finite element analysis was used to determine the stress state
and deformation upon loading. Furthermore, high speed data was collected for
shock load detonation events to document the failure sequence of a G/M seal
under such loading. The shock overload event was found to last 0.82 µsec and
propel an electrical feed-through-pin at a terminal velocity of 955 m/s. The core of
a multiple pin G/M seal design was found to experience large accumulations of
principal stress and deformation during pressure loading of the interior face. High
speed video data discovered the G/M seal failed along the glass-to-pin interface
during shock overload failure. Overall, this thesis provided definition of failure
sequence and highlighted problematic structural areas, as well as design
weaknesses for construction of G/M seals.
ii
ACKNOWLEDGEMENTS
! It has been a great privilege to have Dr. Eric Skaar as my thesis adviser
and committee chairman. He is truly a pleasure to work for, and I benefitted
greatly from his expertise, support, and patience. Dr. Skaar provided the overall
guidance throughout the past few years, to help this dream become a reality,
through his confidence, motivation, and support. We have truly shared some fond
moments in philosophical debate over the nature of the universe. I am deeply
indebted to Glen Stichling of CAD Inc. for the coordination of their laboratory
facilities and for his excellent guidance, particularly during the finial stages of this
work. His rigorous approach to problem solving is demanding but enlightening.
Thanks to Paul Delgrego of Del Imaging Systems for his expertise, help, and
suggestions achieving the high speed photography.
! On the personal side, my deepest and warmest thanks go to my parents
David and Peggy Horton for their unfailing support, encouragement, and love.
Additionally, my fiancée Kristen Wallis, more than she can realize, she has taught
me much about life and made life worth living. It is her support that made the
finial stages of this work bearable. To her I dedicate this thesis. The friendship
that Charles Hudson and I have developed over the past few years is proof that
misery loves company. I hope that I can someday assist him as much as he has
helped me. And thanks to my dear friends Tony Martin and Gary Street, who are
a constant source of inspiration. Their unending energy, faith, and belief in the
future are contagious. Finally, thank you to Daniel Williams for always
encouraging me to have the faith in myself to take risks and strive for the best.
And most importantly, I thank the Lord for establishing the principles upon which I
strive to live my life.
iii
CONTENTS
Title Page ........................................................................................................................!i Abstract .........................................................................................................................!ii Acknowledgements .....................................................................................................!iii Contents .......................................................................................................................!iv List of Figures ...............................................................................................................!vList of Tables ................................................................................................................!viNomenclature ..............................................................................................................!vii
.......................................................................................................Executive Summary! 1...........................................................................................................Section 1.1 Introduction 1
....................................................................Section 1.2 Overall Project Goal and Objectives 3................................................................................................................Section 1.3 Methods 4
.........................................................................................Section 1.4 Embodiment of Design 5..................................................................................................................Section 1.5 Results 8
........................................................................................Section 1.6 Structure of This Thesis 8..........................................................................................................Literature Survey! 10
.......................................................................................Section 2.1 Overview/Organization 10....................................................................Section 2.2 Mechanical Structure of G/M Seals 11...................................................................Section 2.3 Modeling Deformation of Interfaces 13
...............................................................................................Section 2.4 Interface Diffusion 17.............................................................................................Section 2.5 Shock Deformation 18
.........................................................................................Section 2.6 Concluding Thoughts 21........................................................................................Mechanical Impact Loading! 22
.........................................................................................................Section 3.1 Introduction 22.................................................................................................Section 3.2 G/M Seal Design 22
...............................................................................Section 3.3 Identification of Test Method 26..............................................................................................................Section 3.4 Findings 31
.........................................................................................Section 3.5 Concluding Thoughts 35...............................................................................................Finite Element Analysis! 36.........................................................................................................Section 4.1 Introduction 36
.........................................................................................Section 4.2 Closed form Solutions 36.....................................................................................Section 4.3 Computational Solutions 40
.........................................................................................Section 4.4 Concluding Thoughts 46.............................................................................................................Shock Loading! 47
.........................................................................................................Section 5.1 Introduction 47........................................................................................Section 5.2 Nonlinear Shock Wave 48
...............................................................................Section 5.3 Identification of Test Method 49..............................................................................................................Section 5.4 Findings 56
.........................................................................................Section 5.5 Concluding Thoughts 60..................................................................................................................Conclusions! 62.................................................................................................................Bibliography! 65
.............................................................Appendix A. Impact Test Machine Drawings! 68
iv
LIST OF FIGURES
Figure 1. Dimensions and Materials of G/M Seal Initiator...............................................!5Figure 2. CAD Assembly and Sequence of Failure.........................................................!7Figure 3. Mechanical Analogy of An Interface...............................................................!14Figure 4. Stress States in G/M Seals...........................................................................! 23Figure 5. Example Tensile Stresses in G/M Seal.........................................................! 24Figure 6. Meniscus Wetting Conditions........................................................................!25Figure 7. Loading of G/M Seal for Push-Out Test.........................................................!26Figure 8. Load Curve for Impact at RT and 300°F........................................................!28Figure 9. Impact High Speed Photo-Time Stamp 0.392194 s......................................!29Figure 10. Impact High Speed Photo-Time Stamp 0.396051 s....................................!30Figure 11. Impact High Speed Photo-Time Stamp 0.398622 s....................................!30Figure 12. Impact High Speed Photo-Time Stamp 0.428480 s....................................!31Figure 13. Glass Geometry Ratio.................................................................................! 38Figure 14. Maximum Residual Principal Stress............................................................! 39Figure 15. Multiple Pins in Single Glass Bead Design..................................................!40Figure 16. Axisymmetric Mesh of G/M Seal Used for FEA...........................................!41Figure 17. Von-Mises Deformation-Interior Face..........................................................!42Figure 18. Von-Mises Deformation-Axial Face.............................................................! 43Figure 19. Maximum Principal Stress-Exterior Face....................................................! 44Figure 20. Maximum Principal Stress-Interior Face and Axial Face.............................! 45Figure 21. Maximum Principal Stress-Interior Face......................................................!45Figure 22. Typical CAD Assembly.................................................................................!49Figure 23. CAD and Isolation Cap................................................................................!50Figure 24. Detonation Test Chamber............................................................................! 51Figure 25. Shock Load High Speed Photo-Time Stamp 0.000162 s............................! 52Figure 26. Shock Load High Speed Photo-Time Stamp 0.000187 s............................! 52Figure 27. Shock Load High Speed Photo-Time Stamp 0.000212 s............................! 52Figure 28. Shock Load High Speed Photo-Time Stamp 0.000237 s............................! 53Figure 29. Shock Load High Speed Photo-Time Pin Failure........................................! 53Figure 30. Close Bomb Test Configuration...................................................................! 54Figure 31. Typical Pressure Trace of CAD Detonation.................................................!55
v
LIST OF TABLES
Table 1. Thermal and Mechanical Properties..................................................................!4Table 2. Load and Stress for Impact Test......................................................................!27Table 3. Pin Displacement, Velocity, and Acceleration..................................................!53Table 4. Closed-Bomb Pressure Data...........................................................................!55Table 5. Average CAD Closed-Bomb Data...................................................................!56
vi
NOMENCLATURE
Symbol Explanationα Effective coefficient of expansion (20°C to 445°C)K Thermal Conductivity
Cp Heat Capacityρ DensityE Modulus of Elasticity
ET/E Ratio of Plastic Modulus to Elastic Modulusν Poisson’s Ratioσy Yield Strength of Ductile Metal σT Uniaxial Tensile Stress LimitσC Uniaxial Compressive Stress Limit
Abbreviation ExplanationG/M Glass-to-MetalFEA Finite element analysisCAD Cartridge Actuated Device CMZ Cohesive Zone ModelCTE Coefficient of Thermal ExpansionRT Room Temperature
GGR Glass Geometry Ratiopsi pounds per square inch
vii
Chapter 1. EXECUTIVE
SUMMARY
SECTION 1.1 INTRODUCTION
! Cartridge Actuated Devices (CADs) are commodity items that function as a
system component. In operation, they release a precise explosive of propellant
energy to perform controlled work. They function in a variety of military system
applications, including aircrew escape, fire suppression, and stores/emergency
release systems. Even air bag approaches are CAD-driven based on the quick
response time and space/weight to force restrictions.
! CAD composition consist of pyrotechnic material, electrical bridge wire for
ignition, and an insulating feedthrough containment consisting of a Glass-to-
Metal Seal. Degradation of the G/M seal can cause the CAD to not be
hermetically sealed and malfunction or function improperly. About 3,100 different
configurations are now in use by all Military Services. Many of these
configurations are man-rated, mission essential, requiring a high degree of
reliability.[1] They are normally developed as a component of a weapon or life
support system. All have a defined shelf/service life and must be replaced
1
[1 ] Man Rated: Controls hazards with sufficient certainty to be considered safe for human operations, and provides, to the maximum extent practical, the capability to safely recover the crew from hazardous situations.
periodically. CADs that are needed for safety of flight or ship systems can cause
the grounding or dry-docking of the vessel if they are defective or past their
defined shelf life.!
! Glass-to-Metal (G/M) seals are a very important part of the packaging and
insulation of electrical and chemical components within the CAD. Specifically, for
military applications outside the traditional static design criteria, the G/M seal
must provide hermetic containment of very corrosive and reactive materials from
surrounding environments. Additionally, they must perform to a very tight
specification of electrical insulation properties to ensure detonation. The Navy
currently utilizes a comprehensive set of specifications and design criteria for
CADs, but fundamental knowledge of the behavior of G/M seals under these
conditions is lacking.
! Modern knowledge in the field of sealing technology provides ample results
for static loading; however, the area of high-strain shock-loading of G/M seals is
unstudied and unknown. For example, a prime DoD CAD manufacturer utilizes
empirical proof-testing results to certify designs of G/M seals, but has little
fundamental knowledge of seal behavior under shock-loading. Currently, this
proof-testing is limited to the redundant destruction of duplicate seals prior to
certifying a part for shipment. This is one potential area that adds to the total cost
of procurement incurred by the military. Understanding the fundamental
properties for military applications of G/M seals will reduce the statistical
requirement for samples necessary to ensure performance of mission critical
parts, thus contributing to the overall cost savings of military CAD manufacturing.
2
! Present and future designs have resulted in smaller volume allowances for
CAD devices. In the past, seals were simply over-designed with high safety
factors so failure was not a primary concern. However, volume restrictions push
the envelope and stretch design stress levels to the limit of empirical knowledge.
A recent example from a Naval supplier for a torpedo application directly required
a small volume seal that withstands a high order explosive, or shock-load driven
response, rather than pressure driven, and was required to maintain seal integrity
adjacent to shock loading. There was no existing data on shock load
performance of a G/M seal for this contractor to utilize other than past knowledge
of over-design conditions.
SECTION 1.2 OVERALL PROJECT GOAL AND OBJECTIVES
! Collective goals of the project include the documentation of impact and shock
loading failure events of G/M seals.[2 ] Subsequently, perform a root-cause
investigation, aided by Finite Element Analysis (FEA) to produce stress plots and
substantiate mechanical design. Finally, the culmination of this work is to produce
a compressive definition of the failure sequence of CAD units during G/M seal
overload events.
3
[2] Impact loading is a dynamic load resulting from the motion of energy waves below the acoustic range. Shock loading produces energy waves that potientially cause changes in microstructure and irreversibly alter material properties.

SECTION 1.3 METHODS
! The methods used to determine the weakness of G/M seal design include
mechanical dynamic impact, finite element analysis, and chemical or pyrotechnic
shock loading. FEA, static mechanics of material method, was used to model the
stress state of the G/M seal. G/M seals during production have large
accumulations of residual stresses. Literature was surveyed to use principal
closed form solutions for these values and incorporated into the initial model. The
stresses calculated for the interface pressures were applied to the assembled
model and radial and tangential stresses were solved. Meshes of the assembled
G/M seal were analyzed in SolidworksⓇ Simulation. The FEA models included
static stress with linear material responses and mechanical event simulation.
! Dynamic tests were accomplished by loading with a blunt pin on the face of
the glass seal. The pin was slightly undersized to the diameter of the glass to
isolate loading to the G/M interface. A high speed video recorder was positioned
perpendicular to the G/M seal axis to produce sequential frames during overload
failure.
! Chemical pressure response shock load tests were conducted in an isolated
detonation chamber capable of withstanding the explosive force upon ignition.
Again a high speed camera was positioned, behind a protective shield with a
view port, perpendicular to the G/M seal axis. Seals were pyrotechnically loaded
within a solid housing designed to insure that complete overload failure occurs at
the seal only.
4
SECTION 1.4 EMBODIMENT OF DESIGN
! Many different design configurations exist for both G/M seals and housing
designs, based on component geometry, materials, and CAD performance
requirements. The components and dimensions of the initiator under
consideration in this work are represented in Table 1 and Figure 1.
Symbol Alloy 52 1 9010 Glass 1 303 S.S. 1α (1/°C) 10.2 X 10⁻⁶ 10.2 X 10⁻⁶ 16.6 X 10 -6K (W/m-°C) 100.0 1.09 16.4Cp (W-sec/Kg) 0.385 0.8 0.46ρ (Kg/m 3) 8500 2200 8030E (MPa) 206.9 X 10³ 67.57 X 10³ 193.1 X 10³
ET/E --- --- 0.1ν 0.3 0.21 0.3σy (MPa) 344.7 --- 241.3σT (MPa) --- 34.5 ---σC (MPa) --- 275.8 ---
Table 1. Thermal and Mechanical Properties
Figure 1. Dimensions and Materials of G/M Seal Initiator
5

! The seal was selected based on its pervious empirical knowledge in this
application and observed limitations. Figure 2 shows how the initiator fits into a
CAD, and also a representation of the sequence of events during successful
detonation.[3] For the purpose of this thesis, failure occurs when the G/M seal
breaks. Failure of other components is not considered. As long as the “outer
burst disc” ruptures, failure has not occurred even though the G/M seal may have
burst. Ideally, the G/M seal remains intact and all energy is transferred into the
rupture of the burst disc, according to the sequence of Figure 2.
! The effective life of a CAD is based on the hermeticity and stability of the
pyrotechnic components. During static state, the effective life of a CAD, or shelf
life, is the length of time given before the entire unit is considered unsuitable for
use. For man-rated or mission essential CAD units, it is the regulated time the
units can be stored without use, during which, the defined quality of the unit
remains acceptable under expected conditions of service. Many of the chemical
components of the pyrotechnic materials are highly corrosive and act to degrade
the overall heremticity of the G/M seal. Once seal integrity has been
compromised, the CAD is no longer deemed safe for use and must be replaced
and disposed of properly.
6
[3 ] A deflagration event is characterized by a subsonic flame propagation velocity. In contrast, a detonation event is characterized by supersonic flame propagation velocities.
Static State: Pyrotechnic contained in hermetic seal.
Initiation: Bridge-wire ignites pyrotechnic.
Energy release: Thermal or mechanical primary energy release.
Figure 2. CAD Assembly and Sequence of Failure
Inner Burst Disc
Outer Burst Disc
7
! During initiation, the bridge wire connecting electrical pins and housing burns,
and the pyrotechnic material is ignited. Sudden explosion of the material ruptures
the inner burst disc, subsequently transferring heat into the gas mixture. Finally,
after enough temperature and pressure have built up, the outer burst disc is
ruptured and energy is released thermo-mechanically with a flier-plate or
pressure release work delivery system.
SECTION 1.5 RESULTS
! This work defines the failure sequence of a G/M seal during pressure
overload failure. It shows that, during detonation of a chemical initiator, sufficient
tensile stresses develop around the pin interface to lead to total failure. Several
mechanical properties are characterized to support empirical findings.
Furthermore, it reveals how the G/M interface responds during shear loading
isolated to the interface region. It is advised that sufficient design considerations
of this sequence be observed in future CAD use of G/M seals to increase overall
reliability.
SECTION 1.6 STRUCTURE OF THIS THESIS
! ! The following chapter contains a literature review, subdivided on topical
basis, pertaining to traditional academic achievements in the field of materials
engineering relevant to material selection and environmental concerns. Chapters
8
3 through 5 describe mechanical impact loading of the G/M interface, finite
element analysis, and shock load testing, respectively. Each chapter will contain
distinct sections on design approach, method details, and results. Chapter 6 will
cover conclusions and future recommendations.
9
Chapter 2. LITERATURE
SURVEY
SECTION 2.1 OVERVIEW/ORGANIZATION
! For many years, glasses have been used by the electronics industry as a
sealing and insulating medium, especially when hermetic needs arise. However,
a joint interface consisting of elastically differentiable materials, subjected to
impact or high-strain rate loading, is largely undocumented. As Selcukʼs work on
determining mechanical strengths for G/M seals notes, “there have been no
measurements reported of mechanical properties of seals, nor any discussion of
methods by which these properties can be measured.”2 Much less is there a
seemingly present knowledge of shock loading for these interface mechanics.
Traditionally, investigators were only interested in residual stresses and
differences in thermal expansion between the sealing material and components
being sealed. However, this leaves a gap in the armaments industry when such
seals are used in the production of CADs.
! This review develops a basic understanding of interface issues for
mismatched joints and seeks to provide an understanding of problematic areas.
Secondly, it begins to show a basic understanding of shock loading for elastic-
plastic materials, based on the development of dislocation mechanics.
10
Additionally, this review presents an understanding of adiabatic properties, which
are extremely significant when attempting to understand energy transfer within
the matrix due to extremely high energy inputs. Finally, it presents information
specifically focused on mechanical construction of G/M seals.
SECTION 2.2 MECHANICAL STRUCTURE OF G/M SEALS
! The adherence, or bonding, of glass to metal is extremely important in
producing a quality G/M seal. Primarily, two bonding mechanisms are present:
mechanical wetting of an irregular or “rough” metal interface by the glass and
chemical interaction with a tenacious surface oxide. Most chemical theories rely
on the metal ions forming a tight bond on both sides as a result of oxidation. M.
Hida et al. points out, in recent years, that strong joining of two materials
depends on both chemical and physical joining.3 Meaning, the development of
bonding at the interface to produce chemical adhesion and the development of
mechanical stress distributions and gradients across the interfacial zones, are
both necessary. Thus, redox reactions in the interfacial zone are necessary, not
only for forming chemical bonds, but also for producing an interlocking structure
because wetting is required for the latter.
! The general absence of contemporary widespread developments in the field
of G/M seal research originates largely from the lack of computational modeling
technologies and an overall appeal to modern researchers, as evidenced by the
difficulty in finding extensive modern-day sources. Marcus Borom, during the
1960ʼs, provided primary definitions of the physical chemistry of glass sealing
11
and characterization of oxides. Borom studied porcelain enamel structures and
redox reactions present during manufacturing. At the time, due to a lack of high
resolution microscopes, his observations were based on weight with respect to
oxidizing time data.4
! To this day, the guiding body of research for construction and design of G/M
seals remains the work conducted during the early 1980ʼs at Sandia National
Laboratories by S.N. Burchett et al.1 Burchett reports the design and
manufacturing considerations for a coaxial compression G/M seal with a
particular material combination. The goal of the work was to couple the design
with manufacturing guidelines to yield a mechanically optimized G/M coaxial
compression pin seal. For the forming of a seal, a metal pin is surrounded by a
collar of glass (insulator) which is inserted into a hole in the metal housing
(header). The temperature is then increased until the glass flows and fuses to the
metal pin and housing. Finally, the most crucial step is initial cooling to service
temperature. During this stage, if the materialsʼ expansions are not properly
understood, stresses develop.
! The seal must survive many different environments, and survival is based
largely on the stress state of the seal. Proper design requires either zero stress
or compressive stress state in the glass at room temperature. Tensile stresses
will lead to micro-cracking and loss of hermeticity.1 Burchettʼs work focused on
geometric configurations, thermal cycling, and the effect of multiple pin seals in a
metal housing.
12
! In 1993, Bruchett provided an extension of the publication “Some Guidelines
for the Mechanical Design of Coaxial Compression Pin Seals.” The extension
stated that, during heat treatment for sealing, the temperatures reached were
capable of annealing the Alloy 52 pins.5 This research focused on the increase in
ductility and lowering yield strength of the pins. Thermal residual stresses were
then computed with annealed pins, and the improved results were used to
reconstruct the previous set of guidelines that originated from his initial study.
Bruchett found that annealing of the pins significantly narrows the optimal design
range. Also of importance, the presence of excessive pin wetting was shown to
greatly impact the glassʼs residual stress state.
SECTION 2.3 MODELING DEFORMATION OF INTERFACES
! An interface can be described as a collection of strains and several
constitutive elements. Strains within an interface allow for discontinuous moment
stresses to develop and are either stored and/or dissipated. To assist in
understanding this, Gudmundson proposed a mechanical analogy of an
interface, shown in Figure 3.6 Higher-order moment stresses and plastic strains
are analogous to tractions and displacements. The constitutive behavior can be
described by stiffnesses, viscous and frictional elements, etc, represented as K.
13
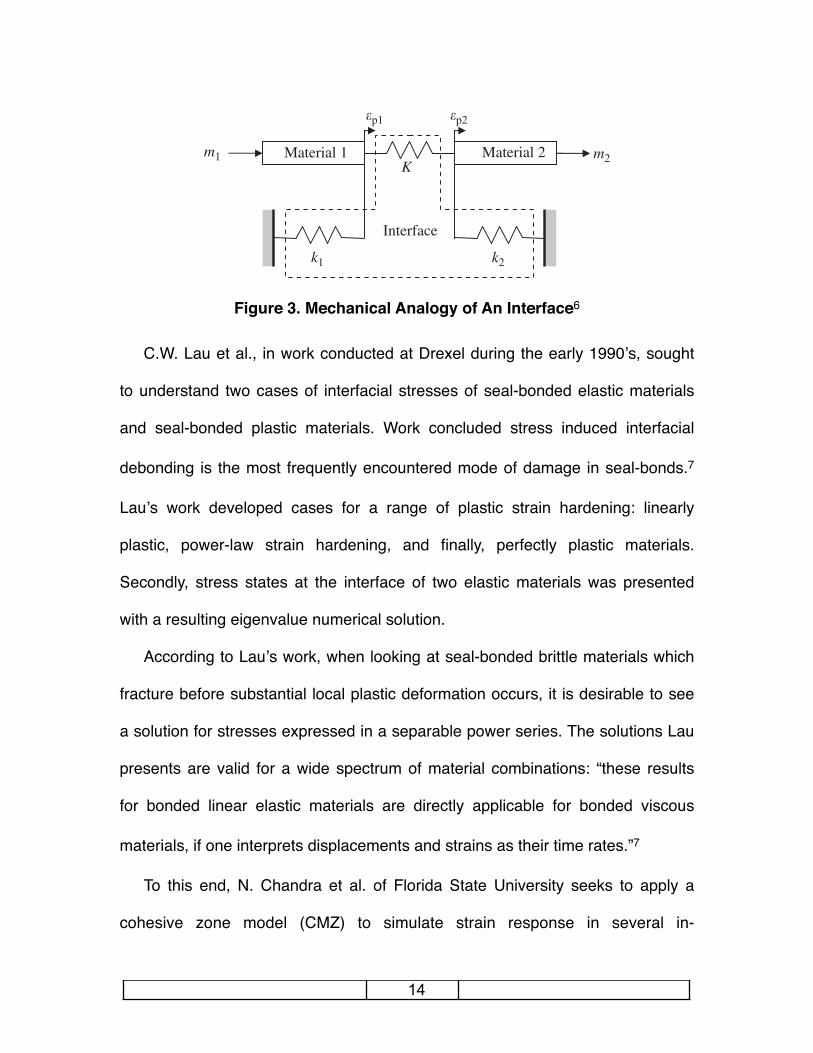
Figure 3. Mechanical Analogy of An Interface6
! C.W. Lau et al., in work conducted at Drexel during the early 1990ʼs, sought
to understand two cases of interfacial stresses of seal-bonded elastic materials
and seal-bonded plastic materials. Work concluded stress induced interfacial
debonding is the most frequently encountered mode of damage in seal-bonds.7
Lauʼs work developed cases for a range of plastic strain hardening: linearly
plastic, power-law strain hardening, and finally, perfectly plastic materials.
Secondly, stress states at the interface of two elastic materials was presented
with a resulting eigenvalue numerical solution.
! According to Lauʼs work, when looking at seal-bonded brittle materials which
fracture before substantial local plastic deformation occurs, it is desirable to see
a solution for stresses expressed in a separable power series. The solutions Lau
presents are valid for a wide spectrum of material combinations: “these results
for bonded linear elastic materials are directly applicable for bonded viscous
materials, if one interprets displacements and strains as their time rates.”7
! To this end, N. Chandra et al. of Florida State University seeks to apply a
cohesive zone model (CMZ) to simulate strain response in several in-
_!pIij ¼ _lI 3M
Iij
2SM, (32)
respectively. If we assume rate-independence and proportional, monotonically increasingloading, the interface models can be compared qualitatively. For the thin film problem, wehave SM ¼ 3
2 jmIzzzj and Sf ¼ lIsy. Eq. (31) then gives jmI
zzzj ¼23 lIsy. For the surface energy
model with N ¼ 1, the moment stress at the interface is given by Eq. (23) as jmIzzzj ¼
23 lGsy.
Consequently, if lG ¼ lI is used the two interface models should predict the same yieldstrength. If we compare Figs. 4(a) and 5(a), this is confirmed. However, in the case ofreversed or cycling loading, a comparison between the two models cannot be made.A quite general discussion on the formulation of interface conditions within a strain
gradient plasticity framework was presented by Gudmundson (2004). It allowed fordiscontinuous plastic strains as well as discontinuous conjugate moment stresses over theinterface. Furthermore, models based on storage of internal energy and/or dissipation atthe interface was discussed. The interface model can be represented by a mechanicalanalogy of an interface as in Fig. 6. Higher-order moment stresses and plastic strains areanalogous to tractions and displacements on both sides of an interface. For an interfacethat is defined in terms of tractions and displacements, the constitutive behaviour can bedescribed by stiffnesses, viscous and frictional elements, etc. In Fig. 6 these elements aresymbolically represented by K ; k1; k2. The constitutive relationship between momentstresses and plastic strains can be described in an analogous way. Different special casescan now be identified. An elastic–plastic interface, as is treated in the present paper,corresponds to k2 ! 1, which implies that !p2ij ¼ 0 in the elastic material (2). In this case itis only required to define a constitutive relationship between !p1ij and M1
ij as in Eqs. (15) or(16). The interface model that was presented by Aifantis and Willis (2005, 2006)corresponds to K ! 1 in Fig. 6, which implies that !p1ij ¼ !p2ij . The elements k1; k2 can inthis case be combined into a single element k1 þ k2 and the constitutive equation can bedefined in terms of !p1ij ¼ !p2ij and the difference between higher-order stresses on both sidesof the interface. The interface model that was discussed by Gurtin and Needleman (2005)assumed continuous higher-order moment stresses over the interface. This corresponds tok1 ¼ k2 ¼ 0 in Fig. 6, and the constitutive equation can be defined in terms of thecontinuous higher-order stresses together with the difference in plastic strain !p1ij # !p2ij onboth sides of the interface.The results presented in Fredriksson and Gudmundson (2005b), where the surface
energy evolved in a quadratic fashion, showed a different behaviour. For compliantinterfaces, it was predicted that only the hardening was influenced by the film thickness,while the yield strength was influenced for a stiff interface. With the present models, it is
ARTICLE IN PRESS
Material 2Material 1K
k1 k2
m1 m2
Interface
!p1 !p2
Fig. 6. Mechanical analogy.
P. Fredriksson, P. Gudmundson / J. Mech. Phys. Solids 55 (2007) 939–955952
14
homogeneous systems.8 As compared to Lauʼs modeling, Chandraʼs work starts
with a primary understanding of interfaces based upon a narrowly graded region
of continuum properties, and evolves to an infinitely thin surface separated by
springs which are represented as cohesive zones with specific traction relations.
This research seeks to establish traction equations for Ceramic-Metal interfaces.
In general, CMZs are defined as boundary-value problems, in which quantities
such as displacements, velocities, stresses or temperatures are the input values;
however, strain response rate is omitted.
! In 2006, Fredriksson et al. of the Royal Institute of Technology completed a
CMZ model for plastic deformation at the micron scale.6 However, this work was
limited to isotropic materials. In his first model, motivated by dislocation theory,
interface energy was accumulated as linear plastic strain. In his second model,
plastic energy was completely dissipated at the surface.
! Understanding of dislocation theory at interfaces arises from Ashbyʼs work
during the early 1970ʼs. Ashby et al. stated, “geometrically necessary dislocations
are generated for compatibility reasons when plastic deformation is
heterogeneous.”9 One type of gradient theory seeks to preserve the form of
standard plasticity equations but does not involve additional boundary conditions.
! The concept of interfacial energy dependent on the plastic strain state at the
interface, implies a vanishing strain energy at the interface; however, no plastic
strain on the elastic side of the interface can exist. In order to develop a gradient
equation, Fredriksson assumed all interfaces were of the same type, either
elastic or elastic-plastic, and could contribute to strain gradient plasticity energy.6
15
Fredriksson also theorized that as a strain moves toward an interface, it behaves
as a free surface and allows for strain energy to propagate across the interface.
Conceptually, these strains function as a slip system, causing an accumulation of
edge dislocations at the interface.
! Alternately, another type of interface, presented by Gudmundson, can be
visualized as surface energy vanishing and work dissipating.10 This interface
condition is similar to plastic deformation and would include creep in the bulk
material, but speculatively remains of limited use to the focus of pure elastic
interfaces at high-strain rates such as shock loading.
! In 2004, Gudmundson presented a general discussion on the formulation of
conditions seen by a strain gradient, based upon interface descriptions by
Fredriksson.10 In Gudmundsonʼs unified theory, the interface can be considered a
mechanical structure made of Hookean springs, see Figure 3. Forces are able to
move across the mechanical system and strains are accumulated and
dissimulated accordingly.
! The development of the above interface models allow for the study of energy
transfer across interfaces. The ability to completely model the mechanics of
interfaces, provide FEA models the ability to accurately transfer energy across
dissimilar boundaries, thereby contributing to enhanced design capabilities.
16
SECTION 2.4 INTERFACE DIFFUSION
! When considering sealing technology, diffusivity is a crucially important
aspect for the collection of dislocation strains along the interface, which in turn
promote failure of the interface. Additionally, it is important to understand the
effects of residual stresses upon the interface, which arise from differences in
thermal expansion. Work conducted by Raj et al. at the University of Colorado
presents interfacial ion exchange and subsequent vacancies and point defects.
Raj proved the occurrence of ion exchange across a metal-ceramic interface.11 In
earlier studies of soda-lime glass, large ions of potassium were exchanged to
create compressive stresses. As the stresses increased, the effective fracture
strength of the glass magnified.12 An additional variable considered during this
defining study was influence of particle size on thermal diffusively. Raj
hypothesized that thermal diffusivity would decrease with smaller particles
because of thermal resistance of the interface.
! For example, Raj suggested changes in particle size would lead to a change
in relative values of thermal conductivity between the fine particles and coarse
particles when the temperature was increased.Materials that are dissimilar and
have a highly defuseable matrix are especially vulnerable. Secondly, in contrast
to a dissolution-precipitation reaction, ion exchange requires only that the cations
of the ceramic should have significant mobility.11 If a dissolution type reaction
occurs, it requires a significant interfacial energy among the particles with an
added chemical driving force. In G/M seals, the interface relies heavily on the
17
chemical adhesion and stability. Ion exchange during forming acts to achieve
adhesion by altering the driving force toward chemical equilibrium.
! Ronald Loemanʼs work at Sandia National labs focused on mapping the
stresses that induce microstructural changes, resulting from chemical interfacial
reactions of G/M seals.13 Ideally, thermal coefficients of the metal and final glass
seal should be comparable. Loemanʼs work shows that crystallization of a high-
thermal-expansion lithium silicate glass-ceramic differs in the presence of a metal
substrate than in bulk and forms a reaction zone. The presence of a reaction
zone probably suggests that both the glass-ceramicʼs thermal expansion and
thermal conductivity vary across the interface. The expansion coefficients infer
that the interlayer of the glass-ceramic will have significant implications on
residual stresses.13 Normally, the seal is assumed to be stress-free or in
compression. The results of this study proves the glass-metal reactions required
for bonding alter the crystallization of the glass-ceramic near the interface.
Significant interfacial stresses may develop and must be accounted for in design.
SECTION 2.5 SHOCK DEFORMATION
! Normally, materials are subjected to forces at speeds in the regime of sub-
acoustic waves. A shock wave is a force that propagates through a material
faster than the speed of sound, causing changes in a materialʼs state variables.
Traditional force waves will produce isentropic alterations in state variables, while
the passage of a shock wave typically produces irreversible changes in the same
18
values. Shock energy is able to produce extremely high-strain rates which induce
adiabatic viscous effects. Grujicic, of Clemson, has significantly studied modeling
of such waves within soda-lime glass.14 Grujicicʼs shock wave work attempted to
advance the application of computational modeling for glasses under high-
pressure/high-strain rate loading. According to the research, glass is traditionally
treated as a continuum whose properties become degraded by nucleation,
growth, and coalescence of cracks.14 Additionally, unlike the metal housing, glass
is amorphous and lacking of long-range order. This lack of order gave rise to a
second modeling approach based on the bonding sites of a random network. At
high pressures, the network formers can change, resulting in phase changes
based on geometric alterations.
! Gaining an understanding of materials for higher strain testing is also
significant to dislocation theory. Once diffusion is omitted from the interface,
energy transfer must be understood. Recent work at the Naval Surface Warfare
Center by R. W. Armstrong et al. seeks to describe dislocation mechanics
constitutive equation analysis for fcc and bcc materials.15 Armstrongʼs work
begins with a fundamental Hall-Petch pile-up basis and moves to strain
hardening and dynamic recovery. In 1988, a simple dislocation formula for
constitutive equations for metals was introduced, based on thermally activated
motion of dislocations. Armstongʼs associate F. Zerilli promoted that, for bcc
metals, the motion of dislocations was governed primarily by their interaction with
the lattice potential (Peierls-Nabarro stress).16 Meaning, dislocation motion is
19
essentially temperature and strain-rate independent. The von-Mises equation
was used to define yielding with respect to average grain diameter, with
constants to account for thermally activated dislocation interactions. For testing
on copper, Armsrtongʼs initial equations show theoretically the flow stress acted
to diminish the ductility, comparative to experimental results by K. J. Frustchy.
Experimental results showed a strongly increased strain hardening behavior for
copper at high-strain rates, most likely due to dislocation drag and deformation
twinning stress.17
! Twinning, in materials, shows a strong dependance on grain size. For iron
twinning, flow stresses can produce strain rates on the order of 104 per second
and has been shown to occur in fcc metals, but generally at very high stress
levels.18 In 1995, Armstrongʼs work produced a constitutive model for twinning
based on the idea that a threshold amount of twinning will occur in a single grain.
This threshold is responsible for accommodation of the excess strain, by which
the von-Mises effective stress exceeds the twinning stress. Thus, the results
indicate that twinning hardens these metals by reducing the materialʼs grain size
and the microstructure within the grain as well. In very small grain size materials,
little to no twinning was observed, as well as little to no shock hardening was
found.18 However, strain hardening can be seen with a susceptibility to shear
instability, translating to enhanced ductility. Additionally, L. Murrʼs work observed
profuse twinning in shock deformed tantalum, thus endorsing the shock
hardening theory based on the Hall-Petch grain size refinement basis.19 At shock
20
rates, adiabatic conditions are present, as proposed by Zener and Hollomon in
1944, the shear instability develops and the rate of thermal softening overcomes
the rate of work hardening.20
! In 1998, Drumheller produced a collective work based on modern nonlinear
waveforms. Drumheller outlined the only constitutive model for an elastic material
and detailed formation and decay of a shock wave. The principles of shock
waves was unified based on pressure and thermodynamics. Both temperature
and entropy, as well as force and motion, govern the constitutive model of
materials. 21
SECTION 2.6 CONCLUDING THOUGHTS
! The idea of G/M seals has existed for many years, and application is largely
based on empirical experience. When conducting literature searches for
mechanical properties, little information can be located. This is especially true
when looking at extremely high-strain rate loading conditions. This literature
survey sought to illustrate a basic understanding of several potentially underlying
issues, which are expected to aid this thesis. However, due to the field of high-
strain rate loading of elastically mismatched interfaces being largely unexplored,
the connection between many of the above detailed concepts is disjoint. Future
development of interface mechanics will conceivably unify these foundational
concepts, in order to reveal application-oriented usefulness of the academic
premises for production engineering.
21
Chapter 3. MECHANICAL
IMPACT LOADING
SECTION 3.1 INTRODUCTION
! Construction of G/M seals produces many forms of residual stresses, and
depending upon loading, different failure sequences will result. One possible
indication of cracking susceptibility is the location of maximum residual stresses.
Predominantly, the maximum residual stresses are seen at the sealing interface
due to accumulation of compressive stresses and CTE mismatch.23 The goal of
this impact or dynamic loading experiment was to measure the maximum push-
out force of a G/M seal during overload failure and empirically record the
resulting failure sequence.
SECTION 3.2 G/M SEAL DESIGN
! To aid in understanding the observed impact failure sequence, several
commonly encountered internal stresses were defined. Definition of the internal
stresses was followed by a root-cause analysis supported by a number of
characteristics of G/M seals pertaining to the findings.
22
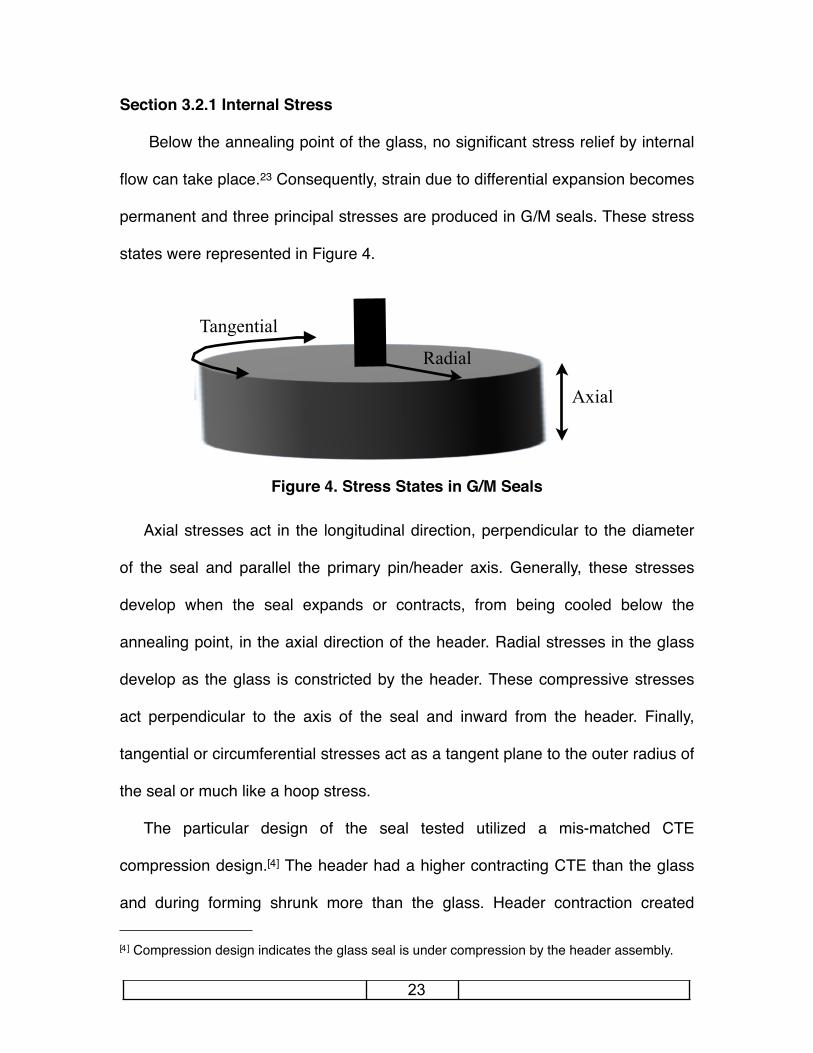
Section 3.2.1 Internal Stress
! Below the annealing point of the glass, no significant stress relief by internal
flow can take place.23 Consequently, strain due to differential expansion becomes
permanent and three principal stresses are produced in G/M seals. These stress
states were represented in Figure 4.
Figure 4. Stress States in G/M Seals
! Axial stresses act in the longitudinal direction, perpendicular to the diameter
of the seal and parallel the primary pin/header axis. Generally, these stresses
develop when the seal expands or contracts, from being cooled below the
annealing point, in the axial direction of the header. Radial stresses in the glass
develop as the glass is constricted by the header. These compressive stresses
act perpendicular to the axis of the seal and inward from the header. Finally,
tangential or circumferential stresses act as a tangent plane to the outer radius of
the seal or much like a hoop stress.
! The particular design of the seal tested utilized a mis-matched CTE
compression design.[4] The header had a higher contracting CTE than the glass
and during forming shrunk more than the glass. Header contraction created
Axial
Radial
Tangential
23
[4 ] Compression design indicates the glass seal is under compression by the header assembly.
radial and axial compressive forces that produced compressive residual stresses
in the glass. The pin retained the balance of forces by employing a matching
CTE, which sustained the compressive stresses from the header.
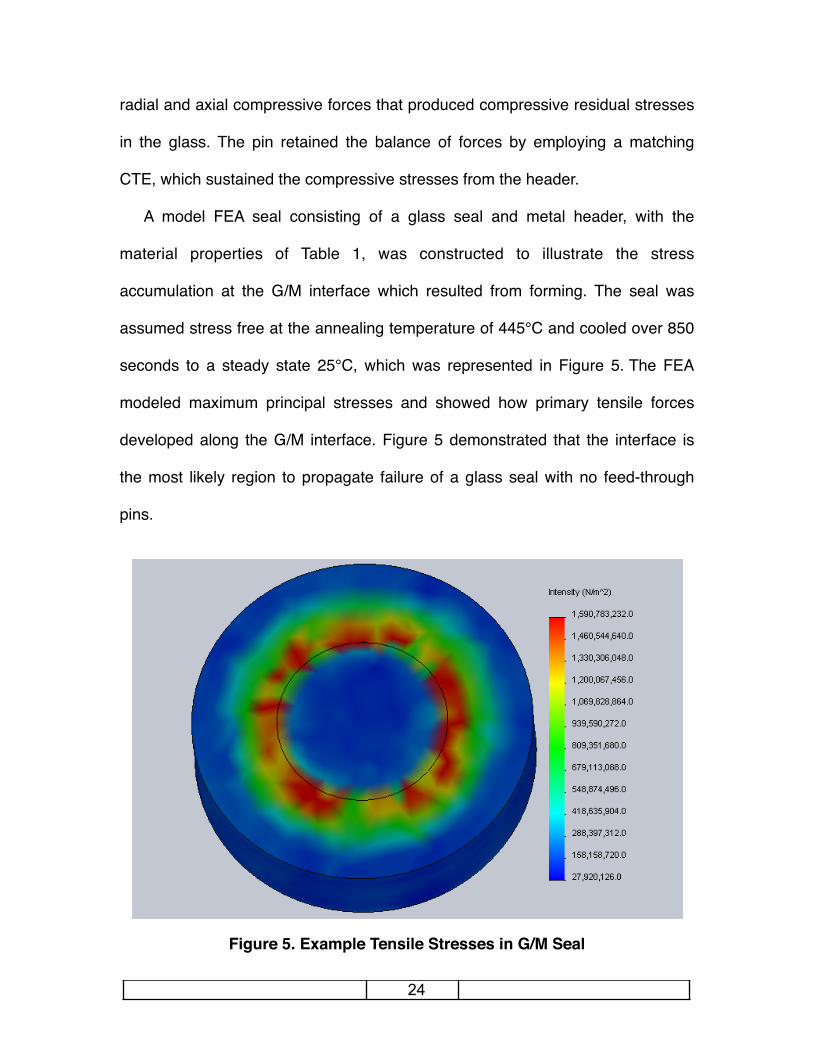
! A model FEA seal consisting of a glass seal and metal header, with the
material properties of Table 1, was constructed to illustrate the stress
accumulation at the G/M interface which resulted from forming. The seal was
assumed stress free at the annealing temperature of 445℃ and cooled over 850
seconds to a steady state 25℃, which was represented in Figure 5. The FEA
modeled maximum principal stresses and showed how primary tensile forces
developed along the G/M interface. Figure 5 demonstrated that the interface is
the most likely region to propagate failure of a glass seal with no feed-through
pins.
Figure 5. Example Tensile Stresses in G/M Seal
24
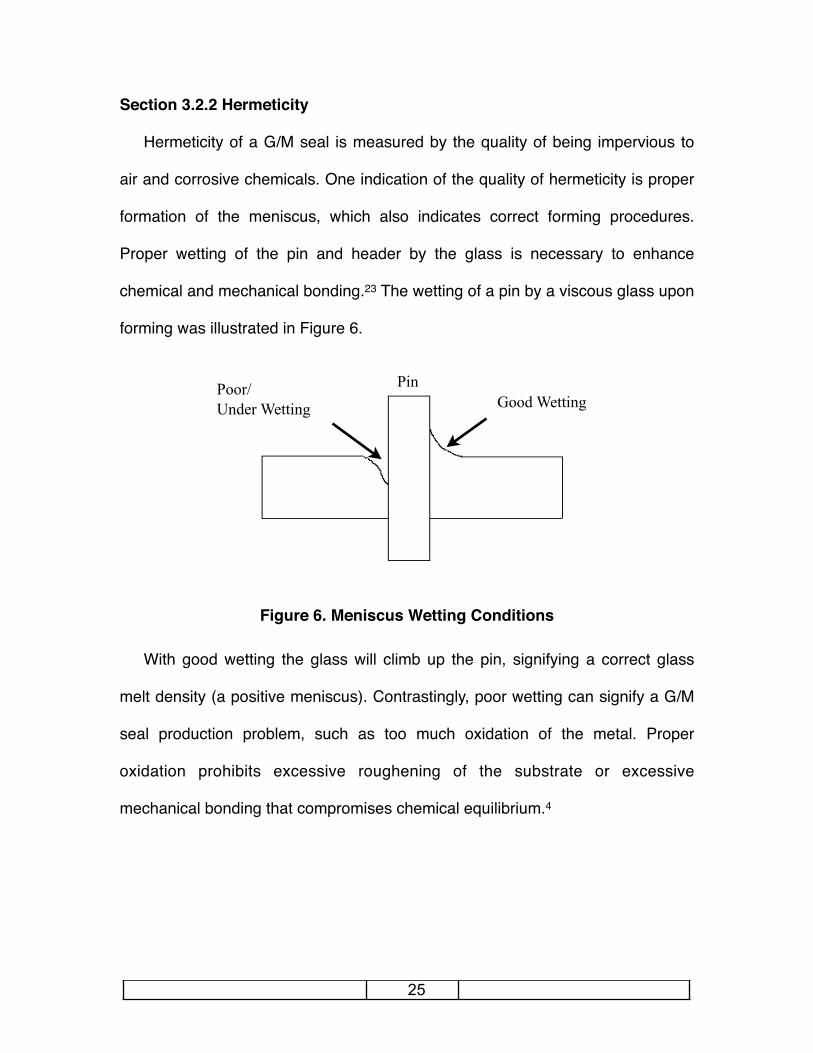
Section 3.2.2 Hermeticity!
! Hermeticity of a G/M seal is measured by the quality of being impervious to
air and corrosive chemicals. One indication of the quality of hermeticity is proper
formation of the meniscus, which also indicates correct forming procedures.
Proper wetting of the pin and header by the glass is necessary to enhance
chemical and mechanical bonding.23 The wetting of a pin by a viscous glass upon
forming was illustrated in Figure 6.
Figure 6. Meniscus Wetting Conditions
! With good wetting the glass will climb up the pin, signifying a correct glass
melt density (a positive meniscus). Contrastingly, poor wetting can signify a G/M
seal production problem, such as too much oxidation of the metal. Proper
oxidation prohibits excessive roughening of the substrate or excessive
mechanical bonding that compromises chemical equilibrium.4
PinPoor/Under Wetting Good Wetting
25
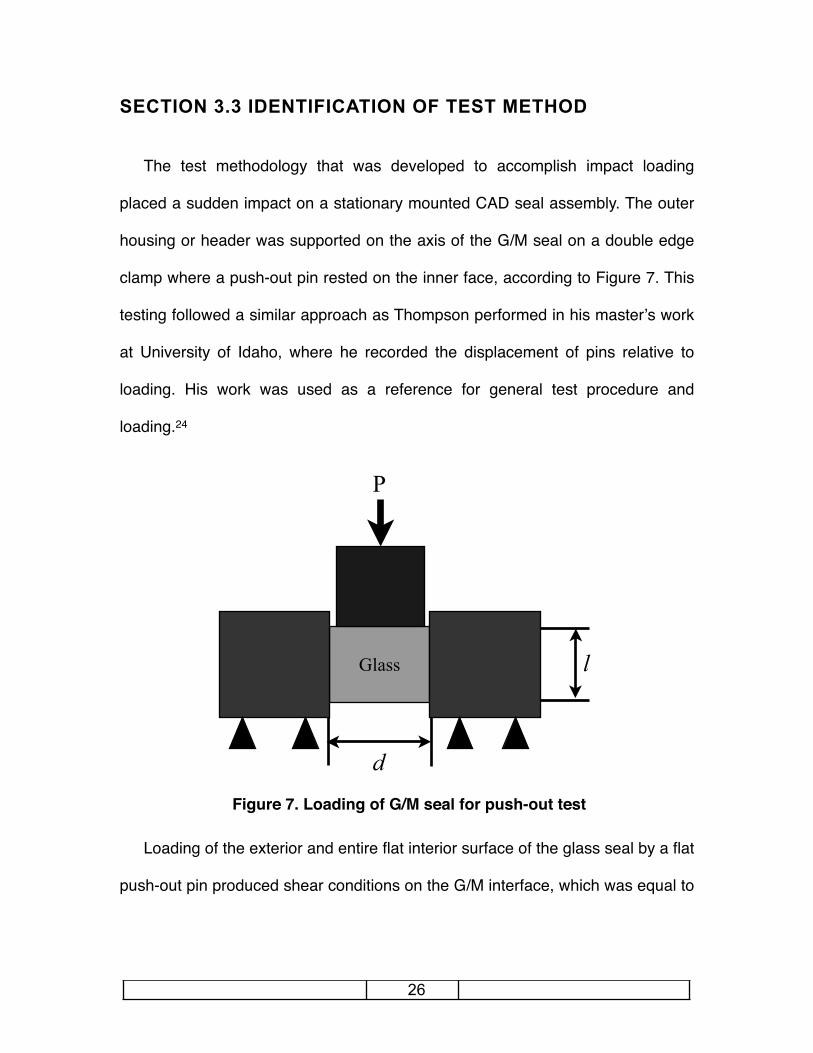
SECTION 3.3 IDENTIFICATION OF TEST METHOD
! The test methodology that was developed to accomplish impact loading
placed a sudden impact on a stationary mounted CAD seal assembly. The outer
housing or header was supported on the axis of the G/M seal on a double edge
clamp where a push-out pin rested on the inner face, according to Figure 7. This
testing followed a similar approach as Thompson performed in his masterʼs work
at University of Idaho, where he recorded the displacement of pins relative to
loading. His work was used as a reference for general test procedure and
loading.24
Figure 7. Loading of G/M seal for push-out test
! Loading of the exterior and entire flat interior surface of the glass seal by a flat
push-out pin produced shear conditions on the G/M interface, which was equal to
Glass
P
d
l
26
the normal stress. Assuming uniform loading this stress is described by Equation
[1].
! ! ! ! ! ! ! ! ! ! ! ! ! ! ! ! ! ! ! ! [1]
where,
σ-Normal StressP-Load Appliedl-Thickness of G/M Interfaced-Diameter of Seal
! The normal stress, σ, was a function of the load, P, and the structural
dimensions of the interface under a fixed resistance load, l. Recall from Figure 1
the diameter of the glass seal was 0.25”; it was necessary for the push out rod
applying load, P, to be undersized to 0.2” diameter. Undersizing the push rod, to
the diameter of the seal, aided in accommodating misalignment of load frame
and seal. The equipment used to collect the force data was a 5000 pounds high
frequency load cell and drop weight impact test machine detailed in Appendix A.
A weight of fifteen pounds was dropped 60 inches.
! The impact test measured the resistive forces exerted on the load cell by the
G/M interface. Tests were conducted at two temperatures: room temperature and
300°F. Due to expense and scarcity of components, and comparable results
produced by Thompson, only one G/M seal was tested at each temperature.[5]
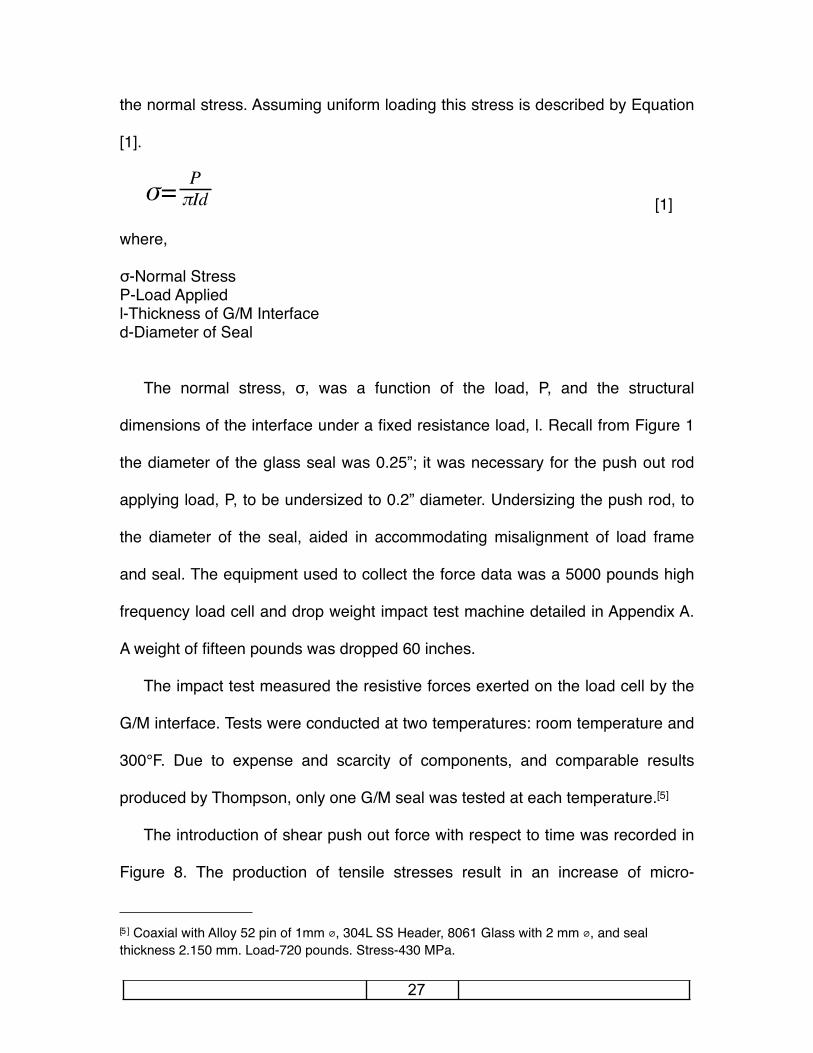
! The introduction of shear push out force with respect to time was recorded in
Figure 8. The production of tensile stresses result in an increase of micro-
27
[5 ] Coaxial with Alloy 52 pin of 1mm ⌀, 304L SS Header, 8061 Glass with 2 mm ⌀, and seal thickness 2.150 mm. Load-720 pounds. Stress-430 MPa.
cracking along the interface and a higher overall probability of a fracture of the
glass bond, resulting in failure.24 Table 2 showed the maximum loads seen during
failure at test temperatures for this material combination and design. Equation [1]
was used to calculate the stress at failure and assumed to be the strength of the
interface, recorded in Table 2. Additionally, the curves were integrated and
recorded as impulse. The area under the curves represented the change of
momentum upon failure of the G/M seal, or rather the absorption of force with
respect to time.
Figure 8. Load Curve for Impact at RT and 300°F
Test Load[lbf] [N]
Load[lbf] [N]
Stress [MPa]
Impulse [Ns]
Room Temp 72°F 2412 10,729 117 879.45
300°F 1456 6476 71 417.60
Table 2. Load and Stress for Impact Test
28

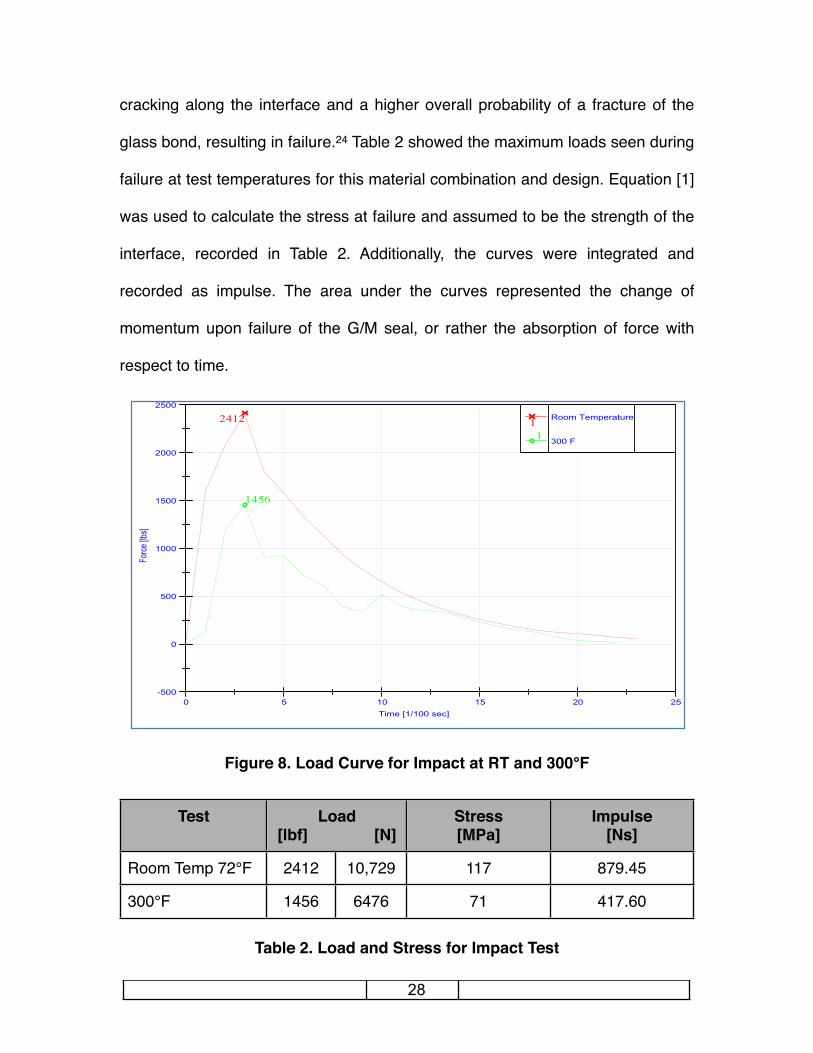
! To collect video data, a high speed video camera was placed perpendicular to
the load axis of Figure 7.[6] High speed video data was collected at 14,000 frames
per second at room temperature. Selected frames were presented in Figures
9-12 and documented the failure sequence of a G/M seal undergoing impact
loading. The selected frames will be analyzed in detail in section 3.4.
! This high speed video data portrayed how design characteristics contribute to
failure. To the knowledge of the author, high speed video of overload failure
sequence has never been recorded nor is there any existing in literature. In the
future, design engineers will be able to use this failure sequence to gain a true
understanding of G/M seal construction and implementation.
Figure 9. Impact High Speed Photo-Time Stamp 0.392194 s
29
[6 ] Camera: Manufacture-Redlake Imaging, Model-Motion Pro X3, Image Array-1280x1024, Frame Rate (fps)-2000 to 128,000, Electronic Start/Stop Record Trigger
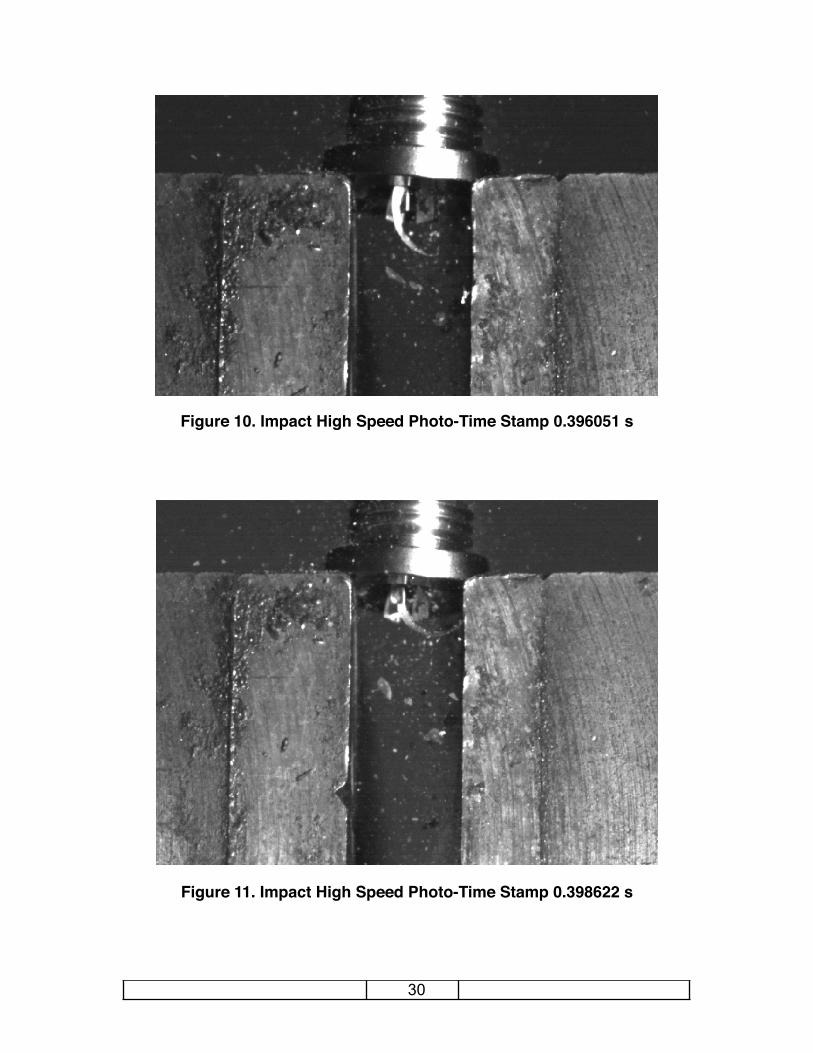
Figure 10. Impact High Speed Photo-Time Stamp 0.396051 s
Figure 11. Impact High Speed Photo-Time Stamp 0.398622 s
30

Figure 12. Impact High Speed Photo-Time Stamp 0.428480 s
SECTION 3.4 FINDINGS
! Loading profiles, displayed in Figure 8, created at room temperature (RT)
and 300°F show a marked difference in peak strength as a function of
temperature. The author speculates this is likely the result of a loss of adhesion
at the interface. As the temperature increases the adhesion lowered, as
evidenced by the initial discontinuity during loading of the elevated sample.
! Furthermore, the derivative or slope of the curves from peak force to
approximately 500 pounds suggested the response was not completely elastic,
marked by an abrupt release of linear energy, but rather an elastic-plastic with a
measured yielding and unloading of energy. Conjecturally, an elastic-plastic
response indicated energy is potentially transferred minutely across the interface,
and the metal housing provided plastic yielding that assisted in absorbing energy.
31
Additionally, gagged inflections exhibited by the elevated temperature sample
during unloading advocated a loss of adhesion followed by traction resistance as
the seal slips and then regains adhesion and slips again. Consequently, the
majority of the applied force went into fracturing the material. Thus, the strains
that were developed upon instantaneous loading were not uniquely determined
by the stresses elastically, but depended upon the history of loading or how the
stress state was reached.
! The area under the curve was measured and represented the impulse of the
strain response that was exhibited during impact loading. Impulse provided the
comparative tool in determining the difference between the qualitative responses
and also described the change in momentum the load cell experienced upon
impact. Impulse was considered due to the inseparable nature of both force and
duration of an impact event during dynamic loading. The impulse produced
throughout impact loading at room temperature was two times greater than that
which was produced at 300°F. In other words, at room temperature the G/M seal
absorbed twice as much momentum from impact forces as the G/M seal that was
tested at an elevated temperature.
! Analysis proceeded from the load curves to the selection of frames from the
high speed video, presented in Figures 9-12. Several hypotheses existed for the
observed failure sequence and remained speculatively based on empirical data.
However, as discussed earlier, it was assumed that the interface of the glass
being investigated was placed in pure shear: the maximum tensile stress equaled
the shear stress that occurred at the interface.
32
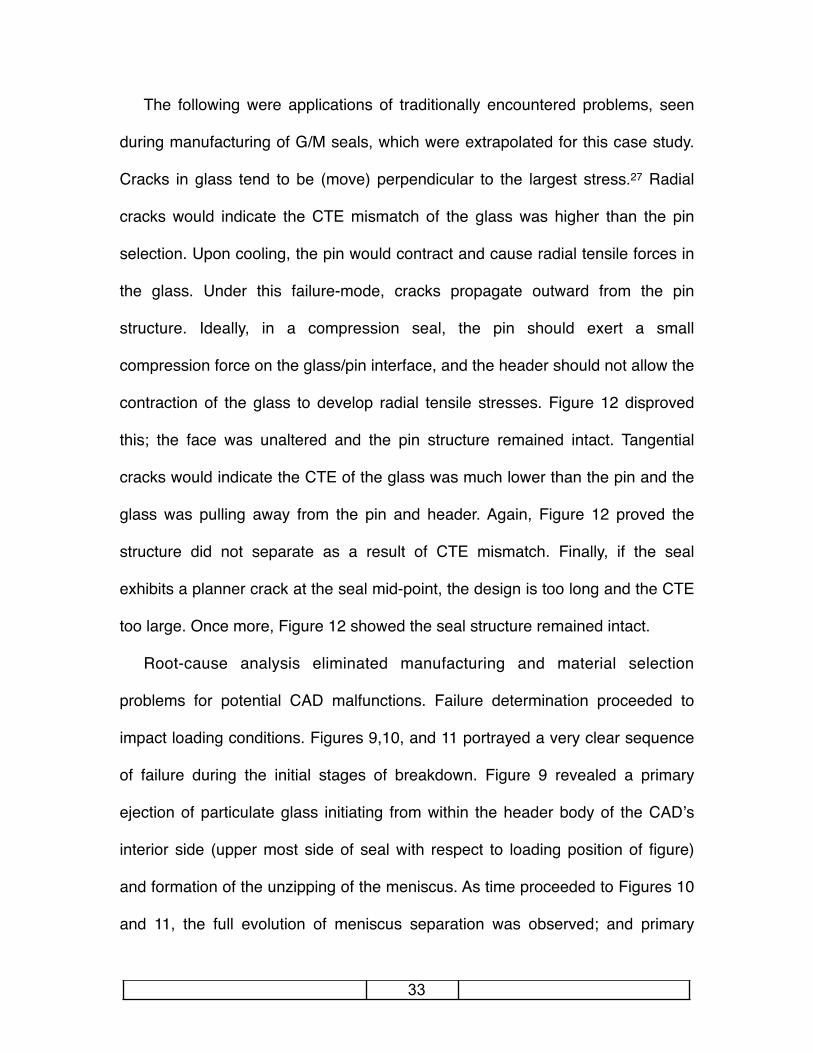
! The following were applications of traditionally encountered problems, seen
during manufacturing of G/M seals, which were extrapolated for this case study.
Cracks in glass tend to be (move) perpendicular to the largest stress.27 Radial
cracks would indicate the CTE mismatch of the glass was higher than the pin
selection. Upon cooling, the pin would contract and cause radial tensile forces in
the glass. Under this failure-mode, cracks propagate outward from the pin
structure. Ideally, in a compression seal, the pin should exert a small
compression force on the glass/pin interface, and the header should not allow the
contraction of the glass to develop radial tensile stresses. Figure 12 disproved
this; the face was unaltered and the pin structure remained intact. Tangential
cracks would indicate the CTE of the glass was much lower than the pin and the
glass was pulling away from the pin and header. Again, Figure 12 proved the
structure did not separate as a result of CTE mismatch. Finally, if the seal
exhibits a planner crack at the seal mid-point, the design is too long and the CTE
too large. Once more, Figure 12 showed the seal structure remained intact.
! Root-cause analysis eliminated manufacturing and material selection
problems for potential CAD malfunctions. Failure determination proceeded to
impact loading conditions. Figures 9,10, and 11 portrayed a very clear sequence
of failure during the initial stages of breakdown. Figure 9 revealed a primary
ejection of particulate glass initiating from within the header body of the CADʼs
interior side (upper most side of seal with respect to loading position of figure)
and formation of the unzipping of the meniscus. As time proceeded to Figures 10
and 11, the full evolution of meniscus separation was observed; and primary
33
glass particle expulsion transitioned from the upper/inner face to the lower/outer
interface of G/M seal and flowed out over the header assembly. Finally, Figure 12
characterized the ejection of the glass seal. The glossy lower exterior surface of
the seal remained intact and the surface condition remained in initial forming
state. The face condition further proved the glass expulsion, recorded in Figure 9,
as being ejected from the lower side of the seal, did not originate from the break
down of the face of the seal. The only remaining possible location of failure was
isolated to the meniscus region. Figure 12 supported this failure hypothesis, in
that it completely lacked the meniscus and showed deterioration along the outer
ring where the meniscus should be attached, and also exhibited cracking along
the entire axial G/M interface.
! From the sequence of Figures 9,10, and 11, it is speculated that failure
originated along the G/M interface within the meniscus zone. Several possible
loading scenarios explain meniscus cracking. First, too much wetting occurred
and produced an excessive meniscus, and when coupled with high compression
forces from the metal housing, failure resulted. Second, if the glass preform
weight was too high and the melt density was lower than normal, excessive
wetting might occur, but was unlikely in this case as materials selection was well
documented.5 Most likely, compressive stresses were overloaded, and due to the
forming state of the meniscus, it was the weakest link for this form of loading and
design.
! It was proposed: failure propagated from the impact zone along the interface
toward the opposite end of the seal and was focused at the meniscus/header
34
interface. As stresses were constrained axially along the seal interface, the
compressive forces were overcome in the radial and tangential directions. After
initial failure of the meniscus, material was ejected from the top seal surface,
axial traction forces provided resistance and held the glass seal in place. Once
the interface traction forces along the G/M interface, resisting the impact in the
axial direction, were overcome the glass seal slipped; as evidenced by the initial
glass particulate being ejected from the inside lower face in Figure 9. The
meniscus “unzipped” around the circumference and peeled away. Finally, all axial
friction forces were completely overcome and seal structure was expelled.
SECTION 3.5 CONCLUDING THOUGHTS
! The sequence and phenomena of “unzipping” of the meniscus was observed
and documented during interfacial overload. Furthermore, the impact force at two
temperatures was measured and resulting stresses calculated. The rate of
change of momentum as energy was conveyed by impact forces into the G/M
seal was measured as impulse. At an elevated temperature, the seal absorbed
less impulse energy and failed at a lower peak load.
! It is recommended additional statical testing be performed to determine with
one hundred percent certainty what the root causes were that initiated failure.
However, it was clear the breakdown of the G/M interface and meniscus was the
mode of failure. Although it is not clear if failure occurs in the metal/oxide, glass/
oxide, or oxide alone as no mechanical testing, as of now, is developed to show
which interface deteriorates.
35
Chapter 4. FINITE ELEMENT
ANALYSIS
SECTION 4.1 INTRODUCTION
! Traditionally, the maximum residual stresses are seen at the sealing interface
of a G/M seal.23 Finite Element Analysis (FEA) provided one method for
predicting potentially susceptible regions for accumulation of high levels of
stresses. A two-dimensional closed-form maximum principal stress solution
provided a basic understanding of the design. A fully assembled three-
dimensional model, processed computationally, fully mapped the complete stress
state of the G/M seal upon loading. The goal of the three-dimensional FEA model
was to isolate the most prone regions that lead to potential failure.
SECTION 4.2 CLOSED FORM SOLUTIONS
! The design parameters necessary to produce a “good” G/M seal were
outlined in J.D. Miller and S.N. Burchettʼs work at Sandia National Laboratories
and was used to conduct a two-dimensional initial design study.1 The G/M seal
dimensions and material properties studied with the Miller-Burchett approach
were outlined in Figure 1 and Table 1.
36
! Design considerations for a single coaxial compression pin seal in a metal
header, along with assumptions for the Miller-Burchettʼs approach, were
presented as follows. Residual stresses were determined by assuming the
stress-free temperature occurred at the annealing temperature of the glass. As
the structure cooled, stresses developed linearly, and at room temperature, the
material properties of the respective materials were used to calculate the residual
stresses. Also, the glass was assumed to respond as a linear elastic with the
header and pin in an elastic-plastic manner with von-Mises criteria.
! The closed-form approach used was a two-dimensional maximum principal
stress model which compared σmax to an estimated tensile load limit based on
material properties. It was assumed for σT values between 6.9 MPa (1000) psi
and 34.5 MPa (5000 psi), potential cracking could initiate, and above 34.5 MPa
(5000 psi), cracks occur. The compressive stress limit was assumed to be 8
times the tensile limit, or σc=8.0σT. Using the stress limit model, a Glass
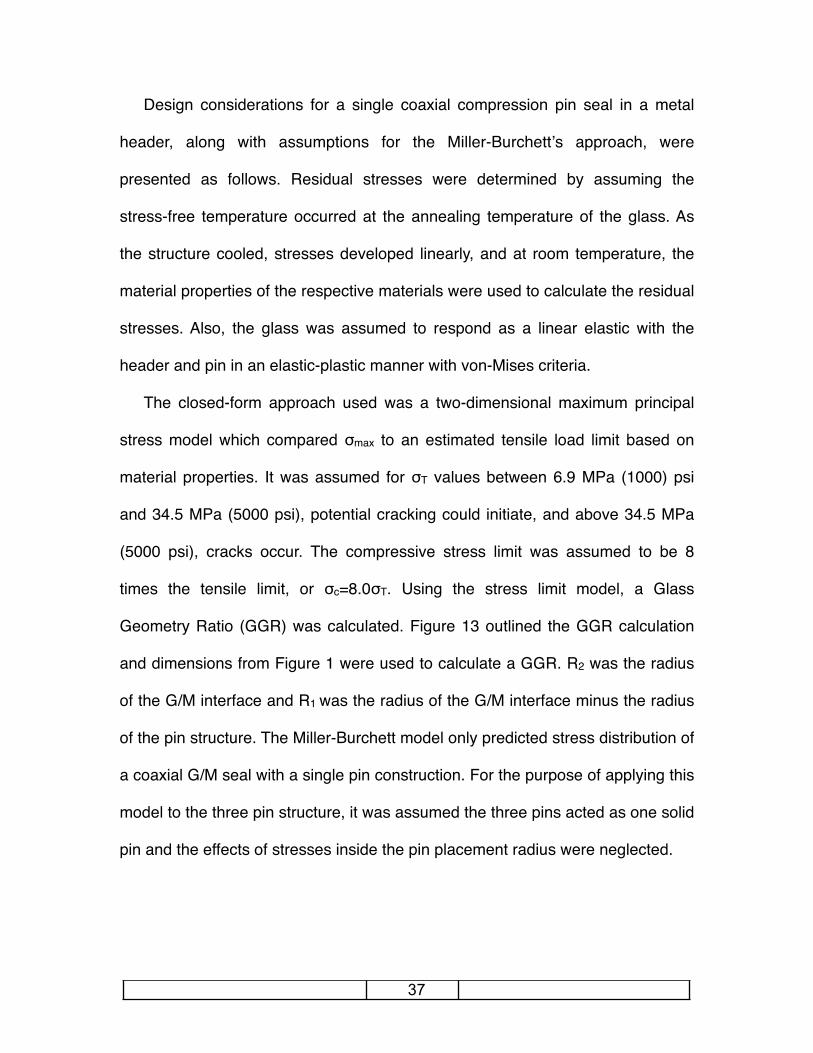
Geometry Ratio (GGR) was calculated. Figure 13 outlined the GGR calculation
and dimensions from Figure 1 were used to calculate a GGR. R2 was the radius
of the G/M interface and R1 was the radius of the G/M interface minus the radius
of the pin structure. The Miller-Burchett model only predicted stress distribution of
a coaxial G/M seal with a single pin construction. For the purpose of applying this
model to the three pin structure, it was assumed the three pins acted as one solid
pin and the effects of stresses inside the pin placement radius were neglected.
!
37
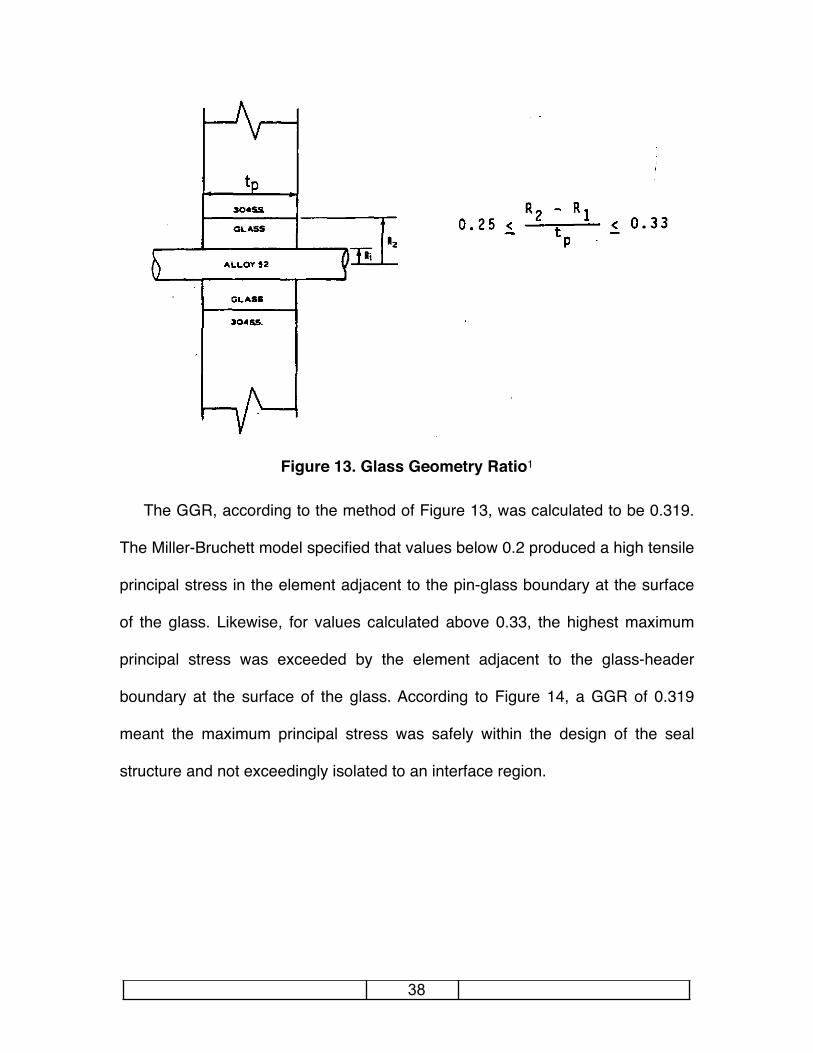
Figure 13. Glass Geometry Ratio1
! The GGR, according to the method of Figure 13, was calculated to be 0.319.
The Miller-Bruchett model specified that values below 0.2 produced a high tensile
principal stress in the element adjacent to the pin-glass boundary at the surface
of the glass. Likewise, for values calculated above 0.33, the highest maximum
principal stress was exceeded by the element adjacent to the glass-header
boundary at the surface of the glass. According to Figure 14, a GGR of 0.319
meant the maximum principal stress was safely within the design of the seal
structure and not exceedingly isolated to an interface region.
!
38
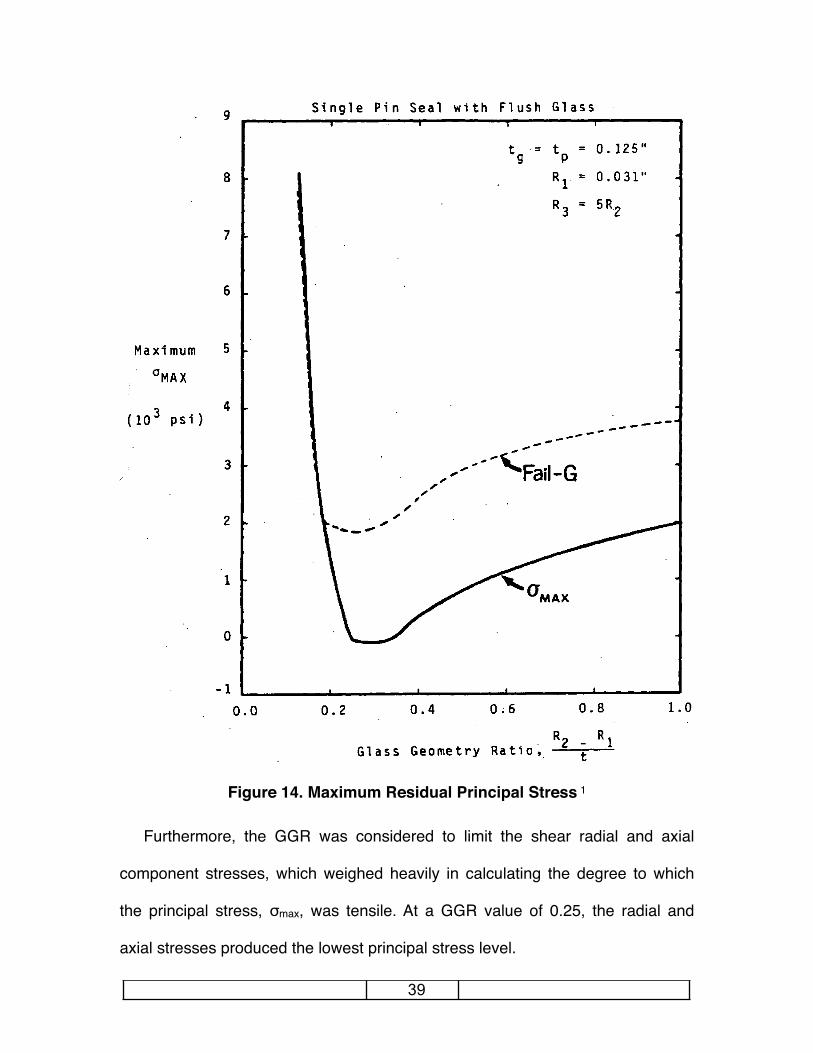
Figure 14. Maximum Residual Principal Stress 1
! Furthermore, the GGR was considered to limit the shear radial and axial
component stresses, which weighed heavily in calculating the degree to which
the principal stress, σmax, was tensile. At a GGR value of 0.25, the radial and
axial stresses produced the lowest principal stress level.
39
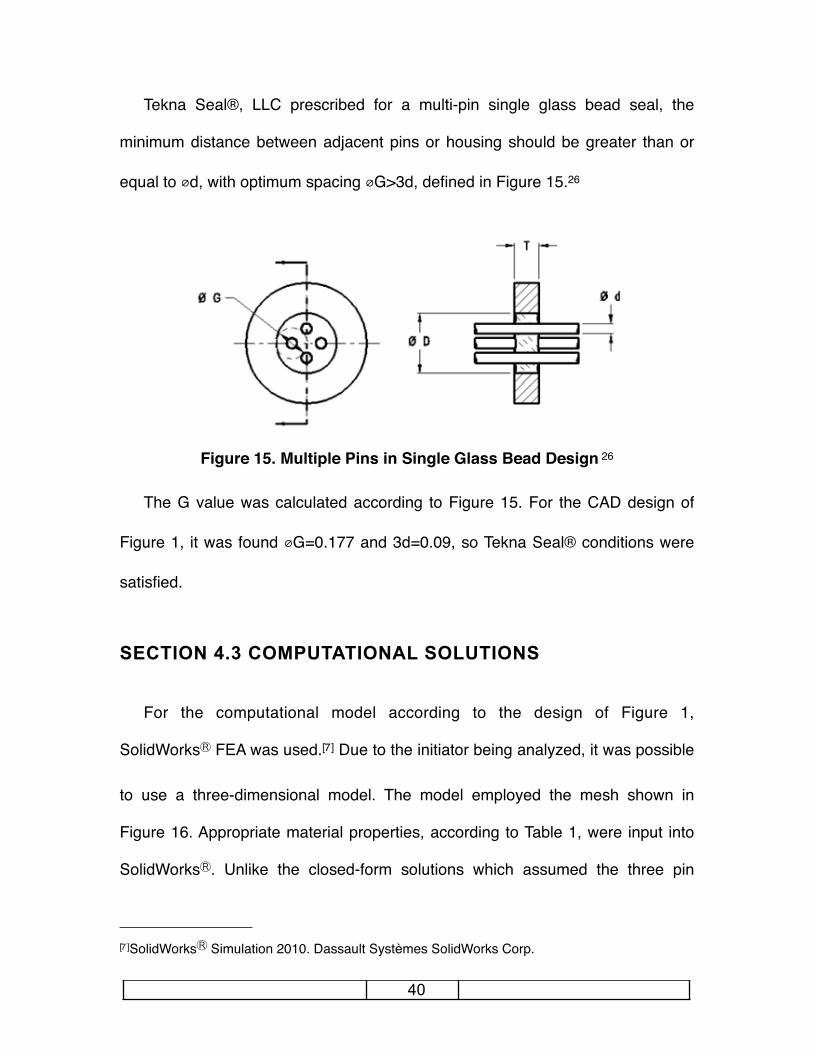
! Tekna Seal®, LLC prescribed for a multi-pin single glass bead seal, the
minimum distance between adjacent pins or housing should be greater than or
equal to ⌀d, with optimum spacing ⌀G>3d, defined in Figure 15.26
Figure 15. Multiple Pins in Single Glass Bead Design 26
! The G value was calculated according to Figure 15. For the CAD design of
Figure 1, it was found ⌀G=0.177 and 3d=0.09, so Tekna Seal® conditions were
satisfied.
SECTION 4.3 COMPUTATIONAL SOLUTIONS
! For the computational model according to the design of Figure 1,
SolidWorksⓇ FEA was used.[7] Due to the initiator being analyzed, it was possible
to use a three-dimensional model. The model employed the mesh shown in
Figure 16. Appropriate material properties, according to Table 1, were input into
SolidWorksⓇ. Unlike the closed-form solutions which assumed the three pin
40
[7 ]SolidWorksⓇ Simulation 2010. Dassault Systѐmes SolidWorks Corp.
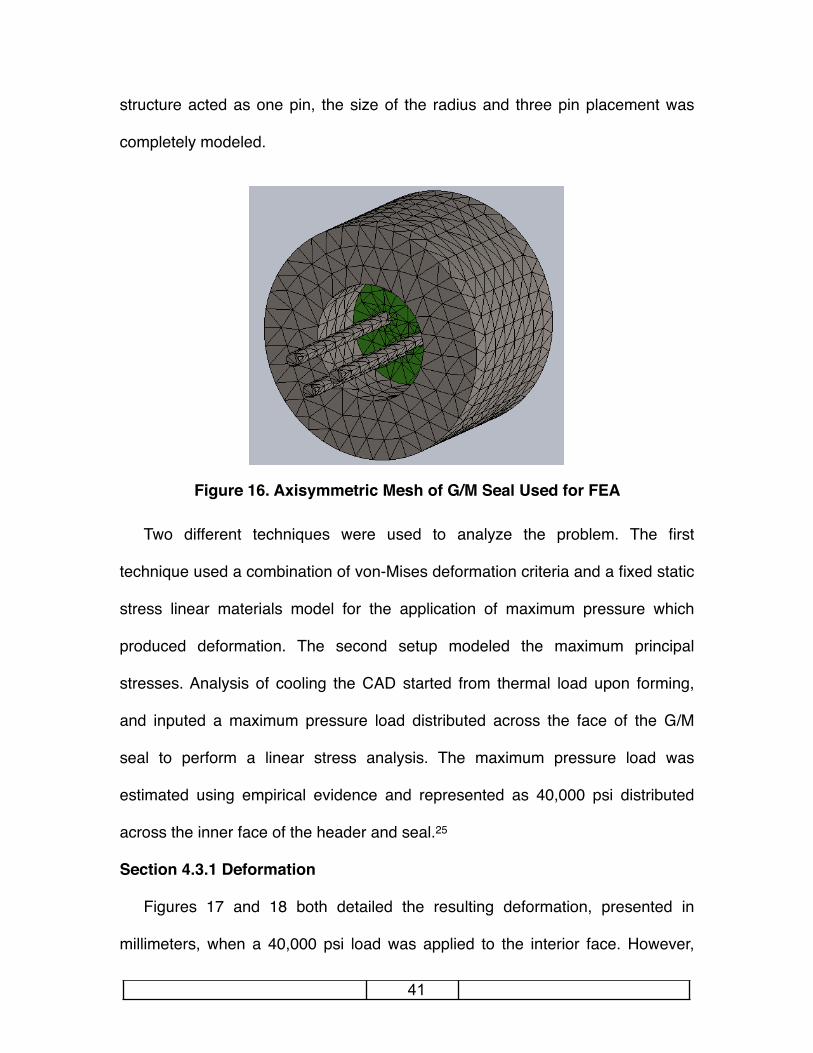
structure acted as one pin, the size of the radius and three pin placement was
completely modeled.
Figure 16. Axisymmetric Mesh of G/M Seal Used for FEA
! Two different techniques were used to analyze the problem. The first
technique used a combination of von-Mises deformation criteria and a fixed static
stress linear materials model for the application of maximum pressure which
produced deformation. The second setup modeled the maximum principal
stresses. Analysis of cooling the CAD started from thermal load upon forming,
and inputed a maximum pressure load distributed across the face of the G/M
seal to perform a linear stress analysis. The maximum pressure load was
estimated using empirical evidence and represented as 40,000 psi distributed
across the inner face of the header and seal.25
Section 4.3.1 Deformation!
! Figures 17 and 18 both detailed the resulting deformation, presented in
millimeters, when a 40,000 psi load was applied to the interior face. However,
41
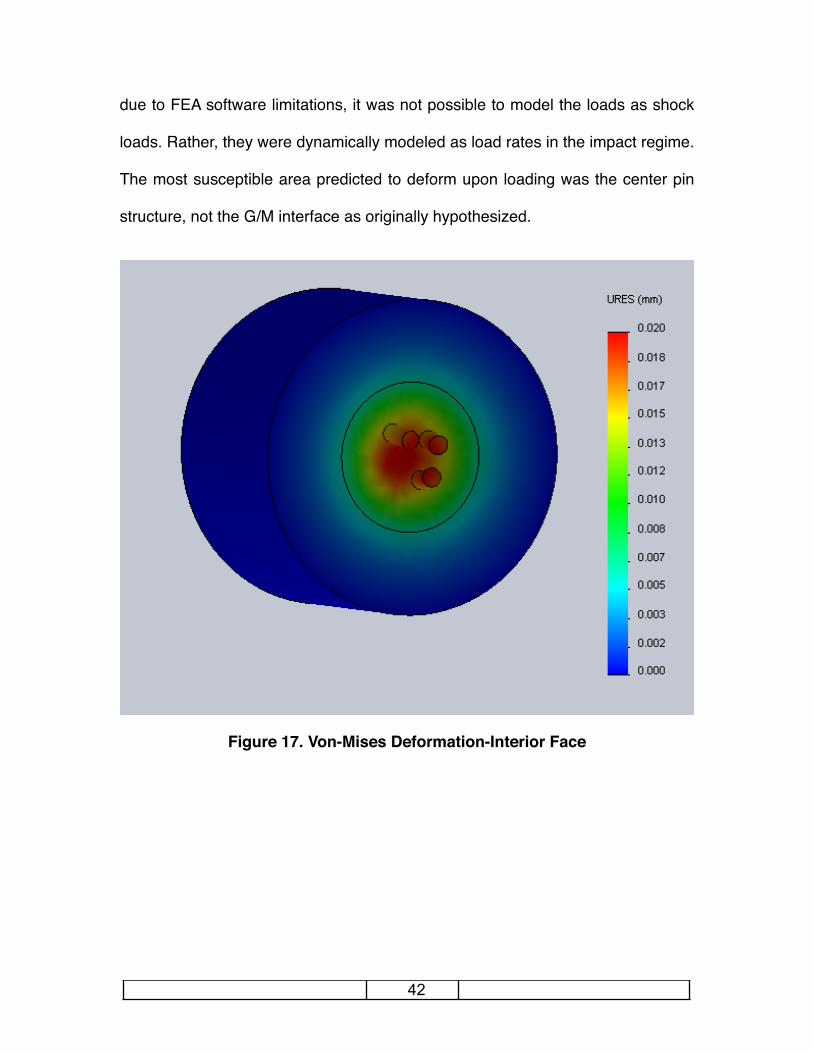
due to FEA software limitations, it was not possible to model the loads as shock
loads. Rather, they were dynamically modeled as load rates in the impact regime.
The most susceptible area predicted to deform upon loading was the center pin
structure, not the G/M interface as originally hypothesized.
Figure 17. Von-Mises Deformation-Interior Face
42
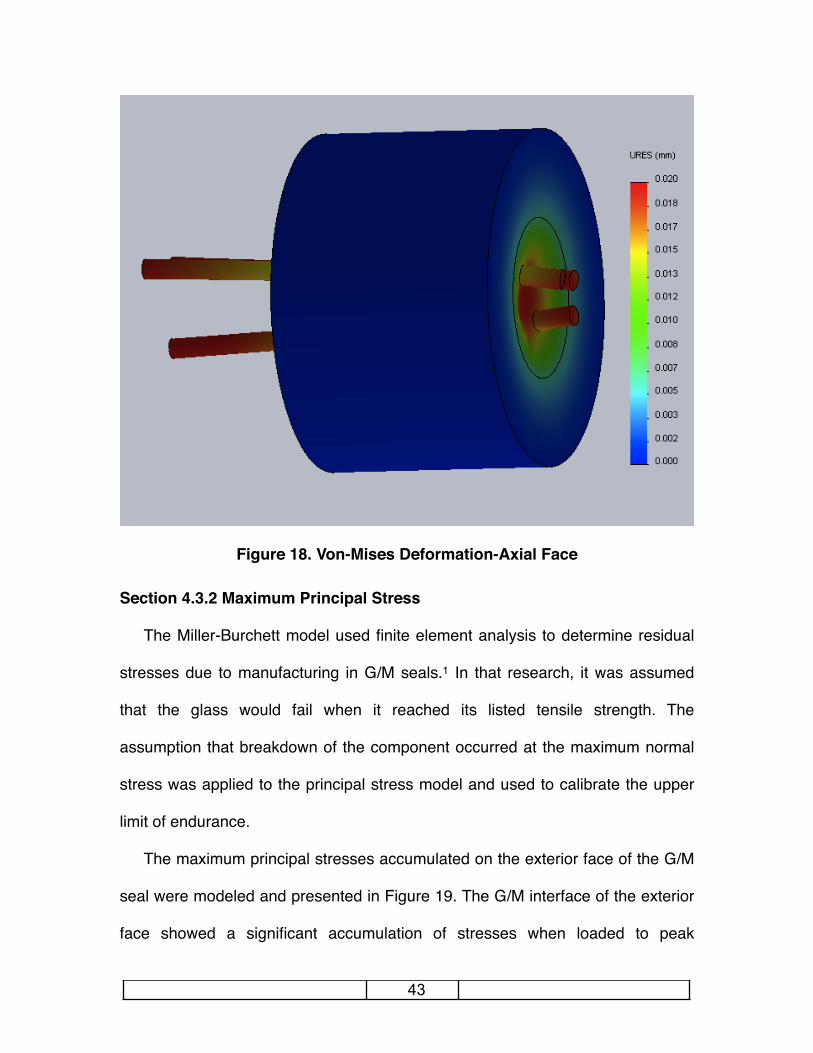
Figure 18. Von-Mises Deformation-Axial Face
Section 4.3.2 Maximum Principal Stress
! The Miller-Burchett model used finite element analysis to determine residual
stresses due to manufacturing in G/M seals.1 In that research, it was assumed
that the glass would fail when it reached its listed tensile strength. The
assumption that breakdown of the component occurred at the maximum normal
stress was applied to the principal stress model and used to calibrate the upper
limit of endurance.
! The maximum principal stresses accumulated on the exterior face of the G/M
seal were modeled and presented in Figure 19. The G/M interface of the exterior
face showed a significant accumulation of stresses when loaded to peak
43
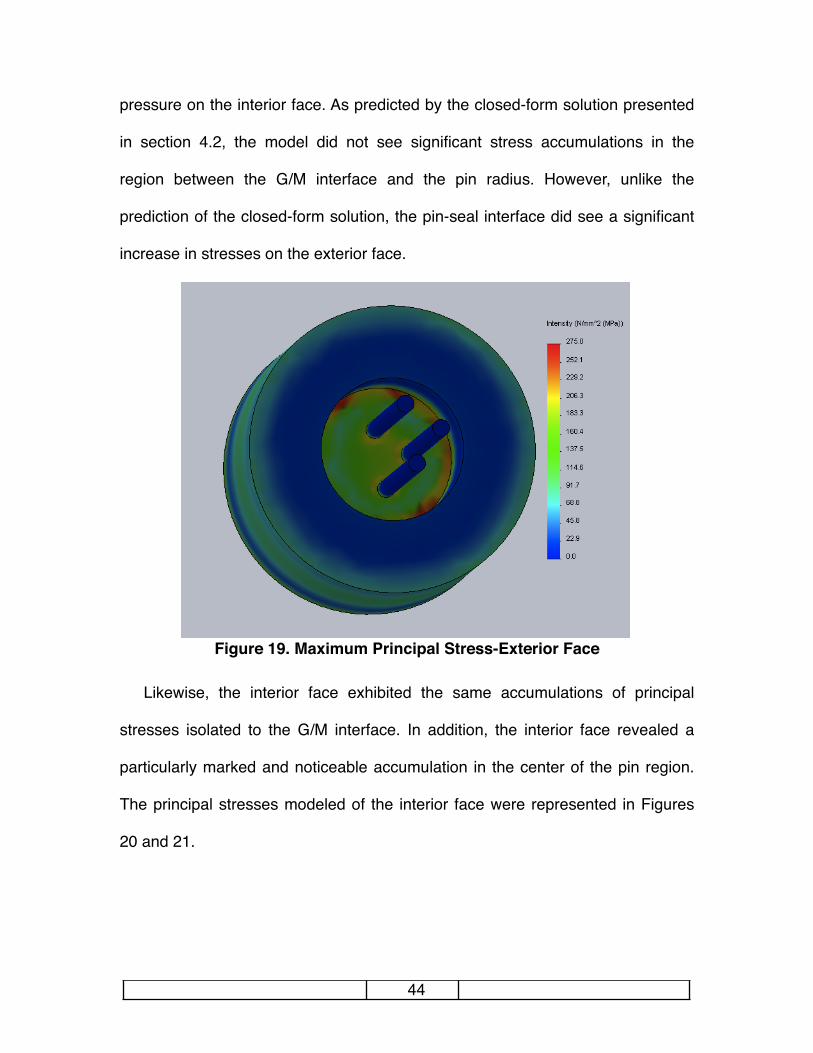
pressure on the interior face. As predicted by the closed-form solution presented
in section 4.2, the model did not see significant stress accumulations in the
region between the G/M interface and the pin radius. However, unlike the
prediction of the closed-form solution, the pin-seal interface did see a significant
increase in stresses on the exterior face.
Figure 19. Maximum Principal Stress-Exterior Face
! Likewise, the interior face exhibited the same accumulations of principal
stresses isolated to the G/M interface. In addition, the interior face revealed a
particularly marked and noticeable accumulation in the center of the pin region.
The principal stresses modeled of the interior face were represented in Figures
20 and 21.
44
Figure 20. Maximum Principal Stress-Interior Face and Axial Face
Figure 21. Maximum Principal Stress-Interior Face
45
SECTION 4.4 CONCLUDING THOUGHTS
! By determining the correct design proportions through the closed-form
solutions, and utilizing the deformation and maximum principal stress models, the
likely path of failure was illustrated as not being isolated to the G/M interface, as
originally hypothesized. The closed-form solution was limited to coaxial signle-pin
G/M seal models. When the pin structure was computationally modeled as three
separate pins, the deformation model predicted a highly deformable region in the
center of the pin structure. The maximum principal stress model also predicted
the region that produced the most stresses was located in the central pin region.
! Instead of failing at the G/M interface, it was anticipated, based on
computational models, that as the seal deforms under the pressure, the center of
the glass seal bulges and produces an area of increased tensile forces between
the pin structure. As deformation intensified, the axial friction forces that hold the
pin in place were overcome by the tensile radial forces along the pin, which
resulted in the pin/glass interface cracking. Once the pin/glass interface cracked,
deterioration of the entire G/M seal was imminent.
46
Chapter 5. SHOCK LOADING
SECTION 5.1 INTRODUCTION
! G/M seals that are used for the construction of CADs must meet very specific
design criteria. They must provide sufficient hermeticity from the surrounding
environment as well as maintain stable containment of highly reactive and
corrosive materials used internally for detonation. The electrical properties of the
seal must be sufficiently insulating to prevent the shorting of electrical feed-
through components to the housing. The G/M seals used for CAD construction
must be sufficiently strong to survive shock loading during detonation and
compact enough to meet stringent size restrictions.
! The goal of this chapter was to produce an understanding of the failure
events of G/M seals that are exposed to shock loading or high-strain rate loading
forces. Empirically, this was accomplished by high speed video recording
overload failures of G/M seals during a detonation event. More specifically, shock
loading is loading by a stress wave of energy that propagates through the
medium at velocities higher than acoustic waves.22 The ability of a material
system to respond to this form of loading is uniquely controlled by its stress-
volume response or equation of state. Shock loading can even produce
irreversible freezes in some of the microstructural changes.14
47
SECTION 5.2 NONLINEAR SHOCK WAVE
! Chapter 3 described mechanical testing of a G/M seal that produced impact
energy below the regime of shock. The energy waves were in the acoustic range,
limited by the speed of sound which travels at approximately 345 m/s through air.
Acoustic waves produce a time lapse between the time the wave is generated
and the instant the wave is detected, due to light traveling at 3 x 10⁸ m/s and
sound traveling at 345 m/s.22 This property is called the causality of the wave and
the speed is termed the finite velocity of the wave. Laplace first understood that
waves of energy in the acoustic range not only caused the pressure to oscillate,
but the temperature as well. This is called the stress wave, where two forces act
together upon a material environment.22
! The experiments of Chapter 3 produced energy waves that were linear. The
waves did not interact with each other and could be represented by a linear
system of equations. Yet, for the regime of shock loading the waves are nonlinear
and contain powers of variables or products of one variable with another, rather
than linear products of variables and constants. The waves interacted with one
another to intensify or weaken the overall effect.
! Simple mechanical understanding alone does not unify the response of these
nonlinear waves. The principal form of a nonlinear wave is termed the simple
wave and is a single non-linear compression wave, rarefaction wave or both and
evolves into discontinuous jumps in velocity and stress due to material
responses. The term shock wave was developed to include both the thermal field
48

and mechanical field produced by non-linear waves and energy is the unifying
concept that connects these two fields.14
! The testing method developed in Chapter 5 produced a stark contrast to the
form of energy exhibited during impact loading. Previously, weak waves caused
changes in stress-strain and to a lesser extent temperature. These material
changes were mostly small and reversible due to their elastic nature. In contrast,
the shock waves in this chapter potentially caused irreversible changes in both
properties and microstructure.14
SECTION 5.3 IDENTIFICATION OF TEST METHOD
! Test methodology was developed to direct the energy of a shock load from a
pyrotechnic event into a G/M seal.
! Units were constructed in typical fashion as CADs. They were loaded with a
charge, bridge wire assembly, and G/M seal; the opposite end was sealed with
an inner flier plate or burst disc. Figure 22 showed a typical brass burst disc on
lower assembly and G/M seal with ignition wire protruding on upper assembly.
Figure 22. Typical CAD Assembly
49
! The CAD was fitted with an isolation cap on the operational or flier plate end.
Immobilization of the operational end prevented the unit from functioning and
releasing the burst disc energy. All energy, when detonated, was exerted equally
in all directions, including against the G/M seal, with the exception of the minute
amount of energy absorbed by the isolation cap. Typical CAD housing and
isolation cap that was screwed onto housing were presented in Figure 23.
Figure 23. CAD and Isolation Cap
! Tests were carried out within the solid containment chamber shown in Figure
24. CAD units were fixed to the bottom of the chamber and detonated parallel to
the plywood observing window. A Motion Pro series high speed video camera
was positioned perpendicular to the axis of CAD firing. The camera was
electronically triggered to begin recording at 90,000 frames per second the
moment the electrical signal triggered the CAD and several nano seconds before
the unit detonated.
50
Figure 24. Detonation Test Chamber
! Image data collected sequentially, Figures 25-28, documented the failure
sequence of a G/M seal undergoing shock loading and analyzed in detail in
section 5.4. The camera was aligned to capture movement starting on the left
edge of view area advancing toward the right. Movement of one of the G/M seal
pins was measured and recorded in Table 3. Additionally, pin-through-air
displacements, velocity, and acceleration were calculated from the video time
stamps and were recorded in Table 3.
51
Figure 25. Shock Load High Speed Photo-Time Stamp 0.000162 s
Figure 26. Shock Load High Speed Photo-Time Stamp 0.000187 s
Figure 27. Shock Load High Speed Photo-Time Stamp 0.000212 s
52
Figure 28. Shock Load High Speed Photo-Time Stamp 0.000237 s
Figure 29. Shock Load High Speed Photo-Time Pin Failure
FigureTime [s]
Displacement [m]
Velocity [m/s]
Acceleration [m/s2]
25 0.000162 0 0 -
26 0.000187 0.00279 110 -
27 0.000212 0.00914 250 5.69 x 10⁶
28 0.000237 0.03302 955 28.04 x 10⁶
Table 3. Pin Displacement, Velocity, and Acceleration
53
! Pressure data was collected to determine the force produced from detonation
of a CAD unit by means of a closed-bomb test.[8] The closed-bomb test consisted
of a CAD unit which was detonated and a burst disc that released energy into a
fixed chamber. The fixed chamber was of a known volume and fitted with a
pressure sensor, shown in Figure 30. During the closed-bomb test, G/M seals
were not tested to destruction and all survived. Shock energy exited the CAD
through the burst disc and was recorded in the form of pressure data.
CHAMBERLoad
Pressure Sensor
G/M Seal
Figure 30. Close Bomb Test Configuration
! Typical data collected was represented in Figure 31 and plotted as force [psi]
with respect to time [s]. The lower portion of Figure 31 was enhanced to show
time from 0.009s to 0.015s and better described the peak pressure recorded.
Table 4 recorded the pressure test results from the CAD units: maximum
pressure, time from electrical short to maximum load, time from maximum
pressure to resonate pressure of 500 psi. Additionally, the force exerted against
54
[8 ] Testing was performed by and results courtesy of Glen Stichling.
the G/M seal was calculated by multiplying pressure by the area of the glass seal
and recorded in Table 4.
Figure 31. Typical Pressure Trace of CAD Detonation 25(Courtesy of CAD Inc.)
Test Max Pressure
[psi]
Time (0 to Peak Pressure)
[s]
Time (Peak Pressure to
500 psi) [s]
Force on Seal[lb]
1 4565.43 0.000203 0.2542 225.9887852 3906.25 0.000258 0.454244 193.3593753 6054.65 0.000203 0.4481 299.7051754 6494.14 0.00018 0.45072 321.459935 4941.45 0.000086 0.54902 244.6017756 4638.67 0.00015 0.4241 229.6141657 5502.90 0.00016 0.5142 272.393558 4921.80 0.0002 0.289 243.6291
Table 4. Closed-Bomb Pressure Data 25(Courtesy of CAD Inc.)
55
! The averages and standard deviation were calculated for Table 4 and are
presented in Table 5.
Max Pressure [psi]
Max Pressure [psi]
Time(0 to Peak Pressure)
[s]
Time(0 to Peak Pressure)
[s]
Time (Peak Pressure to
500 psi) [s]
Time (Peak Pressure to
500 psi) [s]
Force on Seal[lb]
Force on Seal[lb]
AVG STD AVG STD AVG STD AVG STD5128.16 844.435 0.00018 0.00005025 0.422948 0.10213696 253.844 41.79952
Table 5. Average CAD Closed-Bomb Data
SECTION 5.4 FINDINGS
! Data presented in Table 5 aided in gaining a clearer understanding of the
forces the G/M seals can withstand during shock loading. Nevertheless, the
column reported as ʻForce on Sealʼ can be misleading. The value reported in
Table 5 included the pressure inside the closed-bomb the instant after pressure
was released from the inside the CAD. The maximum pressure seen by the G/M
seal was therefore not 253.844 pounds as reported in Table 5. Instead, the
maximum force was calculated the instant before rupture of the burst disc by
Boyleʼs Law according to equation [2].
! P1V1=PT(V1+V2)! ! ! ! ! ! ! ! [2]
! Equation 2 was used to determine the correct pressure inside the CAD the
instant before rupture and was found to be 46,360 psi ± 7,600 psi at 68%
confidence interval. When the pressure was multiplied by the area of the G/M
seal, it yielded a force of 2,290 pounds ± 370 pounds at 68% confidence interval,
without failure of the seal.
56
! Furthermore, the force load acquired when compared with the values
obtained in Chapter 3 for impact loading were in close agreement.
Notwithstanding, there were some limitations associated with extrapolating the
method and results of Chapter 3 to those of the closed-bomb pressure test of
Chapter 5. The major limitations were presented as follows.
! Limitation (1). Mechanical impact testing performed with the methodology of
Chapter 3 produced shear loading isolated to the interface. Under this loading
method, it was impossible for the center of the seal to fail or bulge as predicted
by the FEA model. Shock loading produced a pressure that acted equally across
the entire exposed inner surface of the G/M seal.
! Limitation (2). Shock waves produced thermal and pressure forces and were
unified into an energy term. The test methodology of closed-bomb testing did not
record thermal effects. In order to properly describe the entire event of shock
loading, the thermal response must be established.
! Limitation (3). The pressure recored during closed-bomb testing is an indirect
measurement of the event after actuation of the device. The pressures recorded
do not reflect any losses due to ignition or the actual force inside the CAD prior to
detonation. It was unknown the losses of energy that occurred between the
instant prior to overload of the burst disc and after failure.
! Limitation (4). The impact test prescribed in Chapter 3 was an overload test
and complete failure of the G/M seal occurred. Closed-Bomb testing did not
produce overload failure of the G/M seal. Instead, the CAD is loaded based on
57

industrial experience to a known threshold that did not produce pressures
sufficient to result in failure of the G/M seal.
! Limitation (5). The effect of the closed-bomb housing in which the CAD was
inserted, acting as a thermal sink was unknown. The volume of the CAD unit in
comparison to the closed-bomb chamber was significantly different. At shock
loading rates, any significant expansion or limitation thereof could have produced
major changes in the production and absorption of energy.
! Although these limitations exist, the maximum load produced by pure shear
impact loading approximated the total load recorded during shock loading.
Nevertheless, a global assumption that mechanical impact loading results can be
extrapolated to shock loading conditions was outside the scope of this thesis.
Further extrapolation or comparison of the maximum measured loads between
force load rate or untested conditions elsewhere are subject to error.
! To the knowledge of the author, the exact duration of a CAD detonation has
never been measured. From the video evidence, it was successfully found to go
from initial electrical pulse to total release of energy in 0.82 µsec. This solitary
value, coupled with the addition of even being able to collect video data, was an
impressive finding and accomplishment. At first, it was hypothesized it would be
impossible to capture any video data as the inertia of the G/M seal upon overload
would be exceeded by the production of light energy and the video would be
saturated and unable to visually record any data. Meaning, the inability to capture
visual data would be limited by the causality of the wave, and the speed would
overcome the finite velocity of the wave, much like the doppler effect. Yet data
58
was successfully collected and an initial velocity of the pin-through-air was
recorded in Table 3 to be 955.04 m/s and accelerating at 28.04 x 10⁶ m/s2. !
! Perhaps the most crucial still frame collected occurred in Figure 29. Again, to
the knowledge of the author, the exact failure mode of a G/M seal resulting from
shock forces had never been recorded. Figure 29 provided concrete evidence for
predictions of the FEA models, showing pin interface weakness. Both Figure 28
and 29 emulated the ejection of a pin the instant before total failure of the glass
occurs. Testing of the G/M interface alone did not provide sufficient data to
describe failure of G/M seals during shock loading.
! Most likely the failure sequence is as follows. First, the bridge wire ignited the
material as shock forces moved through the pyrotechnic. The equation governing
density and volume is altered and a traditional explosion event occurs. Second, a
massive amount of energy build-up occurred at the face of the G/M seal. The
sudden change in pressure and thermal energy degraded the properties of the
seal. In chapter 3, an increase of thermal energy lowered the overall strength. As
for the case of shock loading, adiabatic changes in the material did not allow
energy absorption as there was not sufficient time for a change in viscosity or
nucleation of a phase transformation to occur. Third, due to an inability to absorb
thermal energy, pressure became the primary driving force and bulged the glass
outward. The sudden change in loading on the seal resulted in a change of
stress state of the glass, and forces which were once compressive were
overcome. Finally, when sufficient tensile forces along the pin developed axially
and radially, the friction forces of the pin interface were overwhelmed and the pin
59
was ejected. This was also evidenced by the pressure response seen in the
enhanced portion of Figure 31. The pressure trace exhibited a build up of force
until the friction forces were first matched, followed a small sudden dip as the pin
yielded, then increased again until maximum load and total failure occurred.
Ultimate failure of the seal was imminent the instant after pins were
compromised. During this form of loading, no materials remained for postmortem
analysis and no glass remained bonded to the header.
SECTION 5.5 CONCLUDING THOUGHTS
! High speed video data was successfully captured of a CAD during shock
overload failure. Examination of high speed video yielded a qualitative
understanding of the failure sequence of a G/M seal during a CAD overload
event. Data proved the initial point of failure originated from the electrical pin and
not the G/M interface. Closed-Bomb pressure test results were analyzed, and
forces experienced by the G/M seal were found and compared to data collected
during shear impact loading of the G/M interface.
! The weaknesses predicted by the design FEA model of Chapter 4 were
qualitatively confirmed. Furthermore, velocity and acceleration of a pin moving
through air ejected from a G/M seal structure was calculated, as well as the
duration of the overall event from electrical impulse to breakdown.
! Overall, this work demonstrated the importance of understanding nonlinear
phenomena and the effects caused during failure of a G/M seal. It is important
that both event duration and energy magnitude be considered necessary for
60
defining the failure characteristics of CADʼs G/M seals. This work has provided
evidence that future design considerations should not be based solely on simple
static pressure overload testing.
61

Chapter 6. CONCLUSIONS
! Accomplishing the objectives presented in chapter 1 support the hypothesis
that significant design considerations can be gained from the observed empirical
failure sequence. As a result, the empirical study also sought to improve the
overall structural performance of G/M seals used for CAD construction.
! Impact testing performed in chapter 3 sought to examine the weaknesses of
the G/M interface during shear loading. Typical design characteristics, stress
states, and hermeticity were defined based upon industry prescribed standard
practices. A standard glass seal, with no pins, was modeled which reflected the
principal stress effect along the G/M interface when cooled below the annealing
point upon forming.
! The G/M interface was first theorized to be the most probable location of
failure, due to the accumulation of stresses found as the metal header contracted
upon cooling. Peak shear load, recorded from the mechanical drop weight impact
test, at room temperature and 300°F was 2,412 pounds and 1,456 pounds,
respectively. In addition, the resulting shear stress was calculated at room
temperature and 300°F, resulting in 117 MPA and 71 MPA, respectively. Next, the
resulting unload curves were integrated. The impulse or change in momentum
upon overload failure was determined. The room temperature sample produced
62
two times the change in resulting momentum, or rather absorbed twice the
impulse, upon overload failure as compared to the G/M seal tested at an
elevated temperature. Finally, a high speed video was collected at 14,000 frames
per second. Analysis of these still frames recorded the unzipping of the meniscus
and empirically documented the failure sequence.
! Closed-form Finite Element Analysis (FEA) solutions were evaluated in
chapter 4 for the design configuration of the tested CAD G/M seal evaluated by
impact and shock loading test. The three pin structure was modeled as a single
coaxial pin with the radius of the coaxial pin sized to the radius of the three pin
core structure. The CAD geometry investigated proved to satisfy the thickness
and radial distances prescribed by the Glass Geometry Ratio (GGR) method, as
well as the multiple pin placement guidelines provided by Tekna Seal®. Two fully
computational models were completed utilizing both the von-Mises deformation
criteria and maximum principal stress definitions. The generated three-
dimensional models revealed a highly susceptible region in the axial core of the
pin placement prone to bulging deformation with an extreme concentration of
stresses.
! Shock loading conditions were successfully high speed video recorded at
90,000 frames per second in chapter 5. During pressure overload, video analysis
revealed that the G/M seal failed at the pin-seal interface; contrary to the original
hypothesis that failure would occur at the G/M interface, which was tested in
chapter 3. In addition, the total duration of a CAD detonation event was recorded
as 0.82 µsec from initial electrical impulse to maximum pressure or overload
63
failure. Furthermore, the velocity and acceleration of the discharged pin-through-
air were calculated as 955 m/s and 28.04 x 10⁶ m/s2, respectively. Shock load
testing culminated with a defined breakdown sequence of a G/M seal during
overload failure.
! During shock loading, the total force seen was calculated as 46,000 psi or
2,250 pounds, and the peak pressure load was in close agreement with the
impact test results. However, a global assumption that mechanical impact loading
results can be extrapolated to shock loading conditions was outside the scope of
this thesis and several limitations were outlined. Further extrapolation or
comparison of the maximum measured loads between force load rate or untested
conditions elsewhere are subject to error.
! In order to develop an exact failure analysis, as well as completely confirm
the exact path of failure, additional work is recommended to be focused at the
G/M interface and glass-pin interface. These recommendations should be based
on advanced interface characterization through the use of high power
microscopy, X-ray diffraction, and electron backscatter diffraction. A complete
quantitative characterization of the interface is needed in order to support the
empirical findings of this thesis. Finally, further work is needed to determine if
optimum mechanical and chemical adhesion was reached concerning the G/M
seals in question of this thesis.
64
BIBLIOGRAPHY
[1] Burchett, S. N. and J. D. Miller. Some Guidelines for the Mechanical Design of Coaxial Compression Pin Seals. Sandia National Laboratories, Albuquerque, NM. NTIS SAND82-0057. 1988.
[2] A. Selcuk and A. Atkinson; Mechanical Strength of Glass-To-Joints. 3rd European SOFC Forum. pp. 211.1998.
[3] M. Hida, Y. Takemoto, and Zhi-Yi Song. Characterization of Glass/Steel Interfacial Zone. Journal of Materials Science. v 15. pp. 1669-1673. 1996.
[4] Borom, Marcus P., Joseph A. Pask. Role of “Adherence Oxides” in Development of Chemical Bonding at Glass-Metal Interfaces. Journal of The American Ceramic Society. v 49, n 1, pp. 1-10. Jan. 1966.
[5] Burchett, Steven N. Robert S. Chambers. Extensions of “Some Guidelines for the Mechanical Design of Coaxial Compression Pin Seals.” Sandia National Laboratories, Albuquerque, NM. NITS SAND93-0306. 1993.
[6] Fredriksson, P. (Department of Solid Mechanics, KTH Engineering Sciences, Royal Institute of Technology, SE-100 44 Stockholm, Sweden); Gudmundson, P., Modelling of the interface between a thin film and a substrate within a strain gradient plasticity framework. Journal of the Mechanics and Physics of Solids, v 55, n 5, pp. 939-955, May 2007.
[7] Lau, C.W. (Drexel Univ, Philadelphia, PA, USA); Rahman, A.; Delale, F. Interfacial Mechanics of Seals. ASME Mater Div Publ MD, v 4, pp. 89-98, 1987.
[8] Chandra, N. (Department of Mechanical Engineering, Florida State University, Tallahassee, FL , USA); Li, H.; Shet, C.; Ghonem, H. Some Issues In The Application of Cohesive Zone Models for Metal-Ceramic Interfaces. International Journal of Solids and Structures, v 39, n 10, pp. 2827-2855, May 2002.
[9] Ashby, M.F., Deformation of plastically non-homogeneous materials. Philos. Mag. v 21, pp. 399-424.1970.
[10] Gudmundson, P. A. Unified Treatment of Strain Gradient Plasticity. J. Plast. v 21, pp.1834-1854. 2004.
[11] Raj, R. (Dept. of Mech. Eng., Colorado Univ., Boulder, CO, USA); Saha, A.; An, L.; Hasselman, D.P.H.; Ernst, P.: Ion exchange at a metal-ceramic interface. Acta Materialia, v 50, n 5, pp. 1165-76, March 2002.
65
[12] Nordberg ME, Mochel EL, Garfinkel HM, Olcott JS. Strengthening by ion exchange. J Am Ceramic Soc.; v 47, n 5, pp. 215-219. 1964.
[13] Kunz, S.C. (Sandia Nat. Labs., Albuquerque, NM, USA); Loehman, R.E. Source: Thermal expansion mismatch produced by interfacial reactions in Glass-Ceramic to Metal Seals. Advanced Ceramic Materials, v 2, n 1, pp. 69-73, Jan. 1987.
[14] Grujicic, M. Multi-Length Scale Modeling of High-Pressure-Induced Phase Transformations in Soda-Lime Glass. Journal of Materials Engineering and Performance. v 20. n 7. pp.1144-1156. October 2011.
[15] Zerilli, F.J. (Head Div., Naval Surface Warfare Center, Indian Head, MD, USA); Armstrong, R.W. Dislocation mechanics based analysis of material dynamics behavior : enhanced ductility, deformation twinning, shock deformation, shear instability, dynamic recovery: Journal de Physique IV (Colloque), v 7, n C3, pp. 637-642, Aug. 1997. Web: 01 Nov. 2011 <http://hal.archives-ouvertes.fr/docs/00/25/53/93/PDF/ajp- jp4199707C3109.pdf>.
[16] Zerilli, F. J., and Armstrong, R. W., High Strain Rate Effects on Polymer, Metal and Ceramic Matrix Composites and Other Advanced Materials, edited by Y. D. S. Rajapakse and J. R. Vinson, The American Society of Mechanical Engineers, v. 48 pp. 121-126. New York, 1995.
[17] Frutschy, KJ, and Clifton, RJ, in US Army Solid Mechanics Symposium, Myrtle Beach, SC, 1996.
[18] Armstong, RW. Grain Size and Mechanical Properties-Fundamentals and applications. Edited by MA Otooni. Met. Res. Soc. Pittsburgh, PA. pp. 149ff. 1995.
[19] Murr, LE, Meyers, MA. Shock-Induced Deformation Twinning in Tantalum. Acta Mater. v 45. pp.157. 1997.
[20] Zener, C., and Hollomon, JH: J. App. Phys. v. 15. pp. 22 1944.
[22] Drumheller, D.S. Introduction to Wave Propagation in Nonlinear Fluids and Solids. Cambridge University Press. 1998.
[23] Borom, Marcus P. The Mechanical and Chemical Aspects of Glass Sealing. Glass Industry. v 59, n 3, p 12-14,16,21, March 1978.
[24] Thompson, Luke M. Thermal Stresses In Airbag Initiators. Thesis. University of Idaho, 2005. Print.
[25] Stichling, Glen C. Closed-Bomb Pressure Data. 2005. Raw data. Private Correspondence, Fairfield, NJ.
66
[26] "Glass Seal, Hermetic Seal, and Hermetic Feedthrough Design Guidelines from Tekna Seal, Inc." Glass-to-Metal Seal, Hermetic Seals & Hermetic Feedthrough Custom Manufacturer : Tekna Seal, Inc. Tekna Seal LLC. Web. 01 Nov. 2011. <http:// www.teknaseal.com/guidelines.html>.
[27] “Common Defects: Causes and Solutions” Glass Seal Preform Manufacturer : Elan Technologies. Web. 06 OCT 2011. <http://www.elantechnology.com/ information/technical-library/common-defects-causes-and-solutions.aspx>.
67
http://www.elantechnology.com/information/technical-library/common-defects-causes-and-solutions.aspx
http://www.elantechnology.com/information/technical-library/common-defects-causes-and-solutions.aspx

APPENDIX A. IMPACT TEST MACHINE DRAWINGS
Page Intentionally Left Blank
68

69
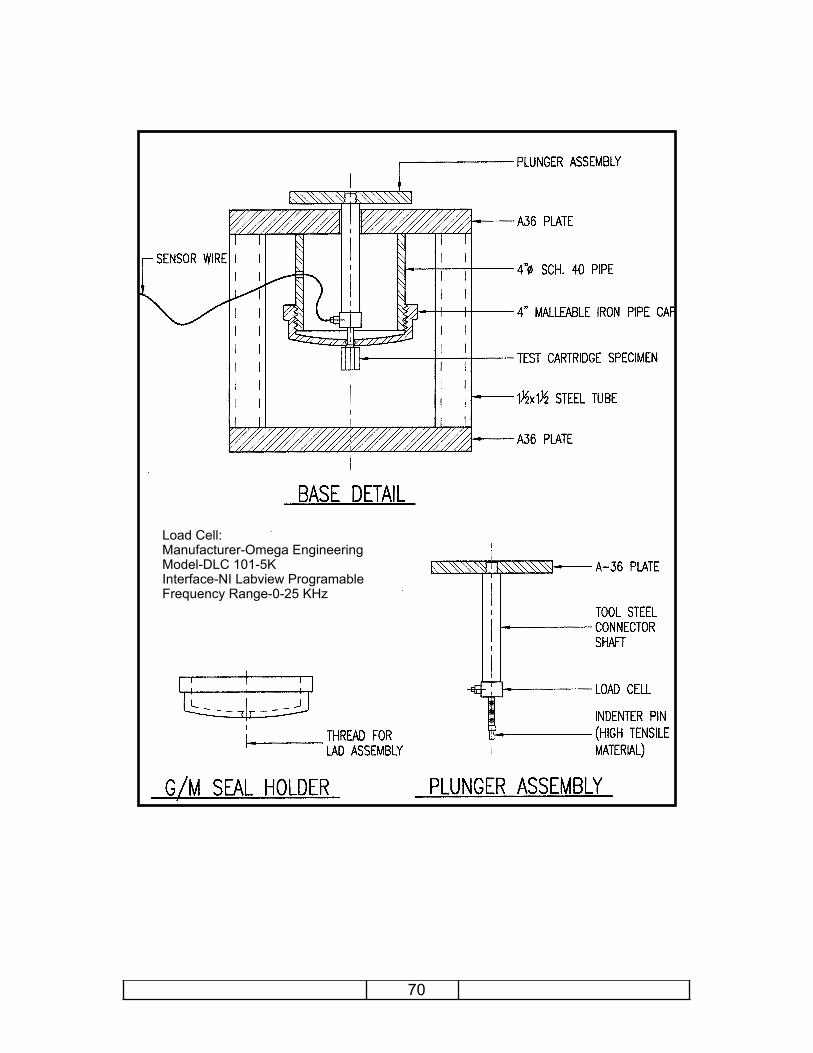
70
Load Cell: Manufacturer-Omega EngineeringModel-DLC 101-5KInterface-NI Labview ProgramableFrequency Range-0-25 KHz