
Empirical Example: Evaluating Job Training Program · assumes that the effect of job training in...
7
Empirical Example: Evaluating Job Training Program This is the last empirical example I show you. It is ultimate because it involves panel data, missing values, proxy variable, DID estimator, FE estimator, and entity-specific trend. I hope, after reading this long note, you can appreciate that econometrics is art. You have to be careful, and treat your empirical work as an art piece. A small touch can make a big difference. This example is like hot pot that you can taste in Sichuan China. We put a lot of (spicy) goodies in it. Enjoy this econometrics hot pot! 1
Transcript of Empirical Example: Evaluating Job Training Program · assumes that the effect of job training in...

Empirical Example: Evaluating Job Training Program
This is the last empirical example I show you. It is ultimate because it involves panel data,
missing values, proxy variable, DID estimator, FE estimator, and entity-specific trend. I
hope, after reading this long note, you can appreciate that econometrics is art. You have
to be careful, and treat your empirical work as an art piece. A small touch can make a big
difference.
This example is like hot pot that you can taste in Sichuan China. We put a lot of (spicy)
goodies in it.
Enjoy this econometrics hot pot!
1
Suppose we hope to evaluate the effect of a Michigan job training program on worker
productivity. The data file jobtrain.csv contains panel data for 157 companies from year
1987 to 1989. So the total observations are nT = 157 ∗ 3 = 471. There is a unique id (fcode)
for each company. We need this id and time variable (year) to structure the panel data.
The worker’s productivity is measured by variable “scrap”, which is the number of items,
per 100, that must be scrapped due to defects. The dummy variable “grant” equals one if a
company received a job training grant in a year.
As usual, we want to summarize data first after importing the data file. We notice that
scrap has only 162 observations. So there are missing values. Then we display the first 10
observations, and see dots for scrap in all of them. Next we try command
count if scrap!=.
and there are 162 observations (not companies) with non-missing scrap values. Not all of
those companies received grants. The command
list if grant==1&scrap!=.
shows that 19 companies received grant in 1988, and 11 received grant in 1989. None of
them received grant in 1987. Even though we have 157 companies, only 19 of them are in
treatment group in 1988, and 11 in 1989. The number of effective observations is small. We
cannot expect very precise estimate of the causal effect.
Next we run three OLS cross sectional regressions for year 1987, 1988, and 1989 respec-
tively.
reg scrap grant if year==1987
sum grant if year == 1987
reg scrap grant if year==1988
reg scrap grant if year==1989
The 1987 regression drops grant, because grant equals zero for all observations. The sum
command below confirms that. The intercept 4.61 in the 1987 regression is just the average
scrap in 1987. The coefficient -1.14 in 1988 regression indicates job training lowers scrap
rate, but insignificantly at 5% level. The 1989 regression has a positive 0.20 and insignificant
coefficient.
The insignificant result is expected. Recall theorem 3.2 in the textbook. Small SSTj leads
to big standard error and small t statistics. In this case the t-value of grant in 1989, 0.10, is
smaller (in absolute value) than 1988, -0.67, because the variation of grant in 1989 is smaller
than 1988. The commands below confirm that
2

sum grant if year == 1988&scrap!=.
sum grant if year == 1989&scrap!=.
tab grant if year == 1988&scrap!=.
tab grant if year == 1989&scrap!=.
Because grant is a dummy, the coefficient of grant is effectively the difference in means.
For instance, The coefficient -1.14 in 1988 regression can also be obtained by using commands
below
sort grant
ttest scrap if year==1988, by(grant)
Note that the p-value for one tailed test is half of that of two-tailed test.
The regression that uses cross section data can be biased, due to omitted variables such
as worker’s ability. There are several things we can do regarding the bias. First we can refer
to table 3.2 in the textbook and report the direction of bias. Second, we can try to find proxy
for those omitted variables. One easy proxy is the lagged dependent variable, see example
9.4 in the textbook. The idea is, there are some unobserved factors that affect last year, and
this year as well. Because we are using panel data, we need to generate panel-specific lagged
value, not overall lagged value. The commands are
sort fcode year
by fcode: gen scraplag = scrap[_n-1]
list if fcode==418011
reg scrap grant scraplag if year==1988
reg scrap grant scraplag if year==1989
If the key part “by fcode:” was dropped, you would get the unwanted overall lagged value
(try it). We display variables for the company 418011. The first observation of scraplag
is (and should be) missing value. Then we run the 1988 and 1989 regressions again, but
with the scraplag as the additional regressor (proxy for unobserved factors). Both new
regressions produce negative coefficients of grant (-.79 and -.57), with new p-values smaller
than old regressions without scraplag. scraplag is significant in both regressions. The R-
squared improves considerably, from 0.0086 in 1988 regression without scraplag to 0.8642
with scraplag. This is common. History tends to explain future a lot. That is why there
is a course called time series analysis that I may (proudly) teach. For this problem, proxy
variable does the trick.
3

We note that the coefficients of scraplag in two regressions are 0.86 and 0.88, close
to 1. If we subtract scraplag on both sides of regression, the left hand side is the first
difference of scrap, and the right hand side is intercept and grant (dummy). We get
difference-in-difference estimator!!
by fcode: gen dscrap = scrap - scraplag
* DID Estimator
reg dscrap grant if year==1988
reg dscrap grant if year==1989
sort grant
ttest dscrap if year==1988, by(grant)
ttest dscrap if year==1989, by(grant)
By using “by fcode:” we get panel-specific difference
∆scrapit = scrapit − scrapit−1.
We can apply ttest to ∆scrapit and get the same results. The DID estimates are -0.739
and -0.670 (both negative) in 1988 and 1989 regressions. The p-values for DID estimators
are smaller than the OLS estimator without grantlag. The DID estimator makes more sense
than OLS, since time-invariant unobserved factors have been controlled for.
We note the R-squared in the DID regression becomes much smaller. However, you can
not compare this R2 to the regression that uses scrap as the dependent variable. It is ok to
see decreasing R2 because the process of differencing has the side effect of minimizing signal
and maximizing noise. You learn more about this in time series course.
Smart guy A would ask, gee, what is the difference between DID estimator and first
difference (FD) estimator? To get the FD estimator, we need to get first lag and difference
of grant. There are two tricky issues here.
First, since no firms received grant prior to 1988, the first observation of grantlag should
be zero, not missing value.
sort fcode year
by fcode: gen grantlag = grant[_n-1]
replace grantlag = 0 if grantlag==.
gen dgrant = grant - grantlag
list if fcode==418011|fcode==419409
4
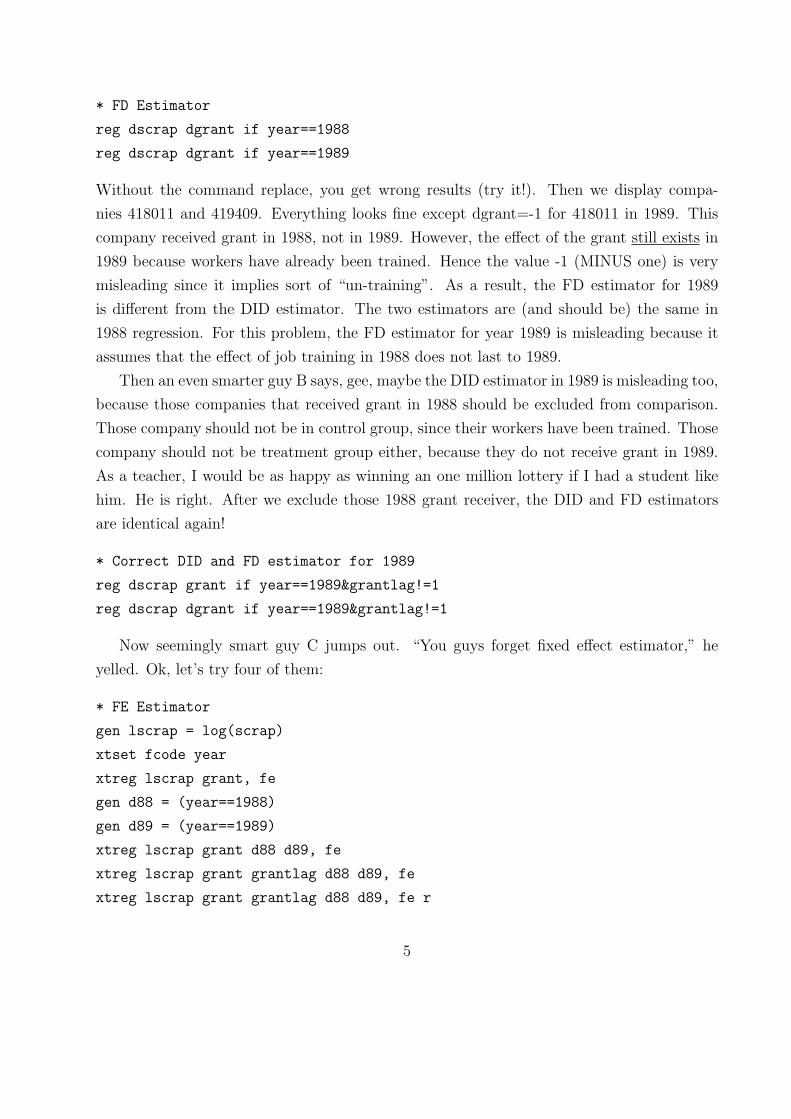
* FD Estimator
reg dscrap dgrant if year==1988
reg dscrap dgrant if year==1989
Without the command replace, you get wrong results (try it!). Then we display compa-
nies 418011 and 419409. Everything looks fine except dgrant=-1 for 418011 in 1989. This
company received grant in 1988, not in 1989. However, the effect of the grant still exists in
1989 because workers have already been trained. Hence the value -1 (MINUS one) is very
misleading since it implies sort of “un-training”. As a result, the FD estimator for 1989
is different from the DID estimator. The two estimators are (and should be) the same in
1988 regression. For this problem, the FD estimator for year 1989 is misleading because it
assumes that the effect of job training in 1988 does not last to 1989.
Then an even smarter guy B says, gee, maybe the DID estimator in 1989 is misleading too,
because those companies that received grant in 1988 should be excluded from comparison.
Those company should not be in control group, since their workers have been trained. Those
company should not be treatment group either, because they do not receive grant in 1989.
As a teacher, I would be as happy as winning an one million lottery if I had a student like
him. He is right. After we exclude those 1988 grant receiver, the DID and FD estimators
are identical again!
* Correct DID and FD estimator for 1989
reg dscrap grant if year==1989&grantlag!=1
reg dscrap dgrant if year==1989&grantlag!=1
Now seemingly smart guy C jumps out. “You guys forget fixed effect estimator,” he
yelled. Ok, let’s try four of them:
* FE Estimator
gen lscrap = log(scrap)
xtset fcode year
xtreg lscrap grant, fe
gen d88 = (year==1988)
gen d89 = (year==1989)
xtreg lscrap grant d88 d89, fe
xtreg lscrap grant grantlag d88 d89, fe
xtreg lscrap grant grantlag d88 d89, fe r
5

Here we use log scrap in order to compare to Table 14.1 in textbook. Now the coefficient
measures the percentage change in scrap rate. The first FE estimate is -.157 with p-value
0.207. This estimator has controlled for time-invariant unobserved factors (or company fixed
effect). In order to control for company-invariant unobserved factor (or time fixed effect),
we add the two (why not three?) yearly dummies d88 and d89. The second FE estimate
is -0.08 with p-value of 0.516. In order to allow for lagged effect of grant, the third FE
regression adds grantlag. The coefficient of grant is -0.25, and coefficient of grantlag is -
0.42. So obtaining grant in 1988 can lower scrap rate by about 22% (exp(-0.25)-1≈ -0.22)
in 1988, and lower scrap rate by 34% ((exp(-0.42)-1≈ -0.34) in 1989. This fact indicates
that job training does have lasting effect. Thus, the first and second FE estimates are both
misleading (by excluding grantlag). Finally we use option r to get the cluster-robust standard
error, which is unreported in Table 14.1. Both grant and grantlag have negative coefficients,
and are significant at 10% level, whether robust error is used or not.
Given the similarity between the DID and FE estimates, we can conclude that job training
program lowers scrap rate and enhances productivity, provided that grant is uncorrelated
with idiosyncratic error:
E(granti,t1ui,t2) = 0, ∀t1, t2 = 1, ...T (1)
To guard against the violation of above assumption, people try to include (ad hoc) company-
specific trend
scrapit = β0 + β1grantit + ai + ai ∗ t+ error (2)
⇒ ∆scrapit = β1∆grantit + ai + error (3)
The idea is to use the company-specific trend ai ∗ t to approximate some factors left in
idiosyncratic error. The last equation indicates that we should estimate the differenced
equation by fixed effect. The commands are
by fcode: gen dlscrap = lscrap - lscrap[_n-1];
xtreg dlscrap dgrant, fe;
areg dlscrap dgrant, absorb(fcode);
The new estimate is -0.035 with p-value 0.644. So grant has almost no effect. Given that we
have only three years, and not many effective observations, I would suggest not to take this
estimate seriously because it is very imprecise.
6

Ok. I am tired now. Please consider doing the following questions as exercise.
• Q1: please report the pooled OLS estimator
• Q2: please replace yearly dummy d88 and d89 with a linear trend, i.e., the model is
scrapit = β0 + β1grantit + ai + ct+ error
Report the FE estimator. Hint: you can get the trend by using
by fcode: gen trend = _n
• Q3: Consider the IV estimation of the differenced equation, and duplicate the result
reported in example 15.10 in the textbook.
7


