Emotion Recognition and Understanding Using EEG Data in A ...
Upload
maryam-alimardaniCategory
view
282download
1
186 IEEE TRANSACTIONS ON INFORMATION TECHNOLOGY IN BIOMEDICINE, VOL. 14, NO. 2, MARCH 2010
Emotion Recognition From EEG Using HigherOrder Crossings
Panagiotis C. Petrantonakis, Student Member, IEEE, and Leontios J. Hadjileontiadis, Member, IEEE
Abstract—Electroencephalogram (EEG)-based emotion recog-nition is a relatively new field in the affective computing areawith challenging issues regarding the induction of the emotionalstates and the extraction of the features in order to achieve op-timum classification performance. In this paper, a novel emo-tion evocation and EEG-based feature extraction technique ispresented. In particular, the mirror neuron system concept wasadapted to efficiently foster emotion induction by the process ofimitation. In addition, higher order crossings (HOC) analysis wasemployed for the feature extraction scheme and a robust classi-fication method, namely HOC-emotion classifier (HOC-EC), wasimplemented testing four different classifiers [quadratic discrim-inant analysis (QDA), k-nearest neighbor, Mahalanobis distance,and support vector machines (SVMs)], in order to accomplish ef-ficient emotion recognition. Through a series of facial expressionimage projection, EEG data have been collected by 16 healthy sub-jects using only 3 EEG channels, namely Fp1, Fp2, and a bipolarchannel of F3 and F4 positions according to 10–20 system. Twoscenarios were examined using EEG data from a single-channeland from combined-channels, respectively. Compared with otherfeature extraction methods, HOC-EC appears to outperform them,achieving a 62.3% (using QDA) and 83.33% (using SVM) classifica-tion accuracy for the single-channel and combined-channel cases,respectively, differentiating among the six basic emotions, i.e., hap-piness, surprise, anger, fear, disgust, and sadness. As the emotionclass-set reduces its dimension, the HOC-EC converges towardmaximum classification rate (100% for five or less emotions), justi-fying the efficiency of the proposed approach. This could facilitatethe integration of HOC-EC in human machine interfaces, such aspervasive healthcare systems, enhancing their affective characterand providing information about the user’s emotional status (e.g.,identifying user’s emotion experiences, recurring affective states,time-dependent emotional trends).
Index Terms—Electroencephalogram (EEG), emotion recogni-tion, higher order crossings analysis, k-nearest neighbor (k-NN),Mahalanobis distance (MD), mirror neuron system, quadratic dis-criminant analysis, support vector machines (SVMs) .
I. INTRODUCTION
D ESPITE the difficulty to give a precise definition of emo-tion, it is globally accepted that everyday activities, such
as social communication, decision-making, and fundamentaladaptation tasks are highly influenced by people’s moods anddistinct emotional states. Moreover, it is evidenced [1], [2] thatemotional intelligence, that is the ability to identify, assess, andmanage emotions of one’s self and of others, plays a crucial
Manuscript received December 23, 2008; revised June 30, 2009. First pub-lished October 23, 2009; current version published March 17, 2010.
The authors are with the Signal Processing and Biomedical Technology Unit,Telecommunications Laboratory, Department of Electrical and Computer Engi-neering, Aristotle University of Thessaloniki, GR 541 24 Thessaloniki, Greece(e-mail: [email protected]; [email protected]).
Digital Object Identifier 10.1109/TITB.2009.2034649
role in learning processes and particularly in the capability ofextracting the information that is most important. Furthermore,a number of studies by neuroscientists, cognitive scientists, andpsychologists have shown that emotion is of major importancein rational and intelligent thinking. More precisely, it has beenshown [3] that patients without emotional brain functioning hadsevere impairments in everyday activities that require rationaland intelligent behavior.
All the aforementioned findings have revealed the impor-tance of not only emotional intelligence in achieving personalaspirations but also in accomplishing aggregate attainments viahealthy social interaction; but what if interactions have to bebetween humans and machines? Nowadays, human–machineinteractions (HMIs) are a vital aspect of our technologically in-vaded life. In order to make this collaboration more efficient andpragmatic, machines should be equipped with the ability to iden-tify, understand, and integrate during the interaction phase theemotional needs of their human partner. There are circumstan-tial evidences from relative experiments [4] that human–humaninteraction (HHI) does not have significant differences fromHMI. As a result, it is apparent that if HMI has to be as effectiveas HHI, an inevitable need to instill machines with emotionalabilities emerges.
From a healthcare perspective, accounting for a patient’s emo-tional state is essential in medical care [5]. In fact, not only mayappropriate emotional state assessment be a key indicator ofthe patient’s mental or physical health status, but the powerof emotions themselves over the recovery process has also beendocumented [3]. In a tele-health scenario, clinicians should nec-essary focus to accurately assess patient’s emotional status toenhance his/her care. Collection of physiological signals andmapping of the latter to emotional states can synthesize thepatient’s affective information for the healthcare provider [6].Moreover, patients’ models, not only of the physical charac-teristics of the patients, but also models of their emotions canbe built, initiating a field of affective computing for tele-homehealth care applications [6]. Some examples in the latter include:the development of systems for monitoring and responding tohuman multimodal affect and emotions via multimedia andempathetic avatars; mapping of physiological signals to emo-tions and synthesizing the patient’s affective information for thehealthcare provider [6]; enhancement of behavioral patterns ofdaily activity using ontological models that embed the emotionalfactor, assisting diagnosis in conjunction to a person’s healthcondition [7].
Research has already been conducted toward effective HMIby implementing methods in order to recognize emotionsfrom face [8]–[10], voice [11]–[14], and data related to the
1089-7771/$26.00 © 2009 IEEE

PETRANTONAKIS AND HADJILEONTIADIS: EMOTION RECOGNITION FROM EEG USING HIGHER ORDER CROSSINGS 187
autonomous nervous system (galvanic skin response, heart rate,etc.) [15], [16]. Although, the performance of those emotionrecognition techniques appear to be efficient there is a numberof issues regarding their realization during the HMI interaction.For example, consider an HMI, where a human had to look di-rectly to the camera all the time or the possibility for a machineto recognize an emotion through voice in a noisy environment.Autonomous nervous system signals can overcome the afore-mentioned problems, yet they are significantly influenced byother factors whose effect is similar with an emotion-derivedone. For instance, perspiration due to physical activity ratherthan emotions would affect a galvanic skin response (GSR)-based emotion recognition system. Currently, few efforts havebeen initiated to recognize emotions with electroencephalo-gram (EEG)-based recognition systems by artificially elicitingemotional states. This approach eliminates the disadvantagesof the previous emotion recognition techniques as central ner-vous system signals are barely influenced by the aspects markedpreviously.
Toward such direction, the most prominent methods em-ployed statistical-based [17] and wavelet-based [18] analysisof EEG signals for feature extraction; combined with clas-sification methods (such as support vector machine (SVM)[19], fuzzy k-means [20], and fuzzy c-means [21]) theyhave resulted in moderate emotion recognition percentagesfor up to three [18], four [22], and five [17] distinct emo-tions. Despite the classification potential of EEG for suchkind of recognition reflected in the works reported in the lit-erature [17], [18], [22]–[24], further research is needed inorder to improve recognition rates and discover unknownaspects of emotion mechanisms performed in the humanbrain.
This paper describes the implementation of an EEG-based,user-independent emotion recognition system using a featureset drawn from higher order crossings (HOC) analysis [25].The latter reveals the oscillatory pattern of the EEG signal pro-viding a feature set that convey the emotion information to theclassification space, where different types of classifiers use suchemotion information to discriminate among different emotionstates. The classification efficiency of the proposed approach,namely HOC-emotion classifier (HOC-EC), is outlined fromthe experimental results by the application of the HOC-EC toEEG-datasets acquired from 16 healthy volunteers un-der emotion evocation with visual inputs (pictures withemotion-related facial expressions). This setup was moti-vated by the mirror neuron system (MNS) concept [26],which relates emotion induction with the process of im-itation. Compared with previous approaches, the HOC-ECis quite attractive due to its superiority in the emotionrecognition power for a combination of up to six distinctemotions.
The rest of this paper is structured as follows. Section IIprovides background information on the emotion elicitationtheme and describes the proposed analysis. The experimentaldataset used, alongside some realization issues are describedin Section III. Section IV presents the HOC-EC performancethrough experimental results, discusses its efficiency to address
the EEG-based classification problem and compares it with otherworks. Finally, Section V concludes the paper.
II. METHOD
A. Background
1) Emotions: Since different theories of how emotions ariseand been expressed exist, there is a variety of emotion modelsused in affective computing [27]. Inspired by the Darwinian the-ory, Ekman et al. proposed the universality of six facial expres-sions [28], i.e., happiness, surprise, anger, disgust, sadness, andfear. On the other hand, psychologists do not present emotionsas discrete states but rather as continuous ones and thereforedemonstrate them in an n-dimensional (n-D) space; usually the2-D valence/arousal space is adopted. Valence stands for one’sjudgment about a situation as positive or negative and arousalspans from calmness to excitement, expressing the degree ofone’s excitation. In this paper, the Ekman’s six universal emo-tions [28] were adopted, with the latter consisting the class-setof the discrimination analysis. The selection of these emotionswas based on the fact that this universal basis for emotionalexpression is considered a pancultural aspect of psychologicalfunctioning and is no longer debated in contemporary psychol-ogy [29].
2) Mirror Neuron System and Emotion Elicitation: Neuro-physiological experiments have demonstrated that when indi-viduals observe an action done by another individual seem tohave the same brain activity, as if they did the correspondingaction themselves [26]. Moreover, MNS has been connectedwith the ability of imitation, which also, among others, relatesto recognition of emotions by others’ face expressions and ges-tures [30]. Based on the MNS concept, the emotion elicitationprocess here was realized through Ekman’s pictures [31] shownto subjects as a distinct emotion stimulus. According to MNStheory, the subjects’ EEG signal is supposed to reflect the sameor akin brain activity, as when they are really overcome by thesame emotion.
According to Picard et al. [15], there are five factors thatshould be taken under consideration during the data collectionstage of an experiment designed to elicit emotions.
1) Subject elicited versus event elicited: Does subject pur-posefully elicit emotion or is it elicited by a stimulus orsituation outside the subject’s efforts?
2) Laboratory setting versus real world: Is subject in a labo-ratory or in a special room that is not their usual environ-ment?
3) Expression versus feeling: Is the emphasis on externalexpression or on internal feeling?
4) Open recordings versus hidden recordings: Does subjectknow that anything is being recorded?
5) Emotion-purpose versus other-purpose: Does subjectknow that the experiment is about emotion?
Until now, the emotion evocation process in EEG-based emo-tion recognition experiments was depended on projection ofphotos that picturize event or situations which are claimed toelicit certain distinct emotions or emotional states that fall withinthe aforementioned valence/arousal space [32]. Although the
188 IEEE TRANSACTIONS ON INFORMATION TECHNOLOGY IN BIOMEDICINE, VOL. 14, NO. 2, MARCH 2010
last four factors above seem to be relatively controllable dur-ing such experiments the first one raises issues concerning theemotional impact of such pictures to the subjects. Aspects likepersonality, personal experiences, and particular subject’s moodat the time that the experiment is conducted dramatically influ-ence the way someone emotionally reacts in the view of that kindof images. As a result, as soon as the emotion is inducted by astimulus outside the efforts of the subject, it is questioned howeffectively the emotion is actually evoked and, consequently,how representative the EEG activity is, with regard to a particu-lar emotion. This is addressed by replacing those pictures withothers showing humans expressing the six basic emotions, i.e.,happiness, surprise, anger, fear, disgust, and sadness; hence,according to the MNS theory [30], it is not expected from thesubject to actually feel the emotion but express the same or akinEEG activity as s\he had really experienced it.
B. Previous Classification Features
For comparison reasons, two other feature extraction tech-niques for EEG-based emotion recognition were implementedand applied to the acquired signals. These methods, based onstatistical values [17] and the wavelet transform [18], along withthe construction of the relevant feature vectors (FVS ), are furtherexplained in the following.
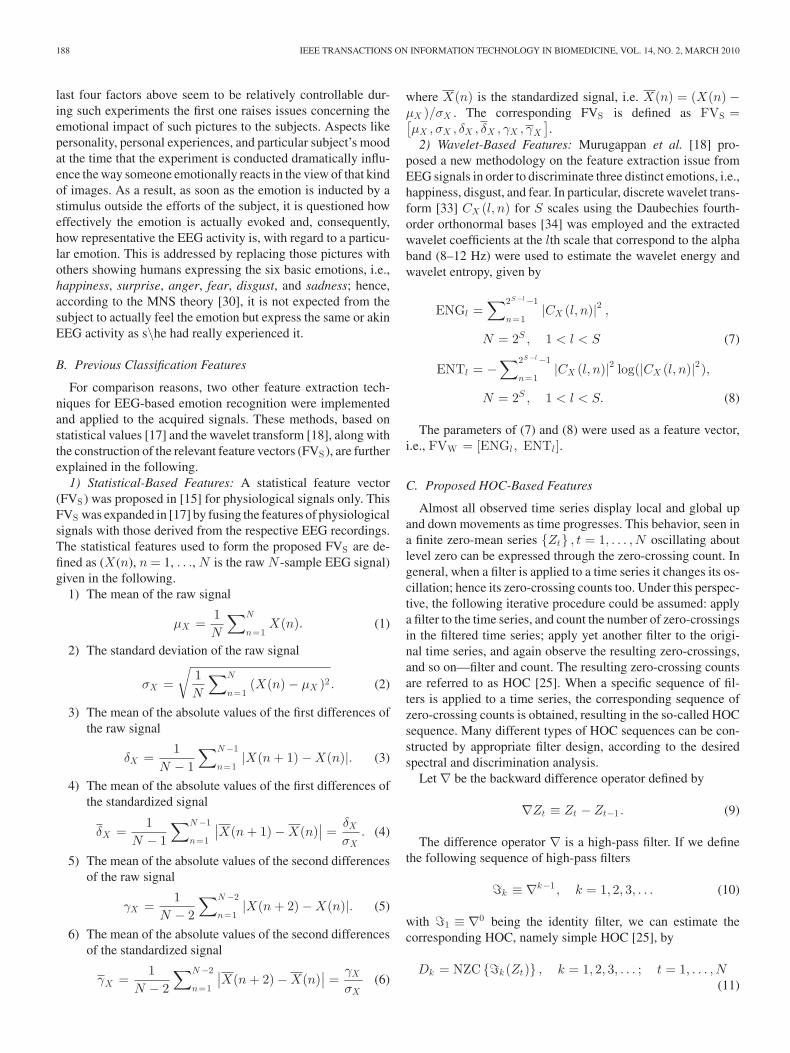
1) Statistical-Based Features: A statistical feature vector(FVS ) was proposed in [15] for physiological signals only. ThisFVS was expanded in [17] by fusing the features of physiologicalsignals with those derived from the respective EEG recordings.The statistical features used to form the proposed FVS are de-fined as (X(n), n = 1, . . ., N is the raw N -sample EEG signal)given in the following.
1) The mean of the raw signal
µX =1N
∑N
n=1X(n). (1)
2) The standard deviation of the raw signal
σX =
√1N
∑N
n=1(X(n) − µX )2 . (2)
3) The mean of the absolute values of the first differences ofthe raw signal
δX =1
N − 1
∑N −1
n=1|X(n + 1) − X(n)|. (3)
4) The mean of the absolute values of the first differences ofthe standardized signal
δX =1
N − 1
∑N −1
n=1
∣∣X(n + 1) − X(n)∣∣ =
δX
σX. (4)
5) The mean of the absolute values of the second differencesof the raw signal
γX =1
N − 2
∑N −2
n=1|X(n + 2) − X(n)|. (5)
6) The mean of the absolute values of the second differencesof the standardized signal
γX =1
N − 2
∑N −2
n=1
∣∣X(n + 2) − X(n)∣∣ =
γX
σX(6)
where X(n) is the standardized signal, i.e. X(n) = (X(n) −µX )/σX . The corresponding FVS is defined as FVS =[µX , σX , δX , δX , γX , γX
].
2) Wavelet-Based Features: Murugappan et al. [18] pro-posed a new methodology on the feature extraction issue fromEEG signals in order to discriminate three distinct emotions, i.e.,happiness, disgust, and fear. In particular, discrete wavelet trans-form [33] CX (l, n) for S scales using the Daubechies fourth-order orthonormal bases [34] was employed and the extractedwavelet coefficients at the lth scale that correspond to the alphaband (8–12 Hz) were used to estimate the wavelet energy andwavelet entropy, given by
ENGl =∑2S −l −1
n=1|CX (l, n)|2 ,
N = 2S , 1 < l < S (7)
ENTl = −∑2S −l −1
n=1|CX (l, n)|2 log(|CX (l, n)|2),
N = 2S , 1 < l < S. (8)
The parameters of (7) and (8) were used as a feature vector,i.e., FVW = [ENGl , ENTl ].
C. Proposed HOC-Based Features
Almost all observed time series display local and global upand down movements as time progresses. This behavior, seen ina finite zero-mean series {Zt} , t = 1, . . . , N oscillating aboutlevel zero can be expressed through the zero-crossing count. Ingeneral, when a filter is applied to a time series it changes its os-cillation; hence its zero-crossing counts too. Under this perspec-tive, the following iterative procedure could be assumed: applya filter to the time series, and count the number of zero-crossingsin the filtered time series; apply yet another filter to the origi-nal time series, and again observe the resulting zero-crossings,and so on—filter and count. The resulting zero-crossing countsare referred to as HOC [25]. When a specific sequence of fil-ters is applied to a time series, the corresponding sequence ofzero-crossing counts is obtained, resulting in the so-called HOCsequence. Many different types of HOC sequences can be con-structed by appropriate filter design, according to the desiredspectral and discrimination analysis.
Let ∇ be the backward difference operator defined by
∇Zt ≡ Zt − Zt−1 . (9)
The difference operator ∇ is a high-pass filter. If we definethe following sequence of high-pass filters
�k ≡ ∇k−1 , k = 1, 2, 3, . . . (10)
with �1 ≡ ∇0 being the identity filter, we can estimate thecorresponding HOC, namely simple HOC [25], by
Dk = NZC {�k (Zt)} , k = 1, 2, 3, . . . ; t = 1, . . . , N(11)

PETRANTONAKIS AND HADJILEONTIADIS: EMOTION RECOGNITION FROM EEG USING HIGHER ORDER CROSSINGS 189
where NZC {·} denotes the estimation of the number of zero-crossings and
∇k−1Zt =∑k
j=1
(k − 1j − 1
)(−1)j−1 Zt−j+1
with(
k − 1j − 1
)=
(k − 1)!(j − 1)! (k − j)!
(12)
In practice, we only have finite time series and lose an obser-vation with each difference. Hence, to avoid this effect we mustindex the data by moving to the right, i.e., for the evaluation of ksimple HOC, the index t = 1 should be given to the kth or a laterobservation. For the estimation of the number of zero-crossingsin (11), a binary time series Xt(k) is initially constructed givenby
Xt(k)
=
{1, if �k(Zt) ≥ 00, if �k(Zt) < 0 , k = 1, 2, 3, . . . ; t = 1, . . . , N
(13)
and the desired simple HOC are then estimated by countingsymbol changes in X1(k), . . . , XN (k), i.e.,
Dk =∑N
t=2[Xt(k) − Xt−1(k)]2 . (14)
In finite data records, it holds Dk+1 ≥ Dk − 1 [25]. In addi-tion, as k increases, the discrimination power of simple HOCdiminishes, since different processes yield almost the sameDk [25].
In this paper, HOC are used to construct the feature vector(FVHOC ), formed as follows:
FVHOC = [D1 ,D2 , . . . , DL ], 1 < L ≤ J (15)
where J denotes the maximum order of the estimated HOC andL the HOC order up to they were used to form the FVHOC (seefollowing section for its selection). It must be noted that the useof the HOC term throughout the subsequent sections, actuallyrefers to simple HOC. For an extended coverage of the HOC-based analysis of time series the reader is encouraged to consultKedem’s book [25].
D. Classification Processes and Setup
Four classification processes were employed in this paper.These are briefly described in the succeeding subsections fol-lowed by a description of the classification setup adopted.
1) Quadratic Discriminant Analysis (QDA): QDA [35], [36]is based on the quadratic discriminant function
dm (FV) = −12
log |Cm | − 12(FV − µm )T C−1
m (FV − µm )
+ log pm (16)
where m = 1,. . .,M corresponds to the number of classes, Cis the covariance matrix for each class, µ is a vector with themean values of each variable consisting the FV, and p is the
prior probability for each class. Assuming training and test setsas proportions of the initial dataset, the covariance matrices Cm ,m = 1, . . ., M and the mean vectors µm , m = 1, . . ., M arecalculated from the training part whereas each FV from thetest set is classified into one of the M classes according to thefollowing rule:
g(FV) = arg maxm
dm (FV) (17)
where g(FV) is the class the FV was assigned. The resultingdecision boundaries of the quadratic discriminant analysis arequadratic equations in FV.
2) k-Nearest Neighbor (k-NN): k-NN algorithm [37] as-sumes all instances (FVs) correspond to points in the n-D space.The nearest neighbors of a given FV are defined in terms of thestandard Euclidean distance. More precisely, let an arbitrary FVbe
FV = [x1 , x2 , . . . , xn ]. (18)
Then, the distance between two FVs, FV1 =[x1
1 , x12 , . . . , x
1n ] and FV2 = [x2
1 , x22 , . . . , x
2n ] is defined as
d(FV1 ,FV2), where
d(FV1 ,FV2) ≡√∑n
i=1(x1
i − x2i )
2. (19)
The k-NN algorithm is realized in two steps: 1) define thetraining set of FVs; 2) given a query FVq to be classified, letFV1 , . . . ,FVk denote the k FVs from training sets that arenearest to FVq ; then, return the class that the majority of thek-NN (FVs) are from.
3) Mahalanobis Distance (MD): The discriminant analysisused in this approach is based on the MD criterion. MD is thedistance between a case (FV) and the centroid for each group inattribute space (n-D space) [38]. There is an MD for each caseand each case is classified as belonging to the group for whichthe MD is minimum. The statistical distance or MD betweentwo FVs, FV1 and FV2 , as defined previously, in the n-D space,from the same distribution, which has a covariance matrix C isdefined as
dS (FV1 ,FV2) =√
(FV1 − FV2)T C−1(FV1 − FV2).(20)
Obviously, the MD is the same as the Euclidean distance ifthe covariance matrix is the identity matrix.
4) Support Vector Machine: In the SVM classifier [19], apolynomial function is used as a kernel function that projectsthe data to high dimensional feature space
K(FVsv ,FVq ) = (FVTsvFVq + 1)p (21)
where FVsv is the “support vector” and FVq is the queryFV. Originally the SVM is designed for the classificationof two classes by finding the optimal hyperplane where theexpected classification error of test samples is minimized.Among several approaches to apply a multiclass SVM clas-sification process the one-versus-all method [39] was adoptedhere. Six SVMs that correspond to each of the six univer-sal emotions were used. The ith SVM is trained with all ofthe training data in the ith class with positive labels, and all
190 IEEE TRANSACTIONS ON INFORMATION TECHNOLOGY IN BIOMEDICINE, VOL. 14, NO. 2, MARCH 2010
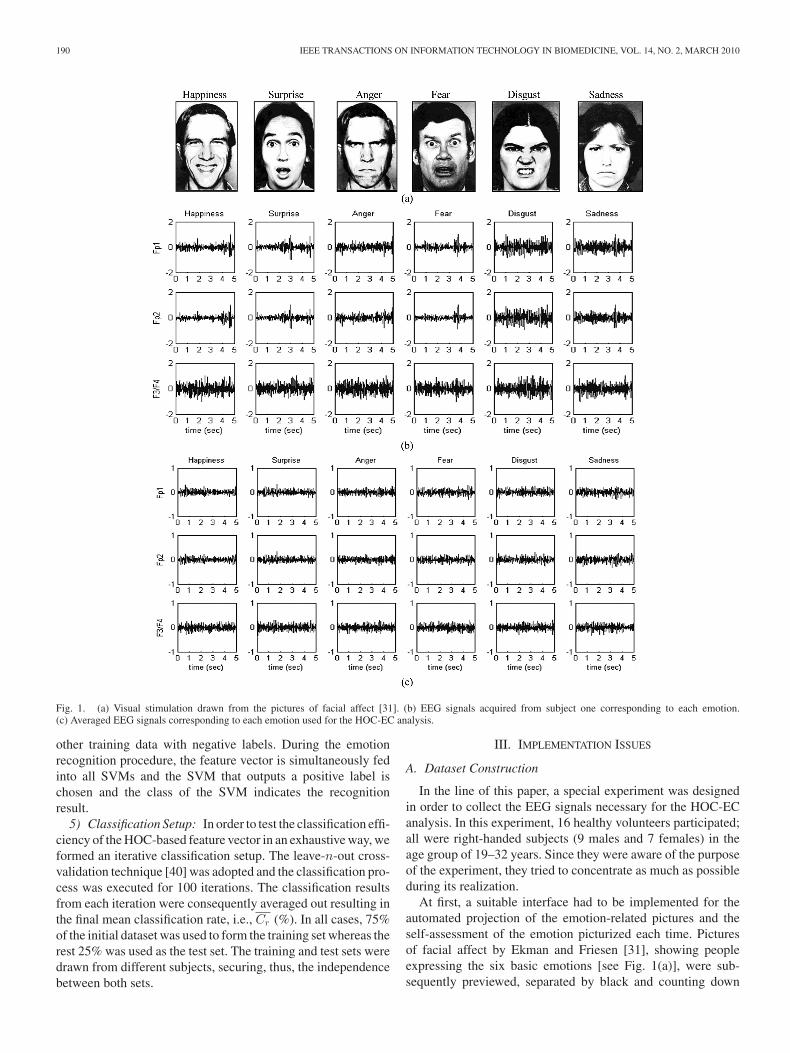
Fig. 1. (a) Visual stimulation drawn from the pictures of facial affect [31]. (b) EEG signals acquired from subject one corresponding to each emotion.(c) Averaged EEG signals corresponding to each emotion used for the HOC-EC analysis.
other training data with negative labels. During the emotionrecognition procedure, the feature vector is simultaneously fedinto all SVMs and the SVM that outputs a positive label ischosen and the class of the SVM indicates the recognitionresult.
5) Classification Setup: In order to test the classification effi-ciency of the HOC-based feature vector in an exhaustive way, weformed an iterative classification setup. The leave-n-out cross-validation technique [40] was adopted and the classification pro-cess was executed for 100 iterations. The classification resultsfrom each iteration were consequently averaged out resulting inthe final mean classification rate, i.e., Cr (%). In all cases, 75%of the initial dataset was used to form the training set whereas therest 25% was used as the test set. The training and test sets weredrawn from different subjects, securing, thus, the independencebetween both sets.
III. IMPLEMENTATION ISSUES
A. Dataset Construction
In the line of this paper, a special experiment was designedin order to collect the EEG signals necessary for the HOC-ECanalysis. In this experiment, 16 healthy volunteers participated;all were right-handed subjects (9 males and 7 females) in theage group of 19–32 years. Since they were aware of the purposeof the experiment, they tried to concentrate as much as possibleduring its realization.
At first, a suitable interface had to be implemented for theautomated projection of the emotion-related pictures and theself-assessment of the emotion picturized each time. Picturesof facial affect by Ekman and Friesen [31], showing peopleexpressing the six basic emotions [see Fig. 1(a)], were sub-sequently previewed, separated by black and counting down
PETRANTONAKIS AND HADJILEONTIADIS: EMOTION RECOGNITION FROM EEG USING HIGHER ORDER CROSSINGS 191
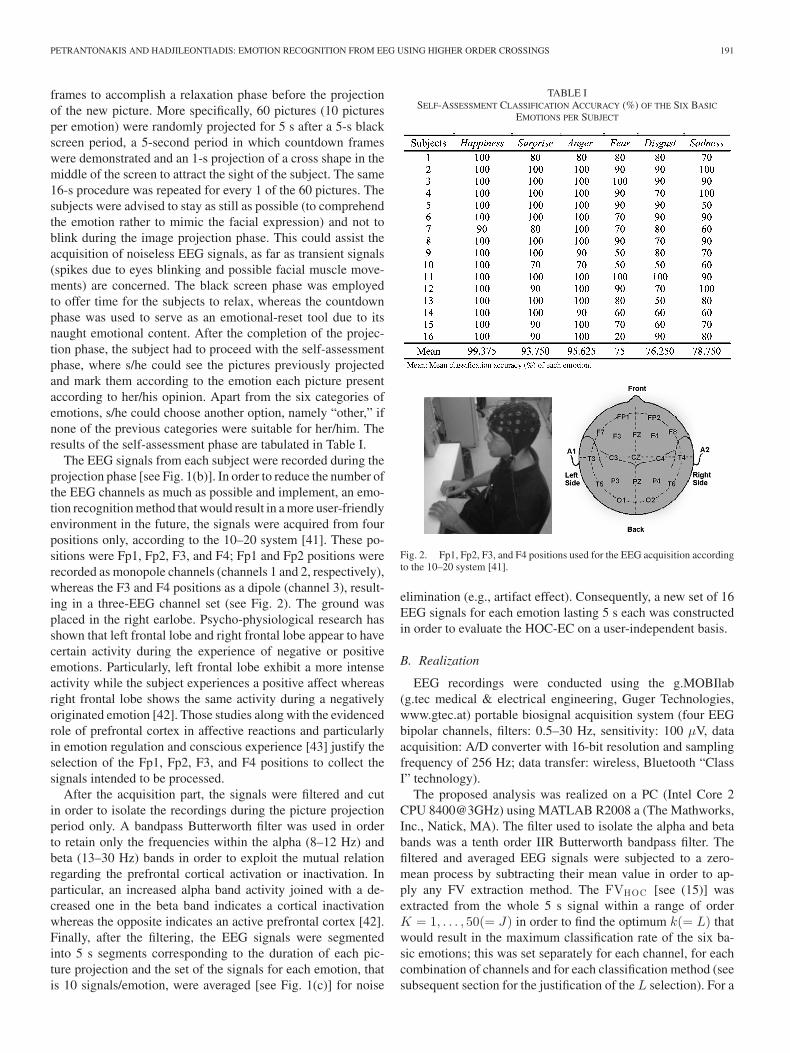
frames to accomplish a relaxation phase before the projectionof the new picture. More specifically, 60 pictures (10 picturesper emotion) were randomly projected for 5 s after a 5-s blackscreen period, a 5-second period in which countdown frameswere demonstrated and an 1-s projection of a cross shape in themiddle of the screen to attract the sight of the subject. The same16-s procedure was repeated for every 1 of the 60 pictures. Thesubjects were advised to stay as still as possible (to comprehendthe emotion rather to mimic the facial expression) and not toblink during the image projection phase. This could assist theacquisition of noiseless EEG signals, as far as transient signals(spikes due to eyes blinking and possible facial muscle move-ments) are concerned. The black screen phase was employedto offer time for the subjects to relax, whereas the countdownphase was used to serve as an emotional-reset tool due to itsnaught emotional content. After the completion of the projec-tion phase, the subject had to proceed with the self-assessmentphase, where s/he could see the pictures previously projectedand mark them according to the emotion each picture presentaccording to her/his opinion. Apart from the six categories ofemotions, s/he could choose another option, namely “other,” ifnone of the previous categories were suitable for her/him. Theresults of the self-assessment phase are tabulated in Table I.
The EEG signals from each subject were recorded during theprojection phase [see Fig. 1(b)]. In order to reduce the number ofthe EEG channels as much as possible and implement, an emo-tion recognition method that would result in a more user-friendlyenvironment in the future, the signals were acquired from fourpositions only, according to the 10–20 system [41]. These po-sitions were Fp1, Fp2, F3, and F4; Fp1 and Fp2 positions wererecorded as monopole channels (channels 1 and 2, respectively),whereas the F3 and F4 positions as a dipole (channel 3), result-ing in a three-EEG channel set (see Fig. 2). The ground wasplaced in the right earlobe. Psycho-physiological research hasshown that left frontal lobe and right frontal lobe appear to havecertain activity during the experience of negative or positiveemotions. Particularly, left frontal lobe exhibit a more intenseactivity while the subject experiences a positive affect whereasright frontal lobe shows the same activity during a negativelyoriginated emotion [42]. Those studies along with the evidencedrole of prefrontal cortex in affective reactions and particularlyin emotion regulation and conscious experience [43] justify theselection of the Fp1, Fp2, F3, and F4 positions to collect thesignals intended to be processed.
After the acquisition part, the signals were filtered and cutin order to isolate the recordings during the picture projectionperiod only. A bandpass Butterworth filter was used in orderto retain only the frequencies within the alpha (8–12 Hz) andbeta (13–30 Hz) bands in order to exploit the mutual relationregarding the prefrontal cortical activation or inactivation. Inparticular, an increased alpha band activity joined with a de-creased one in the beta band indicates a cortical inactivationwhereas the opposite indicates an active prefrontal cortex [42].Finally, after the filtering, the EEG signals were segmentedinto 5 s segments corresponding to the duration of each pic-ture projection and the set of the signals for each emotion, thatis 10 signals/emotion, were averaged [see Fig. 1(c)] for noise
TABLE ISELF-ASSESSMENT CLASSIFICATION ACCURACY (%) OF THE SIX BASIC
EMOTIONS PER SUBJECT
Fig. 2. Fp1, Fp2, F3, and F4 positions used for the EEG acquisition accordingto the 10–20 system [41].
elimination (e.g., artifact effect). Consequently, a new set of 16EEG signals for each emotion lasting 5 s each was constructedin order to evaluate the HOC-EC on a user-independent basis.
B. Realization
EEG recordings were conducted using the g.MOBIlab(g.tec medical & electrical engineering, Guger Technologies,www.gtec.at) portable biosignal acquisition system (four EEGbipolar channels, filters: 0.5–30 Hz, sensitivity: 100 µV, dataacquisition: A/D converter with 16-bit resolution and samplingfrequency of 256 Hz; data transfer: wireless, Bluetooth “ClassI” technology).
The proposed analysis was realized on a PC (Intel Core 2CPU 8400@3GHz) using MATLAB R2008 a (The Mathworks,Inc., Natick, MA). The filter used to isolate the alpha and betabands was a tenth order IIR Butterworth bandpass filter. Thefiltered and averaged EEG signals were subjected to a zero-mean process by subtracting their mean value in order to ap-ply any FV extraction method. The FVHOC [see (15)] wasextracted from the whole 5 s signal within a range of orderK = 1, . . . , 50(= J) in order to find the optimum k(= L) thatwould result in the maximum classification rate of the six ba-sic emotions; this was set separately for each channel, for eachcombination of channels and for each classification method (seesubsequent section for the justification of the L selection). For a

192 IEEE TRANSACTIONS ON INFORMATION TECHNOLOGY IN BIOMEDICINE, VOL. 14, NO. 2, MARCH 2010
Fig. 3. Cr values for the single-channel case for all classification methodsversus the k order of the HOC analysis.
spherical evaluation of the recognition power of the HOC-EC,the classification process was conducted for all possible combi-nations of the six basic emotions in groups of five, four, threeand two emotions, respectively, for all channels separately, forall combinations of channels and for all classifiers. In all cases,averaged EEG signals from 12 and 4 subjects were used astraining and test sets, respectively. In QDA, equal prior prob-abilities [pm in (16)] were assumed for each emotion class.After testing, 3-NN was used as classifier for the k-NN case,whereas, the SVM kernel function parameter p in (21) was set asp = 5.
IV. RESULTS AND DISCUSSION
A. Single-Channel Case
For the single-channel case, the EEG data from each channelwere subjected to the HOC-based analysis and for each HOC or-der k, the Cr was estimated using the four aforementioned clas-sifiers, i.e., QDA, k-NN, MD, and SVM, in order to identify theL value that provides with the maximum classification efficiencyand defines the FVHOC , i.e., FVHOC = [D1 ,D2 , . . . , DL ]. Infact, this L value was selected as the one that leads to the highestCr for the class-set of six distinct emotions. Fig. 3 depicts the Cr
for all classifiers (see Fig. 3(a)–(d) correspond to QDA, k-NN,MD, and SVM, respectively) for k = 2, . . . , 50 per channel. Asit is clear from each subplot, for all classifiers but SVM L isdefined from channel 3 (F3/F4), as there, the Cr gets its highestvalue. For the SVM case, L is derived from channel 1 (Fp1); theselected L values are [13 (QDA), 9 (k-NN), 24 (MD), 22 (SVM)]corresponding to Cr values of {62.3% (QDA), 38.67% (k-NN),46.94% (MD), 41.94% (SVM)}. From an overall perspective ofFig. 3, it is noticed that, according to the classifier used, there isa severe or moderate dependence of the classification accuracy
with the selection of the HOC order k. For example, channel3 in the QDA case exhibits a noticeable variation in Cr for k> 12; on the contrary, this is not the case for rest classifiers.In a similar manner, channel 1 exhibits a moderate variationin the SVM case for k > 21, although in the case of the restclassifiers it shows a rather constant behavior. The constructedFVHOC based on the selection of the L value per classifier wasused throughout the channels, ensuring the highest classificationefficiency and the minimum size of the FVHOC .
Table II presents the classification results from the HOC-ECfor the hardest classification problem, i.e., when the class-setconsists of six distinct emotions, derived from the HOC-basedanalysis of the EEG data from channel 3. The distribution ofthe classification results across the six emotions tabulated inTable II displays the correct classification (percentages in boldin diagonal) and the misclassification (percentages out of di-agonal) rate, respectively. For comparison reasons, the classi-fication results when using FVS and FVW (corresponding toS-EC and W-EC approaches, respectively) are also includedin this table, presented in the format of (%/%), i.e., (% fromS-EC/% from W-EC), respectively. The percentages correspondto the Cr derived when averaging the classification rates acrossthe 100 iterations. As Table II shows, in all cases, the HOC-ECoutperforms the other two methods, exhibiting a Cr of 62.3%,whereas S-EC and W-EC provide 30.89% and 37.3% Cr values,respectively. From the six basic emotions, anger seems to be themost difficult to distinguish, as all three methods have exhib-ited the lowest mean classification rates (see Table II, fourthcolumn-fourth row). Nevertheless, the HOC-EC has providedalmost doubled Cr , compared with the other two methods (50%versus 27.08/25%). The classification results presented in Ta-ble II are derived using the QDA classifier, as this was the onethat provided with the highest classification rate for the proposedHOC-EC scheme amongst the four examined classification pro-cesses.
As presented in Table I, the Cr performed by the subjectsthemselves has revealed a difficulty in distinguishing fear, dis-gust and sadness, exhibiting a Cr less than 79%. In the otherthree emotions, i.e., happiness, surprise and anger, the Cr wasfound greater than 93%. Comparing these ‘‘human” classifica-tion results with the ones presented in Table II, it is clear thatall three algorithms come short of the human ability to classifythe basic six emotions. HOC-EC, however, is the only one thatcomes closer to the human Cr values, with the other two meth-ods significantly lacking behind, achieving almost the same Cr
for sadness (78.57% from HOC-EC versus 78.75% from thesubjects).
From Table II, it is also clear that the HOC-EC presents thelowest misclassification distribution, as it exhibits, in most ofcases, very low or zero mean misclassification rates. The W-ECapproach follows, leaving behind the S-EC one, which shows atendency to assign nonzero mean misclassification rates for allemotion pairs.
For a spherical presentation of the HOC-EC ability to distin-guish between distinct emotions, the maximum Cr , i.e., Cmax
r ,derived from all class-sets consisting of emotion groups (i.e.,groups of six, five, four, three, and two emotions) for all three

PETRANTONAKIS AND HADJILEONTIADIS: EMOTION RECOGNITION FROM EEG USING HIGHER ORDER CROSSINGS 193
TABLE IICr VALUES (%) OF EACH EMOTION OF THE PROPOSED HOC-EC COMPARED WITH S-EC AND W-EC USING THE QDA CLASSIFIER FOR THE SINGLE-CHANNEL
CASE (CHANNEL 3)
Fig. 4. Cm axr values for the proposed method (HOC-EC) against the S-EC
and W-EC, for the single-channel case for all classification methods and allpossible combinations of emotion classes.
single channels and for all classifiers was estimated; Fig. 4depicts the derived Cmax
r values. In particular, Fig. 4(a)–(c)correspond to the derived results for channels Fp1, Fp2, andF3/F4, respectively. In all parts of Fig. 4, the resulted classifi-cation rates from HOC-EC, S-EC, and W-EC are plotted withsolid black line, dashed black line, and solid gray line, respec-tively; the four classifiers are denoted with square (�)-QDA,diamond (♦)-k-NN, circle (o)-MD, and asterisk (∗)-SVM. As itis clear from this figure, channel 3 [F3/F4-Fig. 4(c)] providesthe highest Cmax
r (almost in all emotion classes) compared tothe other two channels [Fig. 4(a) and (b)]. Moreover, HOC-
EC outperforms the other two feature extraction methods in allcases of channels exhibiting higher Cmax
r values for {six, five,four, three, two} emotion groups compared with the ones fromthe S-EC and W-EC. As Fig. 4 demonstrates, this holds almostindependently from the classifier type; an exception occurs forthe case of channel 2 [see Fig. 4(b)], where W-EC providessame or slightly higher Cmax
r values than the HOC-EC in allcases of the classifier types except the case of the MD classi-fier. It is noteworthy that the SVM classifier performs poorlyfor the case of W-EC when the number of emotions class-set isincreased (>2), independently from the channel; nevertheless,this performance is inversed for the class-set with two emotions[especially for channels 2 and 3, respectively, see Fig. 4(b) and(c)]. This figure additionally shows that the HOC-EC steadilyconverges to the human’s classification rate when the number ofemotions class-set is of reduced size; on the contrary, the W-ECand S-EC seem to exhibit slower convergence for all classifiersexcept SVM, reflecting a lower response to the reduction of theemotion class-set from six to two emotions.
B. Combined-Channel Case
The procedure followed in the single-channel case was alsoadopted for the combined-channel scenario. In particular, fourchannel combinations were produced, i.e., CB1 = {channel 1(Fp1), channel 2 (Fp2)}, CB2 = {channel 1 (Fp1), channel 3(F3/F4)}, CB3 = {channel 2 (Fp2), channel 3 (F3/F4)}, andCB4 = {channel 1 (Fp1), channel 2 (Fp2), channel 3 (F3/F4)};for each one, EEG data from the combined channels were sub-jected to the HOC-based analysis and for each HOC order k,the mean classification rate, denoted as Cc
r , was estimated us-ing again the QDA, k-NN, MD, and SVM classifiers. This way,the L value that provides with the maximum classification ef-ficiency and defines the combined feature vector, FVc
HOC , i.e.,for each classifier was identified, accordingly. The FVc
HOC wasstructured as
FVcHOC
= [Di1 ,D
i2 , . . . , D
iL ,Dj
1 ,Dj2 , . . . , D
jL ,Ds
1 ,Ds2 , . . . , D
sL ],
i = 1, 2; j = 2, 3; s = 0, 3, i �= j, j �= s (22)
194 IEEE TRANSACTIONS ON INFORMATION TECHNOLOGY IN BIOMEDICINE, VOL. 14, NO. 2, MARCH 2010
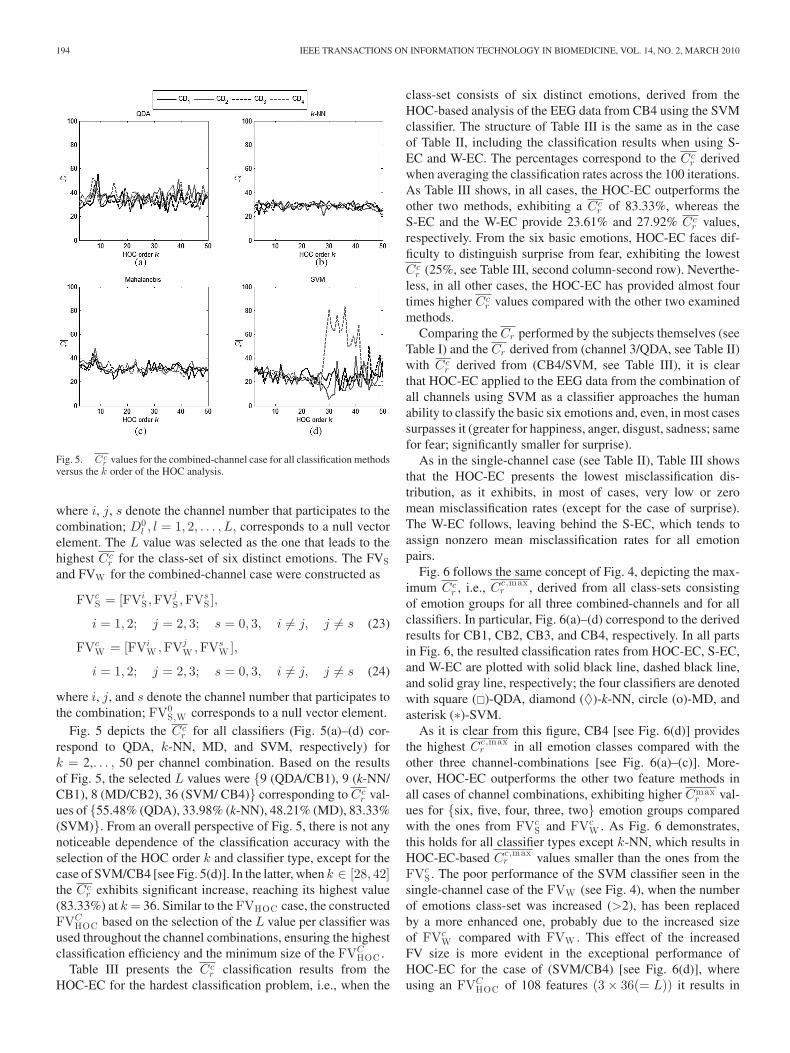
Fig. 5. Ccr values for the combined-channel case for all classification methods
versus the k order of the HOC analysis.
where i, j, s denote the channel number that participates to thecombination; D0
l , l = 1, 2, . . . , L, corresponds to a null vectorelement. The L value was selected as the one that leads to thehighest Cc
r for the class-set of six distinct emotions. The FVSand FVW for the combined-channel case were constructed as
FVcS = [FVi
S ,FVjS ,FVs
S ],
i = 1, 2; j = 2, 3; s = 0, 3, i �= j, j �= s (23)
FVcW = [FVi
W ,FVjW ,FVs
W ],
i = 1, 2; j = 2, 3; s = 0, 3, i �= j, j �= s (24)
where i, j, and s denote the channel number that participates tothe combination; FV0
S,W corresponds to a null vector element.Fig. 5 depicts the Cc
r for all classifiers (Fig. 5(a)–(d) cor-respond to QDA, k-NN, MD, and SVM, respectively) fork = 2,. . . , 50 per channel combination. Based on the resultsof Fig. 5, the selected L values were {9 (QDA/CB1), 9 (k-NN/CB1), 8 (MD/CB2), 36 (SVM/ CB4)} corresponding to Cc
r val-ues of {55.48% (QDA), 33.98% (k-NN), 48.21% (MD), 83.33%(SVM)}. From an overall perspective of Fig. 5, there is not anynoticeable dependence of the classification accuracy with theselection of the HOC order k and classifier type, except for thecase of SVM/CB4 [see Fig. 5(d)]. In the latter, when k ∈ [28, 42]the Cc
r exhibits significant increase, reaching its highest value(83.33%) at k = 36. Similar to the FVHOC case, the constructedFVC
HOC based on the selection of the L value per classifier wasused throughout the channel combinations, ensuring the highestclassification efficiency and the minimum size of the FVC
HOC .Table III presents the Cc
r classification results from theHOC-EC for the hardest classification problem, i.e., when the
class-set consists of six distinct emotions, derived from theHOC-based analysis of the EEG data from CB4 using the SVMclassifier. The structure of Table III is the same as in the caseof Table II, including the classification results when using S-EC and W-EC. The percentages correspond to the Cc
r derivedwhen averaging the classification rates across the 100 iterations.As Table III shows, in all cases, the HOC-EC outperforms theother two methods, exhibiting a Cc
r of 83.33%, whereas theS-EC and the W-EC provide 23.61% and 27.92% Cc
r values,respectively. From the six basic emotions, HOC-EC faces dif-ficulty to distinguish surprise from fear, exhibiting the lowestCc
r (25%, see Table III, second column-second row). Neverthe-less, in all other cases, the HOC-EC has provided almost fourtimes higher Cc
r values compared with the other two examinedmethods.
Comparing the Cr performed by the subjects themselves (seeTable I) and the Cr derived from (channel 3/QDA, see Table II)with Cc
r derived from (CB4/SVM, see Table III), it is clearthat HOC-EC applied to the EEG data from the combination ofall channels using SVM as a classifier approaches the humanability to classify the basic six emotions and, even, in most casessurpasses it (greater for happiness, anger, disgust, sadness; samefor fear; significantly smaller for surprise).
As in the single-channel case (see Table II), Table III showsthat the HOC-EC presents the lowest misclassification dis-tribution, as it exhibits, in most of cases, very low or zeromean misclassification rates (except for the case of surprise).The W-EC follows, leaving behind the S-EC, which tends toassign nonzero mean misclassification rates for all emotionpairs.
Fig. 6 follows the same concept of Fig. 4, depicting the max-imum Cc
r , i.e., Cc,maxr , derived from all class-sets consisting
of emotion groups for all three combined-channels and for allclassifiers. In particular, Fig. 6(a)–(d) correspond to the derivedresults for CB1, CB2, CB3, and CB4, respectively. In all partsin Fig. 6, the resulted classification rates from HOC-EC, S-EC,and W-EC are plotted with solid black line, dashed black line,and solid gray line, respectively; the four classifiers are denotedwith square (�)-QDA, diamond (♦)-k-NN, circle (o)-MD, andasterisk (∗)-SVM.
As it is clear from this figure, CB4 [see Fig. 6(d)] providesthe highest Cc,max
r in all emotion classes compared with theother three channel-combinations [see Fig. 6(a)–(c)]. More-over, HOC-EC outperforms the other two feature methods inall cases of channel combinations, exhibiting higher Cmax
r val-ues for {six, five, four, three, two} emotion groups comparedwith the ones from FVc
S and FVcW . As Fig. 6 demonstrates,
this holds for all classifier types except k-NN, which results inHOC-EC-based Cc,max
r values smaller than the ones from theFVc
S . The poor performance of the SVM classifier seen in thesingle-channel case of the FVW (see Fig. 4), when the numberof emotions class-set was increased (>2), has been replacedby a more enhanced one, probably due to the increased sizeof FVc
W compared with FVW . This effect of the increasedFV size is more evident in the exceptional performance ofHOC-EC for the case of (SVM/CB4) [see Fig. 6(d)], whereusing an FVC
HOC of 108 features (3 × 36(= L)) it results in

PETRANTONAKIS AND HADJILEONTIADIS: EMOTION RECOGNITION FROM EEG USING HIGHER ORDER CROSSINGS 195
TABLE IIICc
r VALUES (%) OF EACH EMOTION OF THE PROPOSED HOC-EC COMPARED WITH S-EC AND W-EC USING THE SVM CLASSIFIER FOR THE COMBINED-CHANNEL
CASE (CHANNEL COMBINATION CB4 )
Fig. 6. Cc,m axr values for the proposed method (HOC-EC) against the S-EC
and W-EC, for the combined-channel case for all classification methods and allpossible combinations of emotion classes.
Cc,maxr = {83.33%, 100%, 100%, 100%, 100%} for {six, five,
four, three, two} emotion groups, respectively. Nevertheless, theincrease in FV size should be handled with care, as it severelyaffects the computational burden of the classification process,especially when the issue of real-time implementation is of pri-mary priority.
C. Overall Performance
For an overall performance perspective of the HOC-EC,Table IV was constructed. In particular, Table IV presents thebest Cmax
r and Cc,maxr values for the introduced HOC-EC and
the two other examined methods, i.e., S-EC and W-EC, for thesingle- and combined-channel cases, respectively, when exam-ining the hardest case of differentiating among the six emotions.The corresponding channel number and channel combinationalong with the relevant classifier types are also given. As Ta-ble IV tabulates, HOC-EC almost doubles the best Cmax
r andCc,max
r values from the S-EC and W-EC approaches, showinga significant enhancement in the EEG-based emotion detectionprocess. Furthermore, Table IV shows that the use of more thanone channels does not always imply increase in the classifica-
TABLE IVBEST Cm ax
r AND Cc,m axr VALUES (%) FOR THE CASE OF SIX EMOTION
CLASSES OF THE PROPOSED HOC-EC COMPARED WITH S-EC AND W-EC
tion performance; for example, when using three instead of onechannels, the performance of HOC-EC is significantly increased(∼20%). Nevertheless, this increase is smaller (∼6%) for thecase of S-EC approach when using two instead of one channels,and even a decrease is noticed (∼2%), as it happens for the caseof the W-EC. The classification power of the examined classi-fiers seems to be affected by the selection of the FV (type andnumber of features). In fact, SVM shows high classification abil-ity for extended-size FV (e.g., FVC
HOC ), whereas QDA seems tobetter handle the classification process for small-size FVs (e.g.,FVHOC , FVc
W ). Finally, MD exhibits the highest classificationperformance both for the case of FVs and FVc
S , respectively.The fact that the SVM provides with the more efficient classifi-cation is beneficial, as SVMs give a magnitude for recognition;using this magnitude a degree could be possibly associated withthe emotion stimulus [14].
The presented results have shown the ability of the HOC-ECto better discriminate the EEG potentials stemming from emo-tion stimulus. Apart from the EEG-based perspective, speechand facial expressions are widely examined for the extraction ofthe underlying emotion, as there is a great deal of mutual infor-mation between vocal and facial expressions. Nevertheless, thebody of work on detecting emotion in speech is quite limited.Currently, researchers are still debating what features influencethe recognition of emotion in speech. There is also considerableuncertainty as to the best algorithm for classifying emotion, andwhich emotions to class together. Some promising approachesare reported in [11]–[14]. In particular, in [13] the k-NN andSVM classifiers were used to classify pairs of opposing emo-tions; they report a mean classification rate of 73.94% whenusing both k-NN and SVM. Moreover, in [14], the k-Means,SVM, and neural network classifiers were used to classify the
196 IEEE TRANSACTIONS ON INFORMATION TECHNOLOGY IN BIOMEDICINE, VOL. 14, NO. 2, MARCH 2010
emotions neutral, anger, happiness, and sadness; they reporta mean classification rate of 74.28% using SVM. In addition,in [12], facial expressions, acoustic information and combina-tion of them are examined for their emotion discrimination ef-ficiency among the four aforementioned emotions using SVM;they report a mean classification rate of 70.9% when usingacoustic information only, 85.1% when using facial informationonly, and 89.1% when facial expressions and acoustic informa-tion were fused at feature-level. These classification rates areclearly lower than the ones derived using the proposed HOC-EC,which refer to harder case of differentiating among six emotionssimultaneously. This also holds for the case of emotion detectionusing data related to the autonomous nervous system [15], [16];for example, in [16], the reported mean classification perfor-mance is 67.81% (using k-NN) and 62.27% (using discriminantfunction analysis) for the differentiation among sadness, anger,surprise, fear, frustration, and amusement.
It should be stressed out that the HOC-EC is a user inde-pendent approach; hence, it has high degree of generalizationfacilitating its transfer to many HMI environments without re-quiring an arduous adaptation or pre-analysis phase. In fact, theproposed HOC-EC scheme, contributes, as a basic research, tothe area of affective computing and HMI; applications, how-ever, in the field of healthcare are visible, such as, identifyingpatient’s emotion experiences, recurring affective states, emo-tional trends over time, and providing appropriate feedback dy-namically adapted to the patient’s emotional states via a varietyof appropriate means depending upon the given context (e.g.,disorders within the autism spectrum and/or cerebral palsy).Adaptation of the HOC-EC method to a fully pervasive systemwould require additional effort (both in EEG acquisition andreal-time implementation aspects). Nevertheless, advent tech-nology could provide in the forthcoming future smaller wirelessEEG sensors and dedicated hardware, fostering the HOC-EC in-tegration within expert pervasive systems that could collectivelyassess health indicators and patterns for diagnostic, predictiveand prescriptive purposes.
V. CONCLUSION
A new classification tool, namely HOC-EC, has been pre-sented here for EEG-based emotion recognition. In particular, anew feature vector extraction method based on HOC analysis hasbeen proposed and has revealed the potential of a robust emo-tion recognition method from EEG. Moreover, a novel emotionelicitation technique based on the Mirror Neuron System wasproposed in order to achieve more effective representation of theemotion stimulus to the artificially evoked brain potentials. EEGdata from single-channel and combined-channel cases were sub-jected to HOC-EC and four different classifiers (QDA, k-NN,MD, and SVM) were employed. For the single-channel case,the best results were obtained by the QDA (62.3% mean classi-fication rate), whereas for the combined-channel case, the bestresults were obtained using SVM (83.33% mean classificationrate), for the hardest case of differentiating among the six basicemotions, i.e. happiness, surprise, anger, fear, disgust, and sad-ness. Extended classification tests were implemented concern-ing all possible combinations of emotion classes showing the
effectiveness of the proposed method, which achieved graduallymaximum (100%) classification rates as soon as the number ofthe classes emotions was reduced from six to two. The compari-son of the HOC-EC method with other feature extraction meth-ods (S-EC and W-EC, respectively) overwhelmed its robustnessand consistency to effectively discriminate emotions from EEGsignals. Integration of HOC-EC in a pervasive healthcare sys-tem could contribute to improved HMI that enables advancedmonitoring and interpretation of patient status and environmentoptimizing the whole medical assessment procedure.
ACKNOWLEDGMENT
The authors would like to thank all the 16 subjects partic-ipated in the experiment for their patience during the tediousEEG recording phase. Moreover, the authors would also like toappreciate the comments of the two anonymous reviewers thatcontributed to a more in-depth expansion of the paper upon theexamined issues.
REFERENCES
[1] P. SaloVey and J. D. Mayer, “Emotional intelligence,” Imagination, Cog-nition Pers., vol. 9, no. 3, pp. 185–211, 1990.
[2] D. Goleman, Emotional Intelligence. New York: Bantam Books, 1995.[3] A. R. Damasio, Descartes’ Error: Emotion, Reason, and the Human Brain.
New York: Gosset/Putnam, 1994.[4] B. Reeves and C. Nass, The Media Equation. How People Treat Comput-
ers, Television, and New Media like Real People and Places. New York:CSLI, Cambridge Univ. Press, 1996.
[5] C. Doukas and I. Maglogiannis, “Intelligent pervasive healthcare sys-tems,” Adv. Comput. Intell. Paradigms Healthcare-3, vol. 107, pp. 95–115, 2008.
[6] C. Lisetti, F. Nasoz, C. LeRouge, O. Ozyer, and K. Alvarez, “Developingmultimodal intelligent affective interfaces for tele-home health care,” Int.J. Human-Comput. Stud., vol. 59, pp. 245–255, 2003.
[7] T. S. Barger, D. E. Brown, and M. Alwan, “Health-status monitoringthrough analysis of behavioral patterns,” IEEE Trans. Syst., Man Cybern.,vol. 35, no. 1, pp. 22–27, Jan. 2005.
[8] I. Cohen, A. Garg, T. S. Huang. (2000).“Emotion recognition from facialexpressions using multilevel HMM” presented at the Neural Inf. Process.Syst. (NIPS) Workshop Affective Comput., Colorado. [Online]. Available:http://www.ifp.uiuc.edu/∼ashutosh/ papers/NIPS_emotion.pdf
[9] F. Bourel, C. C. Chibelushi, and A. A. Low, “Robust facial expressionrecognition using a state-based model of spatially-localized facial dynam-ics,” in Proc. 5h IEEE Int. Conf. Automat. Face Gesture Recognit., 2002,pp. 106–111.
[10] J. J. Lien, T. Kanade, J. F. Cohn, and C. Li, “Automated facial expressionrecognition based on FACS action units,” in Proc. 3rd IEEE Conf. Automat.Face Gesture Recognit., 1998, pp. 390–395.
[11] B. Schuller, S. Reiter, R. Mueller, M. Al-Hames, and G. Rigoll, “Speakerindependent speech emotion recognition by ensemble classification,” inProc. 6th Int. Conf. Multimedia Expo. ICME 2005, pp. 864–867.
[12] C. Busso, Z. Deng, S. Yildirim, M. Buut, C. M. Lee, A. Kazemzadeh,S. Lee, U. Neumann, and S. Narayanan, “Analysis of emotion recognitionusing facial expressions, speech and multimodal information,” in Proc.6th Int. Conf. Multimodal Interfaces (ICMI-04), 2004, pp. 205–211.
[13] R. Shah and M. Hewlett. (2007). Emotion detection from speech. [On-line]. Available: http://www.stanford.edu/class/cs229/proj2007/ShahHewlett%20–20Emotion%20Detection%20 from%20Speech.pdf
[14] F. Yu, E. Chang, Y. Q. Xu, and H. Y. Shum, “Emotion detection fromspeech to enrich multimedia content,” in Proc. IEEE Pacific Rim Conf.Multimedia, 2001, pp. 550–557.
[15] R. W. Picard, E. Vyzas, and J. Healey, “Toward machine emotional intel-ligence: Analysis of affective physiological state,” IEEE Trans. PatternAnal. Mach., vol. 23, no. 10, pp. 1175–1191, Oct. 2001.
[16] F. Nasoz, C. L. Lisetti, K. Alvarez, and N. Finkelstein. (2003, Jun. 22–26). “Emotion recognition from physiological signals for user model-ing of affect,” presented at the UM’2003, 9th Int. Conf. User Model,
PETRANTONAKIS AND HADJILEONTIADIS: EMOTION RECOGNITION FROM EEG USING HIGHER ORDER CROSSINGS 197
Pittsburg, PA, [Online]. Available: http://www.eurecom. fr/util/ publid-ownload.en.htm?id = 1806.
[17] K. Takahashi, “Remarks on emotion recognition from bio-potential sig-nals,” in Proc. of 2nd Int. Conf. Autonomous Robots Agents, 2004, pp. 186–191.
[18] M. Murugappan, M. Rizon, R. Nagarajan, S. Yaacob, I. Zunaidi, andD. Hazry, “EEG feature extraction for classifying emotions using FCMand FKM,” J. Comput. Commun., vol. 1, pp. 21–25, 2007.
[19] N. Cristianini and J. Shawe-Taylor, An Introduction to Support Vector Ma-chines and Other Kernel-based Learning Methods. Cambridge, U.K.:Cambridge Univ. Press, 2000.
[20] J. J. De Gruijter and A. B. McBratney, “A modified fuzzy k means forpredictive classification,” in Classification and Related Methods of DataAnalysis, H. H. Bock, Ed. Amsterdam, The Netherlands: Elsevier, 1988,pp. 97–104.
[21] K. G. Srinivasa, K. R. Venugopal, and L. M. Patnaik, “Feature extractionusing fuzzy C-Means clustering for data mining systems,” Int. J. Comput.Sci. Netw. Security, vol. 6, pp. 230–236, 2006.
[22] M. Murugappan, M. Rizon, R. Nagarajan, S. Yaacob, I. Zunaidi, andD. Hazry, “Lifting scheme for human emotion recognition using EEG,”in Proc. Int. Symp. Inf. Technol., 2008, pp. 1–7.
[23] D. O. Bos. (2006). EEG-based emotion recognition: The influence ofvisual and auditory stimuli. [Online]. Available: http://hmi.ewi.utwente.nl/verslagen/capita-selecta/CS-Oude_Bos-Danny.pdf
[24] R. Horlings, D. Datcu, and L. J. M. Rothkrantz, “Emotion recognitionusing brain activity,” in Proc. Int. Conf. Comput. Syst. Technol., 2008,pp. 1–6.
[25] B. Kedem, Time Series Analysis by Higher Order Crossings. Piscat-away, NJ: IEEE Press, 1994.
[26] G. Rizzolatti and L. Craighero, “The mirror-neuron system,” Annu. Rev.Neurosci., vol. 27, pp. 169–192, 2004.
[27] R. W. Picard, Affective Computing. Boston, MA: MIT Press, 1997.[28] P. Ekman et al., “Universals and cultural differences in the judgments of
facial expressions of emotion,” J. Pers. Soc. Psychol., vol. 53, pp. 712–717, 1987.
[29] C. Barr-Zisowitz, “Sadness-Is there such a thing,” in Handbook of Emo-tions, 2nd ed, M. Lewis and J. M. Haviland-Jones, Eds. New York: TheGuilford Press, 2000, ch. 38, pp. 607–622.
[30] E. Oztop, M. Kawato, and M. Arbib, “Mirror neurons and imitation: Acomputationally guided review,” Neural Netw., vol. 19, pp. 254–271,2006.
[31] P. Ekman and W. V. Friesen, “Pictures of facial affect,” in Human Interac-tion Laboratory. San Francisco, CA: Univ. California Medical Center,1976.
[32] P. J. Lang, M. M. Bradley, and B. N. Cuthbert, “International affective pic-ture system (IAPS): Affective ratings of pictures and instruction manual,”University of Florida, Gainesville, FL, Tech. Rep. A-8, 2008.
[33] P. S. Addison, The Illustrated Wavelet Transform Handbook: IntroductoryTheory and Applications in Science Engineering. Bristol, U.K.: Instituteof Physics (IOP) Publishing Ltd, 2002.
[34] I. Daubechies, “Orthonormal bases of compactly supported wavelets,”Commun. Pure Appl. Math., vol. 41, pp. 909–996, 1988.
[35] W. J. Krzanowski, Principles of Multivariate Analysis. Oxford, U.K.:Oxford Univ. Press, 1988.
[36] G. A. F. Seber, Multivariate Observations. Wiley Series in Probability andStatistics. New York: Wiley, 1984.
[37] T. Mitchell, Machine Learning. New York: McGraw-Hill, 1997.[38] P. C. Mahalanobis, “On the generalized distance in statistics,” Proc. Nat.
Inst. Sci. India, vol. 2, pp. 49–55, 1936.[39] O. Chapelle, P. Haffner, and V. Vapnik, “Support Vector Machines for
histogram-based image classification,” IEEE Trans. Neural Netw., vol. 10,no. 5, pp. 1055–1064, Sep. 1999.
[40] P. A. Devijver and J. Kittler, Pattern Recognition: A Statistical Approach.London, U.K.: Prentice-Hall, 1982.
[41] E. Niedermeyer and F. Lopes da Silva, Electroencephalography: BasicPrinciples, Clinical Applications, and Related Fields. Baltimore, MD:Williams & Wilkins, 1993.
[42] C. P. Niemic, “Studies of emotion: A theoretical and empirical review ofpsychophysiological studies of emotion,” J. Undergraduate Res., vol. 1,pp. 15–18, 2002.
[43] R. J. Davidson, D. C. Jackson, and N. H. Kalin, “Emotion, plasticity, con-text, and regulation: Perspectives from affective neuroscience,” Psychol.Bull., vol. 126, pp. 890–909, 2000.
Panagiotis C. Petrantonakis (S’08) was born inIerapetra, Crete, Greece, in 1984. He received theDiploma degree in electrical and computer engi-neering from the Aristotle University of Thessa-loniki (AUTH), Thessaloniki, Greece, in 2007. Heis currently working toward the Ph.D. degree withthe Signal Processing and Biomedical TechnologyUnit, Telecommunications Laboratory, Departmentof Electrical and Computer Engineering, AUTH.
His current research interests include advancedsignal processing techniques, nonlinear transforms,
and affective computing.Mr. Petrantonakis is a member of the Technical Chamber of Greece.
Leontios J. Hadjileontiadis (S’87–M’98) was bornin Kastoria, Greece, in 1966. He received the Diplomadegree in electrical engineering and the Ph.D. de-gree in electrical and computer engineering both fromAristotle University of Thessaloniki (AUTH), Thes-saloniki, Greece, in 1989 and 1997, respectively. Healso received the Ph.D. degree in music compositionfrom the University of York, Heslington, U.K., in2004.
In December 1999, he joined as a Faculty Mem-ber with the Signal Processing and Biomedical Tech-
nology Unit, Telecommunications Laboratory, Department of Electrical andComputer Engineering, AUTH, where he is currently an Associate Professor,engaged on lung sounds, heart sounds, bowel sounds, ECG data compression,seismic data analysis, and crack detection. He is also a Professor in music com-position with the State Conservatory of Thessaloniki, Thessaloniki. His researchinterests include higher order statistics, alpha-stable distributions, higher orderzero crossings, wavelets, polyspectra, fractals, neuro-fuzzy modeling for medi-cal, mobile, and digital signal processing applications.
Dr. Hadjileontiadis is a member of the Technical Chamber of Greece, HigherOrder Statistics Society, International Lung Sounds Association, and Ameri-can College of Chest Physicians. He was the recipient of the second award atthe Best Paper Competition of the ninth Panhellenic Medical Conference onThorax Diseases’97, Thessaloniki. He was also an open finalist at the Studentpaper Competition (Whitaker Foundation) of the IEEE EMBS’97, Chicago, IL,a finalist at the Student Paper Competition (in memory of Dick Poortvliet) ofthe MEDICON’98, Lemesos, Cyprus, and the recipient of the Young ScientistAward at the 24th International Lung Sounds Conference’99, Marburg, Ger-many. In 2004, 2005, and 2007, he organized and served as a mentor to threefive-student teams that have ranked as third, second, and seventh worldwide,respectively, at the Imagine Cup Competition (Microsoft), Sao Paulo, Brazil in2004/Yokohama, Japan, in 2005/Seoul, Korea, in 2007, with projects involvingtechnology-based solutions for people with disabilities.


![An Optimal EEG-based Emotion Recognition Algorithm ......system based on EEG signals such as event-related synchronization [11] and event-related desynchronization [12]. A number of](https://static.fdocuments.us/doc/165x107/60591d1867969b0f56154721/an-optimal-eeg-based-emotion-recognition-algorithm-system-based-on-eeg-signals.jpg)