Emma Olsson- The Effect of Globalization on Gender...
37
The Effect of Globalization on Gender Equality within Welfare and Work Life Author: Emma Olsson Supervisors: Andreas Bergh and Therese Nilsson Master Thesis I, NEKN01 Department of Economics May 2014
-
Upload
nguyenthuy -
Category
Documents
-
view
214 -
download
0
Transcript of Emma Olsson- The Effect of Globalization on Gender...

The Effect of Globalization on Gender
Equality within Welfare and Work Life
Author:
Emma Olsson
Supervisors:
Andreas Bergh and Therese Nilsson
Master Thesis I, NEKN01 Department of Economics
May 2014
The aim of this thesis is to analyze what effect different aspects of globalization
have had on gender equality in welfare and work life during the period 1970-2012 using
data for up to 171 countries. The KOF index of globalization is used as a proxy to include
social, political and economic globalization. Furthermore, gender equality is measured by
relative changes in health, education and workforce participation.
In general the results indicate that globalization has a positive effect on female
relative to male secondary and tertiary schooling as well as labor force participation;
strengthening gender equality. Conversely, the relative labor force participation in the
industry sector shows a negative trend with more inequality as a result.

Acknowledgement First and foremost, I would like to express my sincere gratitude to my advisors
Andreas Bergh and Therese Nilsson for their support and pointers. Their expertise has
been vital in the process of writing this thesis.
I would also like to extend my deepest appreciation to the thesis group of spring
2014 for good advice and discussions.
Lund, May 28 Emma Olsson

Table of Contents
1. Introduction ...................................................................................................................... 1
2. Background ...................................................................................................................... 2
2.1 Globalization ............................................................................................................................... 2 2.2 Inequality .................................................................................................................................... 2 2.3 Theoretical framework and related research ............................................................................... 2 2.4 Hypothesis ................................................................................................................................... 5
3. Data and Method .............................................................................................................. 6
3.1 Data ............................................................................................................................................. 6 3.2 Descriptive statistics ................................................................................................................... 8 3.3 Method ........................................................................................................................................ 9
4. Empirical results and analysis ........................................................................................ 10
4.1 Overall globalization ................................................................................................................. 10 4.2 Social, political and economic globalization ............................................................................ 13 4.3 Non-OECD countries ................................................................................................................ 18 4.4 Pooled OLS model .................................................................................................................... 22
5. Discussion ...................................................................................................................... 24
6. Conclusion ..................................................................................................................... 26
7. References ...................................................................................................................... 27
8. Appendix ........................................................................................................................ 29

List of Tables
Table 1: Descriptive statistics ........................................................................................ 8
Table 2: Overall globalization and female/male life expectancy ................................. 10
Table 3: Overall globalization and female/male schooling ......................................... 11
Table 4: Overall globalization and female/male labor force participation .................. 12
Table 5: Overall globalization and female/male sector distribution ............................ 13
Table 6: Social, political and economic globalization and female/male life expectancy14
Table 7: Social, political and economic globalization and female/male schooling ..... 15
Table 8: Social, political and economic globalization and female/male labor force
participation ......................................................................................................... 16
Table 9: Social, political, economic globalization and labor force distribution in sectors
.............................................................................................................................. 17
Table 10: Social, political economic globalization and female/male life expectancy. Non-
OECD ................................................................................................................... 18
Table 11: Social, political economic globalization and female/male schooling. Non-
OECD ................................................................................................................... 19
Table 12: Social, political economic globalization and female/male labor force
participation. Non-OECD .................................................................................... 20
Table 13: Social, political and economic globalization and female/male sector
distribution. Non-OECD ...................................................................................... 21
Table 14: Overall globalization and female/male life expectancy ............................... 22
Table 15: Overall globalization and female/male schooling ....................................... 22
Table 16: Overall globalization and female/male labor force participation ................ 23
Table 17: Overall globalization and female/male sector distribution .......................... 23
Table 18: 2013 KOF Index of Globalization ............................................................... 29
Table 19: List of countries ........................................................................................... 31
Table 20: Correlation matrix ........................................................................................ 32
1
1. Introduction Gender equality is important both for individual people and economic development
(Klasen and Lamanna, 2009). Looking at data on gender equality in welfare and work life
it is visible that there still are gaps between women and men. At the same time the world
we live in is becoming more globalized. Moreover, globalization is often viewed as
having both positive and negative impacts, making some people winners while others
become losers (Bussmann, 2009).
In this thesis I have looked at the relationship between globalization and gender
equality in welfare and work life. Studies examining the effect of globalization typically
take an economic perspective, using measures like trade openness. However, increased
globalization, meaning that civilizations become more integrated, might also affect the
way people live and behave in a society. Globalization is complex, affecting information
flow, spread of technology, social and political norms as well as economic interactions.
Globalization makes it possible for countries to specialize their production (Feenstra,
2003) and it allows ideas and norms to spread. (Arribas, Perez, Tortosa-Ausina, 2008).
Considering the different aspects of globalization it is reasonable that it might affect the
way we look at gender equality. This thesis has therefore analyzed the effect of
globalization trying to answer whether globalization increases or decreases gender
equality. Furthermore, using the KOF index of globalization, three aspects, social,
political and economic globalization, have been considered. This thesis aims to
investigate the effect of these three aspects of globalization on gender equality in welfare
and work life, thus expanding the already existing literature. Furthermore, contributing to
an expansion of the already existing literature, the effect of globalization is measured in
relative terms looking at differences in life expectancy, school enrollment and labor force
participation using data for up to 171 countries during the time period 1970-2012.
The remainder of this thesis is organized as follows. Next section starts with a
background of globalization and inequality, further follows a discussion covering basic
principles and results from theory and related studies concluded with a hypothesis.
Section 3 explains methodology and variables used in this paper. Section 4 presents the
results and section 5 discusses the results. Finally, section 6 concludes the results and
present some ideas regarding further research.

2
2. Background
2.1 Globalization
In this thesis I define globalization as integration between countries, a phenomenon
that increases trade of goods and services as well as bringing’s people closer together. I
try to capture some of the complexity of globalization by considering social, political and
economic aspects of globalization. Social globalization concerns norms and cultural
values, political globalization includes integration at a political level and economic
globalization refers to trade of goods and services as well as investment flows across
countries (Dreher, 2006). Globalization is measured using the KOF index of
globalization. See table 18 in appendix for a more detailed description of indices and
variables included.
2.2 Inequality
Talking about inequality it is important to remember that comparing women to men
is not just about justice and equality, it is also a question regarding development. Gender
inequality in health, education and employment has been shown to affect the daily life of
women and men as well as productivity and economic growth of a country negatively
(Klasen and Lamanna, 2009; Niklas Potrafke, 2012). This question is therefore important
for all countries and people.
2.3 Theoretical framework and related research
According to trade theories like the Ricardinan model, international trade makes it
possible for countries to specialize their production to become more productive (Feenstra,
2003). Specialization may in turn affect job creation and people’s affordability to pay for
health and education. From a macroeconomic perspective it is possible that economic
globalization and trade generates higher income for the state. Meaning that the
government get more money that they can use for public spending like investments in
better education and health facilities (Bussmann, 2009). Studies examining the effect of
globalization often use trade openness to estimate a measure of globalization. Margit
Bussmann (2009) analyzes whether women are the winners or losers from globalization,
using trade openness to estimate the effect on women’s welfare and work life. In relative
terms, comparing women to men, the result does not support that welfare increase with
3
globalization. However, the results indicate that the effect of increased trade openness has
different effect for countries depending on whether they are members of Organization for
Economic Co-operation and Development, OECD, or not. In non-OECD countries female
labor force participation increase while it decreased in OECD countries. In absolute terms
female labor force participation in non-OECD countries increases in the agricultural and
manufacturing sectors but decreases in the service sector. The results for OECD countries
show increased female labor force participation in the service sector, while there is a
visible decrease in the agricultural and manufacturing sectors, furthermore, the changes
are slightly greater for women then for men.
Analyzing different measures of economic globalization Richards and Gelleny
(2007) show that overall participation in global economic activity seems to have a
positive affect on the status of women. However, they find that the relationship between
economic globalization and the status of women varies for different types of
globalization, status and time periods.
Moreover, discussing whether “good times are good for women” Dollar and Gatti
(1999) finds that increased income per capita is positive for gender equality in education
and health and that gender inequality in education is bad for economic growth. They also
show that religious preference, regional factors and civil freedom have a big impact on
gender inequality.
Gray, Kittilson and Sandholtz (2006) argues that globalization affect norms and
ideas in a country as well as economic integration, using trade as a measure of
globalization. They find that health, literacy, participation in government decisions and
work force outcomes among women improve as countries become more open to
international influences. Membership in international organizations like the UN and
World Bank as well as investment activity and trade are repeatedly found to improve the
situation of women.
Further considering the social effects of globalization Cho (2013) concludes that
economic globalization has no effect when controlling for social globalization. The paper
states that social globalization has a positive impact on women. Information flow,
exchange of ideas and images are good for women´s social rights while personal contacts
and communication with people in different countries is good for women´s economic
empowerment.

4
Theory also states that the more international activity a country is engaged in, the
more likely they are to be affected by norms and ideas of other countries (Gray-Kittilson
and Sandholtz, 2006). Assuming that the norms and ideas of the international society is
positive for women´s rights, social globalization should have a positive effect on the
welfare and work life of women. According to theory social globalization, including
tourism and information flows could be expected to affect education levels positively.
Increased possibility of working abroad could also increase the incentives for education
with greater payoffs (Stark, 2004)
Spread of information, norms and ideas are also related to international
organizations and political globalization. Norms and ideas that are dominant in the
international society spread through international organizations and forums. Higher
degree of participation and appreciation of these international mediums indicates that the
norms and ideas of the international society are more likely to be integrated in the
domestic policies (Gray, Kittlson and Sandholtz, 2006.). International conventions like
the Convention on Elimination of all forms of Discrimination Against Women, CEDAW,
as well as international conferences and declarations that highlight health, physical quality
of life and employment with purpose to improve the living standard of women should
therefore have a positive effect on the domestic norms and ideas regarding women’s
welfare and work life. In addition there are an increased number of Non-Governmental
Organizations, NGOs, discussing women’s rights. A country signing these conventions
and declarations makes it possible for the NGOs to pressure the governments for
improved living conditions, decreasing the gender gap in the country (Gray, Kittlson and
Sandholtz, 2006).
Exploring differences between developing and developed countries the Stolper-
Samuelson theorem predicts that countries abundant in low-skilled labor will focus on the
production of low-skilled goods. Increased trade and increased economic globalization
should therefore benefit low-skilled workers in low-skilled labor abundant countries.
Reflecting upon history, the fact that men traditionally have received higher education
while women often have been responsible for household duties it is reasonable to assume
that women often work in low-skilled labor market segments and that globalization
should lead to gains benefiting women. On the contrary, countries abundant in high-
skilled workers specialize their production in producing high-skilled goods. Assuming
that women, compared to men, more often work in low-skilled labor force segments
therefore means that men will gain more then women from free trade in high-skilled

5
countries (Feenstra, 2003) Globalization in the sense of the Stolper-Samuelson argument
is viewed as job creating indicating that more people get an opportunity to afford to pay
for the cost of education and better healthcare themselves. Looking at prior studies
authors like Zafiris Tzannatos (1999) looks at the level and changes in female and male
labor force participation rates, employment segregation and female relative to male
wages. The paper finds that differences in employment and wages are diminishing much
faster in developing then developed countries. Furthermore Niklas Potrafke (2012)
analyzes the effect of globalization for women in developing countries. Using the Social
Institutions and Gender Index (SIGI) Potrafke considers different aspects of institutions
that govern women´s choices in daily life. He further uses the KOF index of globalization
to separate the effect of social, political and economic globalization. The results indicate
that globalization is good for women, strengthening institutions positively correlated with
gender equality. The results also indicate that it is the social and economic aspects of
globalization that affects institutions related to gender equality the most. Ozler (2000) examines the relationship between increased export activity and share
of female employment in developing countries using plant-level data from Turkey. The
results show trade liberalization has led to larger employment gains for women relative to
men in the manufacturing sector. However, looking at the employment distribution of
different sectors it is visible that women still often work in low-paying jobs.
2.4 Hypothesis
Summing up we see that the result of previous studies differs, although most studies
indicates that there are differences between countries and that the relationship between
globalization and female relative to male health, education and work force participation is
positive. The hypothesis of this study is, based on theory and previous studies, that all
aspect of globalization has a positive impact on women´s welfare and work life relative to
men. The differences between countries imply that women in high-income countries
benefit less from globalization measuring labor force participation in relative terms.
Excluding all OECD countries therefore should lead to a larger positive coefficient
measuring economic globalization and labor force participation.

6
3. Data and Method
3.1 Data
Analyzing the relationship between globalization and gender equality in welfare and
work life I use panel data for the years 1970-2012, covering up to 171 countries. To limit
the effect of missing observations mean values are calculated with five-year intervals,
1970-1974, 1975-1979, 1980-1984, 1985-1989, 1990-1994, 1995-1999, 2000-2004, 2005-
2009 and 2010-2012. All data is collected from the World Bank indicators unless
indicated otherwise, (World Bank, 2014.)
Dependent variables:
Estimating the effect on gender equality in welfare and work life are calculated
using a ratio for all dependent variables, taking women divide by men.
To approximate the effect on welfare and work life the variables are chosen to estimate
relative health, education and economic participation.
Gender equality in welfare is tested using two dependent variables. Life expectancy
at birth, measured in years, assumed to reflect health condition and physical quality of life
in a country, and school enrollment in primary, secondary and tertiary education,
measured as gross percentage. Women´s work life is considered looking at labor force
participation rate and labor force participation rates in the service, agriculture and
industry sectors. Labor force participation rate is measured as a percentage of female
divided by male population ages 15-64 (modeled ILO estimate) and labor force
participation rate in sectors is measured as a percentage of female employees of female
employment divided by male employees of male employment.
Independent variables:
The main independent variable used for this thesis is globalization, using the KOF
index of globalization invented by Dehre (2006). This index includes 23 variables,
combined in to three sub-dimensions, social, political and economic globalization. These
three sub-dimensions are in turn composed to one index measuring globalization. Social
globalization concerning norms and cultural values, include data on personal contact,
information flows, as well as cultural proximity’s like the numbers of McDonald´s
restaurants in each country. Political globalization considers integration on a political
engagement level, measuring number of embassies, membership in international
7
organizations and participation in the UN Security Council missions. Finally, the index of
economic globalization is composed of data covering trade of goods and service as well
as capital flows (Dehre, 2006). Looking at scatter plots of the data I decided to use the
logarithm of the KOF index. Moreover, suspecting that it may take some years before the
effect of globalization is visible in the variables measuring gender equality in welfare and
work life. The KOF index is lagged, implying that the observations for the years 1970-
1974 correspond to the years 1975-1979.
Additional independent variables are added measuring population in total numbers,
GDP per capita PPP for constant 2005 international dollars and fertility rate measured
by total birth per women. Some of the dependent variables are also used as independent
variables in some of the regressions. These variables are added to control for effects that
otherwise might lead to misinterpretations of the effect globalization has on the dependent
variables. To get a better fit of the model I use the logarithm of both population and GDP
per capita.
Before concluding the final specification two more variables were tested, the
portion of seats held by women in national parliaments as a percentage as well as the
Polity IV, data measuring democracy (Monty G, Jaggers and Gurr, 2002). Controlling for
these factors had a big impact on some of the other variables, especially the effect of
globalization witch might be because both portion of seats held by women in national
parliaments and degree of democracy in a country are closely related to globalization.
This view is strengthened by articles like David Held (1997) and Barry Eichengreen as
well as David Lebland (2008). Suspecting that, both portion of seats held by women in
national parliaments and the democracy measure, can be seen as part of the effect of
globalization, both variables where excluded from the final regression.

8
3.2 Descriptive statistics Table 1: Descriptive statistics
Obs Mean St.Dev. Min Max
Ln KOF overallt-1 1376 3.728607 .398259 2.625326 4.525861 Ln KOF socialt-1 1424 3.543833 .5971013 1.813195 4.526729 Ln KOF political t-1 1522 3.525046 1.014271 0 4.581878 Ln KOF economic t-1 1116 3.814727 .4405713 2.25918 4.584162 Female/male life expectancy at birth 11753 1.074441 .0375349 .9543503 1.328 Female/male primary school enrollment 1099 1.03038 .5052011 . .0375542 5.76471 Female/male secondary school enrollment 1337 .8922341 .2527706 .0836498 1.790718 Female/male tertiary school enrollment 1165 .912246 .6170583 .030042 6.894963 Female/male labor force participation 875 .6918734 .213061 .1295285 1.085396 Female/male labor force agriculture 693 .7170631 .5024997 0 2.933985 Female/male labor force industry 695 .5579992 .3649538 .05 4.096296 Female/male labor force Service 695 1.341685 .3863941 .083004 3.272727 Ln GDP 1178 8.553303 1.261791 5.244886 11.59016 Fertility rate 1747 3.825814 1.965313 .872 9.1464 Ln population 1846 14.99369 2.289469 9.232943 21.01905 Non-OECD 1854 .8398058 .366885 0 1
Analyzing descriptive statistics it is visible that the mean values for life expectancy
at birth, primary school enrollment and labor force participation in the service sector are
larger for women then men. On the contrary, mean values for secondary and tertiary
school enrollment as well as labor force participation, overall, agriculture and industry,
are smaller then one, meaning that they are smaller for women then for men.

9
3.3 Method
Four main empirical models where specified for this thesis, measuring life
expectancy, school enrollment, labor force participation and labor force distribution
in the service, agricultural and industry sector. As explained in section 3.1 all of the
dependent variables are calculated in relative terms, women divided by men.
(1) Life expectancy
Lif.exp = β0 + β1*ln(KOF)it-1 + β2*ln (GDPit + β3*Lab.forit + β4*Fertit + β5*ln(Pop)it +
β6*Sch.sec it + uit
(2) Primary, secondary and tertiary school enrollment.
Sch.enr = β0 + β1*ln(KOF)it-1 + β2* ln(GDP)it + β3* Fert it + β4*ln (Pop)it + uit
(3) Labor force participation
Lab.for= β0 + β1*ln(KOF)it-1 + β2* ln(GDP)it + β3* Fertit + β4*ln (Pop)it
+ β5* Sch.secit + uit
(4) Labor force distributions in the agriculture, service and industry sector
Lab.dis = β0 + β1*ln(KOF)it-1 + β2* ln(GDP)it + β3* Fertit + β4*ln (Pop)it
+ β5* Sch.secit + uit
With i = 1…N; t = 1…T
In section 4.1 and 4.4, globalization is measured using over all globalization
,KOFove, while the regressions in section 4.2 and 4.3 use social, political and economic
globalization separated, KOFsoc, KOFpol and KOFeco.
Testing the sensitivity of the model section 4.3 analyzes whether the effect is robust
excluding OECD countries. Further a Hausman specification test indicated that running
the regressions with a fixed effects model specification best matches the data. All of the
regressions in section 4.1, 4.2 and 4.3 are therefore performed using fixed effects.
However, a random effects model is performed as a sensitivity test in section 4.4.All
regressions are performed controlling for robust standard errors.

10
4. Empirical results and analysis Testing the effect of globalization on gender equality in welfare and work life all of
the regressions use the dependent variables measured as a ratio of female relative to male.
The results can therefore not tell if the absolute effect for women and men is negative or
positive. However, combined with descriptive statistics the results indicate whether
globalization significantly affects gender equality and, if it does, the results may also
indicate whether globalization increases or decreases gender equality.
The tables in section 4.1 are presented including control variables. To show how the
regressions are built and to estimate the sensitivity of the results control variables are
added in steps, expressed in different columns. Control variables used in section 4.1 are
also used in section 4.2, 4.3 and 4.4, however, they are excluded from the tables to save
space.
4.1 Overall globalization
Table 2: Overall globalization and female/male life expectancy
(1) Life expectancy
(2) Life expectancy
Ln KOF Overall t-1 0.0112 0.00536 (0.0159) (0.0171) Ln GDP -0.000162 0.00272 (0.00248) (0.00388) Labor force 0.00477 0.00131 (0.0816) (0.0822) Fertility 0.00293 (0.00243) Ln population -0.000879 (0.00124) Secondary education 0.0195 (0.0350) Constant 1.033*** 1.018*** (0.0787) (0.0856) Observations 367 367 R-squared 0.002 0.012 Number of Countries 136 136 Robust standard errors in parentheses * Significant at 10%. ** Significant at 5%. *** Significant at 1%.
11
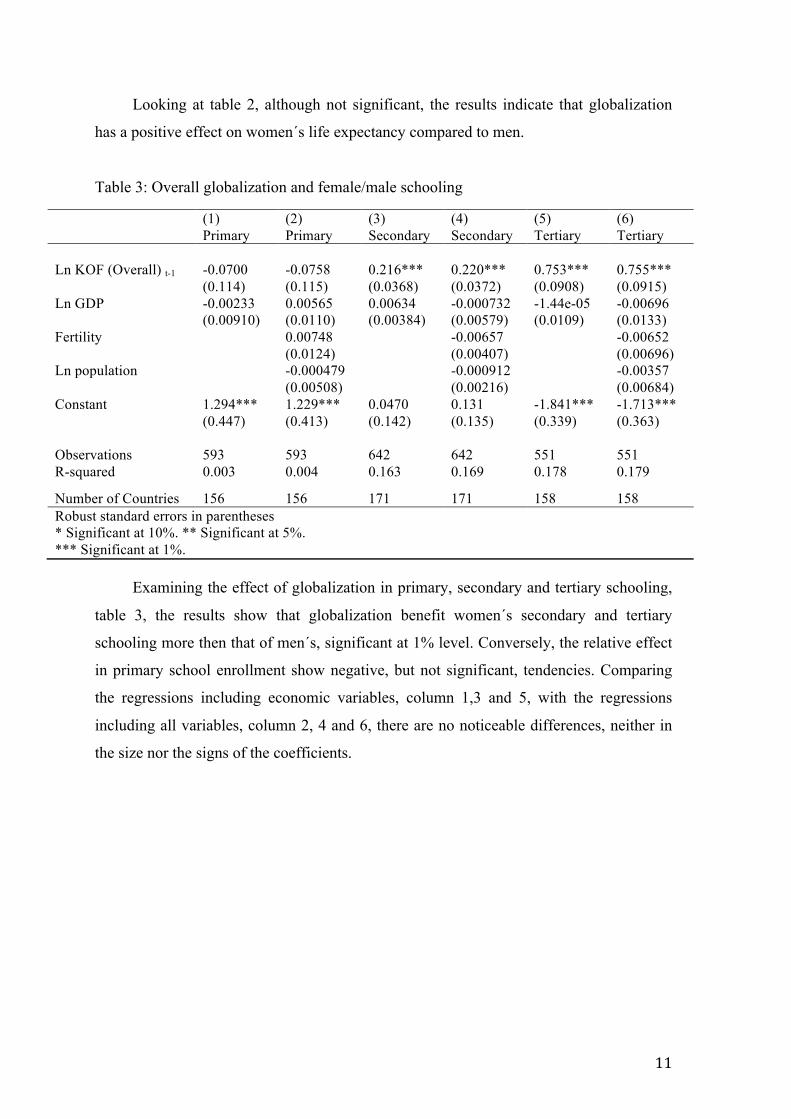
Looking at table 2, although not significant, the results indicate that globalization
has a positive effect on women´s life expectancy compared to men.
Table 3: Overall globalization and female/male schooling
(1) (2) (3) (4) (5) (6) Primary Primary Secondary Secondary Tertiary Tertiary Ln KOF (Overall) t-1 -0.0700 -0.0758 0.216*** 0.220*** 0.753*** 0.755*** (0.114) (0.115) (0.0368) (0.0372) (0.0908) (0.0915) Ln GDP -0.00233 0.00565 0.00634 -0.000732 -1.44e-05 -0.00696 (0.00910) (0.0110) (0.00384) (0.00579) (0.0109) (0.0133) Fertility 0.00748 -0.00657 -0.00652 (0.0124) (0.00407) (0.00696) Ln population -0.000479 -0.000912 -0.00357 (0.00508) (0.00216) (0.00684) Constant 1.294*** 1.229*** 0.0470 0.131 -1.841*** -1.713*** (0.447) (0.413) (0.142) (0.135) (0.339) (0.363) Observations 593 593 642 642 551 551 R-squared 0.003 0.004 0.163 0.169 0.178 0.179
Number of Countries 156 156 171 171 158 158 Robust standard errors in parentheses * Significant at 10%. ** Significant at 5%. *** Significant at 1%.
Examining the effect of globalization in primary, secondary and tertiary schooling,
table 3, the results show that globalization benefit women´s secondary and tertiary
schooling more then that of men´s, significant at 1% level. Conversely, the relative effect
in primary school enrollment show negative, but not significant, tendencies. Comparing
the regressions including economic variables, column 1,3 and 5, with the regressions
including all variables, column 2, 4 and 6, there are no noticeable differences, neither in
the size nor the signs of the coefficients.

12
Table 4: Overall globalization and female/male labor force participation
(1) Labor force participation
(2) Labor force participation
KOF (Overall) t-1 0.138*** 0.138*** (0.0212) (0.0213) Ln (GDP) 0.00203 0.000967 (0.00172) (0.00247) Fertility -0.00110 (0.00198) Secondary education 0.0329 (0.0458) Ln (population) -0.00126 (0.000928) Constant 0.135 0.138 (0.0835) (0.0884) Observations 382 382 R-squared 0.299 0.307 Number of Countries 136 136 Robust standard errors in parentheses * Significant at 10%. ** Significant at 5%. *** Significant at 1%.
Tables 4 show the relationship between overall globalization and female relative to
male labor force participation. Both column 1 and 2 show a positive coefficient of 0.138
significant at 1% level. Looking at the control variables fertility has a negative, although
insignificant coefficient.
The results, testing the effect of overall globalization and labor force participation in the
service, agriculture and industry sectors are displayed in table 5. The sign of the coefficients
estimating the effect in the service sector is positive while the effect in the agriculture sector
seems to be negative. Both coefficients measuring the effect in the industry sector are
substantially negative and significant at 1% level.

13
Table 5: Overall globalization and female/male sector distribution
(1) (2) (3) (4) (5) (6) Service Service Agriculture Agriculture Industry Industry KOF (Overall) t-1 0.0840 0.0783 -0.0933 -0.0870 -0.564*** -0.540*** (0.0695) (0.0763) (0.166) (0.162) (0.135) (0.135) Ln (GDP) -0.00227 -0.000959 -0.0106 -0.0212* 0.00948 0.0101 (0.00731) (0.00938) (0.0102) (0.0126) (0.00646) (0.0103) Fertility 0.00137 -0.0122 0.000962 (0.00654) (0.00887) (0.00677) Secondary education 0.0379 0.0221 -0.173* (0.220) (0.174) (0.0990) Ln (population) 0.00218 -0.00816 0.00329 (0.00392) (0.00551) (0.00356) Constant 1.047*** 0.984*** 1.149* 1.362** 2.699*** 2.709*** (0.278) (0.303) (0.654) (0.626) (0.508) (0.453) Observations 320 320 320 320 320 320 R-squared 0.015 0.018 0.015 0.032 0.343 0.353
Number of Countries 123 123 123 123 123 123 Robust standard errors in parentheses * Significant at 10%. ** Significant at 5%. *** Significant at 1%.
4.2 Social, political and economic globalization
In this section the regressions are tested looking at the effect of social, political and
economic globalization. As mentioned before using the KOF index of globalization makes it
possible to investigate whether there are any aspects of globalization that affects gender
equality more or less.

14
Table 6: Social, political and economic globalization and female/male life expectancy
(1) (2) (3) (4) Life expectancy Life expectancy Life expectancy Life expectancy Ln KOF (Social) t-1 0.00170 -0.00672 (0.0171) (0.0250) Ln KOF (Political) t-1 0.0128 0.0178 (0.0100) (0.0138) Ln KOF (Economic) t-1 0.00169 -0.00671 (0.0159) (0.0205) Observations 292 292 292 292 R-squared 0.031 0.036 0.031 0.037 Number of countries 107 107 107 107
Robust standard errors in parentheses * Significant at 10%. ** Significant at 5%. *** Significant at 1%.
Testing the relationship between social, political, economic globalization and life
expectancy all coefficient are positive, tested separately. Controlling for the other aspects of
globalization the sign of the coefficient indicate that social and economic globalization has a
negative effect on female relative to male life expectancy. None of the results are significant
at 10% level.
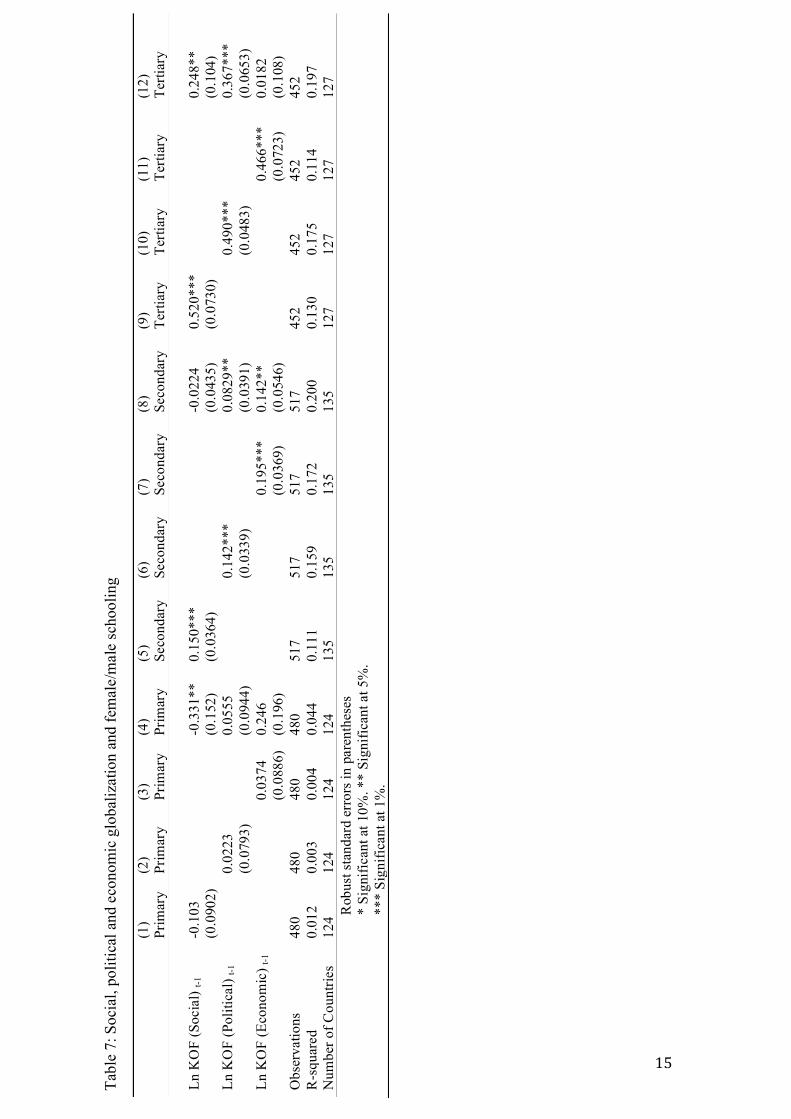
As seen in table 7 social globalization is negative for female relative to male primary
education, furthermore the effect is significant at 5% level controlling for political and
economic globalization. The effect in secondary and tertiary school enrollment is positive and
significant in all columns except when estimating the effect in secondary school enrollment
while controlling for political and economic globalization, column 8. Political globalization
show positive tendencies for primary school enrolment as well as significant and positive
effects for secondary and tertiary school enrollment. Economic globalization is positive for all
levels of school enrollment. Estimating the effect on secondary school enrollment both
coefficients are significant. Considering tertiary school enrolment the effect is significant
when not controlling for social and political globalization, column 3. Looking at the size of
the coefficients it is notable that social globalization has the largest effect on primary school
enrolment.
.
15
Tabl
e 7:
Soc
ial,
polit
ical
and
eco
nom
ic g
loba
lizat
ion
and
fem
ale/
mal
e sc
hool
ing
(1
) (2
) (3
) (4
) (5
) (6
) (7
) (8
) (9
) (1
0)
(11)
(1
2)
Pr
imar
y Pr
imar
y Pr
imar
y Pr
imar
y Se
cond
ary
Seco
ndar
y Se
cond
ary
Seco
ndar
y Te
rtiar
y Te
rtiar
y Te
rtiar
y Te
rtiar
y
Ln K
OF
(Soc
ial)
t-1
-0.1
03
-0.3
31**
0.
150*
**
-0.0
224
0.52
0***
0.
248*
*
(0.0
902)
(0
.152
) (0
.036
4)
(0.0
435)
(0
.073
0)
(0.1
04)
Ln K
OF
(Pol
itica
l) t-1
0.02
23
0.
0555
0.14
2***
0.08
29**
0.49
0***
0.36
7***
(0
.079
3)
(0
.094
4)
(0
.033
9)
(0
.039
1)
(0
.048
3)
(0
.065
3)
Ln K
OF
(Eco
nom
ic) t
-1
0.03
74
0.24
6
0.
195*
**
0.14
2**
0.46
6***
0.
0182
(0.0
886)
(0
.196
)
(0
.036
9)
(0.0
546)
(0
.072
3)
(0.1
08)
Obs
erva
tions
48
0 48
0 48
0 48
0 51
7 51
7 51
7 51
7 45
2 45
2 45
2 45
2 R
-squ
ared
0.
012
0.00
3 0.
004
0.04
4 0.
111
0.15
9 0.
172
0.20
0 0.
130
0.17
5 0.
114
0.19
7 N
umbe
r of C
ount
ries
124
124
124
124
135
135
135
135
127
127
127
127
Rob
ust s
tand
ard
erro
rs in
par
enth
eses
*
Sign
ifica
nt a
t 10%
. **
Sign
ifica
nt a
t 5%
. **
* Si
gnifi
cant
at 1
%.
16
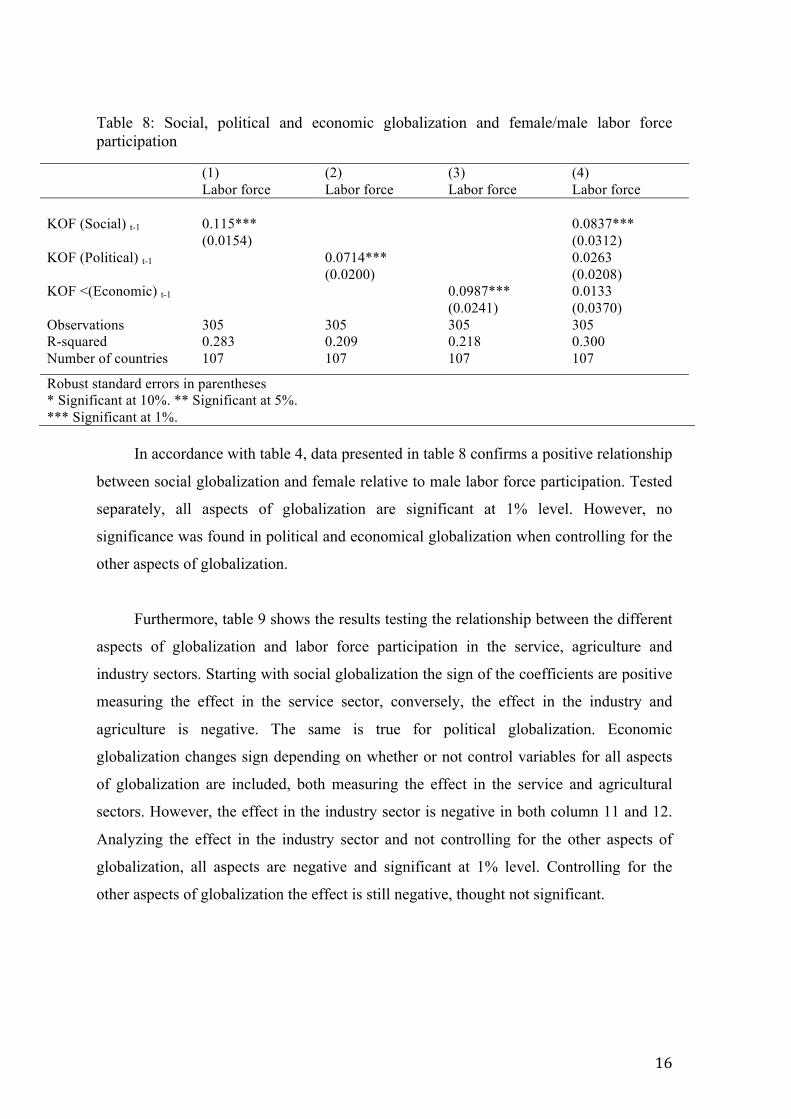
Table 8: Social, political and economic globalization and female/male labor force participation
(1) (2) (3) (4) Labor force Labor force Labor force Labor force KOF (Social) t-1 0.115*** 0.0837*** (0.0154) (0.0312) KOF (Political) t-1 0.0714*** 0.0263 (0.0200) (0.0208) KOF <(Economic) t-1 0.0987*** 0.0133 (0.0241) (0.0370) Observations 305 305 305 305 R-squared 0.283 0.209 0.218 0.300 Number of countries 107 107 107 107
Robust standard errors in parentheses * Significant at 10%. ** Significant at 5%. *** Significant at 1%.
In accordance with table 4, data presented in table 8 confirms a positive relationship
between social globalization and female relative to male labor force participation. Tested
separately, all aspects of globalization are significant at 1% level. However, no
significance was found in political and economical globalization when controlling for the
other aspects of globalization.
Furthermore, table 9 shows the results testing the relationship between the different
aspects of globalization and labor force participation in the service, agriculture and
industry sectors. Starting with social globalization the sign of the coefficients are positive
measuring the effect in the service sector, conversely, the effect in the industry and
agriculture is negative. The same is true for political globalization. Economic
globalization changes sign depending on whether or not control variables for all aspects
of globalization are included, both measuring the effect in the service and agricultural
sectors. However, the effect in the industry sector is negative in both column 11 and 12.
Analyzing the effect in the industry sector and not controlling for the other aspects of
globalization, all aspects are negative and significant at 1% level. Controlling for the
other aspects of globalization the effect is still negative, thought not significant.

17
The
effe
ct in
the
indu
stry
sect
or
Tabl
e 9:
Soc
ial,
polit
ical
, eco
nom
ic g
loba
lizat
ion
and
labo
r for
ce d
istri
butio
n in
sect
ors
(1
) (2
) (3
) (4
) (5
) (6
) (7
) (8
) (9
) (1
0)
(11)
(1
2)
Se
rvic
e Se
rvic
e Se
rvic
e Se
rvic
e A
gric
ultu
re
Agr
icul
ture
A
gric
ultu
re
Agr
icul
ture
In
dust
ry
Indu
stry
In
dust
ry
Indu
stry
KO
F (S
ocia
l) t-1
0.
0573
0.
0512
-0
.106
-0
.214
-0
.366
***
-0.0
768
(0
.058
7)
(0.0
739)
(0
.118
)
(0
.156
) (0
.075
8)
(0.1
21)
KO
F (P
oliti
cal)
t-1
0.
0772
0.08
14
-0
.049
7
-0.0
197
-0
.365
***
-0
.096
5
(0
.057
5)
(0
.075
1)
(0
.105
)
(0.0
985)
(0.1
07)
(0
.065
0)
KO
F (E
cono
mic
) t-1
0.
0534
-0
.061
5
-0
.045
1 0.
180
-0.5
06**
* -0
.354
(0.0
750)
(0
.114
)
(0
.160
) (0
.223
)
(0
.147
) (0
.244
) O
bser
vatio
ns
284
284
284
284
284
284
284
284
284
284
284
284
R-s
quar
ed
0.02
8 0.
034
0.02
3 0.
037
0.04
7 0.
035
0.03
4 0.
057
0.30
4 0.
273
0.37
3 0.
385
Num
ber o
f Cou
ntrie
s 10
3 10
3 10
3 10
3 10
3 10
3 10
3 10
3 10
3 10
3 10
3 10
3 R
obus
t sta
ndar
d er
rors
in p
aren
thes
es
* Si
gnifi
cant
at 1
0%. *
* Si
gnifi
cant
at 5
%.
***
Sign
ifica
nt a
t 1%
.
18
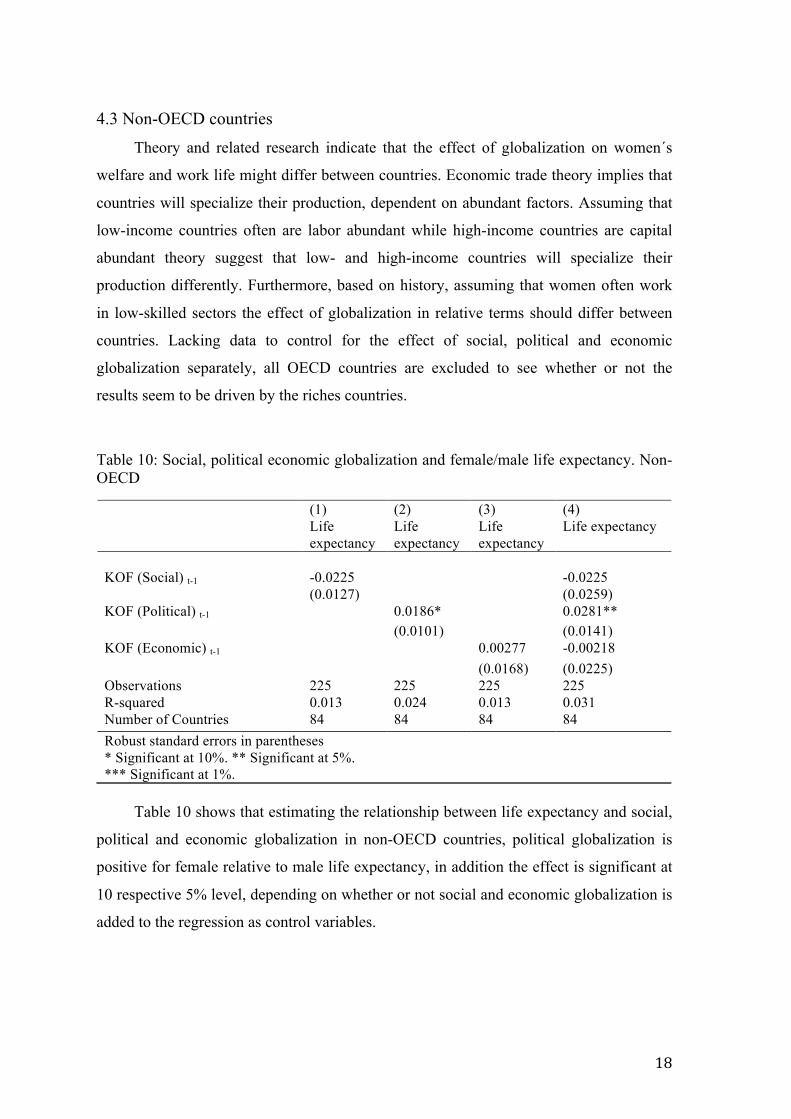
4.3 Non-OECD countries
Theory and related research indicate that the effect of globalization on women´s
welfare and work life might differ between countries. Economic trade theory implies that
countries will specialize their production, dependent on abundant factors. Assuming that
low-income countries often are labor abundant while high-income countries are capital
abundant theory suggest that low- and high-income countries will specialize their
production differently. Furthermore, based on history, assuming that women often work
in low-skilled sectors the effect of globalization in relative terms should differ between
countries. Lacking data to control for the effect of social, political and economic
globalization separately, all OECD countries are excluded to see whether or not the
results seem to be driven by the riches countries.
Table 10: Social, political economic globalization and female/male life expectancy. Non-OECD
(1) (2) (3) (4) Life
expectancy Life expectancy
Life expectancy
Life expectancy
KOF (Social) t-1 -0.0225 -0.0225 (0.0127) (0.0259) KOF (Political) t-1 0.0186* 0.0281** (0.0101) (0.0141) KOF (Economic) t-1 0.00277 -0.00218 (0.0168) (0.0225) Observations 225 225 225 225 R-squared 0.013 0.024 0.013 0.031 Number of Countries 84 84 84 84 Robust standard errors in parentheses * Significant at 10%. ** Significant at 5%. *** Significant at 1%.
Table 10 shows that estimating the relationship between life expectancy and social,
political and economic globalization in non-OECD countries, political globalization is
positive for female relative to male life expectancy, in addition the effect is significant at
10 respective 5% level, depending on whether or not social and economic globalization is
added to the regression as control variables.
19
Tabl
e 11
: Soc
ial,
polit
ical
eco
nom
ic g
loba
lizat
ion
and
fem
ale/
mal
e sc
hool
ing.
Non
-OEC
D
(1
) (2
) (3
) (4
) (5
) (6
) (7
) (8
) (9
) (1
0)
(11)
(1
2)
Pr
imar
y Pr
imar
y Pr
imar
y Pr
imar
y Se
cond
ary
Seco
ndar
y Se
cond
ary
Seco
ndar
y Te
rtiar
y Te
rtiar
y Te
rtiar
y Te
rtiar
y
KO
F (S
ocia
l) t-1
-0
.143
-0
.413
**
0.16
4***
0.
0176
0.
504*
**
0.16
2
(0.1
07)
(0.1
82)
(0.0
398)
(0
.043
3)
(0.0
775)
(0
.104
) K
OF
(Pol
itica
l) t-1
0.02
04
0.
0746
0.12
5***
0.05
75
0.
480*
**
0.
384*
**
(0.0
832)
(0.0
975)
(0.0
329)
(0.0
364)
(0.0
489)
(0.0
572)
K
OF
(Eco
nom
ic) t
-1
0.02
11
0.26
8
0.
190*
**
0.12
6**
0.45
7***
0.
0478
(0.1
01)
(0.2
26)
(0.0
402)
(0
.058
8)
(0.0
683)
(0
.084
9)
Obs
erva
tions
37
4 37
4 37
4 37
4 38
6 38
6 38
6 38
6 34
3 34
3 34
3 34
3 R
-squ
ared
0.
017
0.00
2 0.
001
0.05
4 0.
134
0.14
8 0.
179
0.19
9 0.
204
0.32
2 0.
194
0.34
2 N
umbe
r of
Cou
ntrie
s 98
98
98
98
10
4 10
4 10
4 10
4 10
0 10
0 10
0 10
0
Rob
ust s
tand
ard
erro
rs in
par
enth
eses
*
Sign
ifica
nt a
t 10%
. **
Sign
ifica
nt a
t 5%
. **
* Si
gnifi
cant
at 1
%.
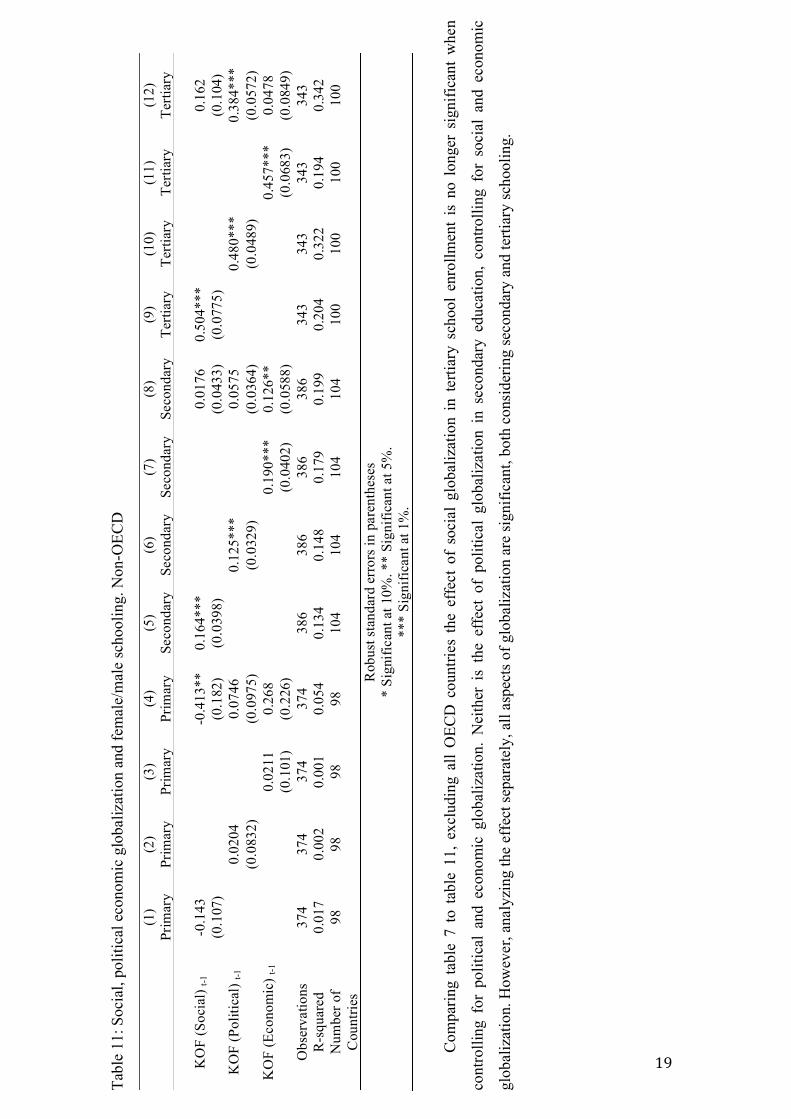
Com
parin
g ta
ble
7 to
tab
le 1
1, e
xclu
ding
all
OEC
D c
ount
ries
the
effe
ct o
f so
cial
glo
baliz
atio
n in
ter
tiary
sch
ool
enro
llmen
t is
no
long
er s
igni
fican
t w
hen
cont
rolli
ng f
or p
oliti
cal
and
econ
omic
glo
baliz
atio
n. N
eith
er i
s th
e ef
fect
of
polit
ical
glo
baliz
atio
n in
sec
onda
ry e
duca
tion,
con
trolli
ng f
or s
ocia
l an
d ec
onom
ic
glob
aliz
atio
n. H
owev
er, a
naly
zing
the
effe
ct se
para
tely
, all
aspe
cts o
f glo
baliz
atio
n ar
e si
gnifi
cant
, bot
h co
nsid
erin
g se
cond
ary
and
terti
ary
scho
olin
g.

20
Table 12: Social, political economic globalization and female/male labor force participation. Non-OECD
(1) (2) (3) (4) Labor force Labor force Labor force Labor force KOF (Social) t-1 0.0986*** 0.0769** (0.0148) (0.0328) KOF (Political) t-1 0.0639*** 0.0313
(0.0193) (0.0218) KOF (Economic) t-1 0.0775*** -0.00633
(0.0227) (0.0358) Observations 235 235 235 235 R-squared 0.288 0.241 0.208 0.310 Number of Countries 84 84 84 84
Robust standard errors in parentheses * Significant at 10%. ** Significant at 5%. *** Significant at 1%.
Excluding OECD countries from the regression measuring the effect of social,
political and economic globalization in labor force participation do not indicate any large
changes in the significant coefficients. Analyzing the effect separately, not including
social, political and economic globalization in the control variables, all aspects of
globalization are significant at 1% level.
21
Tabl
e 13
: Soc
ial,
polit
ical
and
eco
nom
ic g
loba
lizat
ion
and
fem
ale/
mal
e se
ctor
dis
tribu
tion.
Non
-OEC
D
(1
) (2
) (3
) (4
) (5
) (6
) (7
) (8
) (9
) (1
0)
(11)
(1
2)
Se
rvic
e Se
rvic
e Se
rvic
e Se
rvic
e A
gric
ultu
re
Agr
icul
ture
A
gric
ultu
re
Agr
icul
ture
In
dust
ry
Indu
stry
In
dust
ry
Indu
stry
KO
F (S
ocia
l) t-1
0.
168*
*
0.
149
0.09
25
-0.0
0956
-0
.365
***
0.03
34
(0
.080
7)
(0.0
908)
(0
.159
)
(0
.211
) (0
.122
)
(0
.189
) K
OF
(Pol
itica
l) t-1
0.12
3*
0.
0513
0.01
83
-0
.159
-0.3
70**
*
-0.1
38
(0.0
695)
(0.0
924)
(0.1
32)
(0
.125
)
(0.1
32)
(0
.090
1)
KO
F (E
cono
mic
) t-1
0.
151
-0.0
258
0.14
8 0.
300
-0.5
09**
-0
.413
(0.1
04)
(0.1
65)
(0.1
98)
(0.2
96)
(0.2
05)
(0.3
45)
Obs
erva
tions
17
2 17
2 17
2 17
2 17
2 17
2 17
2 17
2 16
0 16
0 16
0 17
2 R
-squ
ared
0.
103
0.08
0 0.
080
0.10
6 0.
037
0.02
9 0.
046
0.06
0 0.
168
0.15
4 0.
150
0.37
5 N
umbe
r of
C
ount
ries
73
73
73
73
73
73
73
73
88
88
88
73
Rob
ust s
tand
ard
erro
rs in
par
enth
eses
*
Sign
ifica
nt a
t 10%
. **
Sign
ifica
nt a
t 5%
. **
* Si
gnifi
cant
at 1
%.
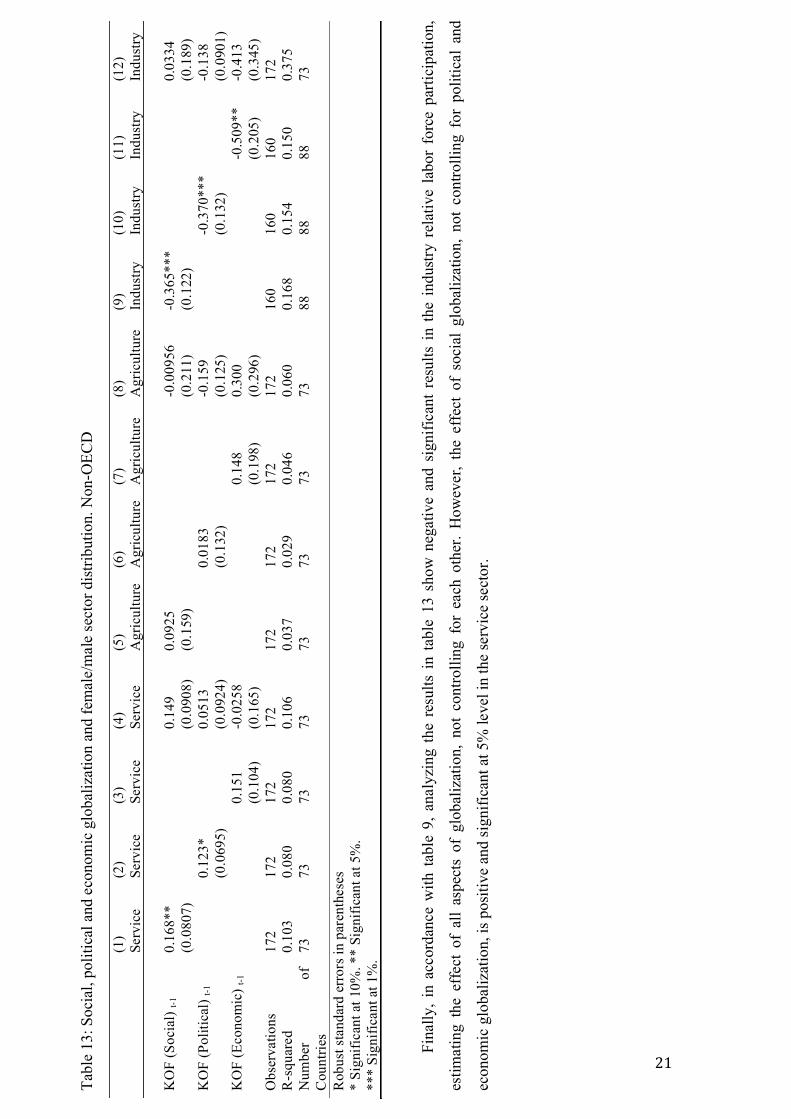
Fi
nally
, in
acco
rdan
ce w
ith t
able
9, a
naly
zing
the
res
ults
in
tabl
e 13
sho
w n
egat
ive
and
sign
ifica
nt r
esul
ts i
n th
e in
dust
ry r
elat
ive
labo
r fo
rce
parti
cipa
tion,
estim
atin
g th
e ef
fect
of
all
aspe
cts
of g
loba
lizat
ion,
not
con
trolli
ng f
or e
ach
othe
r. H
owev
er,
the
effe
ct o
f so
cial
glo
baliz
atio
n, n
ot c
ontro
lling
for
pol
itica
l an
d
econ
omic
glo
baliz
atio
n, is
pos
itive
and
sign
ifica
nt a
t 5%
leve
l in
the
serv
ice
sect
or.
22
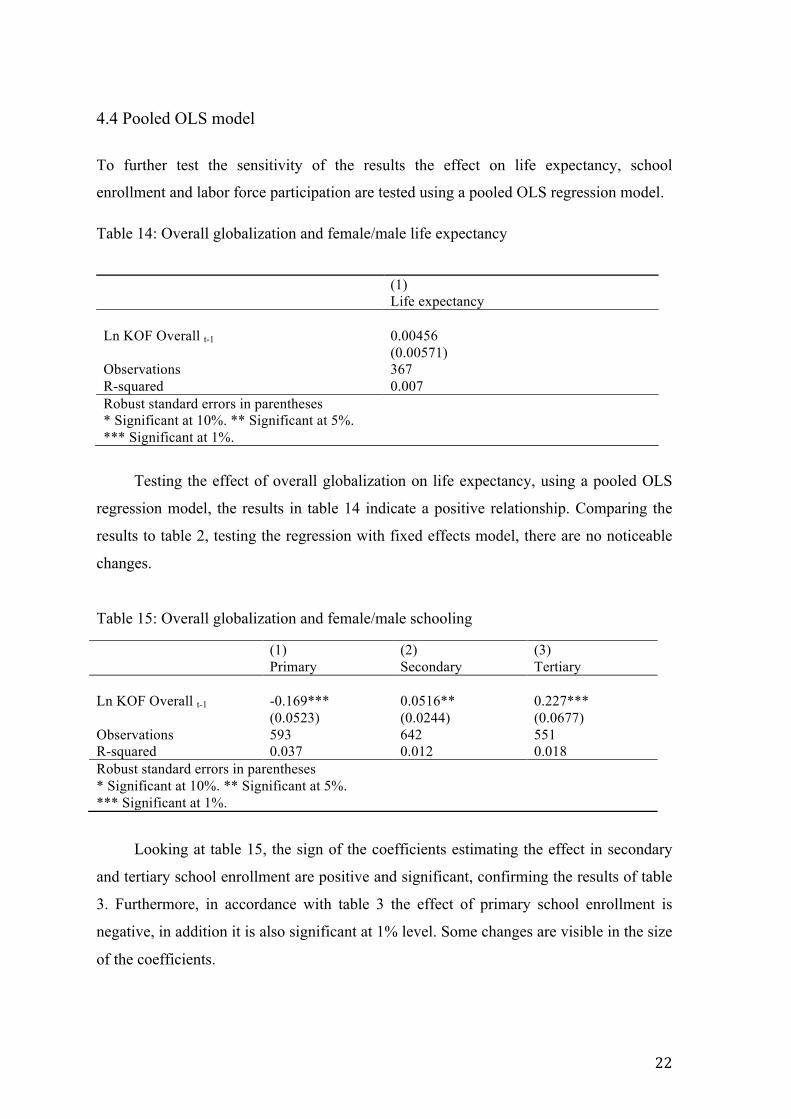
4.4 Pooled OLS model
To further test the sensitivity of the results the effect on life expectancy, school
enrollment and labor force participation are tested using a pooled OLS regression model.
Table 14: Overall globalization and female/male life expectancy
Testing the effect of overall globalization on life expectancy, using a pooled OLS
regression model, the results in table 14 indicate a positive relationship. Comparing the
results to table 2, testing the regression with fixed effects model, there are no noticeable
changes.
Table 15: Overall globalization and female/male schooling
(1) (2) (3) Primary Secondary Tertiary Ln KOF Overall t-1 -0.169*** 0.0516** 0.227*** (0.0523) (0.0244) (0.0677) Observations 593 642 551 R-squared 0.037 0.012 0.018 Robust standard errors in parentheses * Significant at 10%. ** Significant at 5%. *** Significant at 1%.
Looking at table 15, the sign of the coefficients estimating the effect in secondary
and tertiary school enrollment are positive and significant, confirming the results of table
3. Furthermore, in accordance with table 3 the effect of primary school enrollment is
negative, in addition it is also significant at 1% level. Some changes are visible in the size
of the coefficients.
(1) Life expectancy
Ln KOF Overall t-1 0.00456 (0.00571) Observations 367 R-squared 0.007 Robust standard errors in parentheses * Significant at 10%. ** Significant at 5%. *** Significant at 1%.
23
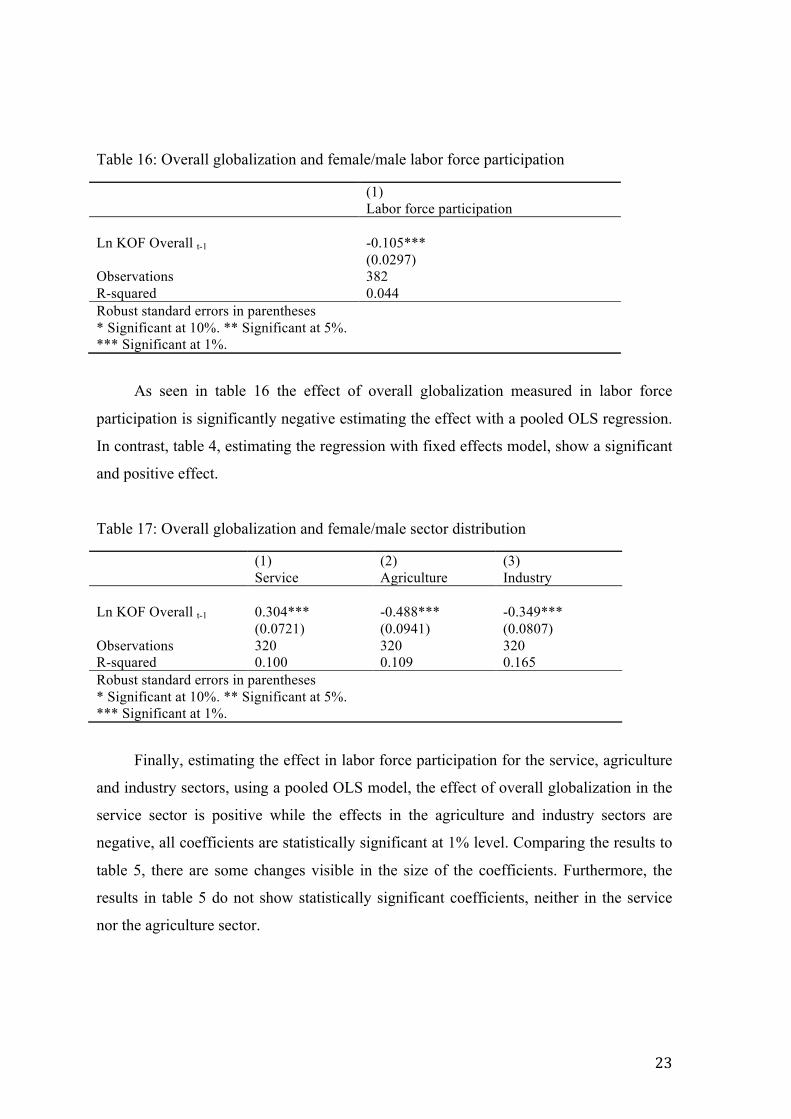
Table 16: Overall globalization and female/male labor force participation
(1) Labor force participation Ln KOF Overall t-1 -0.105*** (0.0297) Observations 382 R-squared 0.044 Robust standard errors in parentheses * Significant at 10%. ** Significant at 5%. *** Significant at 1%.
As seen in table 16 the effect of overall globalization measured in labor force
participation is significantly negative estimating the effect with a pooled OLS regression.
In contrast, table 4, estimating the regression with fixed effects model, show a significant
and positive effect.
Table 17: Overall globalization and female/male sector distribution
(1) (2) (3) Service Agriculture Industry Ln KOF Overall t-1 0.304*** -0.488*** -0.349*** (0.0721) (0.0941) (0.0807) Observations 320 320 320 R-squared 0.100 0.109 0.165 Robust standard errors in parentheses * Significant at 10%. ** Significant at 5%. *** Significant at 1%.
Finally, estimating the effect in labor force participation for the service, agriculture
and industry sectors, using a pooled OLS model, the effect of overall globalization in the
service sector is positive while the effects in the agriculture and industry sectors are
negative, all coefficients are statistically significant at 1% level. Comparing the results to
table 5, there are some changes visible in the size of the coefficients. Furthermore, the
results in table 5 do not show statistically significant coefficients, neither in the service
nor the agriculture sector.

24
5. Discussion Looking at descriptive statistics the mean value for female relative to male life
expectancy is 1.074441 indicating that women in average live longer then men.
Moreover, analyzing the relationship between globalization and female relative to male
life expectancy the results indicate a positive effect looking at overall globalization, both
using a fixed effects and pooled OLS regression model specification. Analyzing the effect
of social, political and economic globalization separately the coefficient indicates a
positive effect for all forms of globalization. However, according to these results
globalization tends to lead to an increase in the life expectancy gap between women and
men. Though, most of the results are statistically insignificant.
Further, looking at descriptive statistics, the mean value of primary school
enrollment indicates that more women then men are enrolled in primary school.
Considering secondary and tertiary schooling the pattern is the reversed. Testing the
relationship between globalization and school enrollment in secondary and tertiary
schooling the overall effect is positive and significant, both using a fixed effect and a
polled OLS regression model. Taking a closer look at the different levels of globalization
the effect is positive and significant for almost aspects of globalization, with some
exceptions using the other aspects of globalization as control variables. Excluding OECD
countries from the regression, the effect is the same as in previous tests, not including any
aspects of globalization as control variables. Summing up, in accordance with the
hypostasis, globalization mainly seems to have a positive effect in secondary and tertiary
school enrollment. In contrast, the regressions testing the relationship between
globalization and relative primary school enrollment mainly indicate insignificant but
negative effects. The results imply that globalization has a positive effect on gender
equality. In accordance with the hypothesis, globalization increases female relative to
male school enrollment in secondary and tertiary schooling, significantly reducing the
gap between women and men. Moreover, thought not significant, the results indicate that
globalization increase gender equality in primary school enrollment.
Analyzing the effect of globalization on gender equality within work life, the results
testing globalization and female relative to male labor force participation indicates both

25
positive and significant effects for women relative to men, looking at overall as well as
analyzing the effect of social, political and economic globalization separately.
The results indicate that the effect of globalization mainly seems to benefit women,
increasing gender equality. However, testing the effect of overall globalization using a
pooled OLS regression model the results show a negative significant effect.
Indicating that the results might be sensitive to changes in the model specification.
Finally, analyzing the effect in different sectors overall globalization in the industry
sector is significantly negative. Looking at social political and economic globalization,
without controlling for each other, the same is true for all aspects of globalization. Both
excluding OECD countries from the regressions as well as testing the effect using a
pooled OLS regression model, the result is robust. Indicating that globalization, in
contrast to the hypothesis, is negative for gender equality within labor force participation
in the industry sector. Looking at descriptive statistics it is visible that this is a male
dominated sector and the results indicate that globalization further increase the portion of
men working in this sector.
The results confirm that globalization is a complex phenomenon. Testing the
relationship for different aspects of globalization there are no clear pattern indicating that
one aspect of globalization affects gender equality more or less then the others.
Furthermore, testing different regression models and changing the control variables as
well as the number of countries included in the regression, it is reasonable to believe that
the results might be a bit sensitive for changes in the model specification. However, the
results studying school enrollment and labor force participation in the industry sector are
fairly robust for all of the regressions.

26
6. Conclusion This thesis analyzes the relationship between social, political, economic
globalization and gender equality in welfare and work life. Concluding the results
globalization seems to have a positive effect on female relative to male secondary and
tertiary school enrollment, both testing overall as well as social, political and economic
globalization.
The effect on labor force participation seems to be positive both testing overall as
well as social, political and economic globalization. In addition, the effect tends to be
most robust testing the effect of social globalization. However, using a pooled OLS
model specification the coefficients are significantly negative.
Considering labor force participation in different sectors the results indicate that
globalization has a negative effect on female relative to male labor force participation in
the industry sector, significant both testing overall as well as social, political and
economic globalization and excluding OECD countries.
Answering the research question of this paper, whether globalization affects gender
equality within welfare and work life, and furthermore, if there are any differences visible
in the effect of social, political and economic globalization, the results are mainly
positive. According to these results, globalization overall has a significant positive effect
both on gender equality in secondary and tertiary schooling as well as labor force
participation. However, the effect in the industry sector is negative, decreasing gender
equality Furthermore, as seen by the results from related research, the effect of
globalization may differ between countries. Further research is therefore needed to define
a more robust relationship between the different aspects of globalization and gender
equality in welfare and work life. It could for example be interesting to further analyze
differences between low- and high-income countries and social, political and economic
globalization.

27
7. References
Arribas, I., Pérez, F., Tortosa-Ausina, E., 2009. Measuring Globalization of International Trade: Theory and Evidence. World Development 37, 127–145. doi:10.1016/j.worlddev.2008.03.009
Bussmann, M., 2009. The Effect of Trade Openness on Women’s Welfare and Work Life. World Development 37, 1027–1038. doi:10.1016/j.worlddev.2008.10.007
Cho, S.-Y., 2013. Integrating Equality: Globalization, Women’s Rights, and Human Trafficking. International Studies Quarterly 57, 683–697. doi:10.1111/isqu.12056
Dollar, D., Gatti, R., 1999. Gender inequality, income and growth: Are good times good for women? Policy Research Report on Gender and Development Working Paper Series no. 1World Bank, Washington DC.
Dreher, A., 2006. Does globalization affect growth? Evidence from a new index of
globalization. Applied Economics 38, 1091–1110. doi:10.1080/00036840500392078
Eichengreen, B., Leblang, D., 2008. Democracy and globalization. Economics & politics 20, 289–334.
Feenstra, Robert C. Advanced International Trade: Theory and Evidence. Princeton
University Press, 2003.
Gray, M.M., Kittilson, M.C., Sandholtz, W., 2006. Women and Globalization: A Study of 180 Countries, 1975-2000. International Organization 293. doi:10.2307/3877895
Held, D., 1997. Democracy and Globalization. Global Governance 3, 251.
Klasen, S.( 1 ), Lamanna, F.( 2 ), 2009. The impact of gender inequality in education and
employment on economic growth: New evidence for a panel of countries. Feminist Economics 15, 91–132. doi:10.1080/13545700902893106
Marshall, Monty G., Keith Jaggers, and Ted Robert Gurr. "Polity IV dataset." Computer file (2002).
Ozler, S., 2000. Export orientation and female share of employment: Evidence from Turkey. World Development 28, 1239–1248. doi:10.1016/S0305-750X(00)00034-6
Potrafke, N., Ursprung, H.W., 2012. Globalization and gender equality in the course of development. European Journal of Political Economy 28, 399–413. doi:10.1016/j.ejpoleco.2012.04.001 .
Stark, O., 2004. Rethinking the Brain Drain. World Development 32, 15–22. doi:10.1016/j.worlddev.2003.06.013

28
Tzannatos, Z., 1999. Women and Labor Market Changes in the Global Economy: Growth Helps, Inequalities Hurt and... World Development 27, 551
World Bank (2014). World development indicators. Washington, DC: World Bank.

29
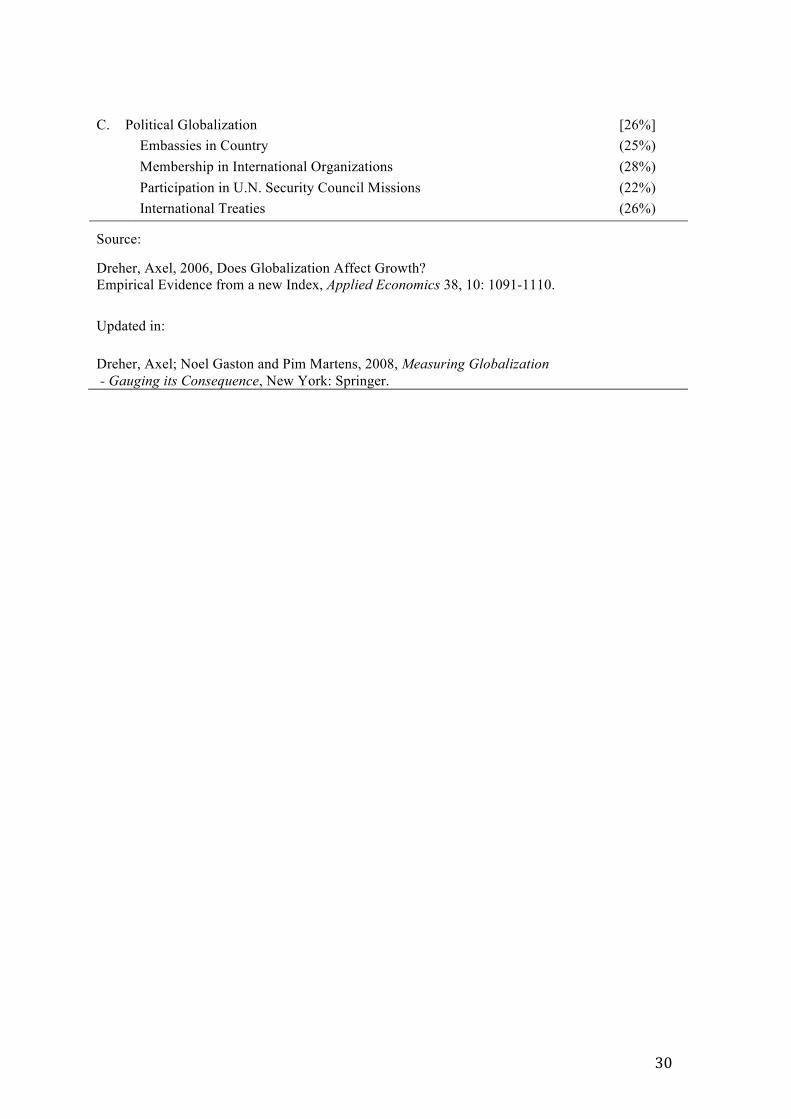
8. Appendix Table 18: 2013 KOF Index of Globalization
Indices and Variables Weights
A. Economic Globalization [36%] i) Actual Flows (50%) Trade (percent of GDP) (21%) Foreign Direct Investment, stocks (percent of GDP) (28%) Portfolio Investment (percent of GDP) (24%) Income Payments to Foreign Nationals (percent of GDP) (27%) ii) Restrictions (50%) Hidden Import Barriers (24%) Mean Tariff Rate (27%) Taxes on International Trade (percent of current revenue) (26%) Capital Account Restrictions (23%) B. Social Globalization [37%] i) Data on Personal Contact (34%) Telephone Traffic (25%) Transfers (percent of GDP) (3%) International Tourism (26%) Foreign Population (percent of total population) (21%) International letters (per capita) (24%) ii) Data on Information Flows (35%) Internet Users (per 1000 people) (33%) Television (per 1000 people) (36%) Trade in Newspapers (percent of GDP) (31%) iii) Data on Cultural Proximity (31%) Number of McDonald's Restaurants (per capita) (45%) Number of Ikea (per capita) (45%) Trade in books (percent of GDP) (10%)
30
C. Political Globalization [26%] Embassies in Country (25%) Membership in International Organizations (28%) Participation in U.N. Security Council Missions (22%) International Treaties (26%)
Source:
Dreher, Axel, 2006, Does Globalization Affect Growth? Empirical Evidence from a new Index, Applied Economics 38, 10: 1091-1110.
Updated in:
Dreher, Axel; Noel Gaston and Pim Martens, 2008, Measuring Globalization - Gauging its Consequence, New York: Springer.
31
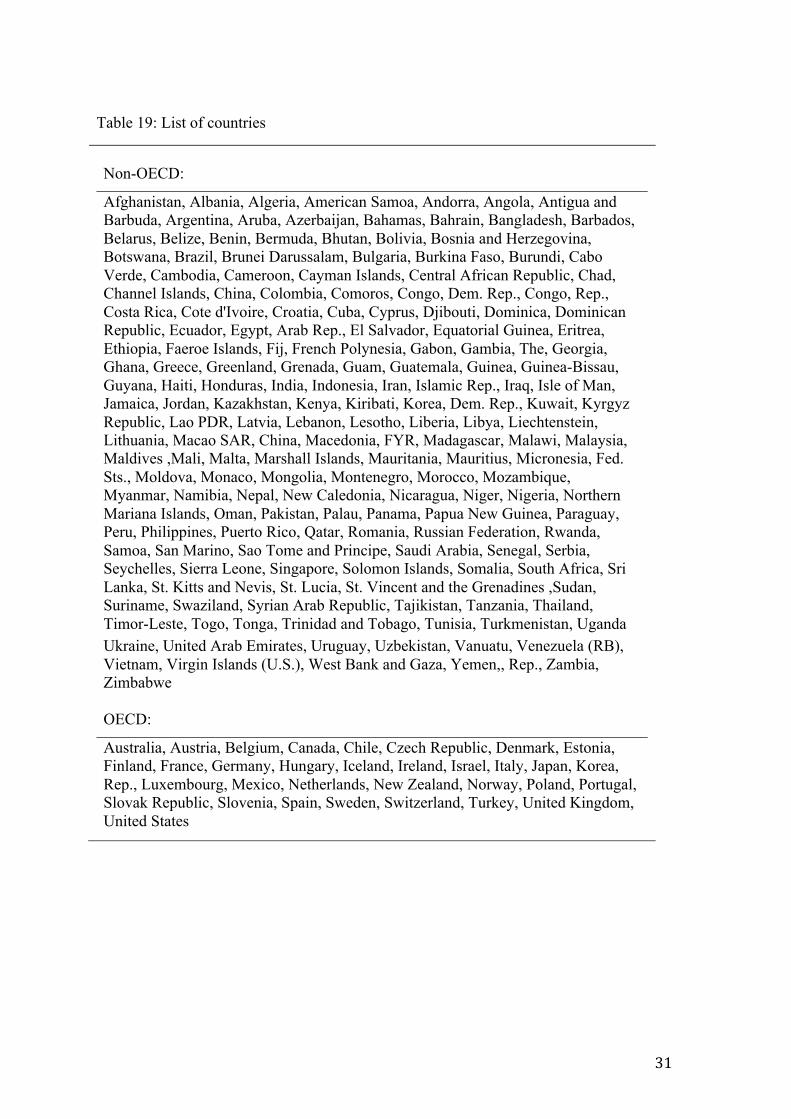
Table 19: List of countries
Non-OECD:
Afghanistan, Albania, Algeria, American Samoa, Andorra, Angola, Antigua and Barbuda, Argentina, Aruba, Azerbaijan, Bahamas, Bahrain, Bangladesh, Barbados, Belarus, Belize, Benin, Bermuda, Bhutan, Bolivia, Bosnia and Herzegovina, Botswana, Brazil, Brunei Darussalam, Bulgaria, Burkina Faso, Burundi, Cabo Verde, Cambodia, Cameroon, Cayman Islands, Central African Republic, Chad, Channel Islands, China, Colombia, Comoros, Congo, Dem. Rep., Congo, Rep., Costa Rica, Cote d'Ivoire, Croatia, Cuba, Cyprus, Djibouti, Dominica, Dominican Republic, Ecuador, Egypt, Arab Rep., El Salvador, Equatorial Guinea, Eritrea, Ethiopia, Faeroe Islands, Fij, French Polynesia, Gabon, Gambia, The, Georgia, Ghana, Greece, Greenland, Grenada, Guam, Guatemala, Guinea, Guinea-Bissau, Guyana, Haiti, Honduras, India, Indonesia, Iran, Islamic Rep., Iraq, Isle of Man, Jamaica, Jordan, Kazakhstan, Kenya, Kiribati, Korea, Dem. Rep., Kuwait, Kyrgyz Republic, Lao PDR, Latvia, Lebanon, Lesotho, Liberia, Libya, Liechtenstein, Lithuania, Macao SAR, China, Macedonia, FYR, Madagascar, Malawi, Malaysia, Maldives ,Mali, Malta, Marshall Islands, Mauritania, Mauritius, Micronesia, Fed. Sts., Moldova, Monaco, Mongolia, Montenegro, Morocco, Mozambique, Myanmar, Namibia, Nepal, New Caledonia, Nicaragua, Niger, Nigeria, Northern Mariana Islands, Oman, Pakistan, Palau, Panama, Papua New Guinea, Paraguay, Peru, Philippines, Puerto Rico, Qatar, Romania, Russian Federation, Rwanda, Samoa, San Marino, Sao Tome and Principe, Saudi Arabia, Senegal, Serbia, Seychelles, Sierra Leone, Singapore, Solomon Islands, Somalia, South Africa, Sri Lanka, St. Kitts and Nevis, St. Lucia, St. Vincent and the Grenadines ,Sudan, Suriname, Swaziland, Syrian Arab Republic, Tajikistan, Tanzania, Thailand, Timor-Leste, Togo, Tonga, Trinidad and Tobago, Tunisia, Turkmenistan, Uganda Ukraine, United Arab Emirates, Uruguay, Uzbekistan, Vanuatu, Venezuela (RB), Vietnam, Virgin Islands (U.S.), West Bank and Gaza, Yemen,, Rep., Zambia, Zimbabwe OECD:
Australia, Austria, Belgium, Canada, Chile, Czech Republic, Denmark, Estonia, Finland, France, Germany, Hungary, Iceland, Ireland, Israel, Italy, Japan, Korea, Rep., Luxembourg, Mexico, Netherlands, New Zealand, Norway, Poland, Portugal, Slovak Republic, Slovenia, Spain, Sweden, Switzerland, Turkey, United Kingdom, United States

32
Tabl
e 20
: Cor
rela
tion
mat
rix
K
OF.
K
OF.
K
OF.
K
OF.
Li
fe.
Prim
. Se
c.
Ter.
Labo
r A
gri.
Ind.
Se
rv.
Fert.
G
DP
Pop.
D
emo.
Pa
rl.
ove
soc
pol
eco
exp
forc
e
KO
Fove
1.
0000
K
OFs
oc
0.90
98
1.00
00
K
OFp
ol
0.57
40
0.
2825
1.00
00
KO
Feco
0.
8893
0.
7968
0.
2629
1.00
00
Li
fe.e
xp
-0.0
903
-0
.105
5
-0.0
639
-0
.043
6
1.00
00
Prim
. 0.
0005
0.10
15
-0.1
098
-0.0
310
0.
0154
1.00
00
Se
c.
0.
1318
0.14
09
-0.0
912
0.
2239
-0
.001
2
0.30
23
1.00
00
Ter.
0.
2015
0.19
89
0.
0332
0.22
59
-0.1
356
0.
2509
0.74
86
1.
0000
Labo
r fo
rce
-0
.072
2
0.05
91
-0.2
168
-0
.071
8
-0.0
302
0.
2432
0.08
51
0.
0971
1.00
00
Agr
i. -0
.312
7 -0
.385
5
0.13
61
-0.4
084
0.
0631
0.00
46
-0.0
293
-0
.078
8
0.04
69
1.
0000
Ind.
-0
.442
2
-0.4
829
-0
.134
4
0.39
33
-0.0
337
0.
0394
-0
.134
1
-0.0
279
0.
1667
0.08
82
1.
0000
Se
rv.
0.28
63
0.
3166
-0
.012
9
0.32
85
-0.0
672
-0
.115
3
0.04
09
0.
0575
-0
.019
4
-0.6
458
-0
.066
7
1.00
00
Fe
rt.
-0.1
141
-0
.094
7
0.05
53
-0.2
071
0.
0390
0.03
90
-0.1
910
-0
.149
0
0.03
12
-0.0
602
0.
0935
-0
.023
5
1.00
00
GD
P 0.
0805
0.05
82
-0.0
148
0.
1371
0.06
40
-0.0
883
0.
1396
0.09
74
0.
0411
0.04
70
-0.0
394
-0
.002
8
-0.6
960
1
.000
0
Pop.
0.
1185
0.11
86
0.
0662
0.09
44
-0.1
530
0.
0894
-0
.033
3
0.05
71
-0.0
210
0.
0205
-0
.068
2
-0.0
158
-0
.076
2
0.04
68
1.
0000
D
emo.
0.
2832
0.
3105
0.
2457
0.
1375
0.
0505
-0
.243
5 0.
0163
-0
.056
2 -0
.027
2 0.
2541
-0
.265
6 -0
.024
3 -0
.043
0 0.
2362
0.
2362
1
.000
0
Parl.
0
.585
5 0.
5250
0.
3162
0.
5590
-0
.168
4 0.
3058
0.
1705
0.
3601
-0
.033
5 -0
.361
2 -0
.417
0 0.
3196
0.
2161
-0
.042
3 0.
0168
-0
.090
8 1.
0000