Emissions from Fires Consequences for Human Safety and …
129
Emissions from Fires Consequences for Human Safety and the Environment Blomqvist, Per 2005 Link to publication Citation for published version (APA): Blomqvist, P. (2005). Emissions from Fires Consequences for Human Safety and the Environment. Department of Fire Safety Engineering and Systems Safety, Lund University. Total number of authors: 1 General rights Unless other specific re-use rights are stated the following general rights apply: Copyright and moral rights for the publications made accessible in the public portal are retained by the authors and/or other copyright owners and it is a condition of accessing publications that users recognise and abide by the legal requirements associated with these rights. • Users may download and print one copy of any publication from the public portal for the purpose of private study or research. • You may not further distribute the material or use it for any profit-making activity or commercial gain • You may freely distribute the URL identifying the publication in the public portal Read more about Creative commons licenses: https://creativecommons.org/licenses/ Take down policy If you believe that this document breaches copyright please contact us providing details, and we will remove access to the work immediately and investigate your claim.
Transcript of Emissions from Fires Consequences for Human Safety and …

LUND UNIVERSITY
PO Box 117221 00 Lund+46 46-222 00 00
Emissions from Fires Consequences for Human Safety and the Environment
Blomqvist, Per
2005
Link to publication
Citation for published version (APA):Blomqvist, P. (2005). Emissions from Fires Consequences for Human Safety and the Environment. Departmentof Fire Safety Engineering and Systems Safety, Lund University.
Total number of authors:1
General rightsUnless other specific re-use rights are stated the following general rights apply:Copyright and moral rights for the publications made accessible in the public portal are retained by the authorsand/or other copyright owners and it is a condition of accessing publications that users recognise and abide by thelegal requirements associated with these rights. • Users may download and print one copy of any publication from the public portal for the purpose of private studyor research. • You may not further distribute the material or use it for any profit-making activity or commercial gain • You may freely distribute the URL identifying the publication in the public portal
Read more about Creative commons licenses: https://creativecommons.org/licenses/Take down policyIf you believe that this document breaches copyright please contact us providing details, and we will removeaccess to the work immediately and investigate your claim.

Emissions from Fires
Consequences for Human Safety and the Environment
Doctoral Thesis
Per Blomqvist
Submitted for the degree of Doctor of Philosophy at the
Department of Fire Safety Engineering Lund Institute of Technology
Lund University
Lund 2005

Department of Fire Safety Engineering
Lund Institute of Technology
Lund University
Box 118, SE-221 00 LUND
Sweden
Report 1030
ISSN 1402-3504
ISRN LUTVDG/TVBB--1030--SE
ISBN 91-628-6638-9
© Per Blomqvist, 2005
Printed by Tryckeriet i E-huset, Lund University, Lund, Sweden
September 2005

Emissions from Fires
i
Abstract
Accidental fires represent a risk for people from the heat and fire effluents produced. It is clear from fire statistics that it is, in fact, the toxic gases that kill and injure many fire victims. Further, there are a number of compounds that are readily produced in fires, which have important sublethal effects on humans. Some of those compounds are known to have a long-term effect on people, and fires might significantly contribute to the emission of such compounds to the environment.
Although, the importance of the quality of the fire effluents has been acknowledged for a long time in the fire science community, information on the detailed composition is to some degree missing. In particular, there has been a lack of real-scale fire experiments including detailed chemical analysis, to confirming the present knowledge-base, which in many cases relies on data from small-scale experiments.
The work presented in this thesis is largely based on the results of a number of unique series of large-scale fire experiments, where the composition of the fire effluents has been characterised in detail. The analyses have included many types of species, e.g.: narcotic fire gases such as CO and HCN, irritants such as HF, HCl and isocyanates, carcinogenic compounds such as benzene, PAHs and dioxins. The particulate phase of the fire effluents has also been characterised in a number of tests.
Information on the production of toxic gases, such as HCN, is important for estimating the time for evacuation in case of fires in buildings. Quantitative information on HCN, and other toxic gases relevant for an evacuation scenario, has been determined in real-scale fire experiments. An application of an FED model for asphyxiant gases, showed that these gases presented the greatest danger in a series of experimental tunnel fires, and that HCN, in particular, had a major impact in these fires.
Further, a chemical kinetic model included in a computational fluid dynamic (CFD) study, has been evaluated for the prediction of HCN production in fires. The prediction of the model was satisfactory compared to the results of large-scale enclosure tests.
An estimate of the total amounts of dioxin, PAH and VOC from fires in Sweden during a specific year was made, by combining the amounts of materials involved in fires with emission factors for these fires. It was concluded that the emissions of PAH, VOC and dioxins from fires are large. The fire related emissions of PAH and dioxins were further shown to be significant and comparable to those from many other sources. For dioxins it is further clear that large catastrophic fires can lead to major emissions.
Key words: fire effluents, large-scale experiments, chemical characterisation, quantitative analysis, gases, PAH, dioxin, particles, emissions, simulations, CFD, incapacitation

Emissions from Fires
ii

Emissions from Fires
iii
Acknowledgements
I sincerely wish to thank Professor Göran Holmstedt, my supervisor at Lund University, for giving me the opportunity to complete my PhD-work at the Department of Fire Technology.
I would like to thank Dr. Patrick Van Hees at SP, who has guided me through the obstacle of writing a thesis, and has given me much valuable advice during the process. I would further like to thank Dr. Margaret Simonson at SP, for proof reading this thesis, and for her cooperation in research projects over the years.
I am indebted to several colleagues at SP, as carrying out a project in fire science is most often a team-work. Colleagues that have been of especial importance are: Anders Lönnermark, Lars Rosell, Dr. Tommy Hertzberg and Dr. Heimo Tuovinen. The work of many other at SP, including the competent technical staff, is further gratefully acknowledged.
My PhD-work, and the projects this thesis is based on, could never have been accomplished without the support of a number of organizations. I am most grateful for the support of my PhD-work from the Centre for Combustion Science and Technology, CECOST, (granted through SSF, the Swedish Foundation for Strategic Research and, STEM, the Swedish Energy Agency), and the opportunity to grow as a researcher in the excellent framework of academic courses and seminars that have been provided through this centre of excellence. I would also like to thank the Swedish Fire Research Board (Brandforsk), the Swedish Rescue Services Agency (SRV) and the Development Fund of the Swedish Construction Industry (SBUF) for their support to my research.
I would finally like to thank SP for giving me the time and resources to conduct (and finally complete) this work.

Emissions from Fires
iv

Emissions from Fires
v
List of publications
This thesis is based on the following papers:
I. Characterization of the combustion products in large-scale fire tests:
comparison of three experimental configurations
Blomqvist P. and Lönnermark A. Fire and Materials 25 (2000) 71-81
II. Study of fire behaviour and toxic gas production of cables in real-scale
tests
Blomqvist P., Van Hees P. and Simonson M. Paper in the Proceedings of the 6th International Fire and Materials Conference ‘99, San Antonio, Texas, USA, pp. 269-278 (1999)
III. Cable Fires in difficult to access areas - Study of the ventilation effect in
horizontal and vertical test set-ups
Van Hees P., Axelsson J. and Blomqvist P. Paper in the Proceedings of the 8th Fire and Materials Conference ‘03, San Francisco, California, USA, pp. 131-146 (2003)
IV. Emissions from Fires Part I: Fire Retarded and Non-Fire Retarded TV-sets
Blomqvist P., Rosell L. and Simonson M. Fire Technology 40 (2004) 39-58
V. Emissions from Fires Part II: Simulated Room Fires
Blomqvist P., Rosell L. and Simonson M. Fire Technology 40 (2004) 59-73
VI. Isocyanates and amines from fires – a screening over common materials
found in buildings
Blomqvist P., Hertzberg T., Dalene M. and Skarping G. Fire and Materials 27 (2003) 275-294
VII. Particles from fires – a screening over common materials found in
buildings
Hertzberg T. and Blomqvist P. Fire and Materials 27 (2003) 295-314
VIII. Modelling of hydrogen cyanide formation in room fires
Tuovinen H., Blomqvist P. and Saric F. Fire Safety Journal 39 (2004) 737-755
IX. Fire Emissions of Organics into the Atmosphere
Blomqvist P., Simonson M. and Persson B. Submitted to Fire Technology (2004)
X. Emissions from an Automobile Fire
Lönnermark A. and Blomqvist P. Accepted for publication in Chemosphere (2005)

Emissions from Fires
vi
In addition to the papers included in the thesis the author has also contributed to the following publications:
XI. Large scale indoor combustion experiments Ryderman A., Dahlberg M., Månsson M. and Blomqvist P. Paper in the Proceedings of the INDUSTRIAL FIRES Workshop, Apeldoorn, The Netherlands, pp. 289-300 (1993)
XII. Large scale indoor combustion experiments Ryderman A., Dahlberg M., Månsson M. and Blomqvist P. Paper in the Proceedings of the INDUSTRIAL FIRES II Workshop, Cadarache, France, pp. 89-96 (1994)
XIII. Fire Characteristics and Detailed Smoke Gas Analyses in Controlled
Under-Ventilated Large-Scale Combustion ExperimentsBlomqvist P., Lönnermark A., Månsson M. and Persson H. Paper in the Proceedings of the INDUSTRIAL FIRES III Workshop, Risø, Denmark, pp. 7-16 (1996)
XIV. Methodology for Measurements of Fire Characteristics and Smoke Gas
Composition in Controlled Under-ventilated Large-scale Combustion
ExperimentsBlomqvist P., Lönnermark A., Månsson M. and Persson H. Paper in the Proceedings of the Second International Conference on Fire Research and Engineering, Gaithersburg, Maryland, USA, pp. 314-324 (1997)
XV. Chemical characterization of the smoke gases in large-scale combustion
experimentsBlomqvist P., Lönnermark A., Månsson M. and Persson H. Paper in the Proceedings of Interflam ‘99, Edinburgh, Scotland, Volume 1, pp. 143-153 (1999)
XVI. Study of Fire Behaviour and Toxic Gas Production of Cables in Real-Scale
Fire TestsSimonson M., Blomqvist P. and Van Hees P. Poster abstract in the Proceedings of Interflam ‘99, Edinburgh, Scotland, Volume 2, pp. 1393-1401 (1999)
XVII. Extractive MethodsBlomqvist P. Presentation in Measurement Needs for Fire Safety: Proceedings of an International Workshop, NISTIR 6527, National Institute of Standards and Technology, Gaithersburg, MD, pp. 208-232 (2000)
XVIII. Measurement of Toxic Combustion Gases in Large-Scale Fire ExperimentsBlomqvist P. Licentiate thesis, Report OOK 00:02, ISSN 0283-8575, Inorganic Chemistry-Department of Chemistry, Gothenburg University, pp. 62 (2000)

Emissions from Fires
vii
XIX. Quantification of PAH, dioxins and other chemical species in fire gasesBlomqvist P., Rosell L. and Simonson M. Paper in the Proceedings of Interflam ‘01, Edinburgh, Scotland, Volume 1, pp. 37-48 (2001)
XX. Thermal Decomposition of Polymers and Construction Materials:
Experimental Kinetic Studies and Improved Pyrolysis ModelsSvenson J., Pettersson J. B. C., Blomqvist P., Van Hees P., Göransson U. and Holmstedt G. Poster abstract in the Proceedings of the Seventh (7th) International Symposium of the International Association for Fire Safety Science (IAFSS), Worcester, MA, USA, pp.1187-1187 (2002)
XXI. CFD Prediction of the Ventilation Effect on Cable Flame SpreadBlomqvist P., Axelsson J., Van Hees P. and Lannegrand G. Poster abstract in the Proceedings of the Seventh (7th) International Symposium of the International Association for Fire Safety Science (IAFSS), Worcester, MA, USA, pp.1169-1169 (2002)
XXII. Analysis of Mass Loss Rate from Cone Calorimeter Tests in Nitrogen
AtmosphereGöransson U. and Blomqvist P. Paper in the Proceedings of 4th International Seminar on Fire and Explosion Hazards, University of Ulster, Londonderry, Northern Ireland, UK, pp. 761-768 (2003)
XXIII. Fire-LCA Model: Furniture Case StudySimonson M., Anderson P. and Blomqvist P. Paper in the Proceedings of Flame Retardants ‘04, London, England, pp. 15-26 (2004)
XXIV. The environmental effect of furnitureAndersson P., Blomqvist P., Rosell L. and Simonson M. Paper in the Proceedings of Interflam ‘04, Edinburgh, Scotland, Volume 2, pp. 1467-1478 (2004)
XXV. Isocyanates in fire smokeHertzberg T., Blomqvist P., Dalene M. and Skarping G. Poster abstract in the Proceedings of Interflam ‘04, Edinburgh, Scotland, Volume 1, pp. 639-644 (2004)
XXVI. Particles from fire: Evaluation of the particulate fraction in fire effluents
using the cone calorimeterLe Tallec Y., Saragoza L., Hertzberg T. and Blomqvist P. Paper in the Proceedings of Interflam ‘04, Edinburgh, Scotland, Volume 2, pp. 1455-1466 (2004)
XXVII. Fire-LCA Model: Furniture Case StudySimonson M., Andersson P., Blomqvist P. and Stripple H. Paper in the Proceedings of Flame Retardants 2004, London, UK, pp. 15-26 (2004)

Emissions from Fires
viii
XXVIII. Thermal decomposition of PMMA and wood fiber boards: Experimental kinetic studies and improved pyrolysis modelsSvenson J., Pettersson J.B.C., Blomqvist P., Van Hees P., Göransson U. and Holmstedt G. Submitted to Fire&Materials (2004)
XXIX. Validation of CFD Model for Simulation of Spontaneous Ignition in Bio-
mass Fuel StorageZenghua Y., Blomqvist P., Göransson U., Holmstedt G., Wadsö L. and Van Hees P. Paper accepted for the 8th International Symposium on Fire Safety Science (IAFSS), Beijing, China (2005)

Emissions from Fires
ix
Table of contents
Abstract i
Acknowledgements iii
List of publications v
Table of contents ix
1 Introduction 1
1.1 Fire risks and consequences 1 1.2 The aim of this thesis 3 1.3 About the author and the outline of the thesis 5
2 Background and methods for experimental work 7
2.1 Combustion and fire 7 2.1.1 Combustion chemistry 7 2.1.2 Fire conditions 10 2.1.3 Generation of compounds in fires 11 2.2 Sampling and analytical methods 12 2.2.1 Sampling of fire gases 12 2.2.2 FTIR measurement 13 2.2.3 Organic compounds 19 2.2.4 Light extinction 22 2.2.5 Particles 22
3 Results and discussion of experimental work 25
3.1 Inorganic gases 25 3.1.1 Production as a function of ventilation 25 3.1.2 Toxic gases from cable fires 32 3.2 Organic compounds 38 3.2.1 Volatile organics 38 3.2.2 Semi-volatile/condensed phase organics 44 3.3 Particles 65
4 Theoretical work and applications 75
4.1 Computational modelling of fires 75 4.1.1 Background 75 4.1.2 Modelling of HCN formation 80 4.2 Human incapacitation in fires 86 4.2.1 Toxicity of fire gases 86 4.2.2 Models for exposure predictions 88 4.2.3 Incapacitation from toxic gases in tunnel fires 93 4.3 Emissions to the environment 97 4.3.1 Background 97 4.3.2 Estimate of total emissions to the atmosphere 97
5 Conclusions 101
6 References 105

Emissions from Fires
x

Introduction
1
1 Introduction
1.1 Fire risks and consequences
Fire is an acknowledged risk in our society that every year causes injures to numerous people and regularly results in significant number of fatalities. Between one hundred and one hundred fifty people are killed in fires in Sweden, each year. The number of fire death has been rather constant during the 90-ties and throughout the first years of the 21st century. The most recent statistics (2002) show that 126 fatal fires occurred that year, and that 137 people lost their lives in these fires [1]. The statistics further show that most fires with fatal outcome occurred in residences involving single persons. In 2002, 90 % of these fires occurred in dwellings with elderly males over-represented in the statistics. Based on the statistics for 2002 there were 15 people killed in fires per million inhabitants in Sweden. This figure is in accordance with the statistics for the United Sates, the UK and mainland Europe, where the number of fire death has been approximated to 14 per million inhabitants [2]. However, large catastrophic fires can occur that increase the fatality records for single years. An example of a severe incident occurring in Sweden is the discotheque fire in Gothenburg (1998) [3] where 63 young people lost their lives. Similarly, the Scandinavian Star fire in 1990 [4] was a severe incident with a high number of fatalities, 156 passenger and crewmembers were killed in this fire. Common for these two catastrophic fires was that a large number of people were gathered in an unfamiliar and confined space, with restricted access to escape, and that many of the victims were overcome by toxic smoke.
Apart from the fatal incidents a larger number of people are inflicted by non-fatal fire injuries, including various degrees of burns and lung damages. The number of people injured in fires in the UK in the end of the 90-ties, was approximately 20 times the number of fire death [2]. In Sweden there are no official statistics on the number of non-fatal fire injuries.
There are several hazards from fires that in unfortunate circumstances may lead to injuries or death. The heat and flames from fires are obvious risks. However, the effect of toxic smoke may actually be the greatest danger. It has been estimated that between 310 000 and 670 000 people are exposed (though in many cases briefly) to fire smoke in home fires in the US each year, and that on average 3 318 people are killed and 11 505 people are injured in fires due to smoke inhalation [5]. In the US the general consensus is that fire deaths from smoke inhalation occur in most cases after the fire has progressed beyond flashover, and that the victims are normally found in a room other than the room containing the flashed-over room [6].
Statistics from the UK show that injures and death caused by exposure to toxic smoke products increased considerably from the 50’s until the 80’s [2], and that approximately half of the fatalities and a third of all injured in dwelling fires at present are caused by exposure to toxic smoke products [2]. An increasing trend in the number of fatalities due to toxic smoke products has also been shown for fires in Sweden for the period 1961-1976 [7]. The increased number of fatalities caused by smoke products has been attributed to the increased use of modern synthetic materials but also to a higher density of combustibles in buildings and dwellings [2].

Emissions from Fires
2
Hence, it is accepted that the effects of toxic smoke poses one of the greatest risks to people in fires. This knowledge has, however, in general not been adequately reflected in research activities in the fire community, nor in standards or codes. The underlying reason is that current fire safety assessments of materials and products are largely based on testing and standards considering parameters such as ignitibility, heat release, flame spread and in some cases rate of smoke obscuration (not toxicity). The basic principle is to mitigate the fire risk and limit the fire spread in the case of ignition, thereby reducing the amount of combusted material that might produce toxic smoke gases. This is certainly a sound approach as a basis for a high level of fire safety. However, as testing almost exclusively focuses on the fire behaviour (i.e.
ignition, heat release and flame spread) of materials and products, detailed knowledge of the characteristics and production pattern of fire gases has generally not received deserved attention.
Much of the knowledge of materials and products is gained through standard product testing. There are however few mandatory standards that address the toxicity of smoke gases. This obviously varies between countries and regions, however as an example, the European fire classification system for construction products [8] does not include any requirement on combustion toxicity. There are, however, a few particular application areas where smoke toxicity is included in the regulations.
In the IMO regulations for the classification of surface materials for use in the interiors of ships there are rather detailed requirements on smoke toxicity [9]. Similarly, for materials intended for use in aircrafts there are regulations on smoke toxicity [10]. Although the concept of focusing on the basic fire properties of materials and products must be the foundation of fire safety, there does appear to be a gap between the information gained from testing and the possible effects of real materials and products in real fires. This issue was recently the focus of a project conducted by NIST, where it was concluded that the proper treatment of smoke toxicity in standards and codes has not yet been solved [11].
Of the toxic smoke products, carbon monoxide (CO) is recognized as the main toxic-ant in fires [12]. Hydrogen cyanide (HCN), elevated level of carbon dioxide (CO2), and oxygen vitiation are also important in their contribution to the asphyxiating characteristics of smoke gases. There are other components in smoke gases that cause sensory irritation to eyes and the upper respiratory tract. These compounds include acid gases produced from the combustion of halogen containing materials (where hydrogen chloride, HCl, is the most common), and a variety of organic compounds, such as: formaldehyde, acrolein and phenol. Irritant gases may have their greatest influence in reducing the speed of egress in the evacuation of people from a fire. But at higher concentrations of irritants, lung damages and oedema may result in death some time after exposure. Generally, the danger from fire gases is a combination of the toxic potency of the smoke and the time of exposure (i.e. dose related effects from aspyxiants). However, for irritants the sublethal effects are concentration related. In addition to gaseous species, condensed phase components in the fire effluents constitute an additional threat. Further, aerosols (smoke) reduce visibility, obstruct breathing and may contain nano-sized particles that can be trans-ported deep into the pulmonary tract.

Introduction
3
Although there are few frequently applied standard test methods assessing the content of fire smoke, knowledge has been gained from research activities over the years. There is information available in the literature on the occurrence and produc-tion of various fire gases, especially on important lethal gases such as CO [12-15] and HCN [16-18], but also to a lesser extent on sublethal organic compounds [19-21] which in some cases may have a more long-term effect. However, due to the comp-lexity of an uncontrolled combustion process (i.e. a fire), and partly due to the high costs associated with detailed chemical characterization, there are still many issues that remains to be solved.
Most existing studies of smoke gas toxicity have solely relied on data from small-scale physical fire models. It is, however, generally not straightforward to interpret such data in terms of smoke gas composition in real scale fires [2]. There is generally a lack of quantitative chemical data concerning fire effluents from real scale fires. As an example, in recent work conducted at NIST, it has been concluded that time dependent yield data for fire-generated gases from room fires are almost non-existent and are much needed [22].
The consequences of fires that have been focused on the most are the direct threats to people in the vicinity of a fire, and the economic losses associated with fires in terms of damage to buildings and infrastructure. However, fires additionally constitute a threat to the environment and may cause local acute effects on terrestrial and aquatic biotopes as well as being a potentially significant emission source of persistent bio-accumulating compounds, such as polychlorinated dibenzo-p-dioxins and polychlor-inated dibenzofurans. The adverse effects of fires on the environment were brought into focus by some large industrial fires in the 80’s [23] [24], perhaps most significantly the Sandoz fire in the Basel area where a long stretch of the river Rhine was seriously polluted by contaminated fire water run-off [25]. These incidents resulted in intensified research activity in industrial fires and some large research projects were launched in Europe [26-28]. The environmental effects from fires have been increasingly addressed also in standardisation work. At present this interest has resulted in a British Standard treating industrial plastic fires [29], and in on-going work in ISO/TC 92/SC 3 aimed on bringing forward a more general document on the environmental effects of fires.
1.2 The aim of this thesis
The aim of this thesis is to present and set into perspective unique quantitative infor-mation regarding the contents of fire effluents that have been gathered from a number of different fire scenarios. The production behaviour of important, lethal, fire gases, e.g. CO, HCN and HCl is analysed in this thesis. Further, some important, but in fire research previously rather neglected, components typically found in fire effluents, are assessed. These components include polycyclic aromatic hydrocarbons – PAHs, “dioxins”, i.e. polychlorinated and polybrominated dibenzo-p-dioxins and furans – PCDDs/PCDFs respective PBDDs/PBDFs, isocyanates and particulate matter. PAHs and dioxins have important sublethal effects on humans and emissions of these types of compounds are of potential environment concern. Isocyanates are potent irritants and are known to cause hypersensitivity from exposure, which is of particular concern to fire fighters and others that come into frequent contact with fire

Emissions from Fires
4
gases. The content of fine particulate matter in fire gases is of concern as these fine particles have a tendency to penetrate deep into the lungs. Research in this area espe-cially, has been limited in the fire community. Results from measurements of particle sizes and distributions in fire effluents are presented and discussed in the thesis.
The different steps involved in an evaluation of the consequences of the emissions from a fire are schematically outlined in Figure 1-1. The first step in such an evalu-ation is to determine the nature and quantities of the emissions from the fire. A detailed assessment includes the dynamics of production of each compound over the course of the fire. Several routes exist to obtain this information. The first alternative is to quantify the contents of the effluents from a large-scale fire test. In many cases this is the best available alternative at present. However, to conduct large-scale fire tests is expensive, and therefore very limited data is available with detailed chemical characterisation. In order to reduce testing costs, and to be able to assess the influ-ence of different fire loads, geometries etc., numerical modelling of fires, including detailed modelling of the gas phase chemistry is an important tool. Although numer-ical simulation of fires constitutes a growing branch in fire research world wide, a research area that has developed from the simpler zone-models to the more detailed computational fluid dynamics (CFD) models, there are currently no commercially available codes that can simulate the full spectrum of important fire gases and associated phenomenon in detail.
Figure 1-1 Routes for obtaining data on the production of fire gases from testing and mathematical simulation, and the two main applications for this data. The activities shown in solid boxes are included in the work presented in this thesis.

Introduction
5
In this thesis, quantitative results from measurements of fire gases from different large-scale scenarios are presented. Further, for one scenario, results from CFD simulations are presented, including detailed simulation of the gas phase chemistry. The results from these simulations are compared with the measured data from the fire tests.
Extrapolation from the characterisation of smoke gas components obtained from small-scale tests represents another possible means for obtaining information on the production of fire gases from a large scale fire. This type of data could form source terms for the introduction of gas species into numerical fire models. These types of assessments are not included in the thesis.
Data on the production of fire effluents are preferable for assessments of the acute effects of fire gases on humans in a fire. As outlined in Figure 1-1, there are gener-ally two possible methods for assessing the effects on human. The most appropriate approach is the use of detailed models based on the response (incapacitation or mortality) of humans (or in some cases monkeys) to toxic or irritant gases. An alternative, commonly applied, method is to base the assessment on the response of rodents to the specific toxicant or to the total fire atmosphere generated by a specific material. The response is determined in small-scale tests generating lethal dose (LD50) or lethal concentration (LC50) data. Using the later method it is assumed that the response of rodents can be transferred to that of a human. In this thesis, the first method is applied to a tunnel fire as an example of the assessment of effects from fire gases on people.
Data on the production of fire-generated compounds are also needed for evaluations of emissions to the environment. Such evaluations include detailed studies of the distribution of compounds, both local distribution in the area close to the fire site, and long-range transport. The estimate of the distribution of fire-generated compounds could include distribution to both air and water. These sorts of calcu-lations involve the use of advanced dispersal modelling. Another application is estimates of total emissions from fires to the environment. A specific group of compounds that have been in focus is dioxins. An inventory of fires in Sweden during one year has been conducted, and estimates were made on the total impact of these fires regarding emissions of important groups of organic compounds, including dioxins.
1.3 About the author and the outline of the thesis
I have during my employment at SP Swedish National Testing and Research Institute (1990 - at present) been involved in a number of high profile research projects where the smoke gases from various fires have been characterised. My research has prin-cipally focused on analysis of the combustion products from large-scale fire tests including the determination of source terms from industrial fires involving chemicals and polymers [30, 31], cable fires [32, 33] and the production of fire gases from room fires [34-36]. Further, small-scale experiments [35, 37] and measurement methodology [38, 39] have been an important part of my research activities.

Emissions from Fires
6
My background as an analytical chemist has allowed me to take an active part in the sampling and chemical analyses included in the research presented here. In most of the work I have planned and been responsible for the chemical analyses and the evaluation of the results. I have personally conducted the FTIR analysis included in this thesis, and also the wet-chemical analyses included in Paper I. Further, I have generally been involved in the design and interpretation of the various physical fire models relied on in this work. Regarding the computational fluid dynamics (CFD) simulations presented in this thesis, I was responsible for the computational grid and the validation data. I further took an active part in the design of the project and the evaluation of the results from the simulations.
Regarding the articles included in this thesis (I-X): in those cases where I appear as the first author, I was responsible for writing the article, with help and input from the co-writers; in those cases where I do not appear as first author, I took an active part in the writing process and wrote selected parts of the articles. I further took an active part in all experimental work presented in the articles, except for the experiments with carbon fibre materials in article VII.
The thesis is outlined as follows:
A background for the experimental work is given in Section 2, including a short general discussion of fire chemistry and a description of the analytical methods used in the experiments.
The most important experimental results are highlighted and analysed in Section 3.The main results from Paper I regarding the production of inorganic gases as a function of the global equivalence ratio are discussed in Section 3.1.1. The findings regarding the production of some inorganic gases in cable fires (Paper II and Paper III) are discussed in Section 3.1.2. The findings regarding the production of volatile organics (Paper I, IV, V and X) and isocyanate compounds from various common building materials (Paper VI) are discussed in Section 3.2.1. Quantitative results from measurements of PAHs, PCDDs/PCDFs and PBDDs/PBDFs (brominated dioxins) from Paper IV-V and Paper X are discussed in Section 3.2.2. The character-ization of size and distribution of fire-generated particles (Paper VII and Paper X) is discussed in Section 3.3.
The more theoretical work in this thesis is presented in Section 4. The mathematical simulation of fires, and specifically the application of CFD modelling including a detailed description of the gas phase chemistry (Paper VIII), is discussed in Section 4.1. Further, two application areas are discussed in Section 4 where detailed know-ledge of the quantitative production of fire gases is required (cf. Figure 1-1). In Section 4.2 there is a brief background given on available models for prediction of incapacitation in fires, and an application to the results from a tunnel fires is discussed as an example. Section 4.3 discusses the impact of emissions from fires on the environment. The most important results from a study based on fire statistics and source terms for VOC, PAH and dioxins (Paper IX) are discussed together with an experimental study of automobile fires (Paper X).

Background and methods for experimental work
7
2 Background and methods for experimental work
2.1 Combustion and fire
The physical processes and chemical reactions involved in a fire are multitude and result in a varying outcome, depending on the prevailing conditions. It is not the aim of this thesis to discuss the aspects of the underlying theories that provide detailed explanations of the different parts of the chemical phenomenon we call fire. However, a short discussion of the fundamental theory is appropriate to serve as a background for the presentation and assessment of experimental results presented later in this thesis.
2.1.1 Combustion chemistry
Combustion is a chemical reaction involving fuel and oxidizer that generates heat and products. There is no clear scientific distinction between the terms combustion and fire, but generally a fire is defined as “uncontrolled combustion”.
The flaming combustion of a solid organic material (e.g. a synthetic polymer or wood) is the type of combustion that generally first comes to mind when considering a fire. For this type of fire to occur, energy is initially needed to thermally break the chemical bonds in the material. There are a number of different mechanisms involved in the thermal decomposition of a polymer chain, including chain-scission, chain-stripping and cross-linking [40]. This overall process is denoted pyrolysis and produces volatile fragments, and in some cases solid char, from the original material. For initiation of the homogeneous combustion process (i.e. a combustion process solely taking place in the gas phase), a certain mixture of pyrolysis gases and oxygen is required. A higher temperature is required for auto ignition to occur compared to induced or piloted ignition, which is the more common ignition process in fires.
The complete combustion of an arbitrary hydrocarbon fuel can be described by the global reaction:
( ) ( ) energymnnmnm ++++ 2221
241 COOHOHC (2.1)
where m and n denotes the number of carbon atoms and hydrogen atoms in the fuel, respectively.
The combustion of even the simplest hydrocarbon fuel is comprised of a large number of intermediate (elementary) reactions, which ultimately leads to the end products of combustion, which in this example were water (H2O) and carbon dioxide (CO2), the products of complete combustion. These intermediate reactions in the gas phase constitute the basis of the combustion process. The intermediate reactions are typically radical chain reactions [41] and the four important types of these reactions are given below (with examples):

Emissions from Fires
8
1. Chain initiating •• +→+ 22 HORORH (2.2)
2. Chain propagating •• +→+ ROHRHHO 222 (2.3)
3. Chain branching ••• +→+ OHOOH 2 (2.4)
4. Chain terminating
OHOHH 2→+ •• (2.5)
The reaction mechanism starts with the chain initiating reactions (2.2) where reactive radicals (denoted with a dot to represent a single electron) are formed from stable species (R denotes an arbitrary hydrocarbon chain). It is the radicals, in this context often denoted chain carriers, that drive the chain reactions of combustion. The reaction proceeds by the formation of new radicals, through chain propagation (reaction 2.3) and chain branching (reaction 2.4). Finally, the chain reactions stop or are moderated by chain terminating reactions (reaction 2.5), in which radicals combine to form stable species. The propagating and especially the branching reactions are thus important to produce radicals and create necessary conditions for maintaining and accelerating combustion.
For higher combustion temperatures (T > 1100 K) the chain branching reactions are quite simple and relative independent of the fuel. However, at lower temperatures (900 K < T < 1100 K) these reactions are more complex and fuel specific [41]. Examples of typical chain branching reactions for hydrocarbons in different comb-ustion temperature regimes are [41]:
T > 1100 K: ••• +→+ OOHOH 2 (2.6)
900 K < T < 1100 K: •• +→+ ROHRHHO 222 (2.7)
MOH2MOH 22 +→+ • (2.8)
In reaction 2.8 above, M is a third body species, necessary for the reaction, but in effect preserved unaltered through the reaction.
The rate of gas phase combustion diminishes after the initial burning phase for many solid organic materials due to the build-up of a carbon rich, char layer on the material surface. Examples of such materials are natural polymers, e.g. wood, and synthetic polymers, e.g. polyvinyl chloride (PVC). The char layer acts as a physical barrier, shielding the virgin material from heat produced by the gas phase reactions, or from another external heat source. The char further obstructs gaseous pyrolysis products from penetrating the surface and taking part in the gas phase reactions. A carbon-aceous char is, however, not inert, but slowly decomposing at sufficiently high temperatures, through inhomogeneous combustion where oxidants in the gas phase react with carbon in the solid phase.
The formation of a char layer is therefore an intrinsic property of some materials that provides a certain degree of inherent flame retardancy. The benefit of a char layer

Background and methods for experimental work
9
has also been utilized in formulations of flame retardant additives used to improve the fire properties of many commercial products [42].
Some background on the formation of a char layer from PVC and the general flame retardant mechanisms of halogen compounds in polymer combustion is of interest in this thesis regarding the work on halogen containing cables (Paper II-III) and bromine containing polymers (Paper IV-V).
Whereas a polyolefin (e.g. polyethylene) principally decomposes through random chain-scission, PVC decomposes through elimination reactions where HCl is eliminated from the polymer chain [40]:
HClCHCHCHClCH2 +−=−→−− (2.9)
The resulting carbon rich condensed phase can then cross-link, creating a more thermally stable structure, which at higher temperatures may form a char [43].
The elimination of HCl from the PVC backbone begins at around 250 °C [43] and the release of a hydrogen halides plays and important role in the quenching mechanism of gas phase chain reactions. This quenching mechanism is common for both HCl and hydrogen bromide (HBr). The general mechanisms for quenching of radicals important in branching reactions (compare to reactions 2.6 and 2.8) are:
•• +→+ XHHXH 2 (2.10)
•• +→+ XOHHXOH 2 (2.11)
where X designates an arbitrary halide atom (Cl or Br).
Addition of brominated flame retardants to polymers is relatively more effective than chlorinated flame retardants (or the intrinsic flame retardant performance of certain PVC formulations as described above) in that bromine is more easily eliminated from the flame retardant carrier, due to the lower dissociation energy for breakage of the C-Br bond compared to the C-Cl bond [43].
As illustrated above (see reactions 2.10 and 2.11) the halogen is released as part of the flame retardant mechanism, implying that it will be available for participation in further retardation provided it remains in the combustion zone. Halogenated flame retardants are typically used together with a synergistic co-additive. The most important in this sense is antimony trioxide (SbO3), which effectively enhances the effect of the halogen through retention of the halogen in the combustion zone for longer period of time than would otherwise be possible. Although SbO3 show effects both in the condensed phase and in the gas phase, the major effect is in the gas phase [42].

Emissions from Fires
10
2.1.2 Fire conditions
A fire is dependent and controlled by the interaction of three constituents: a fuel, an oxidiser and energy. This is often referred to as the “fire triangle” as all three components are needed for initiating and maintaining the fire. Heat is necessary for pyrolisation of the fuel, and the oxidiser is necessary for the combustion of the pyrolysis gases. The exothermal combustion reactions produce heat, thereby continu-ing the circulation from heat to pyrolysis to combustion. A change in one of the components (i.e., interference in the chain of events) has a major influence on the fire conditions and the products from the fire. The actual conditions in a fire are therefore, important to define in a study of the emissions from fires. Fire conditions have been classified in ISO TR 9122-1 [44] and it is clear that the ventilation (or availability of oxygen) is an important factor, e.g. a developing fire with rather good ventilation gives a considerably higher CO2/CO ratio compared to a fully developed, vitiated fire.
A parameter commonly used to describe the ventilation conditions during combust-ion is the equivalence ratio, φ, defined in equation (2.12) below as:
( ).stoichoxygenfuel
oxygenfuel
mm
mm=φ
φ = 1 stoichiometric combustion φ < 1 well ventilated combustion φ > 1 under-ventilated combustion
where fuelm is the mass loss rate of the fuel, oxygenm is the mass flow rate of oxygen,
and the subscript “stoich.” refers to the quotient under stoichiometric conditions.
The equivalence ratio describes the relationship between the actual fuel/oxygen ratio and the stoichiometric fuel/oxygen ratio. In cases where the overall combustion process is studied, and not the spatial variations in e.g. an enclosure, φ can be defined in a more general sense using the equivalence ratio for the total combustion process. This is usually referred to as the global equivalence ratio, GER. In the work present-ed in Paper I, the definition of GER is the ratio between the mass loss rate of the fuel and the mass flow of oxygen entering the combustion room normalised by the stoichiometric ratio.
In order to measure GER in the two different test rooms in Paper I, a device called “the phi meter” [45], was constructed. The essential parts of the phi meter are the combustor, into which the fire gases and additional pure oxygen are introduced, and the O2 analyser. Complete combustion of the fire gases is achieved in the combustor by the high temperature (1000 ºC) and by using a platinum catalyst and additional oxygen. The readings on the O2 analyser are compared with background measure-ments without fire gases through the phi meter. A simple computation gives the equivalence ratio. The instrumentation and the calculations needed to conduct the measurements of the equivalence ratio are described in Paper I.

Background and methods for experimental work
11
2.1.3 Generation of compounds in fires
The effluents from a fire contain a mixture of gases, condensed compounds and solid particles. The composition of the effluents is mainly dependent on:
- the elemental composition of the material involved in the fire,
- the organic structure of the material and
- the prevailing combustion conditions, i.e. temperature and ventilation.
Secondary factors that have an influence on the composition are the extent of dilution (cooling) of the effluents with fresh air (which quenches gas phase reactions), and the “age” of the effluents (which determines the time available for post-fire reactions). The latter point in particularly is important for slow reactions, e.g. the development of particles (soot), and the deposition of condensable compounds.
It is clear that the composition of the effluents varies strongly between fires and also during the course of a fire. Components that are found in fire effluents and which are associated with a certain risk are schematically described in Table 2-1. The examples given in the table are intended to give a general picture of important components and are selected with a focus on the species that have been investigated in the experi-mental part of this thesis. More information on the toxicity of these compounds, and others, is found in Section 4.2.1.
Table 2-1 Selected components in fire effluents and their principal associated risks.
Type of component
Examples of compounds
Examples of sources Principal risks
Inorganic gases CO2 All fires Acute: asphyxia
CO All fires — —
HCN Nitrogen cont. fuels, e.g.nylon
— —
NO, NO2 (NOX) — — Acute: irritation Sublethal: lung damages
NH3 — — — —
HCl Chlorine cont. fuels, e.g.PVC
— —
HF Fluorine cont. fuels, e.g.PTFE, PVDF
— —
HBr Bromine cont. fuels, e.g.
Br-flame retarded mtrl. — —
SO2 Sulphur cont. fuels, e.g.wool
— —

Emissions from Fires
12
Table 2-1 (continued)
Type of component
Examples of compounds
Examples of sources Principal risks
Volatile organics Isocyanates Nitrogen cont. fuels, e.g.
PUR, mineral wool Acute: irritation Sublethal: asthma, cancer
Phenol General for many fires Acute: irritation
Styrene Polystyrene fires — —
Benzene General for all fires Sublethal: cancer
Semi-volatile /condensed phase organics
PAH General for all fires, particularly aromatic fuels
Sublethal: cancer
Dioxins/furans Fires with fuels containing chlorine or bromine
Sublethal: cancer, immuno-toxicity, etc.
Particles Soot particles of various sizes
All fires Acute: visual obscuration, Sublethal: deposition in the lungs
2.2 Sampling and analytical methods
2.2.1 Sampling of fire gases
The characterisation of gases from a fire is complicated by a number of factors: a fire is a dynamic and turbulent process and the concentration of specific compounds in the smoke plume may change from ppm-levels to percentage-levels during the course of the fire, or from one part of the plume to another. Further, fire gases are most often hot at the sampling point, which introduces complications such as continued chemical reactions, or condensation of gases in cold parts of the sampling equipment, or on surfaces in the test set-up. In the case of spectroscopic methods (e.g. FTIR), the normally high concentrations of carbon dioxide and water found in fire gases, and possible interference from unexpected gaseous compounds, make quantification difficult. The presence of high concentrations of particles creates additional chall-enges in sampling. The sampling methodology is, therefore, an important part of the total measurement scheme, irrespective of the analysis method employed.
The aim of the sampling is to collect a representative portion of the fire gases for subsequent analysis. To accomplish this, the sampling equipment normally used for gas sampling consists of a probe, a particulate filter, tubing and a pump. The particulate filter and the sampling tubing are normally heated to avoid condensation of water. The issue of sampling in connection with measurements using FTIR was discussed in detail in [46] and more information is available in [38]. General advice on the sampling of fire effluents are further given in ISO TR 9122-3 [47].
Essentially, two different sampling positions have been utilized in the experimental work presented in this thesis. The most frequently applied technique has been to extract samples from a smoke collection duct. Sampling from a duct, where the smoke gases are well mixed, is the traditional and most controlled situation. The rule

Background and methods for experimental work
13
of thumb is that the fire gases are sufficiently well mixed at a distance of five times the duct-diameter [48] and that, in such cases, one can use a single-hole probe. The sampling was made from a smoke collection duct in all experimental work, except in the enclosure experiments in Paper I, where the sampling was made in the opening (outflow) of the enclosure, and in a series of method validation experiments discuss-ed in Section 2.2.2.
The fire gases are more concentrated and not as well mixed in the opening of an enclosure as in a smoke collection duct. Thus, the sampling conditions are more severe in the first case. To sample in the opening, however, was the strategy chosen for the enclosure tests in Paper I due to the potential to obtain additional information concerning the specific composition of the fire gases as they exit the enclosure. The rationale for this sampling strategy was to minimise the effects of any possible post-fire reactions of the combustion products prior to the sampling location, as the study of products from poorly ventilated combustion was the main objective of these experiments. Further, to properly measure the ventilation conditions in the enclosure any dilution of the fire gases had to be avoided. An additional advantage of this strategy was the reduction of possible losses of gases due to condensation in the hood/duct-system.
Sampling for continuous analysis, using analysis techniques which give time resolved information, is advantageous in the analysis of fire effluents. The major technique of this type that has been applied is online FTIR analysis, which has been used in the experimental work for analysis of many inorganic fire gases.
Accumulative sampling has been used for a number of compounds in this work, including the measurements of inorganic compounds in the pool-fire experiments in Paper I, the measurements of particles in Paper VII and Paper X, and for all measurements of organic compounds. In this type of sampling the smoke is contin-uously drawn through a medium or device designed to retain the species studied. The species concentration in the sampling medium is subsequently determined using a suitable analysis technique. A general advantage of this method is that a low limit of detection can be achieved, determined mainly by the total amount of smoke sampled. One general drawback, however, is that only averaged concentration information is obtained over the sampling period, i.e. time resolved information is not available and important transient information can be lost. In particular in the case of certain large organic species, however, the low concentration of the species in the fire gases at any given time, and the absence of suitable online measurement techniques have made accumulative measurement methods unavoidable.
2.2.2 FTIR measurement
Measurements of gases with infrared absorption techniques have been employed in many fields of science for more than a century. This technique is attractive since a large number of molecules absorb energy in the infrared region. The wavelength absorbed depends on the types of bonds in the molecule. The different functional groups of the molecule create the unique molecular fingerprints utilised in infrared spectroscopy. However, the invention of the two-beam interferometer by Michelson [49] has greatly broadened the applicability of this technique. There are two main
Emissions from Fires
14
advantages of the Michelson interferometer compared with a prism or a grating of a monochromator, which is the alternative device to explore the infrared spectrum. The first, and most important, advantage is that information from all spectral elements is measured simultaneously with an interferometer. The second advantage is that the theoretical optical throughput is considerably higher.
In FTIR spectroscopy, the Michelson interferometer uses a beam splitter and two mirrors, one of which is fixed while the other is moved at a constant speed. The incoming infrared beam is separated and a path difference is introduced before recombination. In the recombined infrared beam, all wavelengths are modulated simultaneously with a distinct modulation frequency. An infrared sensitive detector is used to register the infrared signal as an interferogram. The interferogram, which is a function of mirror position, is converted to a wavelength spectrum through Fourier transformation; hence the name Fourier Transform InfraRed spectrometry. A detail-ed account of the theory behind the FTIR technique can be found in [50].
With the fast development of computers during the last decades and also the reduced costs of FTIR equipment, the use of FTIR spectroscopy has become increasingly common in several fields of gas analysis. The use of FTIR in fire research began towards the end of the 80’s. Some of the earliest work reported in this field was by Kallonen [51], Kinsella et al. [52] and Nyden and Babrauskas [53]. In the European SAFIR project [38] the FTIR technique was further studied and developed speci-fically for measurements in fire environments. SP took an active part in the SAFIR project and developed the application specifically for large-scale fire tests [54] [34].
The instrumentation used for the FTIR measurements reported in Papers I-VI and Paper X consisted of an FTIR spectrometer (Bomem MB 100) with a multi-pass gas cell (Infrared Analysis M-38H-NK-AU). The FTIR spectrometer was used with a spectral resolution of 4 cm-1. The information obtained was in the wavenumber range between 4500 cm-1 and 400 cm-1 and was generally stored in three consecutive scans which were co-added to produce a new averaged spectrum about every fifteenth second. The gas-sampling rate was 4 l/min. A DTGS (deuterared triglycide sulphate) pyroelectric detector was used to measure the infrared beam after passing the cell. The gas cell, which had a volume of 0.922 dm3 and a path-length of 4.8 m, was heated by a cylindrical heating element to maintain a constant temperature of 150 °C. Further; the software used for collection and evaluation of the data was GRAMS/386
v 3.01b (Galactic Industries Corporation). A more detailed account of this FTIR equipment and the technique in general has been given in [55] and in [46].
The composition of the smoke gases is often very complex and changes rapidly with temperature and ventilation conditions. Hence, one needs a calibration covering a broad concentration range. Calibration is also needed for gas species not primarily quantified, but which cause spectral interference, such as water. Further, high conc-entrations of CO2 are commonly found in smoke gases. The strong absorbance of CO2 interferes with many compounds of interest. Figure 2-1 illustrates this problem, showing the absorption spectrum of water vapour and CO2, which cover some of the spectral region of CO (and other spectral ranges of interest as well).

Background and methods for experimental work
15
0
0.01
0.02
0.03
0.04
0.05
1900200021002200230024002500
Wavenumber (cm-1)
Abs
orba
nce
CO2
CO CO
H2O
Figure 2-1 Spectrum of CO interfered by CO2 and H2O (solid line); overlaid is a calibration spectrum of 99 ppm CO (dashed line).
The FTIR instrument was calibrated for the gases shown in Table 2-2. Hence, these gases could be quantitatively determined in the fire tests reported on in Papers I-VI and Paper X. In Paper I, however, NO and NO2 were measured using chemilum-inescence technique [56, 57] as this provided a dedicated instrument with a lower minimum detection limit.
Table 2-2 Gases selected for quantitative calibration. Information on calibration intervals and minimum detection limit (MDL).
Gas Lowest calibrated concentration
Highestcalibrated concentration
MDL (ppm)
H2O 1000 ppm 16 % 5
CO2 2000 ppm 20 % 3
CO 100 ppm 8.0 % 7
HCl 50 ppm 0.51 % 4
HF 50 ppm 0.1 % 2
HBr 50 ppm 0.1 % 10
SO2 10 ppm 2.6 % 0.6
HCN 10 ppm 0.20 % 0.4
NH3 10 ppm 0.16 % 0.7
NO 49 ppm 0.049 % 8
NO2 5 ppm 0.0050 % 0.4

Emissions from Fires
16
The sensitivity of the measurements, using the settings of the FTIR as defined above, has been calculated for the calibrated gases. In these calculations the Minimum Detection Limit (MDL) was defined as the concentration giving an absorbance equivalent to the averaged noise signal. The MDL value is, however, a detection limit during optimal conditions and the Lower Limit of Quantification (LLQ) is in many cases a factor of 3 higher. The MDL for each gas calibrated for is listed in Table 2-2.
The method used throughout for quantitative evaluation of the smoke gas spectra, in the experimental work reported in this thesis, has been the peak-height method. The main reason for this choice has been the possibility to quickly build new calibration algorithms and the fact that the supplier of the equipment has extensive experience with this method [58]. The peak-height method was included in a study of several evaluation methods for FTIR spectra from smoke gases [39]. The different evaluation methods assessed in this study included multivariate methods such as PLS and more advanced multivariate methods. The general properties of the methods were studied and specifically, the multivariate methods and the peak-height method were compared regarding prediction of gas concentrations from smoke gas spectra. The gases studied were CO, HCl, HCN and NO. Prediction of the concentrations of these gases was made on smoke gas spectra from large-scale fire tests (tests conducted in the ISO 9705 room) using particleboard and polyurethane foam [34]. This study showed that the peak-height method gave good accuracy in the prediction of gas concentrations. There were, however, some drawbacks with this method. In the case of gas concentrations exceeding the highest calibrated concentration, or in the case of interference from an unknown component, the results from this method may be severely distorted. More seriously, no tool for indicating such distortions exists for the peak-height method. As the peak-height method lacks any warning tool, a number of spectra from each test must be manually evaluated to confirm the accuracy of the analysis. The multivariate methods also gave, in most cases, good accuracy in the prediction. An important advantage with these methods, however, is the possibility of calculating residual values, which serve as an early warning for errors in the prediction. An important disadvantage of the multivariate methods, however, is their greater sensitivity to the quality of the spectra in the calibration of the model compared to the peak-height method.
The FTIR equipment was validated for a number of different fire conditions during the SAFIR project [38]. Table 2-3 summarises these different tests. Full details of the results are not reported in this thesis. For a more detailed account of the results, see the report by Hakkarainen et al. [38].
The tests with the ISO 9705 room were conducted using comparative measurement methods. In all tests conducted in the ISO 9705 room, the sampling for the FTIR was performed in the opening of the room whereas sampling for the comparative methods was made in the smoke gas duct. The comparative methods used were: a non-dispersive IR-analyser for CO2 and CO; absorption solutions in impinger bottles for HCl and HCN; a chemiluminescence analyser for NO and NO2. The tests with the cone calorimeter were Round-Robin tests, in which 8 different laboratories partici-pated.

Background and methods for experimental work
17
Table 2-3 Tests conducted at SP in the SAFIR project for validation of the FTIR method.
Test scenario Fuel Number of tests
Measured gases
ISO 9705 Propanea 4 CO2, HCl
Heptanea 4 CO2, HCl
Particle board 2 CO2, CO, HCN, NO, NO2
FR PUR (flexible) 2 CO2, CO, HCN, HCl, NO, NO2
Cone calorimeter Particle board 3 CO2, CO, NO, HCN
PVC 3 CO2, CO, HCl
FR PUR (rigid) 3 CO2, CO, NO, HCN, HCl a HCl was used to dope the flames to obtain a controlled concentration of HCl in the fires.
The results for CO2 as measured using the FTIR in the ISO 9705 room tests were in good agreement with the results from the comparative method. Typically the results agreed to within 10 % (relative). In the tests with propane and heptane where the fire conditions were more controlled, the results agreed within 5 %.
The tendency of HCl to deposit on surfaces in the test configuration and in the sampling equipment resulted in some problems when trying to validate the FTIR for HCl. In tests where the concentration of HCl was well above 100 ppm in the opening, the agreement with the comparative method was generally satisfactory, i.e.,normally to within 10 %. In tests with low concentrations, however, the agreement was less satisfactory. The concentrations as measured with the FTIR were often twice as high as those measured with the absorption solution in the duct. The probable explanation for this phenomenon is that a certain amount of HCl was depos-ited on the walls of the duct, resulting in the lower concentration measured here; the problem of deposition of HCl on surfaces has previously been identified by Galloway and Hirschler [59].
The levels of HCN produced in the experiments were generally low. Keeping this in mind, an uncertainty of approximately 20 % was regarded as satisfactory. In one test, however, where the average concentration was 100 ppm, the agreement between the analysis methods was 4 %.
The average concentration of NO measured in the experiments, was between 20 and 150 ppm. In spite of these rather low concentrations, the agreement between the methods was better than 20 %. For NO2, on the other hand, the agreement was approximately 50 %, but considering the low concentrations in the fire gases (<10 ppm) these results are acceptable.
To investigate the repeatability and reproducibility of the FTIR method in conjunc-tion with real fire tests Round-Robin (RR) tests were carried out using the cone calorimeter method, which is a well-defined small-scale fire test. The cone calori-

Emissions from Fires
18
meter tests were performed according to ISO 5660-1 [60] using a heat flux level of 50 kW/m2 in all tests.
The results for CO2, CO and HCN from tests with fire retarded polyurethane foam (FR PUR), and results for HCl from the tests with PVC, are presented below to indicate the accuracy of the FTIR measurements in fire tests, and to specifically establish the accuracy for the measurements performed at SP. The results from the RR are shown in Table 2-4 and Table 2-5. The results are given as the maximum concentration measured in the tests and as the total amount produced. The results are presented as averages, together with repeatability (Sr, standard deviation within laboratory) and reproducibility (SR, standard deviation between laboratories). One should keep in mind that the uncertainties associated with the fire-test method itself are included in the results presented.
The results from the measurements conducted at SP are presented as the average of the three tests (m), and the standard deviation for these tests (Sr). The statistical model used for the RR-results has been described by Hakkarainen et al. [38]. The outcome of the RR as a whole was considered as satisfactory. The standard devi-ations were as good or better, than the standard deviations found in the most common fire testing methods. Further, the SP results were within the statistical limits for all species.
Table 2-4 RR-results from FTIR measurement on tests with FR PUR.
Quantity CO2, max (ppm)
CO2, total (g)
CO, max (ppm)
CO, total (g)
HCN, max (ppm)
HCN, total (g)
RR SP RR SP RR SP RR SP RR SP RR SP
No of results 8×3 3 7×3 3 8×3 3 7×3 3 8×3 3 7×3 3
Average, m 7057 7700 23.8 26.2 365 389 1.06 0.91 40 29 0.066 0.056
Sr 349 58 1.3 1.5 36 20 0.06 0.05 5 1 0.008 0.002
SR 1049 - 3.7 - 72 - 0.36 - 16 - 0.019 -
Sr/m (%) 4.9 0.8 5.4 5.7 9.9 5.4 5.4 4.9 11.7 3.4 12.2 2.7
SR/m (%) 14.9 - 15.6 - 19.8 - 34 - 39.3 - 28.7 -
Table 2-5 RR-results from FTIR measurement on tests with PVC.
Quantity HCl, max (ppm)
HCl, total (g)
RR SP RR SP
No of results 8×3 3 7×3 3
Average, m 3571 3217 17.8 16.9
Sr 465 286 1.5 1.2
SR 1020 - 4.6 -
Sr/m (%) 13 8.9 8.6 6.8
SR/m (%) 28.5 - 26 -

Background and methods for experimental work
19
2.2.3 Organic compounds
Sampling and analysis of organic compounds have been conducted in many of the experimental investigations discussed in this thesis. The basic sampling method has been to accumulate the organic gas constituents on various adsorbent materials as generally outline in [61]. The Chemical Analysis department at SP has conducted all analyses of VOC compounds. External laboratories conducted the analysis of the remaining organic compounds.
Volatile organic compounds (VOC)
For the enclosure tests in Paper I, the tests in Papers IV-V, and the tests reported on in Paper X, the measurements of VOC species were conducted by adsorption of fire gases on Tenax adsorbent tubes. The definition of VOC species using this method includes a range of non-polar or slightly polar small-medium sized hydrocarbon species with a molecular weight of approximately 75-200 amu. The adsorbents were subsequently analysed by thermal desorption and high resolution gas chromato-graphy. The separation column was split for both FID (flame ionisation detector) and MS (mass selective detector) detection. Individual species were identified from the MS data, but quantification was made from the FID data as this detection method has a wider range for linear response. Further, the total amount of VOC species was calculated by integrating the retention time-range of 8-38 min, which for aromatic substances corresponds to the molecular size of 75 to 150 amu, thereby including benzene and naphthalene. The FID detector was calibrated against toluene. A more detailed description of this method for VOC analyses can be found in Paper IV.
The VOC measurement technique for the open pool-fire experiments in Paper I was somewhat different. The sampling set-up consisted of one tube containing XAD-2 (Amberlite XAD-2 resin, suitable for higher molecular weight species), a cooled U-tube (approx. -10 ºC) to condense and trap water, and one activated carbon adsorp-tion tube cooled to -50 ºC to collect lower molecular weight species. The sampling flow rate was 2 l/min. The adsorbent tubes used were not commercial ones, but designed specially for this purpose. The tubes used for XAD-2 and activated carbon, respectively, were of the same type; they were made of glass and were 150 mm in length and 24 mm in diameter. The tubes were subdivided into two parts, separated by glass wool, filled with approximately 6 g and 3 g of adsorbent material respect-ively, in the two layers. In the subsequent analysis of the adsorption tubes, the adsorption material was transferred to a capped bottle together with a solvent and was agitated in an ultrasonic bath for 10 - 30 min. The solvent used for XAD-2 was diethyl ether. For the activated carbon the solvent used was carbon disulfide, which has a longer retention time compared to the lighter species. The chromatographic system normally used was a gas chromatograph, equipped with a 50-m non-polar (HP-1), megabore (0.53 mm diameter), separating column. The carrier gas used was helium, and 1 µl sample was injected using an on-column injector. The system had the possibility to split the sample gas leaving the separating column to a mass selective detector (MSD) and a flame ionisation (FID) detection system, respectively.
Emissions from Fires
20
The two strategies in sampling and analysis of VOC species both have advantages. In the method involving XAD-2 adsorbent and activated carbon, adsorption tubes with greater amounts of adsorption material were used. A relatively high sampling flow could thus be used in this case without risks for losses in the sampling. The adsorbent materials were subsequently desorbed using a solvent, which might cause problems with interference in the gas chromatographic analysis. An advantage with this desorption technique is, however, the possibility to perform multiple analyses on the same sample extract. Another advantage is the activated carbon adsorbent, which extends the range of low molecular compounds sampled. In the method using Tenax adsorbent, adsorption tubes with smaller amounts of adsorbent materials were used. In this case, a substantially lower sampling flow had to be used in order to reduce the risk of losses in the sampling. The great advantage of this type of adsorbents is, however, that they are appropriate for thermal desorption in the subsequent gas chromatographic quantification/ identification step. The principal advantage is that there are no solvent dilution or interference effects. A disadvantage is that the entire sample is spent in one analysis.
Isocyanates, aminoisocyanates and amines
Isocyanate compounds (including isocyanates, aminoisocyanates and amines) were sampled using an impinger-filter sampling system. The system samples airborne isocyanates in an impinger flask containing reagent solution of DBA (Di-n-butylamine) in toluene to form specific DBA-isocyanate derivatives. A glass fibre filter with a pore size of 0.3 µm was placed in series after the impinger. It has been shown that large particles (>1.5 µm) are retained in the impinger solution, whereas smaller particles (0.01-1.5 µm) pass through the impinger solution and are collected by the filter [62]. Analyses were conducted separately for the impinger solution and the filters. LC-MS detection resulted in a highly sensitive measurement of iso-cyanates, equivalent to 1/2000 of the Swedish threshold limit valuei (for TDI in a 5 lair sample). The analysis method was based on LC-MS technique (Liquid chromato-graphy separation with mass spectroscopic detection) and has previously been described by Karlsson [63]. A more detailed description of the sampling and analysis of isocyanate compounds is given in Paper VI. The individual compounds analysed are shown in Table 2-6.
i The Swedish (occupational exposure) threshold limit value for toluene diisocyanate (TDI) is 5 ppb (for exposure during a working day).

Background and methods for experimental work
21
Table 2-6 Isocyanate, aminoisocyanates and amines measured.
Compound Abbreviation
Isocyanates:
2,4-Toluene diisocyanate 2,4-TDI
2,6-Toluene diisocyanate 2,6-TDI
4,4-Methylenediphenyl isocyanate 4,4-MDI
Hexamethyl diisocyanate HDI
Phenyl isocyanate PHI
Methyl isocyanate MIC
Ethyl isocyanate EIC
Propyl isocyanate PIC
Isoforon diisocyanate IPDI
Isocyanate acid ICA
Aminoisocyanates:
2,4-Toluene aminoisocyanate 2,4-TAI
2,6-Toluene aminoisocyanate 2,6-TAI
4,2-Toluene aminoisocyanate 4,2-TAI
Hexamethylene aminoisocyanate HAI
4,4-Methylendiphenyl
aminoisocyanate
4,4-MAI
Amines:
2,4-Toluenediamine 2,4-TDA
2,6-Toluenediamine 2,6-TDA
4,4-Methylenedianiline 4,4-MDA
1,6-Hexamethylenediamine 1,6-HDA
Semi-volatile /condensed phase organics
Organic compounds with a high boiling point tend to be adsorbed on particles in smoke gases. Hence, it is of importance that the sampling method used collects a representative sample concerning particle size distribution. This was considered in the measurement presented in this thesis (Paper IV-V and Paper X). The diameter of the sample-probe tip was, together with the sampling flow, adjusted to attain a sampling speed in the orifice of the tip that was equal to that of the gas speed in the smoke gas collector duct. In this manner iso-kinetic sampling was achieved.
Large organic compounds, such as PAHs, PCDDs/PCDFs and PBDDs/PBDFs, were collected using a large sampling-volume system. The sampling system consisted of a heated glass fibre filter, a water-cooled condenser with a condensate bottle, and a large adsorbent cartridge containing XAD-2. The sampling system is described in detail in Paper IV. This type of sampling system is commonly used in Scandinavia and is in close agreement with what is recommended in EN 1948 [64] for sampling of PAHs and PCDDs/PCDFs. The difference to the EN 1948 standard is that an

Emissions from Fires
22
adsorbent cartridge is used to replace the impinger bottles that are described in the standard.
The analysis methodology used for the larger hydrocarbons was in all cases based on high-resolution gas chromatography (HRGC) and mass fragmentography (MS). The extraction and analysis methods used are described in detail in Paper IV.
2.2.4 Light extinction
The smoke gases from a fire contain particles resulting in visual obscuration that may impair the ability of victims to escape from the fire. The smoke properties that are of importance for assessment of visual obscuration are light extinction and visibility. A short definition of important properties and dependencies will be given here, for a full account of the topic see, e.g., the review of Mulholland [65].
The smoke property normally measured is the light extinction coefficient (K). Measurements of K are based on the Bouguer’s law, which gives a relation for the intensity of the incident monochromatic light, ( )λ0I , of a wavelength λ and the in-
tensity of the light, ( )λI , transmitted through a path length L through the smoke, i.e.:
( ) ( ) KLeII −=λλ 0 (2.13)
The smoke production rate (SPR) is the quantity often used in standard fire testing. Results from measurements of SPR in fire tests with cables are discussed in Section 3.1.2. SPR is the product of the light extinction coefficient (K) and the volume flow in the smoke gas duct for the measurement. The unit of SPR is m2/s. The total smoke production (TSP) in a test is expressed as:
dtSPRTSP
t
=0
(2.14)
2.2.5 Particles
Detailed characterisation of fire-generated particles has been conducted in fire tests of different scales. The most thorough investigation was made in a series of cone calorimeter tests (Paper VII). Further, measurements were made in an enclosure test with a sofa (Paper VII) and a full-scale test with a car (Paper X). The characterisation of particles was made using low-pressure cascade impactor technique. Mass size distributions and particle number concentrations were obtained by using a DLPI (Dekati Low-Pressure Impactor) for the measurements in Paper VII and the more advanced ELPI (Electrical Low-Pressure Impactor) for the measurements in Paper X.
In a cascade impactor, particles are separated according to their “aerodynamic size”. The term aerodynamic size is used in order to provide a simple means of category-izing the sizes of particles having different shapes and densities with a single dimension. The aerodynamic diameter of an arbitrary particle is equal to the diameter of a spherical particle having a density of 1 gm/cm3 that has the same inertial proper-

Background and methods for experimental work
23
ties in the gas as the particle of interest. The aerodynamic diameter for particles greater than 0.5 micrometer can be approximated using the following equation [66]:
ppspa dd ρ= (2.15)
=pad Aerodynamic particle diameter.
=psd Stokes diameteri.
=pρ Particle density.
In a cascade impactor the sampled aerosol stream is directed against a flat plate through an input nozzle. An advanced cascade impactor, such as a low-pressure impactor, consists of several such impaction plates with nozzles of gradually decreasing diameters. At each stage, the output stream is forced to make a 90-degree bend, which is the basic mechanism for separation of particles in size-classes according to their aerodynamic diameter. In the output stream, particles with inertia higher than a certain limiting value can not follow the 90-degree bend of the gas stream, and therefore impact on the next collection plate. The gradually decreased diameter of the nozzle at each subsequent stage increase the velocity of the incoming aerosol and smaller sized particles impact and are captured. The reduced pressure at which a low-pressure impactor operates enables higher gas velocities and makes classification of smaller particle sizes possible. A schematic representation of the principle for a multi stage cascade impactor is shown in Figure 2-2.
Figure: Linda S. Johansson [67]
Figure 2-2 Schematic figure of the principle of a cascade impactor.
The stages of an impactor is characterised by their cut-off sizes. The cut-off size
(D50%) is related to the Stokes number (i.e. particle inertia) that gives 50 % collection efficiency, i.e., an impactor plate does not have perfect collection characteristics, and thus some under-sized particles are collected and some over-sized particles are admitted to the next plate. As some larger particles escape the designated plate and
i The Stokes diameter for a particle is the diameter of a sphere that has the same density and settling velocity as the particle. The concept is based on the aerodynamic drag force caused by the difference in velocity of the particle and the surrounding fluid.

Emissions from Fires
24
are collected on the following plate, the geometric mean diameter (Di) is commonly used as an alternative description of collector plates. The geometric mean diameter is calculated as the square root of the product of the cut-off size of the stage in question and the cut-off size of the next higher size (the geometric mean is defined as the Nth root of the product of N values [68]). The DLPI and the ELPI used, resolve particle size distribution with 13 channels with the cut-of sizes shown in Table 2-7. Particles larger than 12 µm and 10 µm, respectively, will be captured in the first stage. If there is a risk for “overloading” of large particles a pre-cyclone, is used. The measurements reported on in Paper VII and Paper X were made without pre-treatment with a cyclone.
A measurement with the DLPI gives average data over the sampling period. The particles in the sampled aerosol are collected on the pre-weighted impactor plates, and the sampled mass distribution within the 13 size ranges is then determined gravimetrically after the test. The ELPI, however, determines the particle number concentrations continuously. The sampled particles are charged in the instrument’s Corona charger before reaching the electrically isolated collector stages of the low-pressure impactor. The charged particles are continuously quantified at each stage by a sensitive multi-channel electrometer.
Particle number distribution, respective particle mass distribution, is calculated by assuming an aerodynamic particle diameter, i.e. a spherical particle with a density of 1 g/cm3, having the same terminal velocity as the particles studied. For both instruments, greased Al-foil was mounted on the collector plates. Grease was used to avoid bouncing of particles. Details of the measurements with the DLPI can be found in Paper VII, and similarly, for the ELPI in Paper X.
Table 2-7 Data on impactor stages for DLPI and ELPI. Cut-off diameters are denoted by D50% and geometric mean diameters by Di.
Stage 1 2 3 4 5 6 7 8 9 10 11 12 13
DLPI a
D50%
(µm)
0.026 0.053 0.095 0.169 0.299 0.447 0.730 1.14 1.93 2.89 4.85 8.12 12.05
DLPI Di (µm) 0.037 0.071 0.127 0.225 0.366 0.571 0.911 1.48 2.36 3.74 6.27 9.89 -
ELPI b
D50%
(µm)
0.029 0.059 0.103 0.166 0.255 0.393 0.637 0.99 1.61 2.46 3.97 6.69 10.15
ELPIDi (µm) 0.041 0.078 0.131 0.206 0.317 0.500 0.794 1.26 1.99 3.13 5.15 8.24 -
aThe DLPI was heated to 150°C to avoid condensation, and the cut-off sizes refer to this temperature.
bThe ELPI is always run at room temperature with a two-step ejector dilution system. The cut-off
sizes refer to room temperature (20°C).

Results and discussion of experimental work
25
3 Results and discussion of experimental work
3.1 Inorganic gases
Measurement of inorganic gaseous compounds using FTIR has been included in all experimental work reported in the papers appended to this thesis. Measurement of these compounds from fires is important as they constitute a large part of the smoke gas composition. This class of compounds further includes e.g. CO, HCN and HCl, compounds that are a direct threat to people trying to escape from a fire. Selected experimental results from measurements in large-scale fire tests are discussed in the following sections.
3.1.1 Production as a function of ventilation
The trends in the production of some inorganic gaseous compounds found from three different large-scale experimental series are discussed in this section. The data was collected in two EU-sponsored research project: COMBUSTION [69] and TOXFIRE [28], in which the emissions from warehouse fires were investigated. The role of SP in both projects was to conduct large-scale indoor combustion experiments. The experimental series included: large open pool fires [31, 57], pool fires placed in the ISO 9705 room [56], and a large test enclosure (LTE) where the fuel in most experiments was placed in a rack, i.e. in a storage configuration [70]. The overall ventilation conditions for the combustion were measured using a Phi-meter in the enclosure experiments (see Section 2.1.2). The large open pool fires were run in the COMBUSTION project and included tests with polystyrene (fire retarded and non-fire retarded), PVC, polypropylene, Nylon-66 and chlorobenzene. The enclosure fires were run in the TOXFIRE project. Polypropylene, Nylon-66 and chlorobenzene were tested in this project, as well as two crystalline materials: tetramethylthiuram monosulphide (TMTM) and 4-chloro-3-nitrobenzoic acid. The materials or fuels chosen for the experiments were selected to represent materials that could be found in substantial quantities in warehouses and to achieve a reasonable complexity in the smoke gas chemistry.
Detailed information on the experimental configurations and on the fuels included in the combustion experiments can be found in Paper I where the results of these experimental series are discussed and compared.
Important knowledge gained from these experiments included the production behaviour of different fire gases in large-scale fires under different ventilation conditions. It is also of interest to compare the gas production between different large-scale configurations. Only selected results from the large database of experi-mental results will be discussed here, to highlight major findings.
In a comparison of results from different test configurations, production rates or yields are preferred over concentrations, as concentrations are dependent on the dilution of the system.

Emissions from Fires
26
Yield (Yi) is here defined as the mass of the species i produced (mi) divided by the consumed mass of the fuel (mfuel):
fuel
ii
m
mY = (3.1)
In the experimental series with open pool fires, most of the data collected were aver-aged over the whole test period. Further, no information is available on the exact ventilation conditions during these tests. To make a coarse comparison with the test series where the ventilation conditions were measured, an average of the total yields for the open pool fire experiments was calculated for each substance (number of tests ≥ 2). A selection of these averaged yields is included in some of the figures shown below (Figure 3-1, Figure 3-5 and Figure 3-6). In these figures, the yields for the open pool fires are shown as dashed lines. The dashed lines cover the range of φ-values from 0 to 1.0 to indicate that the exact ventilation condition is unknown, but that a reasonable assumption concerning the actual ventilation condition is that the tests were well-ventilated, i.e. had a global equivalence ratio below 1.
In order to evaluate yields at different equivalence ratios for the ISO room experi-ments, where the φ -value often varied within the same test, it was necessary to select short time periods within any given test with different φ -values and calculate yields for these periods. It would have been useful to have long periods of time as a basis for these investigations, to minimise the influence of noise: however, an advantage with the actual situation is that several values of the equivalence ratio could be seen in the same test, and thereby increased the total number of useful data points. In the figures below these data points are connected to show the trends within individual tests.
The experiments in the large test enclosure (LTE) where the fuels were placed in a storage configuration often showed steady state conditions. In these experiments one extended period was chosen for the calculation of yields. An exception was the experiment with Nylon 66, which showed two distinct steady state periods. Both of these periods were chosen for the calculation of yields. An uncertainty in the yields calculated for the storage configuration tests is that a load cell could not be used. Hence, the mass loss in the storage configuration tests had to be estimated. The mass loss was calculated from the heat release rate using the approximation that the combustion efficiency was 0.60 [71] in all three cases. However, pool fire tests were run within the larger test enclosure with two of the substances, polypropylene and chlorobenzene. In these test a load cell was used and mass loss data is available.
The production of CO as a function of the equivalence ratio is shown in Figure 3-1 for Nylon 66. The dependence of CO on the prevailing equivalence ratio was found to follow that which has previously been shown by e.g. Woolley and Fardell [72] and Gottuk [73]. When the oxygen available for the combustion reactions decreases, the production of CO increases. This behaviour of CO production was also clearly seen for polypropylene, and the yields were comparable with those found for Nylon 66. In the tests with chlorobenzene the same trend was seen. However, for this substance less experimental data was available due to problems in the sampling. Notably, the CO yields from chlorobenzene were twice as high as that seen in the experiments
Results and discussion of experimental work
27
with Nylon 66 and polypropylene, irrespective of the ventilation conditions. For TMTM, the picture was not as clear. Firstly, the CO measurements conducted in the opening with the FTIR contained severe interference from spectral overlap from COS (carbonyl sulphide), and no data on CO in the opening was available for equivalence ratios higher than 1. Secondly, the results from the CO measurements performed in the duct were very scattered and did not agree well with the measurements in the door for lower equivalence ratios. The overall tendency, although not conclusive, was that the CO production measured in the opening increased with a higher equivalence ratio, but decreased at very high equivalence ratios as measured in the duct.
0
20
40
60
80
100
120
0 0.2 0.4 0.6 0.8 1 1.2 1.4
YC
O [
g/k
g]
φ
Figure 3-1 Nylon 66: yield of CO versus φ. (ISO 9705 room tests: -o-; storageconfiguration tests in the LTE: •; open pool fire tests: ---)
The production levels in the different test scenarios were in good agreement for Nylon 66 and chlorobenzene, which can be seen in Figure 3-1 for Nylon 66. For polypropylene and TMTM, on the other hand, considerably higher yields of CO were found in the storage configuration tests. Actually, an apparent displacement of the yield in the more well-ventilated direction for the storage configuration tests was found for all compounds in the tests with PP (see Paper I, Figure 5a and Figure 6a) and also for the tests with TMTM. A possible explanation is that even though oxygen is present in excess inside the large volume of the room, oxygen may not have been available in the immediate vicinity of the fire, i.e., there may have been insufficient turbulence for effective mixing of the gases, or alternatively a too rapid a drop in the fire gas temperature to complete the combustion. The indication of locally under-ventilated conditions is supported by the formation of significant amounts of carbonyl sulphide, COS, in the storage configuration test with TMTM, together with seemingly high CO and THC (total hydrocarbon) yields. Formation of COS was observed for TMTM in the ISO room for under-ventilated conditions only.
The end products measured from the nitrogen containing fuels investigated were strongly dependent on the degree of ventilation. In the case of well-ventilated conditions, NOX were the primary nitrogen containing combustion products, with NO as the major product, i.e., only small amounts of NO2 were produced. The production of NOX from TMTM is shown in Figure 3-2. The results from the tests in the ISO 9705 room with TMTM clearly illustrate the dependence of the NOX

Emissions from Fires
28
production on the equivalence ratio. A similarly dependence was also seen for Nylon 66. The yields were, however, approximately a factor 2 lower for Nylon 66 (although Nylon 66 has nitrogen content in the same order of that of TMTM). In one of the ISO 9705 room tests with Nylon 66, however, irregular behaviour of the NOX
production could be observed (see Paper I, Figure 7a). This may have been an effect of temperature, as in this test significantly higher temperatures were attained (100-200 K higher). One should note that no information is available on the actual flame temperatures; only gas temperatures were measured.
0
2
4
6
8
10
12
14
0 0.5 1 1.5 2
YN
OX [
g/k
g]
φ
Figure 3-2 Tetramethylthiuram monosulphide (TMTM): yield of NOX versus φ.(ISO 9705 room tests: -o-; storage configuration tests in the LTE: •)
At lower temperatures NO is exclusively produced by the fuel-NO mechanism, which is only slightly temperature dependent [74], but at higher temperatures additional NO may be produced through other mechanisms. Possible mechanisms are the thermal-NO (Zeldovich-NO) mechanism and the prompt-NO (Fenimore-NO) mechanism.
Figure 3-3 Schematic of the prompt NOX mechanism [41].
The thermal mechanism forms NO from ambient nitrogen and is only significant at temperatures above 1500 ºC [41], while the prompt mechanism is active at lower temperatures and has its maximum at fuel-rich conditions. Due to the high tempera-ture required for the thermal-NO mechanism, it is not expected to be important in the cases studied here.
The fuel-NO and the prompt-NO mechanisms are closely coupled in their reaction path; HCN is a primary intermediate species in both mechanisms (cf. Figure 3-3 and

Results and discussion of experimental work
29
Figure 3-4). In fact, the HCN yield in the Nylon 66 experiment that showed an irregular NOX production was considerably lower compared to the HCN yields normally found from Nylon 66.
Figure 3-4 Reaction scheme for fuel nitrogen [75].
Further, low concentrations of nitrogen oxides were actually found in the tests with polypropylene and chlorobenzene, substances that contain no nitrogen. Hence, this must have been nitrogen oxides produced most probably by the prompt mechanism.
In both tests with TMTM and Nylon 66, the results from the storage configuration test correlates well with those from the ISO 9705 room and with what would be expected from the dependence on the degree of ventilation. The NOX results from the open pool fire experiments with Nylon 66 were, however, significantly higher than that found from the enclosure experiments. This might have been an effect of higher combustion temperatures in the open pool fire experiments, and further, the compo-sition of the Nylon 66 used in the both test series was not exactly the same. This is discussed in greater detail in Paper I.
At higher equivalence ratios the production of nitrogen oxides decreased. Instead, nitrogen-containing species such as HCN and NH3 were produced, which can be seen in Figure 3-5 and Figure 3-6 for Nylon 66. These trends in production were also typical for TMTM. The maximum yields found for HCN were, however, approxi-mately twice as high for TMTM. As the nitrogen content is approximately the same for the two substances, the higher yields seen from TMTM were probably due to the higher equivalence ratios reached in these tests. The maximum yields found for NH3,on the other hand, were approximately equal to what was found for Nylon 66. The production of HCN predominately during conditions of high temperatures and low oxygen concentrations has been reported earlier from tests in the small scale [16, 17].

Emissions from Fires
30
0
5
10
15
20
25
30
35
0 0.2 0.4 0.6 0.8 1 1.2 1.4
YH
CN [
g/k
g]
φ
Figure 3-5 Nylon 66: yield of HCN versus φ. (ISO 9705 room tests: -o-; storage configuration tests in the LTE: •; open pool fire tests: ---)
0
2
4
6
8
10
12
0 0.2 0.4 0.6 0.8 1 1.2 1.4
YN
H3 [
g/k
g]
φ
Figure 3-6 Nylon 66: yield of NH3 versus φ. (ISO 9705 room tests: -o-; storage configuration tests in the LTE: •; open pool fire tests: ---)
In summary, the production of the nitrogen-containing fire gases studied (NOX, HCN and NH3) exhibits a minimum at an equivalence ratio between 0.6 and 0.8. At this equivalence ratio the fuel nitrogen is predominately converted to molecular nitrogen. The production pattern with a minimum close to an equivalence ratio of unity is typical for combustion of fuel-nitrogen, and has been shown previously [74].
The production of SO2 in the tests with TMTM was strongly ventilation dependent (see Figure 3-7). At an equivalence ratio close to one, almost all sulphur was conv-erted to SO2. At equivalence ratios above one the production of SO2 decreases, which indicates the production of other sulphur-containing species. In fact, at vitiated conditions, a substantial production of COS was found. Additional sulphur containing species were also searched for, e.g. H2S and CS2, but none of these species could be identified from the FTIR spectra.

Results and discussion of experimental work
31
0
200
400
600
800
1000
1200
0 0.5 1 1.5 2 2.5
YS
O2 [
g/k
g]
φ
Figure 3-7 Tetramethylthiuram monosulphide: yield of SO2 versus φ. (ISO 9705 room tests: -o-; storage configuration tests in the LTE: •)
No conclusive study could be made of the dependence of the production of HCl on the equivalence ratio, as the data from the tests was limited. It was found, however, that the production of HCl from chlorobenzene in the enclosure experiments was lower than expected. The yields of HCl from these tests, both in the ISO 9705 room scale and the LTE, were approximately 50 % of the nominal maximum yield. This is in contrast with the yields found in the open pool fire experiments, which were close to 100 %. The most probable explanation is absorption of HCl on the walls of the test enclosure. It has previously been demonstrated by Galloway and Hirschler [59], that significant amounts of HCl readily adsorb on many types of common interior surfaces. One additional explanation involves the energy needed to break the carbon-chlorine bond [76]. This rate-limiting step in the production of HCl is exponentially dependent on the flame temperature. The bond dissociating energy for the carbon-chlorine bond in chlorobenzene is rather high. Higher flame temperatures are needed for significant production of HCl in the combustion of chlorobenzene compared to e.g. PVC, which has a lower bond dissociating energy. Hence, a difference in flame temperatures between the two test series could have contributed to the differences in the HCl yields.
Additional chlorine-containing species were also studied. Specifically, COCl2 was searched for in the FTIR spectra, but this compound could not be identified. Further, in some of the tests with chlorobenzene, sampling with bubbler absorbers containing As2O3 solution was conducted for measurement of Cl2. However, no Cl2 was detect-ed in any of these tests.
The main findings from the large-scale ventilation-controlled experiments with bulk chemicals and polymers where that:
- For a number of fire gases there is a strong dependence of the production on the equivalence ratio of the combustion.
- The type of fire scenario (in this work: open pool fires, the ISO room, a larger test enclosure with a storage configuration) does not alter the outcome of the combustion significantly, for a given level of ventilation.

Emissions from Fires
32
The same materials as those included in the large-scale enclosure experiments discussed above, were also tested in smaller scale experiments, including tubular furnace tests, cone calorimeter tests and tests in a 1/3 ISO room scale [28]. A comparison of the results from the various scales showed good qualitative agreement and satisfactory quantitative agreement between the scales [77]. It was further found that apart from GER, parameters such as temperature and residence time were important for the outcome of the combustion.
3.1.2 Toxic gases from cable fires
The production of inorganic compounds from fires with pure materials or chemicals was discussed in the previous section. In most cases, however, fires involve several different materials, or products composed of different materials. Electrical cables are an example of products that contain several different combustible materials. Cables are often composed of several conductors, each surrounded by an electrically insulating polymer (insulation). The conductors, together with a filler materiali, are encapsulated by another polymeric material (sheath). The sheathing material has often better fire resistance properties compared to the insulation, as the sheath is the material first exposed to external heat. To protect the cable, a layer of metal (armour) is sometimes placed between the outer sheathing material and the insulated conductors.
Fire tests of cables have traditionally concentrated on measurement of damaged length or the resistance to a small flame. As the use of cables has expanded in society, the necessity to have more detailed information about the fire behaviour of modern cables has increased. The need for more sophisticated test methods including parameters such as ignition behaviour, heat-release rate, smoke production and the production of toxic gases was addressed in the EU-sponsored FIPEC project [33]. Measurements of smoke gas composition using FTIR were made in 45 real-scale tests at SP. These tests included medium voltage-, low voltage (LV)-, data-, telephone-, coaxial-, optical cables and wires. The cables tested were selected after a review of European cable installations.
Results of the smoke gas analysis from fires tests with PVC cables within the FIPEC-project are discussed in Paper II. Cables with two types of sheathing materials were tested, cables with normal PVC sheathings and cables with a PVC sheathing modified to achieve reduced fire propagation (RPPVC). One of the conclusions from this paper was that RPPVC consistently delays ignition and the subsequent production of toxic species, and lowers the heat release rate. Although the production of HCl is delayed, the amount produced is equivalent from comparable PVC and RPPVC sheathed cables. The delay is, however, gained at the cost of producing larger amounts of incomplete combustion products such as CO and smoke.
The yields of HCl and CO found from PVC based LV cables have been calculated and are presented in Figure 3-8. The results from all PVC based cables tested in a vertical position (see Paper II, page 2) are presented in the figure. This includes the first eight cables listed in Table 1 in Paper II, and two additional LV cables. Seven of
i The filler material could be a combustible polymer or alternatively a non-combustible material. The filler can have a flame retarded effect, e.g. ATH (aluminium trihydrate) or magnesium hydroxide.
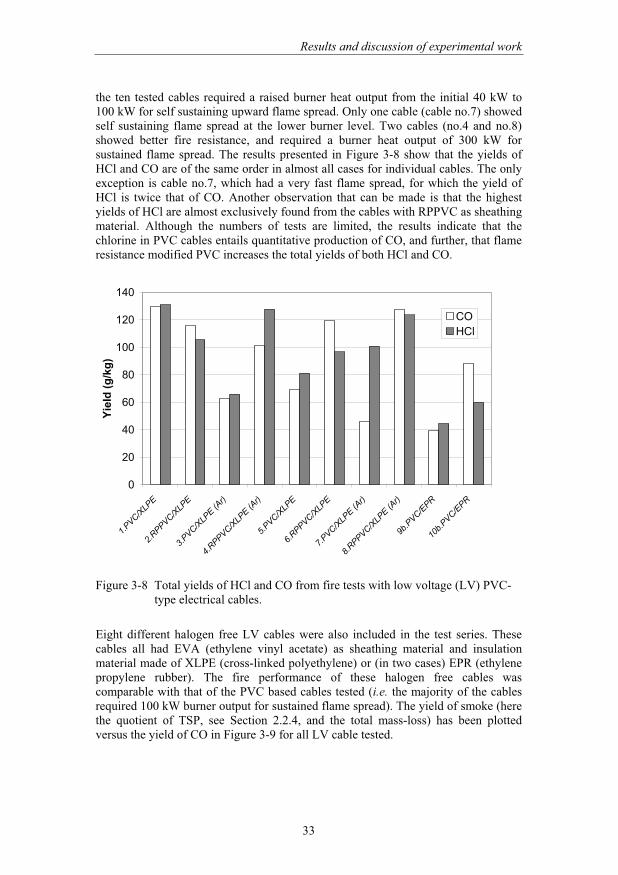
Results and discussion of experimental work
33
the ten tested cables required a raised burner heat output from the initial 40 kW to 100 kW for self sustaining upward flame spread. Only one cable (cable no.7) showed self sustaining flame spread at the lower burner level. Two cables (no.4 and no.8) showed better fire resistance, and required a burner heat output of 300 kW for sustained flame spread. The results presented in Figure 3-8 show that the yields of HCl and CO are of the same order in almost all cases for individual cables. The only exception is cable no.7, which had a very fast flame spread, for which the yield of HCl is twice that of CO. Another observation that can be made is that the highest yields of HCl are almost exclusively found from the cables with RPPVC as sheathing material. Although the numbers of tests are limited, the results indicate that the chlorine in PVC cables entails quantitative production of CO, and further, that flame resistance modified PVC increases the total yields of both HCl and CO.
0
20
40
60
80
100
120
140
1.PVC
/XLP
E
2.RPPV
C/X
LPE
3.PVC
/XLP
E (Ar)
4.RPPV
C/X
LPE
(Ar)
5.PVC
/XLP
E
6.RPPV
C/X
LPE
7.PVC
/XLP
E (Ar)
8.RPPV
C/X
LPE (A
r)
9b.P
VC/E
PR
10b.
PVC/E
PR
Yie
ld (
g/k
g)
CO
HCl
Figure 3-8 Total yields of HCl and CO from fire tests with low voltage (LV) PVC-type electrical cables.
Eight different halogen free LV cables were also included in the test series. These cables all had EVA (ethylene vinyl acetate) as sheathing material and insulation material made of XLPE (cross-linked polyethylene) or (in two cases) EPR (ethylene propylene rubber). The fire performance of these halogen free cables was comparable with that of the PVC based cables tested (i.e. the majority of the cables required 100 kW burner output for sustained flame spread). The yield of smoke (here the quotient of TSP, see Section 2.2.4, and the total mass-loss) has been plotted versus the yield of CO in Figure 3-9 for all LV cable tested.
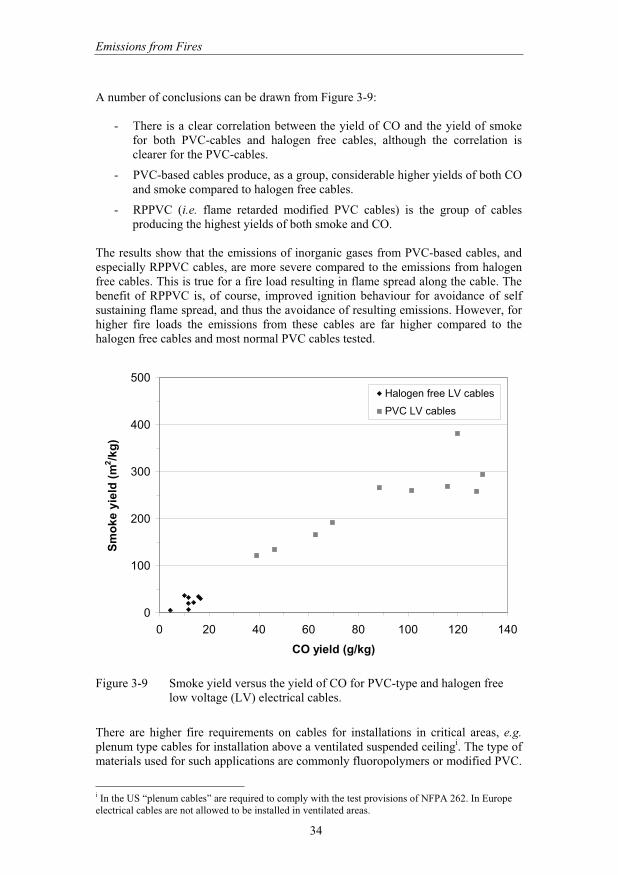
Emissions from Fires
34
A number of conclusions can be drawn from Figure 3-9:
- There is a clear correlation between the yield of CO and the yield of smoke for both PVC-cables and halogen free cables, although the correlation is clearer for the PVC-cables.
- PVC-based cables produce, as a group, considerable higher yields of both CO and smoke compared to halogen free cables.
- RPPVC (i.e. flame retarded modified PVC cables) is the group of cables producing the highest yields of both smoke and CO.
The results show that the emissions of inorganic gases from PVC-based cables, and especially RPPVC cables, are more severe compared to the emissions from halogen free cables. This is true for a fire load resulting in flame spread along the cable. The benefit of RPPVC is, of course, improved ignition behaviour for avoidance of self sustaining flame spread, and thus the avoidance of resulting emissions. However, for higher fire loads the emissions from these cables are far higher compared to the halogen free cables and most normal PVC cables tested.
0
100
200
300
400
500
0 20 40 60 80 100 120 140
CO yield (g/kg)
Sm
ok
e y
ield
(m
2/k
g)
Halogen free LV cables
PVC LV cables
Figure 3-9 Smoke yield versus the yield of CO for PVC-type and halogen free low voltage (LV) electrical cables.
There are higher fire requirements on cables for installations in critical areas, e.g.
plenum type cables for installation above a ventilated suspended ceilingi. The type of materials used for such applications are commonly fluoropolymers or modified PVC.
i In the US “plenum cables” are required to comply with the test provisions of NFPA 262. In Europe electrical cables are not allowed to be installed in ventilated areas.

Results and discussion of experimental work
35
Combustion of fluoropolymers results in the production of hydrogen fluoride (HF), which is an irritant gas (see Section 4.2.1). In the FIPEC test series only one fluoropolymer cable was included, a PVDF (polyvinylidene fluoride) sheathed wire that was tested in the vertical test set-up. This product showed very good fire resistance and did not give any self propagating flame spread even at the highest burner load (300 kW). The production rates of CO and hydrogen fluoride (HF) together with the HRR (including the output from the burner) from this test are shown in Figure 3-10. As can be seen from the figure, only a small amount of material was combusted after each increase of the burner output (the peak in HRR that after a few minutes levels out to the HRR-level of the burner). Carbon monoxide was produced at each of these peaks in HRR, but there was no production of HF measured until the last (highest) burner level, where a rather low production of HF was measured.
0
50
100
150
200
250
300
350
400
0
0.05
0.1
0.15
0.2
0.25
0.3
0.35
0.4
0 5 10 15 20 25
HRR (kW) CO (g/s)HF (g/s)
HR
R (
kW
)
Ga
ses (g
/s)
Time (min)
Figure 3-10 Wire with PVDF sheathing (FIPEC cable no.35) tested in a vertical scenario in the FIPEC project [33].
It was obvious from this test with a fluoropolymer cable, that substantial emission of HF from cable fires would require other conditions than high performance cables as the combustible load only. In previous large scale fire tests with fluoropolymer cables, Clarke et al. [78] assessed the smoke toxicity by animal exposure and chemical analysis. In these tests a large wood crib or diesel fuel was used as an exposure fire.
In real installations different types of cables are in many cases mixed. In such a scenario less fire resistant cables could act as a support fuel for fire resistant fluoropolymer cables. The fire behaviour and gas production from a mixed cable installation within a confined space was studied in Paper III. The installation

Emissions from Fires
36
contained both less fire resistant cables and high performance cables. The cable with the highest fire performance was a data cable with a fire retarded PVC sheath and FEP (tetrafluoroethylene-perfluoro propylvinyl ether copolymer) insulation. The tests series included tests where the cables were mounted horizontally and tests with vertical mounting. Forced ventilation was applied and varied between the tests to study the influence of ventilation on flame spread and subsequent gas production. Detailed information on the test arrangement and the types of cables in the installation is given in Paper III and in the project report [32].
It was found from these tests that HF is produced in substantial amounts from a mixed installation scenario containing a fluoropolymer cable, when a less fire resistant cable acts as the initial fire load and promotes the flame spread. It was further found that forced ventilation has a major influence on the flame spread and gas production in a confined installation. Examples from this test series are given in Figure 3-11.
0
200
400
600
800
1000
1200
1400
1600
0
0.5
1
1.5
2
2.5
3
3.5
4
0 5 10 15 20 25 30
HRR_H2 (kW)HRR_H5 (kW)
Spread_H2 (m)Spread_H5 (m)
HR
R (
kW
)
Spre
ad_b
otto
m la
dd
er (m
)
Time (min)
0
1
2
3
4
5
0 5 10 15 20 25 30
CO_H2 (g/s)
HF_H2 (g/s)
CO_H5 (g/s)
HF_H5 (g/s)
Pro
duction
(g
/s)
Time (min)
(a) (b)
Figure 3-11 (a) Pyrolysed length (lower ladder) and HRR in tests H2 and H5.(b) Production rate of CO and HF in tests H2 and H5.
The graphs show results from two tests with the horizontal test set-up. In test H2 there was no forced ventilation, whereas in test H5 there was forced ventilation applied, giving an air velocity of ~1.75 m/s along the cables. The resulting flame spread and HRR can be seen in Figure 3-11a, and the production of CO and HF is shown in Figure 3-11b (also HCl was produced, cf. Paper III). The resulting flame spread and accompanying gas production increased strongly with forced ventilation. In test H5, more than 1 g/s HF was produced as a maximum, resulting in a concentration close to 500 ppm in the diluted smoke gases in the exhaust duct. The measured production of HF in this test corresponded to a yield of 0.23 g/g, which means that approximately 1/3 of the fluorine in the cable material was found as HF at the sampling point. The remaining 2/3 of the fluorine may have existed as other fluorinated compounds or been attributed to losses of HF in the test enclosure and in the smoke extraction system. Clarke et al. [78] found a total fluorine recovery of 1/3 in their tests. But this included possible hydrolysable compounds such as carbonyl fluoride (COF2) measured as fluoride, and also organic degradation products. The

Results and discussion of experimental work
37
organic degradation products constituted in fact 50% of their total measured fluorine recovery.
COF2 was actually identified in the smoke gases from the tests with the mixed cable installation. COF2 is an irritant gas with effects on eyes, skin, mucous membranes and the respiratory system. No quantitative information has been found on the incapacitating or toxic effects on human, but animal tests have shown that the LC50
of COF2 for rats is approximately a third of the LC50 of HF [79]. COF2 has previ-ously been found in the smoke gases from fire suppression tests using halon replacements [80].
Only a qualitative evaluation of the COF2 production (Paper III, p.8) was possible as no calibration data was available for the FTIR. COF2 was identified from the C-O stretch giving strong absorbance at 1929 cm-1 in the FTIR spectrum [81]. A FTIR spectrum from test H5 is shown in Figure 3-12 where the spectral features of COF2,HF, HCl, CO and CO2 can be identified.
-0.1
0.1
0.2
0.3
0.4
0.5
1800220026003000340038004200
Wavenumber (cm-1)
Abs
orba
nce
CO
COF2
HCl
CO2
HF
CO2
Figure 3-12 FTIR spectrum from test H5 at 6.3 min (water is subtracted). The concentration of HF was quantified to 470 ppm.
It was thus shown that fires in installations with mixed types of cables produce substantial amounts of HF from high performance cables. It was further shown that the smoke gases from such fires can contain COF2.

Emissions from Fires
38
3.2 Organic compounds
Detailed quantitative measurements of organic decomposition products have been made in several of the test-series that form a basis for this thesis. Most of these tests were large- or full-scale fire tests. These types of measurements have been scarce in fire research and most data published previously originates from small-scale testing or is of a qualitative nature.
The ineffective combustion in a fire produces a multitude of different organic compounds in varying quantities, depending on the fuel and the combustion conditions. Paabo and Levin [82] have e.g. shown that more than 150 different organic smoke gas constituents have been reported in the literature from combustion of the simple polymer polyethylene alone. It is, therefore, not practically possible to characterise all the different compounds that may be formed. Instead one must select sampling/measurement methods (see Section 2.2.3) suitable for the specific groups of compounds that are of interest in each individual case (fire). Thus the results regarding some significant groups of organic compounds are presented and analyzed in the following sub-sections.
3.2.1 Volatile organics
Volatile organic compounds (VOC)
This group of organics includes a very large and varied number of compounds. Even though that the production of species containing hetero atoms (e.g. nitrogen, sulfur, and halogens) are governed by the fuel composition, the main volatile organic constituents are very much the same from different fuels. For example, a literature review of reported combustion products from mainly small-scale tests with seven different plastics showed that benzene was found in the combustion atmospheres from six of these plastics, and that it would be extremely likely that the seventh plastic would also generate benzene [83].
In Paper I where pure fuels were combusted in different large-scale test set-ups it was shown that the presence of hetero atoms in the fuel composition had a clear influence on the production pattern, but also that some species seemed to be generic for all of the fuels. Benzene was a principal smoke gas component for all fuels, irrespective of whether the fuel was aromatic or aliphatic. Toluene and naphthalene (a volatile PAH compound) were other frequently occurring species.
More authentic fire scenarios were replicated in Paper V (room fires) and Paper X (automobile fire). Results from the VOC analyses (see Section 2.2.3) from these experiments together with the results from a more recent series of room fires conducted at SP are given in Table 3-1. The test set-up, including the fuel load, for the three new room tests were the same as in the room tests described in Paper V. The combustible item varied in these tests was the sofa, which was of “Swedish type” in Room 3 (i.e. contained no flame retardants), contained phosphor based flame retardants in Room 4, and contained brominated flame retardants in Room 5. These new room tests have been described in detail by Andersson et al. [36] [84].

Results and discussion of experimental work
39
The compounds captured in the largest amounts by Tenax adsorbent sampling in these fires are listed in Table 3-1. It is evident that benzene is the principal volatile organic smoke gas constituent even in authentic real-scale fires. The results from real-scale fires with TV-sets reported on in Paper IV further corroborate this observation.
Table 3-1 Main organic constituents in smoke gases from real-scale fire tests. Data from VOC analysis using Tenax adsorbent sampling.
Order of VOCspecies
TV-LCA room tests (Paper V) Furniture-LCA room tests [84] Car fire (Paper X)
Room 1 Room 2 Room 3 Room 4 Room 5 Room 6
1 Benzene (21%)
Benzene (38%)
Benzene (32%)
Benzene (59%)
Benzene (42%)
Benzene (48%)
Benzene (35%)
2 Naphthalene (16%)
Napht. (18%)
Napht. (17%)
Napht. (13%)
Napht. (11%)
Napht. (14%)
Toluene (7.8%)
3 Benzonitrile (5.5%)
Toluene (6%)
Chloro-benzene (9.5%)
Toluene (5.4%)
Styrene(4.4%)
Toluene (5.5%)
Styrene(5.9%)
4 Styrene(4.5%)
Benzo-nitrile (5%)
Toluene (4.5%)
Styrene(3.4%)
Toluene (4.2%)
Styrene(4.7%)
Napht. (4.8%)
5 Toluene (4%) Styrene(4%)
Benzo-nitrile (3.7%)
Phenol (2.5%)
Benzo-nitrile (3.1%)
Benzo-nitrile (3.6%)
Phenol (4.2%)
6 Phenol (2.4%)
Ethynyl-bezene (3%)
Styrene(3%)
Benzo-nitrile (2.5%)
Phenol (2.6%)
Phenol (2.6%)
Benzo-nitrile (2.7%)
Other 46.6 % 26.0 % 30.3 % 14.2 % 32.7 % 21.6 % 39.6 %
Total yield (g/kg)
0.82 2.9 3.1 2.2 3.1 2.8 8.5
Naphthalene, which is a volatile polycyclic aromatic hydrocarbon (PAH), was found in high concentrations from all fires. Note that naphthalene is captured by the Tenax adsorbent sampling technique and thus is a volatile organic, but as a PAH compound, it is also included in the analysis of this specific group of organics. Other volatile organics of generic character are toluene, phenol and styrene. The structures of these arenes, together with benzene, are shown in Figure 3-13. These compounds contribute to the toxic/irritant quality of smoke gas atmospheres. Especially phenol could be important, being an irritant of irritant potency comparable to HCl and HF (cf. Section 4.2.1).
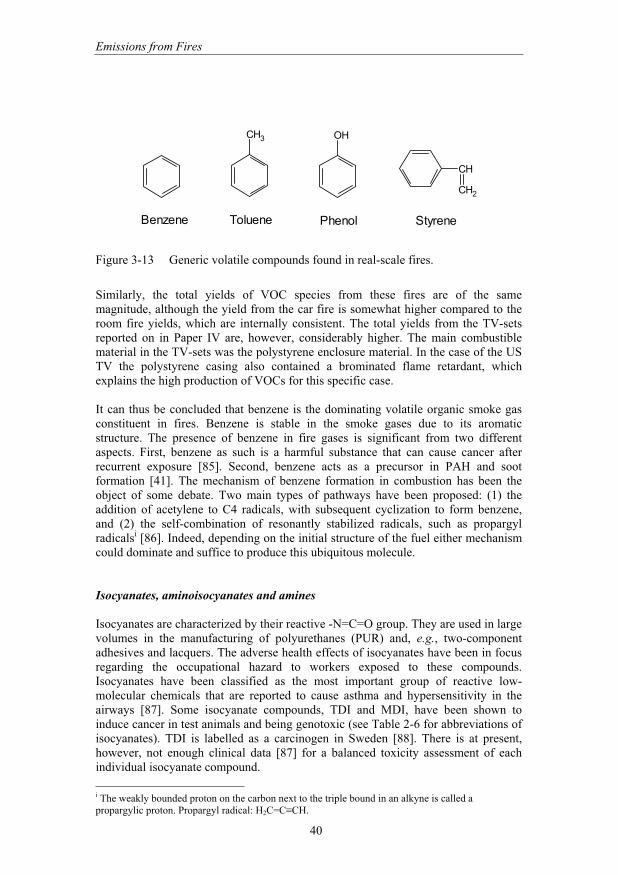
Emissions from Fires
40
Benzene
CH3
Toluene
OH
Phenol
CH
CH2
Styrene
Figure 3-13 Generic volatile compounds found in real-scale fires.
Similarly, the total yields of VOC species from these fires are of the same magnitude, although the yield from the car fire is somewhat higher compared to the room fire yields, which are internally consistent. The total yields from the TV-sets reported on in Paper IV are, however, considerably higher. The main combustible material in the TV-sets was the polystyrene enclosure material. In the case of the US TV the polystyrene casing also contained a brominated flame retardant, which explains the high production of VOCs for this specific case.
It can thus be concluded that benzene is the dominating volatile organic smoke gas constituent in fires. Benzene is stable in the smoke gases due to its aromatic structure. The presence of benzene in fire gases is significant from two different aspects. First, benzene as such is a harmful substance that can cause cancer after recurrent exposure [85]. Second, benzene acts as a precursor in PAH and soot formation [41]. The mechanism of benzene formation in combustion has been the object of some debate. Two main types of pathways have been proposed: (1) the addition of acetylene to C4 radicals, with subsequent cyclization to form benzene, and (2) the self-combination of resonantly stabilized radicals, such as propargyl radicalsi [86]. Indeed, depending on the initial structure of the fuel either mechanism could dominate and suffice to produce this ubiquitous molecule.
Isocyanates, aminoisocyanates and amines
Isocyanates are characterized by their reactive -N=C=O group. They are used in large volumes in the manufacturing of polyurethanes (PUR) and, e.g., two-component adhesives and lacquers. The adverse health effects of isocyanates have been in focus regarding the occupational hazard to workers exposed to these compounds. Isocyanates have been classified as the most important group of reactive low-molecular chemicals that are reported to cause asthma and hypersensitivity in the airways [87]. Some isocyanate compounds, TDI and MDI, have been shown to induce cancer in test animals and being genotoxic (see Table 2-6 for abbreviations of isocyanates). TDI is labelled as a carcinogen in Sweden [88]. There is at present, however, not enough clinical data [87] for a balanced toxicity assessment of each individual isocyanate compound.
i The weakly bounded proton on the carbon next to the triple bound in an alkyne is called a propargylic proton. Propargyl radical: H2C=C CH.

Results and discussion of experimental work
41
The occupational exposure limits (OEL) for isocyanates are very low. In Sweden, the limiting value for a working day is 5 ppb and that for a 15 min exposure 10 ppb. These limiting values apply at present to all isocyanate compounds. The limiting values have, however, been under revision. New limit values will come into force for isocyanates in the end of year 2005. The new limiting values for diisocyanate compounds (e.g. TDI, MDI) are 2 ppm and 5 ppm, respectively, and for mono-isocyanates (e.g. MIC, ICA), 10 ppm and 20 ppm, respectively.
Isocyanates have very low limiting values for creating direct life threatening conditions. NIOSH (National Institute for Occupational Safety and Health) provide immediately dangerous to life or health air concentration values, IDLHs, based on 30 min exposure of 2.5 ppm for 2,4-TDI and 3.0 ppm for methyl isocyanate (MIC) [89]. For comparison, the IDLH for HCl, a more well-known irritant, is 50 ppm [89].
There is some data in the literature on sensory and pulmonary irritation in humans for specific isocyanates. TDI causes severe sensory irritancy at a concentration of 1.0 ppm [2]. MIC showed no irritation at a concentration of 0.4 ppm, tear flow, irritation of eyes, nose and throat at 2 ppm, severe irritation of mucous membranes at 4 ppm, and unendurable irritation at a concentration of 21 ppm [87].
Aminoisocyanates and amines are compounds related to isocyanates in their chemical structure and effect. The group of amines contains compounds, some of which are irritant, acute toxic, cause allergic reactions, or are carcinogenic [90]. In Sweden, e.g., 2, 4-toluenediamine is classified as a toxic irritant that can cause cancer [88].
CH3
NCOOCN
2,6-TDI
OCN
CH3
NH2
2,4-TAI
NCOH
Isocyanic acid
Figure 3-14 Structure formulas for a diisocyanate; 2,6-toluene diisocyanate, a mo-noisocyanate; isocyanate acid, and an aminoisocyanate; 2,4-toluene aminoisocyanate.
There is not much published data available on the combustion related emissions of isocyanates from fires. Previous studies have been more focused on the emissions from thermal heating of materials without the occurrence of flaming combustion. One study, however, measured the emissions from outdoor training of firemen, including the burning and extinction of cars and containers clad with particleboard [91]. Isocyanates were found in the surrounding atmosphere from both of these types of training activities. Interestingly, air samples taken at rather remote locations from the fire site showed measurable concentrations of isocyanates. In another investi-gation of the toxic risks from fires, isocyanates were detected in tubular furnace tests at 300°C and 600°C with glass wool and mineral wool, and at 600°C with poly-isocyanurate foam [92]. Another series of studies are those of Marlair et al. [93, 94],

Emissions from Fires
42
where the ignition risks and toxic gas formation from fires with pure industrial isocyanate compounds were investigated. Isocyanates were, in these studies, mainly found during the fire development phase, whereas hydrogen cyanide was found from fully developed fires.
The results from measurements of isocyanates in a series of small-scale combustion experiments with the cone calorimeter [60], and one full-scale test in the room-corner enclosure [95] are presented in Paper VI. Twenty four different materials and products were investigated in the small-scale experiments (Table 1, Paper VI). An upholstered sofa was burnt in the large-scale experiment. The amounts of iso-cyanates, aminoisocyanates and amines produced from these materials were quantified; both compounds in the gas phase and in parts of the particle phase. The experimental conditions for these tests are also described in Paper VI. Further, isocyanate compounds were measured during sprinkler tests with PUR mattresses (Paper VI) and in a full-scale fire test with an automobile (Paper X).
Isocyanates were found in the cone calorimeter tests from all materials that can be identified as nitrogen containing. In several cases monoisocyanates such as ICA dominated. Somewhat unexpectedly, however, isocyanates were also found from cables and from e.g. a bitumen roofing material and a PVC-carpet. These products obviously had components that contained nitrogen.
Amines and aminoisocyanates were generally found in very low concentrations or not detected, with the exception of the PUR foam products, which produced significant amounts of these compounds.
Isocyanates were further found in the particle phase for some of the products tested. Especially wood showed an enrichment of isocyanate in the particle phase. The highest yields of isocyanates, of all materials tested, were from glass- and mineral wool products. These products did not show flaming combustion in the cone calorimeter tests, but pyrolysed with the production of visible smoke. The types of isocyanates found were principally ICA and MIC (monoisocyanates). The binder in these materials is often cured phenol-formaldehyde-urea (PFU) that preferably dissociates to isocyanates if heated. The findings of high concentrations of ICA and MIC correlate well with what has previously been reported from work environment related heating tests with mineral wool using a tube furnace [96]. In these tests up to 5% of the total mass was emitted as ICA and 1% as MIC, depending on the amount of PFU binder. In the cone calorimeter tests of Paper VI with mineral wool, approximately 3% of the total mass was emitted as ICA and 0.5% as MIC. The yields from the glass wool were, however, significantly higher, 6.8% for ICA and 1.4% for MIC.
The polyurethane products tested in the cone calorimeter were degraded under flaming combustion conditions. High concentrations of isocyanates were found from these products, which could be expected considering their chemical structure. Polyurethanes are produced by reacting isocyanates with a polyol, such as polyether or polyester, to form a flexible or a rigid polymeric product. TDI is used for the production of flexible PUR foam, elastomers and coatings, while pMDI (pre-polymerised methylenediphenyl isocyanate) is typically used for the production of rigid PUR foam. PIR foam is an improved type of rigid PUR.

Results and discussion of experimental work
43
The results from the measurements of isocyanates in the cone calorimeter tests with PUR products are shown in Figure 3-15. Both rigid PUR and PIR predominately emitted ICA and PHI (monoisocyanates); only low amounts of MDI were found. ICA can be considered as the “final” breakdown product of the isocyanates in the polyurethane chain structure. PHI may be an intermediate product from the break-down of MDI, but PHI is also found as an impurity in technical grade MDI. A more varied mix of isocyanates was found from the flexible PUR foam, where ICA, 2,4-TDI and 2,6-TDI were found in the highest amounts. This makes sense as TDI is used for the production of flexible PUR foams. Significant amounts of amines and aminoisocyanates were additionally found for the PUR products (Figure 7, Paper VI).
0
1
100
10000
PUR (flexible foam) PUR (rigid foam) PIR (rigid foam)
Yie
lds
of
iso
cy
an
ate
s (
µg
/g)
2,4
-TD
I
EIC
HD
I
2,6
-TD
I
IPD
I
ICA
4,4
-MD
I
PH
I
MIC
EIC
4,4
-MD
I
4,4
-MD
I
ICA
ICA
PH
I
PH
I
MIC
IPD
I
Figure 3-15 Yields of isocyanates from PUR products combusted under flaming conditions in the cone calorimeter (logarithmic scale on y-axis).
Thus, it has been shown conclusively that significant amounts of isocyanate compounds are produced and escape from the hot zone in flaming combustion of a wide range of materials in a small-scale test. It is also important to establish if these emissions are found from real products under more realistic fire conditions. Indeed isocyanates have also been found in the smoke gases from an upholstered sofa burning within a room, from burning PUR mattresses that were extinguished with water in sprinkler tests, and from a burning automobile.
In the case of the automobile, it was possible to quantify the yield of the isocyanate emissions. The yield found from the real-scale automobile fire was 0.24 mg/g, which is a rather high yield compared with, e.g., the 0.87 mg/g that was found from flexible PUR in the cone calorimeter. Traces of isocyanate metabolites were further found in the urine of a person working in the vicinity of the full-scale test where PUR mattresses were burnt, which shows that exposure to this type of smoke gases might lead to bodily uptake.

Emissions from Fires
44
3.2.2 Semi-volatile/condensed phase organics
Polycyclic aromatic hydrocarbons (PAHs) and dibenzo-p-dioxins/furans, the latter often referred to as “dioxins”, are two groups of semi-volatile/condensed phase organic compounds that have been analysed in several of the fire tests that form the basis of this thesis. Both PAHs and dioxins are, to a varying degree, chemically stable compounds and lipophilic in nature. They are available for bioaccumulation (especially dioxins which are highly persistent compounds), and exhibit a range of toxic effects, of which carcinogenicity is the most significant. Both groups consist of a large number of individual compounds (congeners), for which the toxicity varies widely.
Typically, for groups of structurally related compounds the toxicity of individual congeners is related to a well-studied reference compound to generate Toxic
Equivalence Factors (TEFs) on the basis of shared characteristics [97].
When the measured endpoint in a toxicity assay is positively related to toxicity, then:
TEFi = (endpoint congener i) / (endpoint reference compound). (3.2)
The toxic equivalency (TEQ), i.e. the total toxic potency, of a mixture of congeners can thus be expressed as:
{ }×=i ii TEFcongenerTEQ . (3.3)
The results from measurements of PAHs and dioxins in fire gases are given in the following sections. Background information on these compounds and comparisons with emissions from other combustion sources are further included.
Polycyclic aromatic hydrocarbons (PAHs)
Polycyclic aromatic hydrocarbons (PAHs) are defined as being comprised of two or more joined aromatic rings. The toxicity of individual PAHs varies widely, and a range of non-cancer and cancer effects have been demonstrated [97]. The PAH that has been investigated the most is benzo(a)pyrene (BaP). BaP is metabolised to oxygenated forms that act as a carcinogen in the body [98]. The chemical structure of BaP and other PAHs can be found in Table 3-2.
Systems for toxicity ranking of PAH congeners have been proposed, in which BaP normally has a TEF of 1.0. Many of these systems are based on dose-response modelling of cancer potencies, i.e., only the cancer effect is addressed using such models. The applications of TEF-models for PAHs have been reviewed by Delistraty [97], who concludes that TEF-models are applicable as useful tools in risk assess-ments of complex mixtures of PAHs. There is at present, however, no general consensus on a single toxicity ranking systems for PAHs. One model often referred to, however, is that of Nisbet and LaGoy [99], in which individual PAHs are assigned TEFs which have been rounded to the nearest order of magnitude to avoid overstating the precision [100]. The model of Nisbet and LaGoy is used in this thesis

Results and discussion of experimental work
45
to coarsely assess the toxicity (i.e. the cancer potential) of mixtures of PAH compounds.
TEF values together with additional information on chemical structure and cancer classifications are given in Table 3-2 for the individual PAH congeners that have been measured in this work.
Table 3-2 Information on chemical structure, cancer classification and TEFs for individual PAHs.
PAH amu Structure formulaa Classificationb TEFc
Naphthalene 128 USEPA: D IARC: 3
0.001
Acenaphthalene 152 USEPA: D IARC: N/A
0.001
Acenaphthene 154 USEPA: N/A IARC: N/A
0.001
Fluorene 166 USEPA: N/A IARC: 3
0.001
Phenanthrene 178 USEPA: D IARC: 3
0.001
Anthracene 178 USEPA: D IARC: 3
0.01
Fluoranthene 202 USEPA: D IARC: 3
0.001
Pyrene 202 USEPA: D IARC: 3
0.001
Benzo(a)fluorene 216 USEPA: N/A IARC: 3
-
Benzo(b)fluorene 216 USEPA: N/A IARC: 3
-
Benz(a)anthracene 228 USEPA: B2 IARC: 2A
0.1
Chrysene 228 USEPA: B 2 IARC: 3
0.01

Emissions from Fires
46
Table 3-2 (continued)
PAH amu Structure formulaa Classificationb TEFc
Benzo(b)fluoranthene 252 USEPA: B2 IARC: 2B
0.1
Benzo(k)fluoranthene 252 USEPA: B2 IARC: 2B
0.1
Benzo(e)pyrene 252 USEPA: N/A IARC: 3
-
Benzo(a)pyrene 252 USEPA: B2 IARC: 2A
1.0
Perylene 252 USEPA: N/A IARC: 3
-
Indeno(1,2,3-c,d)pyrene 276 USEPA: B2 IARC: 2B
0.1
Benzo(g,h,i)perylene 276 USEPA: D IARC: 3
0.01
Dibenz(a,h)anthracene 278 USEPA: B2 IARC: 2A
1.0 or 5.0d
Coronene 300 USEPA: N/A IARC: 3
-
aChemical structures of PAHs were gratefully reproduced from NIST Special Publication 922 on-line
internet site. b USEPA, U.S. Environmental Protection Agency [101]: B2-Probable human carcinogen; D-Not
classifiable.
IARC, International Agency for Research on Cancer [102]: 2A-Probable human carcinogen; 2B-Possible Human Carcinogen; 3-Not classifiable. c TEFs from Nisbet and LaGoy [99].
d A TEF of 1 is appropriate for high doses whereas a TEF of 5 is recommended for environmental
exposures [99].
N/A: No information available.
PAHs can be formed directly from saturated hydrocarbons in vitiated combustion atmospheres. Low molecular mass hydrocarbons act as precursors in the pyrosynthesis of PAH compounds that take place at temperatures above 500°C. The tendency for fuels to form PAH via pyrosynthesis varies depending on the structure

Results and discussion of experimental work
47
of the basic organic fuel. While all organic fuels can form PAH, the greatest yields are obtained from aromatic fuels followed by cyclic aliphatics, olefins and paraffins, in decreasing order of magnitude. Thermal break-down of heavier hydrocarbons through pyrolysis is another path to form small unstable precursor compound for PAH synthesis [98].
Lemieux et al. [103] have recently published a comprehensive review on the emissions of organic air toxics from “open burning”, including data on PAH emiss-ions. The review presents detailed quantitative data on PAHs from e.g. burning of crops, land clearing debris, yard waste, liquid fuels, household waste, scrap tires, and automobile shredder residue. The data is, however, not consistence in the range of PAH reported, and Lemieux et al. further report that there is a lack of quantitative data from accidental fires, including structural fires, landfill fires and vehicle fires.
Detailed quantitative analysis of PAHs in smoke gases were made in the fire tests reported on in Paper IV (TV-sets), Paper V (room fires) and Paper X (automobile fire). The total yields from these fire tests, together with data from the more recent series of room tests [36] [84], are given in Table 3-3. The results are further express-ed as BaP-TEQ, using the model of Nisbet and LaGoy with a TEF of 5.0 for dibenz(a,h)anthracene, and with a “toxicity index” calculated as the quotient of respective BaP-TEQ and yield. The toxicity index is introduced here to facilitate an assessment of the toxic quality of the smoke gases, i.e. to compare the toxicity from fires with a difference in produced yields. The distribution of individual PAH compounds are shown in Figure 3-16 and Figure 3-17.
Table 3-3 Total PAH yields and BaP-TEQ for full-scale fire tests.
Fire test Yield PAH (g/kg) BaP-TEQ (g/kg) Toxicity index a
Room1 0.67 0.017 0.025
2 1.7 0.050 0.029
3 1.0 0.027 0.027
4 0.80 0.017 0.021
5 0.60 0.016 0.027
6 0.71 0.019 0.027
Room (average) 0.91 0.024 0.026
nFR-TV 6.1 0.26 0.043
FR-TV 11 0.89 0.081
Automobile 1.1 0.035 0.032
a Toxicity index from the quotient of BaP-TEQ and PAH yield.
Recall that all six room fires were conducted with approximately the same fuel-load, i.e. the same general type and weight of furniture, TV etc. The difference, apart from the first item ignited, which varied, was the fire resistance/material composition of the TV and the sofa. A TV (FR-TV) with a HIPS (high impact polystyrene) housing containing decabromodiphenylether (deca-BDE) was included in room test 2,

Emissions from Fires
48
whereas the TV in all other room test was non-fire retarded (nFR-TV). In room tests 1-4 the sofa included had a non-fire retarded upholstering and covering. In room test 5 the covering was impregnated with a phosphorous based flame retardant, in room test 6 the flame retardant for the covering was bromine based. The upholstering (PUR) in both of these two sofas contained a phosphorous based flame retardant. The individual room fires showed a similar fire development. After a growth phase that varied in time dependent on the item ignited and random effects, the HRR in all cases raised to a level of about 4000 kW.
The yields of total PAH are of the same order of magnitude for the individual room fires as can be seen from Table 3-3, although there is some individual variation. It is not possible to attribute these differences in yields to any specific item included in the fuel load, e.g. the FR-TV or the FR sofas. A more plausible explanation for the variations in PAH yields is differences in fire development between the individual room tests. It is rather interesting to note that the toxicity index calculated for the tests are all are very similar. This shows that the composition of the PAH mixture produced from these fires all resembled each other very much. This is certainly the case as can be seen from Figure 3-16. Low molecular weight PAHs, mainly naphthalene, are quantitatively dominating the congener mix in all cases, but also more toxic PAHs as benzo(a)pyrene and dibenz(a,h)anthracene are present, although in much lower quantities.
Nap
htha
lene
Acena
phth
alen
e
Acena
phth
ene
Fluor
ene
Phena
nthr
ene
Anthr
acen
e
Fluor
anth
ene
Pyren
e
Benzo
(a)fl
uore
ne
Ben
zo(b
)fluo
rene
Ben
zo(a
)ant
hrac
ene
Chr
ysen
e
Ben
zo(b
)fluo
rant
hene
Benzo
(k)fl
uora
nthe
ne
Benzo
(e)p
yren
e
Benzo
(a)p
yren
e
Perylen
e
Inde
no(1
,2,3
-c,d
)pyr
ene
Benzo
(g,h
,i)pe
ryle
ne
Diben
z(a,
h)an
thra
cene
Cor
onen
e
0
5
10
15
20
25
30
35
40
45
50
Re
lative d
istr
ibu
tio
n (
%)
Room 1
Room 2
Room 3
Room 4
Room 5
Room 6
Figure 3-16 Relative distribution of PAH congeners in room fires.

Results and discussion of experimental work
49
The results from the room tests are compared with the emissions from the fires with single TV-sets and the automobile fire in Table 3-3. It can be noted that a fire with a mixture of material as in the case of the automobile fire, gives a yield of PAH similar to that from room tests. The toxicity index for the automobile fire is further comparable to that from room tests, with a similarity in the PAH congener distribution and thus toxicity, which can be seen from Figure 3-17 and Figure 3-18, respectively.
The yields of PAH from the two single TV fires are significantly higher, but perhaps more important is that the toxicity indexes are higher, especially for the FR-TV. The difference in PAH congener distribution and the impact from this in toxicity can be seen from Figure 3-17 and Figure 3-18, respectively. The high yields of PAH from the TV-sets can most likely be attributed to the composition of the housing materials which was HIPS (a plastic with an aromatic backbone, cf. the discussion on PAH formation above) for both TVs. The HIPS was compounded with deca-BDE for the FR-TV, which interferes in the combustion process and obviously enhances the production, as well as the toxicity, of PAHs.
Nap
htha
lene
Acena
phth
alen
e
Acena
phth
ene
Fluor
ene
Phe
nant
hren
e
Anthr
acen
e
Fluor
anth
ene
Pyren
e
Benzo
(a)fl
uore
ne
Benzo
(b)fl
uore
ne
Ben
zo(a
)ant
hrac
ene
Chr
ysen
e
Ben
zo(b
)fluo
rant
hene
Ben
zo(k
)fluo
rant
hene
Ben
zo(e
)pyr
ene
Ben
zo(a
)pyr
ene
Per
ylen
e
Inde
no(1
,2,3
-c,d
)pyr
ene
Ben
zo(g
,h,i)
pery
lene
Diben
z(a,
h)an
thra
cene
Cor
onen
e
0
5
10
15
20
25
30
35
40
45
Rela
tive d
istr
ibution (
%) Room (average)
nFR-TV
FR-TV
Automobile fire
Figure 3-17 Relative distribution of PAH congeners in full-scale fire tests.

Emissions from Fires
50
A selection of PAH yields from other combustion sources than accidental fires (or simulation of such fires) are given in Table 3-4. Johansson et al. [104] have recently presented results from measurements on the emissions from various residential combustion devices. Unfortunately, only total PAH emissions are presented in this reference. As there was no detailed information on the congener composition, it has not been possible to calculate BaP-TEQ for this data. Information was, however, given in the article that PAH from biofuel combustion consisted, in average, of 70% naphthalene, phenanthrene, fluoranthene, pyrene and acenaphthalene, i.e., a compo-sition similar to that from the real-scale fire experiments (cf. Figure 3-17).
Table 3-4 Examples of total PAH yields for residential combustion devices and total PAH yields and BaP-TEQ for open burning.
Source Yield PAH (g/kg) BaP-TEQ (g/kg) Toxicity index a
Residential combustion devices [104]:
Old wood boiler 0.3 - 1 N/A -
Modern wood boiler b 0.004 - 0.6 N/A -
Pellet boiler/burner b 0.002 - 0.01 (0.16) N/A -
Oil burner b 0.0003 - 0.007 N/A -
Open burning [103]:
Scrap tires 4.4 0.14c 0.032
Automobile shredder residues
1.6 0.050 c 0.031
Household waste 0.045 0.0034 c 0.076
a Toxicity index from the quotient of BaP-TEQ and PAH yield. b
PAH yields have been calculated from the original data that was expressed as mg/MJ. The calculations are based on heating values of respective fuel and dry fuel weight. c
BaP-TEQ have been calculated according to the model of Nisbet and LaGoy. N/A: No information available.
It can be seen that the PAH emissions from residential combustion devices often are much lower than the emissions from fires (i.e. the results given in Table 3-3). This is to be expected, but note that both modern and old residential wood burners, during unfavourable conditions, can produce PAH emissions of the same order of magni-tude as that from e.g. a room fire. A great variation (almost 3 order of magnitude) in PAH emission have also been shown for biomass-fired moving grate boilers (thermal capacity of ~1 MW) [105].
The yields of PAH from open burning presented in Table 3-4 is generally in the same order of magnitude as those from the real-scale fire experiments. The exception is the two order of magnitude lower data from open combustion of household waste. These results are, however, from a series of burning tests using a 200 L steel-drum with ventilation holes close to the base of the drum [106]. This combustion device may have increased the combustion efficiency, and caused a lower PAH yield compared to e.g. a fire with the same fuel at a landfill. It is worth noting that the toxicity index for the open burning of scrap tires and automobile shredder residues are comparable

Results and discussion of experimental work
51
to those from room fires and an automobile fire, whereas that from the burning of household waste (in a drum) is twice as high (i.e. a more toxic mix of PAHs are produced).
The relative BaP-TEQ for open burning are presented in Figure 3-18 together with the data for the real-scale fire tests. The figure illustrates that there are a few medium-high molecular weight PAHs that give the greatest contribution to the toxicity of the PAH mixture produced from fires, benzo(a)pyrene and dibenz(a,h)-anthracene giving the greatest contribution.
Nap
htha
lene
Ace
naph
thal
ene
Acena
phth
ene
Fluor
ene
Phena
nthr
ene
Anthr
acen
e
Fluor
anth
ene
Pyren
e
Ben
zo(a
)ant
hrac
ene
Chr
ysen
e
Ben
zo(b
)fluo
rant
hene
Ben
zo(k
)fluo
rant
hene
Benzo
(a)p
yren
e
Inde
no(1
,2,3
-c,d
)pyr
ene
Ben
zo(g
,h,i)
pery
lene
Dib
enz(
a,h)
anth
race
ne
0
10
20
30
40
50
60
70
80
Rela
tive
Ba
P-T
EQ
(%
)
Room (average)
nFR-TV
FR-TV
Automobile fire
Household waste
Scrap tires
Automobile scredder residues
Figure 3-18 Relative distribution of PAH congeners expressed as BaP-TEQ for various fires.

Emissions from Fires
52
It has thus been shown from real-scale fire experiments that:
- Room fires with a mix of material normally found in residences, produce a total yield of PAH around 1 g/kg.
- A total yield of the same magnitude was found from a simulated automobile fire.
- The distribution of individual PAHs (and thus the toxicity) was very similar for room fires and the automobile fire (both fires with a mix of materials).
- Specific materials can produce an order of magnitude higher total PAH yields, and a more toxic mixture of PAHs, e.g. fires with TV-sets (especially a TV with Deca-BDE fire-retarded HIPS housing).
- The distribution of individual PAHs was generally, for all real-scale fires, quantitatively dominated by low molecular mass PAHs, whereas a few medium-high PAHs were most important for the toxicity of the PAH mixture.
In comparison with other combustion sources it was shown that:
- Fires normally produce order of magnitudes higher yields compared to e.g.
residential combustion devices.
- Accidental fires give total PAH yields of the same order of magnitude as those from open burning of e.g. scrap tires and automobile shredder residues.
- The relative distribution of individual PAHs, which determines the toxicity of the PAH mix, was similar for accidental fires and open burning, in that principally benzo(a)pyrene and dibenz(a,h)anthracene accounted for the toxicity.
Polychlorinated dibenzo-p-dioxins and dibenzofurans
Polychlorinated dibenzo-p-dioxins (PCDDs) and dibenzofurans (PCDFs) are two closely related groups of compounds that often are referred to as dioxins. They share a common basic molecular structure comprised of two aromatic rings, joined by two ether-bridges in the case of PCDDs; and by one ether-bridge and one carbon-carbon bond in a heterocyclic arrangement in the case of PCDFs. Both types of compounds can be substituted with up to eight chlorine atoms, and are thus divided into eight homologue groups (homologues are substituted with the same numbers of chlorine atoms, but at different positions). This results in 75 individual PCDD and 135 PCDF congeners. The basic molecular structures of PCDDs and PCDFs are shown in Figure 3-19 together with the molecular structure of the highly toxic 2,3,7,8 tetrachlorodibenzo-p-dioxin (2,3,7,8-TCDD).

Results and discussion of experimental work
53
O
OCl
Cl
Cl
Cl
2,3,7,8-tetrachlorodibenzo-p -dioxin
polychlorinated dibenzofuran
O
( Cl ) x
1
2
3
4
9
7
8
6
1
2
3
4
9
7
8
6O
O
( Cl ) x
polychlorinated dibenzo-p -dioxin
Figure 3-19 General structure of polychlorinated dibenzo-p-dioxins and dibenzo-furans (the numbering convention of the different positions is shown) and the specific structure of 2,3,7,8 tetrachlorodibenzo-p-dioxin.
The difference in molecular structure between dibenzo-p-dioxins and dibenzofurans may seem small, but has implication for molecular stability. While the heterocyclic bridge in the dibenzofuran molecule results in a closed shell of delocalized electrons and thus fulfils the Hückels rule for aromaticity, the ether-bridges in a dibenzo-p-dioxin do not. Dibenzofurans are thus defined as aromatic molecules, and are much more stable than dibenzo-p-dioxins.
The most notable individual dioxin congener is 2,3,7,8-TCDD, which is thermally stable, has a high degree of chemically stability, and is poorly biodegradable [98]. This compound has proven to be very toxic, with effects including dermal toxicity, immunotoxicity, reproductive effects and teratogenicity (i.e. disturbance of the development of an embryo or fetus), endocrine disruption and carcinogenicity [107].
All of the effects of dioxins which have been examined involve interaction with a specific cellular protein known as the Ah, or dioxin, receptor. This interaction is necessary, but not sufficient, to bring about responses. 2,3,7,8-TCDD is considered the prototype for a class of compounds, the polyhalogenated aromatic hydrocarbons (PHAHs). These chemicals include dibenzo-p-dioxins, dibenzofurans, but also, e.g.,biphenyls and naphthalenes which are halogenated in the four lateral positions. The halogens can be either chlorine and/or bromine atoms. In addition to the lateral halogenation, the 2,3,7,8-TCDD-like PHAHs must be able to assume a planar conformation in order to bind tightly to the Ah receptor [108]. Thus, all PCDDs (7 pcs.) and PCDFs (10 pcs.) with chlorine substituted at positions 2, 3, 7 and 8, are toxic with characteristics resembling those of 2,3,7,8-TCDD.
These 17 congeners are usually summed (referred to as TCDD-TEQ) using weights according to the relative toxicity of the individual chemicals. In this sum 2,3,7,8-TCDD is used as the reference compound, and each other member of the group is

Emissions from Fires
54
assigned a toxic equivalency factor (TEF) that describes the toxicity of the species relative to that of 2,3,7,8-TCDD (see the general discussion of TEF-models in the beginning of this section). TEFs for dioxins are based on data from various toxicity assays. The largest data base, however, involves studies of the affinity for binding to the Ah receptor [108].
Some common schemes that can be found in the literature are the TEFs according to the Eadon model [109], the Nordic model [110], the International model [111] and the more recent WHO model [107]. The TEFs proposed by these models are given in Table 3-5. A problem with the existence of several TEF-models is that the TCDD-equivalents found in the literature cannot always be converted to a common basis regarding TEFs, as details regarding the individual congeners are not always reported. The most recent TEF-model (WHO TEFs) has been used for calculations of TCDD-TEQs in this thesis.
Table 3-5 TEF-models for toxicity weighting of mixtures of dioxins.
2,3,7,8-substituted PCDD/F congeners
EadonTEFs
NordicTEFs
International TEFs
WHO TEFs
Dibenzo-p-dioxins:
2,3,7,8-TetraCDD 1 1 1 1
1,2,3,7,8-PentaCDD 1 0.5 0.5 1
1,2,3,6,7,8-HexaCDD 0.03 0.1 0.1 0.1
1,2,3,7,8,9-HexaCDD 0.03 0.1 0.1 0.1
1,2,3,4,7,8-HexaCDD 0.03 0.1 0.1 0.1
1,2,3,4,6,7,8-HeptaCDD 0 0.01 0.01 0.01
OctaCDD 0 0.001 0.001 0.0001
Dibenzofurans:
2,3,7,8-TetraCDF 0.33 0.1 0.1 0.1
1,2,3,7,8-PentaCDF 0.33 0.01 0.05 0.05
2,3,4,7,8-PentaCDF 0.33 0.5 0.5 0.5
1,2,3,6,7,8-HexaCDF 0.01 0.1 0.1 0.1
1,2,3,7,8,9-HexaCDF 0.01 0.1 0.1 0.1
1,2,3,4,7,8-HexaCDF 0.01 0.1 0.1 0.1
2,3,4,6,7,8-HexaCDF 0.01 0.1 0.1 0.1
1,2,3,4,6,7,8-HeptaCDF 0 0.01 0.01 0.01
1,2,3,4,7,8,9-HeptaCDF 0 0.01 0.01 0.01
OctaCDF 0 0.001 0.001 0.0001
Traces of dioxins can be found throughout our ecosystem. In contrast to certain environmental toxins like polychlorinated biphenyls (PCBs) and certain polychlorinated pesticides like DDT, dioxins have never been produced as an industrial end-product. This group of chemicals is, instead, produced as a bi-product of certain industrial processes and through incomplete combustion.

Results and discussion of experimental work
55
Polychlorinated dibenzo-p-dioxins and dibenzofurans (PCDD/Fs) can be formed in combustion atmospheres when carbon, hydrogen and chlorine are present. There are two major formation routes: (1) homogeneous vapour phase formation (primary formation), critical temperature range 500-800°C, and (2) heterogeneous solid phase formation (secondary formation), 200-400°C [112]. Homogeneous formation of PCDDs/Fs is mainly related to precursor compound reactions, whereas hetero-geneous formation has two main mechanisms, one of which is formation from precursors and the other de novo formation from elemental carbon [112]. The presence of a metal catalyst, prominently Cu, is important in heterogeneous formation. The temperature window between 250 and 400°C has been identified as the most important for PCDD/F formation in flue gases from combustion devices, and the importance of chlorination/de-chlorination reactions in the low temperature range has further been observed [113]. Other factors of importance for TCDD/F formation in combustion include: the residence time, combustion conditions (equivalence ratio), particle concentration and presence of chlorine.
The coupling between the chlorine content of the fuel and the resulting PCDD/F production has been debated. It appears, however, that the chlorine content is of greatest importance at higher chlorine levels, while at lower chlorine levels, combustion conditions are more important. Wikström [113] has e.g. shown from tests in a laboratory scale fluidized bed reactor that the chlorine content was of importance only at chlorine levels above ~1 wt-%. At lower levels no influence was seen of the chlorine content, but a clear correlation was seen between the combustion conditions and the PCDD/F production. At poor combustion conditions a ten-fold increase in production was seen. Gullet et al. [114] saw influences both from the level of chlorine content in the fuel and from the combustion conditions in open barrel burning of household waste (cf. Table 3-7).
Relevant quantitative analytical results (i.e. yields) for PCDD/Fs from accidental fires or large-scale fire tests are scarce. Lemieux et al. note that this type of data is very limited or non-existent for all types of open combustion [103]. Most public-cations report more qualitative results, e.g. concentrations found in soot samples taken at fire sites [115] [116], or the concentrations in the smoke gases from, e.g.
simulated house fires [117], landfill fires [118], vehicle fires [119], with no or limited information on the total production. Some quantitative results from large-scale fire tests have, however, been reported, e.g., by Vikelsøe and Johansen from the burnings of chemicals [120] and by Andersson et al. from cable fires [121].
Detailed quantitative analysis of PCDD/Fs was made in the full-scale fire tests discussed in the previous section regarding PAHs. Additionally, brominated dioxins (PBDD/Fs) were analysed in the fire tests with TV-sets and in all six room tests.
The results for PCDD/Fs are presented in Table 3-6. The results are presented as total yields of all dioxin homologues, yields of all (17 pcs.) 2,3,7,8- substituted dioxin congeners and as TCDD-equivalents calculated by the WHO TEF-model. Also here, a “toxicity index” has been calculated for each fire test to facilitate a quick assess-ment of the toxic quality of the congener mix.

Emissions from Fires
56
The results for the room tests show a rather high relative variation between the individual tests. These results can, however, be considered to be of the same order of magnitude relative to the results from the other full-scale fires which are significantly higher.
Table 3-6 Quantitative PCDD/F results from full-scale fire tests.
Fire test Yield all dioxin homologues
(µg/kg)
Yield 2,3,7,8- substituted dioxin congeners (µg/kg)
TCDD-TEQa
(µg/kg)Toxicityindexb
Room 1 1.5 0.11 0.016 0.14
2 0.92 0.075 0.013 0.17
3 0.41 0.066 0.0058 0.09
4 0.21 0.028 0.0022 0.08
5 1.1 0.17 0.0079 0.05
6 3.3 0.26 0.033 0.13
nFR-TV 110 7.5 1.0 0.13
FR-TV 530 25 10 0.40
Automobile 58 6.8 0.73 0.11
aTCDD-TEQ calculated according to the WHO-model [107].
bToxicity index from the quotient of TCDD-TEQ and 2,3,7,8-congener yield.
An explanation of the large difference in yields between, e.g., a room fire and the automobile fire (mixed fuel in both cases) includes an element of speculation as not all facts on fuel composition and combustion conditions are at hand. One could, however, suppose that the chlorine content of the fuel was higher in case of the automobile, as much of the combustible material in an automobile contains chlorine. Thermal breakdown of PCDD/Fs would also be more effective in the case of a room fire. The temperature of the upper smoke gas layer in the room exceeded 800° during the period of the tests where most fuel was combusted, and thermal breakdown of formed PCDDs/Fs was thus possible [112].
The exceptionally high yield of chlorinated dioxins from the FR-TV is notable. The high toxicity index in Table 3-6 further indicates that the 2,3,7,8-substituted congener mix contains an unusually high proportion of high-TEF congeners. It seems possible that the action of the brominated flame retardant (deca-BDE) in the FR-TV promoted formation of chlorinated dioxins; simply by decreasing the combustion efficiency or by other more elaborate mechanisms. It has been seen in pilot scale incinerator experiments that the co-combustion of brominated compounds with a chlorine-containing fuel shifts the homologue distribution of PCDD/Fs towards higher chlorinated species. An increase in the total production of PCDD/F has, however, not been seen as a result of the presence of bromine in the fuel mix [122] [123]. Söderström and Marklund [122] suggest, however, that the presence of Br2 in the gas phase may generate Cl-radicals from Cl2. This reaction would be an extra source of Cl-radicals (the active Cl-species in the gas phase) which could increase the production of PCDD/F.

Results and discussion of experimental work
57
The high PCDD/F yields from the fire with the single FR-TV, however, were not seen in the results from the room test that contained the same type of TV (Room 2). The total amount of PCDD/F from open combustion of one FR-TV would give 6.5 kg ×10 µg/kg = 65 µg TCDD-equivalents, whereas room test 2 only gave an (approximate) total production of 553 kg ×0.9i ×0.013 µg/kg = 6.5 µg TCDD-equivalents. This corroborates the hypothesis that the conditions in the room tests might have promoted thermal breakdown of PCDD/F, and that the combustion conditions are important for PCDD/F formation in fires.
The yields of PCDD/F from other combustion sources are given in Table 3-7 to set the results from the fire tests into perspective. Results on the emissions from residential pellets boilers (4 measurements) and MSW biofuel boilers (3 different boilers) have recently been included in a report from the Swedish Environmental Agency (SRV) [124]. The measured emissions were very low. Emission levels above the detection limit of the analytical method were found in only one case: a pellet boiler. This result from residential combustion of wood pellets (with no flue gas cleaning) is in line with the emission factor for wood/biomass combustion that previously has been estimated by Thomas and Spiro [125]. In contrast, Carroll [126] has estimated a broad range for the emission factor for wood, but he has included a wide variety of source data, from industrial combustion devices to the burning of demolition scrap.
Table 3-7 Yields of PCDD/F from various combustion sources.
Source TCDD-TEQa (µg/kg)
Residential pellet boilersb [124] <0.001 - 0.002
MSW biofuel boilersb (flue gas cleaned) [124] <0.00002 - <0.0005
Wood c [126] 0.0008 - 0.17
Wood/biomass combustion [125] 0.002
PVC c [126] 0.003 - 6.6
Open burning of household wasted [114] 0.014; 0.079; 0.20; 4.9 a [124] reported data in WHO-TEQ. The data in [126] was reported as I-TEQ,
whereas [125] and [114] reported data as TEQ.b
TCDD-TEQ yields have been calculated from the original data that was expressed as mg/MJ. The calculations are based on heating values of respective fuel and dry fuel weight. c
Ash reminder are included in these results.d
Averages from burnings with household waste containing 0%, 0.2%, 1.0% respective 7.5% PVC.
The results from the room tests (Table 3-6) varied between 0.002-0.03 µg TCDD-TEQ/kg, with the lower limit corresponding to the value estimated for un-cleaned wood combustion, and with the higher limit corresponding to the lower span for open burning of household waste. The results from the real-scale fires with the automobile and the two types of TV-sets are high in comparison with the literature data presented in Table 3-7. The results from the FR-TV (10 µg TCDD-TEQ/kg) is actually higher than what have been reported for combustion of PVC and open burning of household waste with a high percentage of PVC.
i A combustion efficiency of 90% was assumed for the room tests.

Emissions from Fires
58
The homologue profiles from the fire tests are shown in Figure 3-20. It can be seen that PCDFs dominate over PCDDs in all cases. Most abundant are the tetra-substituted furans, with a decrease in abundance for higher homologue series in a step-wise fashion. The relative distribution in the homologue series for PCDDs is more random, both between the individual room tests, and for the other real-scale fire tests.
The relative distribution in the PCDF homologue series and the dominance of PCDFs over PCDDs shown here for fires, is also typical of MSW (Municipal Solid Waste) combustion. This was e.g. shown by Wikström from results of 35 flue gas samples from MSW combustion and measurements in a lab reactor [113]. A similar trend in homologue distribution was further seen in the room fires by Ruokojärvi et al. [117]. It is interesting to note that Ruokojärvi et al. could not link the presence of PVC in two of their room fires to any significant increase in measured PCDD/F concentrations.
TCDF
PnC
DF
HxC
DF
HpC
DF
OCDF
TCDD
PnC
DD
HxC
DD
HpC
DD
OCDD
0
10
20
30
40
50
60
70
80
Re
lative
ho
molo
gu
e d
istr
ibutio
n (
%)
Room 1
Room 2
Room 3
Room 4
Room 5
Room 6
nFR-TV
FR-TV
Automobile fire
Figure 3-20 Homologue profiles for PCDD/Fs measured in real-scale fire tests.
The results from the fire tests expressed as relative TCDD-TEQ are shown in Figure 3-21. It is apparent that the congeners most responsible for the toxicity are 2,3,4,7,8-PnCDF and/or 1,2,3,7,8-PnCDD, but there is no common pattern e.g. for the room tests. Although tetra- and penta-CDD homologues are present in significant amounts for the FR-TV (Figure 3-20) there were in fact no 2,3,7,8-CDD congeners found at all from this product, and the toxicity is completely dominated by 2,3,4,7,8-PnCDF.
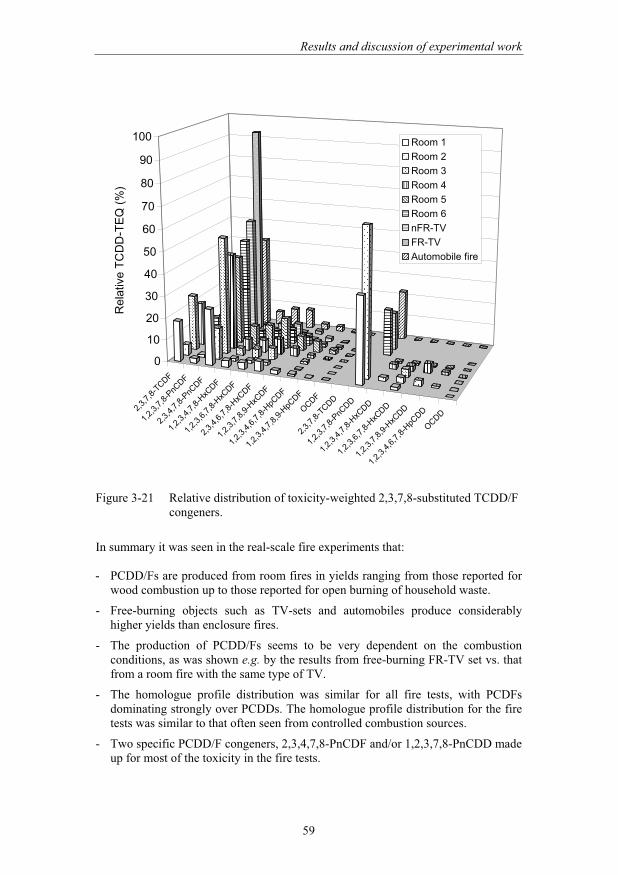
Results and discussion of experimental work
59
2,3,
7,8-
TCDF
1,2,
3,7,
8-PnC
DF
2,3,
4,7,
8-PnC
DF
1,2,
3,4,
7,8-
HxC
DF
1,2,
3,6,
7,8-
HxC
DF
2,3,
4,6,
7,8-
HxC
DF
1,2,
3,7,
8,9-
HxC
DF
1,2,
3,4,
6,7,
8-HpC
DF
1,2,
3,4,
7,8,
9-HpC
DF
OCDF
2,3,
7,8-
TCDD
1,2,
3,7,
8-PnC
DD
1,2,
3,4,
7,8-
HxC
DD
1,2,
3,6,
7,8-
HxC
DD
1,2,
3,7,
8,9-
HxC
DD
1,2,
3,4,
6,7,
8-HpC
DD
OCDD
0
10
20
30
40
50
60
70
80
90
100
Re
lative T
CD
D-T
EQ
(%
)
Room 1
Room 2
Room 3
Room 4
Room 5
Room 6
nFR-TV
FR-TV
Automobile fire
Figure 3-21 Relative distribution of toxicity-weighted 2,3,7,8-substituted TCDD/F congeners.
In summary it was seen in the real-scale fire experiments that:
- PCDD/Fs are produced from room fires in yields ranging from those reported for wood combustion up to those reported for open burning of household waste.
- Free-burning objects such as TV-sets and automobiles produce considerably higher yields than enclosure fires.
- The production of PCDD/Fs seems to be very dependent on the combustion conditions, as was shown e.g. by the results from free-burning FR-TV set vs. that from a room fire with the same type of TV.
- The homologue profile distribution was similar for all fire tests, with PCDFs dominating strongly over PCDDs. The homologue profile distribution for the fire tests was similar to that often seen from controlled combustion sources.
- Two specific PCDD/F congeners, 2,3,4,7,8-PnCDF and/or 1,2,3,7,8-PnCDD made up for most of the toxicity in the fire tests.

Emissions from Fires
60
Polybrominated dibenzo-p-dioxins and dibenzofurans
Polybrominated dioxins (PBDD/Fs) were analysed in the fire tests with TV-sets and in the room tests, as noted above. The group of PBDD/Fs consists of the same number of congeners as their chlorinated counterpart, but PBDD/Fs have different behaviour due to the bromine atom being larger than chlorine and the lower bond strength of the carbon-bromine bond. Although limited, the knowledge of the health effect of PBDD/Fs indicate that these compounds have similar biological properties (including toxicity) as their chlorinated relatives [127].
Combustion of materials treated with brominated flame retardants (Br-FRs) is one potential source of emissions of PBDD/Fs [127]. In the fire experiments described in this thesis the FR-TV contained deca-BDE in the housing material and TBBPA in the printed circuit boards. The sofa included in room test 6 had a covering treated with a brominated flame retardant, presumably deca-BDE. The molecular structures of these compounds are shown in Figure 3-22. It is not difficult to imagine that, in particular, deca-BDE can act as a precursor in PBDD/F formation.
o
BrBr
Br
Br Br
Br Br
Br
BrBr
deca-BDE
C
CH3
CH3
Br
Br
HO
H
H
Br
Br
OH
H
H
TBBPA
Figure 3-22 Molecular structures of decabromodiphenylether (deca-BDE) and tetrabromobisphenol-A (TBBPA).
Previous work has shown that combustion involving Br-FRs can lead to the formation of PBDD/Fs. Buser [128] showed in micro-scale experiments with technical poly-BDE (PBDE) compounds that large fractions of the PBDE were recovered as PBDD/Fs during thermal degradation at 630°C. Luijk et al. [129] made similar experiments with pure PBDEs and found PBDD/F production with decreasing yields from Pn-BDE to deca-BDE. They further studied the influence of the HIPS polymer matrix in a HIPS/deca-BDE/Sb2O3 system, and found that this matrix shifted the optimal PBDF formation temperature from 600°C to the HIPS depolymerization temperature (350-400°C), favoured the formation of PBDFs, and further increased the total yield of PBDFs with a factor 7 (a maximum yield of ~1.5×10⁶ µg/kg PBDFs relative to polymer sample was found). Ebert and Bahadir [130] have reviewed published experimental data on PBDD/F production from thermal degradation (>300°C) of HIPS/deca-BDE/Sb2O3 and found yields (on polymer basis) between 1.5×10⁶ -150×106 µg/kg.

Results and discussion of experimental work
61
Similarly, Weber and Kuch [131] have recently reviewed the formation of PBDD/Fs from thermal degradation of Br-FRs. This review (and also that by Ebert and Bahadir) shows that conditions of incomplete combustion of Br-FRs (especially PBDEs), i.e. conditions that occurs during a fire, can lead to the formation of consid-erable amounts of PBDD/Fs. The primary formation pathway under insufficient combustion conditions is most likely that from precursor compounds (i.e. degra-dation products of PBDEs). However, the less stable bromine-carbon bond in brominated aromatics leads to a rapid decomposition of PBDEs at high temperatures, and thus to a reduced amount of precursors during such conditions [131].
High concentrations of PBDD/Fs have been found in fire residues after accidental fires in private residences. Zelinski et al. [132] investigated three different accidental fires and found brominated substances in most samples. The fire residues from a TV gave the highest concentrations of PBDD/Fs. Söderström and Marklund [133] investigated a private residence after a TV and VCR fire and analysed wipe samples and ash samples. Both type of samples contained chloro-, chlorobromo- and bromo-dioxins.
Quantitative data on PBDD/Fs formation from real-scale fires involving products treated with brominated flame retardants are scarce. Fabarius et al. [134] conducted fire experiments with FR (penta-BDE) TV-sets by burning them in a barrel and sampling the smoke gases at the top. They did find PBDD/Fs in the smoke, but they report their results as concentrations rather than yields.
The results from the measurements in stand-alone tests with the FR-TV and the deca-BDE treated sofa (a sofa similar to that included in room test 6) are presented in Figure 3-23.
It is important to recognize that the test conditions for the FR-TV required an ignition source (30 kW) in contact with the TV during the complete test; the TV self-extinguished if the ignition source was removed (cf. Paper IV). Only half of the combustible material (the total amount was 6.5 kg) of the TV was combusted during the test. The total content of deca-BDE in the TV can be approximated to 0.5 kg. For the sofa test, the same type of burner was applied during the first third of the test, after that the sofa burned freely. The weight of the sofa was 59 kg of which approximately 90% was combusted during the test. The covering of the sofa was impregnated with 0.53 kg of a Br-FR/Sb formulation. The chemical composition of the formulation was propriarity and is not fully known, but available information indicated that the Br-FR was deca-BDE. Information on the sofa test can be found in [84] and in more detail in the project report [36].

Emissions from Fires
62
TBDF
PnB
DF
HxB
DF
HpB
DF
2,3,
7,8-
TBDF
1,2,
3,7,
8-PnB
DF
2,3,
4,7,
8-PnB
DF
1,2,
3,4,
7,8-
HxB
DF
1,2,
3,4,
6,7,
8-HpB
DF
1
10
100
1000
10000
100000
1000000P
BD
F (
µg
/kg
)
FR-TV
BFR-Sofa
Figure 3-23 Yield of PBDF for stand-alone tests with an FR-TV (deca-BDE) and sofa with deca-BDE treated covering (total homologue groups were not measured for the sofa). Note: logarithmic scale on the y-axis.
In the FR-TV test the total amounts of both PBDF homologues and individual PBDD/F congeners was analysed. High concentrations of PBDFs were found, but only one PBDD congener (HxBDE) was detected (in low concentrations). The total yields of PBDF homologues was ~0.8×10⁶ µg/kg, i.e. almost as much as previously have been seen from small-scale thermal degradation experiments [130]. The yield of individual PBDD/Fs found was 68×103 µg/kg.
Individual PBDD/F congeners were analysed in the sofa fire, and only PBDFs were found. A yield of individual PBDFs of 5×10³ µg/kg was found from the sofa. The yield from the sofa was, however, calculated from the total weight-loss of the sofa, recalculating the yield on basis of the treated covering material only, would give a yield of ~80×103 µg/kg, i.e. close to the yield of individual PBDD/Fs found from the deca-BDE treated TV.
TBDD-TEQs have been calculated for the PBDD/Fs in line with what is standard procedure for PCDD/Fs. This is based on the assumption that the toxicity of brominated dibenzodioxins and dibenzofurans is the same as that for the chlorinated relatives. Although a very crude assessment of the toxicity, the resulting 4.7×10³ µg WHO-TEQ/kg for the FR-TV, and 0.12×10³ µg WHO-TEQ/kg for the sofa (yield based on sofa) are very high in comparison with data on TCDD/F formation in fires (cf. Table 3-6) and from other combustion sources (cf. Table 3-7).

Results and discussion of experimental work
63
One can note that residuals of the flame retardant deca-BDE were found in the smoke gases from both tests; 8.1×10³ µg/kg from the FR-TV and 67×103 µg/kg from the sofa. Degradation products of deca-BDE (tetra-hexa brominated BDEs) were analysed in the case of the sofa fire and were found in amounts approximately 1000 times less compared to deca-BDE.
The results from analysis of individual PBDD/F congeners in the room tests are compiled in Figure 3-24. The results from these tests were rather inconsistent in that PBDD/Fs were found in all tests, even those that did not contain a Br-FR object. One of the highest yields was, e.g., found in room test 4 that contained a non-fire retarded sofa. In most tests only one or two different congeners were found, and detectable amounts of individual congeners were also found in blank samples taken during the two measurements series. One explanation for the occurrence of PBDD/Fs in the room fires that did not contain a Br-FR object is that the detailed chemical composition was unknown for most of the material included in the room tests, and other sources of bromine could thus be present. There was indeed an unidentified source of bromine present in, at lest, room test 1. One proof of this is that HBr was found in room test 1 in equivalent amounts as that found in room tests 2 which contained the FR-TV. Similarly, the results from the blank tests show that the smoke gas collection system may have some contaminants from these species due to residues from previous tests.
Although scattered, the results from the room tests indicate that the combustion of deca-BDE treated materials in a room fire scenario does not generally increase the amount of PBDD/F in the smoke gases. The amounts produced from a room fire scenario are further much lower compared to a free-burning scenario of a single product. The total amount of individually analysed PBDD/Fs from open combustion of one FR-TV would give 6.5 kg × 68×103 µg/kg = 440×103 µg, whereas room test 2 merely gave an (approximate) total production of 553 kg ×0.9i ×0.05 µg/kg = 25 µg. The Br FR-treated sofa produced ~260×103 µg, whereas room tests 6, which included that type of sofa, produced ~1400 µg.
i A combustion efficiency of 90% was assumed for the room tests.

Emissions from Fires
64
2,3,
7,8-
TBDF
1,2,
3,7,
8-PnB
DF
2,3,
4,7,
8-PnB
DF
1,2,
3,4,
7,8-
HxB
DF
1,2,
3,4,
6,7,
8-HpB
DF
2,3,
7,8-
TBDD
1,2,
3,7,
8-PnB
DD
1,2,
3,4,
7,8/
1,2,
3,6,
7,8-
HxB
DD
1,2,
3,7,
8,9-
HxB
DD
0.0
0.5
1.0
1.5
2.0P
BD
D/F
(µ
g/k
g)
Blank 1-3
Blank 4-6
Room 1
Room 2
Room 3
Room 4
Room 5
Room 6
Figure 3-24 PBDD/F congeners analysed in room fire experiments.
In summary, it was seen in real-scale fire tests that for PBDD/Fs:
- Fires with products treated with deca-BDE can produce very high yields of predominately PBDFs.
- Approximate TBDD-TEQs calculated for these products (an FR-TV and an FR-treated sofa) were about 3 orders of magnitude higher than the highest TCDD-TEQs reported from burning of PVC.
- The yields of PBDD/Fs found from an FR-TV and an FR treated sofa were comp-arable with data from small-scale experiments.
- A fire with a Br-FR treated product within a room scenario that goes to flash-over produces considerable lower yields compared to a free burning scenario.

Results and discussion of experimental work
65
3.3 Particles
The smoke from a fire is an aerosol, composed of gases and solid/liquid particles. The particle phase is of great importance in fires as radiant energy is emitted through black body emission from solid particles in flames and hot smoke gas layers. The particles are also critical in causing visual obscuration that may impair the ability of people to escape from a fire.
Further, solid particles per se, and in particular finer fractions, are of concern regarding long term health effects. The environmental impact of airborne particles has long been a major ecological and environmental concern [135], with the anthropogenic part of the particulate material receiving the greatest attention. However, due to some alarming reports in the early 90’s [136], where statistically significant correlations were found between variations in airborne particulate matter and sickness/mortality within a population, this interest has also come to include the direct health impact of airborne particles [136] [137]. It has been estimated [138] that almost half a million people die per year as a result of particles generated by car engines only. This number might be compared to the estimated deaths/year due to smoking, which is 3 million/year.
All air in the atmosphere contains a certain amount of small particles, from ~102/cm3
in maritime environments, to ~106/cm3 in the air over large cities, and further to ~109
particles/cm3 in the flue gas from a boiler (before cleaning steps) [139]. Researchers have shown that the health effects are mainly related to the sub-micron sized fraction of the particles, i.e., to the particles having an aerodynamic diameter, dp, less than one micron (µm). Some even suggest that the real danger is related to those particles with dp< 0.1 micron (ultra fine particles) [140] [141]. Such small particles are generated in large amounts in combustion processes, partly as a result of evaporation /condensation processes, and partly from soot generation.
The formation of soot particles is closely linked to the preceding formation of PAHs (see discussion in Section 3.2.2). The first step in soot formation is actually the particle interception of heavy molecules (PAHs) to form particle-like structures. These structures can subsequently grow through condensation, and surface growth by addition of mainly acetylene [41]. Larger structures can be formed by coagulation and agglomeration. These larger agglomerates can further be degraded by oxidation reactions. The basic steps in soot particle formation are shown in Figure 3-25. After the particle interception zone the size of the particles is a few nano meters (nm), whereas they have grown to 20-50 nm after the coagulation zone [142].
As the smoke leaves the flames of a fire and cools, vapour phase PAH condense on the surface of the soot particles. The amount of condensed organics varies from under 20% up to 50% for well-ventilated and under-ventilated fires, respectively [142].

Emissions from Fires
66
Figure: Anne Dederichs [143]
Figure 3-25 Schematic of soot particle formation.
Basically, particles having a diameter of less than 10 µm can be inhaled and the smaller the particle, the less probable it is that the defence system of the body will be able to prevent the material from reaching deep into the lung system. (This is shown schematically in Paper VII, figure 2). Another potential health-hazard related to combustion generated particles is the possibility for adsorption and enrichment of various toxic substances on the particle surface (metals, PAHs, dioxins, HCl, etc.). The occurrence of isocyanates associated to the particle phase is discussed in Paper VI.
The quality, i.e., the mass size and the number size distribution, of the smoke aerosol from fires is thus of importance. There are, however, few reports of detailed quanti-tative measurements to be found in the litterature. Much of the present knowledge regarding particle generation from fires has been compiled by Mulholland [65]. This work indicates that the (geometric mean mass) particle sizes found from fires are often smaller than 1 µm. In a recent paper by Butler and Mulholland [142] there is a

Results and discussion of experimental work
67
compilation of published size distribution and particle yield data for flaming combustion of a number of different fuels.
The detailed characterisation of particle size distribution presented here: in a series of cone calorimeter tests (Paper VII), an enclosure test with a sofa (Paper VII), and a full-scale test with an automobile (Paper X), represents a significant contribution to our understanding of particle generation in fires. The analytical methods used, i.e.
impactor techniques, were described in Section 2.2.5.
Measured particle mass size distributions and number size distributions are shown graphically in Paper VII and Paper X. In order to graphically describe a distribution of particles varying strongly both in size, and concentration between different sizes, it is common to introduce logarithmic scales. Figure 3-26 which shows the particle mass size distribution for particle board tests in the cone calorimeter tests is shown as an example. The horizontal axis is the logarithm of the particle size (Di) and the vertical (mass) axis is normalized relative a logarithmic representation of the size range for each data point in the graph. The diagram actually represents a histogram and each point signifies a collection of particulate material for a specific size class.
0
5
10
15
20
25
0.01 0.1 1 10
Aerodynamic particle diameter (µm)
dm
/dlo
g(D
p)
(p
art
icle
s/N
m3 d
ry g
as
)
Figure 3-26 Particle Mass size distribution from multiple measurements with particle board in the cone calorimeter (Figure 6i, Paper VII).
To show the features and advantages of such a representation a general “step-by-step” example is given here. The most simple grapical representation of grouped particle data is a histogram where the width of each bar represents the size interval and the height represents the number of particles or mass of particles in that group. Data for one of the test with particle board in the cone calorimeter is shown in this form in Figure 3-27.
i There is an error in the unit for the vertical axis in Figure 6, Paper VII. The figure shows particle mass distribution and the unit shall be dm/dlog(Dp).

Emissions from Fires
68
0
5
10
15
20
25
30
0 2 4 6 8 10 12 14
Particle diameter (µm)
Rela
tiv
e m
as
s-d
istr
ibu
tio
n (
%)
dp
Figure 3-27 Histogram of relative mass distribution versus particle size.
The relative mass distribution is given on the vertical axis and the particle diameter on the horizontal axis. The different size intervals are limited by the cut-off size (D50%) of an impactor plate and that of the next plate with a higher D50% value. A disadvantage with this type of representation is that the figure gives a distorted picture of the distribution as the height of an interval is dependent on the width ( dp)of that interval, i.e., an increase in the width of the interval gives an increase in the height as more particles are collected in the interval. In order to prevent this distortion, the data can be normalised relative to the width of the interval. Figure 3-28 shows the data from the test with particle board, with each interval normalized by the interval width, ( dp).
The height of the bars in Figure 3-28 now represents the relative mass per unit of the size interval (relative mass/µm) and the area of each bar is now proportional to the relative mass found in that interval.

Results and discussion of experimental work
69
0
5
10
15
20
25
30
35
40
45
0 2 4 6 8 10 12 14
Particle diameter (µm)
No
rma
lized
re
l. m
as
s-d
istr
ibu
tio
n (
%/µ
m)
Figure 3-28 Histogram of normalized relative mass distribution versus particle size.
It is, however, impractical to present normalized particle data with strongly varying numbers for different intervals. Intervals with low numbers (here: relative mass/µm) are hardly distinguishable in such a representation, as can be seen from Figure 3-28. Instead it is common to normalize relative the interval width from the logarithms of the cut-off sizes, i.e., to normalize relative: dlog(dp) = log(D50%, stage j)- log(D50%, stage
j+1), where j represents an arbitrary collector plate.
0
5
10
15
20
25
30
0 2 4 6 8 10 12 14
Particle diameter (µm)
Lo
g n
orm
ali
zed
re
l. m
as
s-d
istr
ibu
tio
n (
%)
Figure 3-29 Histogram of log-normalized relative mass distribution versus particle size.

Emissions from Fires
70
Figure 3-29 shows the data log-normalized, and all classes are distinguishable, al-though the proportionality between bar area and relative mass is lost.
The wide range and skewed shape of most aerosol distributions (cf. e.g. Figure 3-29) makes them unsuitable for statistical description by the symmetrical normal distribution which is often used for other types of data. The lognormal distribution has (empirically) been found to better describe particle size data [68]. The data from Figure 3-29 is presented in Figure 3-30 with a logarithmic scale for the horizontal axis. Note the almost symmetrical representation of the data with a shape similar to that of a normal distribution. However, as an aerosol distribution often is not perfectly symmetrical it is common to characterise the distribution using the median value instead of the mean value, as extreme values in the tail have less effect on the median than on the mean [68]. The mass median aerodynamic diameter (MMAD) is shown for the distribution in Figure 3-30. Further, the geometric mean diameter (Di)for each interval (dashed lines) and the size of an interval ( dp) are also indicated. The magnitude value at Di for each interval is connected with a line in Figure 3-30 to refer back to the outline of Figure 3-26.
0
5
10
15
20
25
30
0.01 0.1 1 10 100
Particle diameter (µm) - logarithmic scale
Lo
g n
orm
ali
zed
re
l. m
as
s-d
istr
ibu
tio
n (
%)
MMAD
dp
Di
Figure 3-30 Histogram of log-normalized relative mass distribution versus particle size (on a logarithmic scale).
It was seen from the distribution data for a range of materials/products presented in Paper VII that the maximum in mass size distributions for many materials was often located around 0.3 µm and that the number size distributions had a maximum at the smallest detectable particle size (with the instrument used), i.e. at a Di of ~40 nm.
In order to compare our particle distribution data with the data compiled by Butler and Mulholland [142], the MMAD, as described by Hinds [68], has been calculated for some of the tests in Paper VII and for the automobile fire test in Paper X.

Results and discussion of experimental work
71
The data is presented in Figure 3-31 as particle yields versus mass median aerodynamic diameter (MMAD). The quantitative particle distribution results compiled by Butler and Mulholland consist of data from various sources and various fire sizes, but they are all from flaming combustion. From these data, only data from fires with solid fuels have been included in Figure 3-31; this includes fuels such as different types of wood materials and polymers.
0.0001
0.001
0.01
0.1
1
0.01 0.1 1 10
Aerodynamic diameter (µm)
Pa
rtic
le y
ield
(g
/g)
SP, Cone cal. flaming
SP, Cone cal. non-flaming
SP, Automobile fire
Butler et al., various flaming
SP Wood products
SP Polystyrene
SP Melamine
SP FR-4 laminate
Aerodynamic diam.
SP Sofa-enclosure test
SP Automobile fire
Wood, Butler et al.
Wood, Butler et al.
Polystyrene, Butler et al.
Figure 3-31 Smoke yield versus median aerodynamic diameter.
A trend, where the aerodynamic diameter increases with increasing smoke yield was observed by Butler and Mulholland. The new data (SP data) included in Figure 3-31 conforms nicely to that trend.
It can be seen from Figure 3-31 that the SP wood products (cf. Paper VII, table II) from the cone calorimeter tests produce low particle yields with a particle mass distribution with a small MMAD. This is in line with the “low end” group of wood data from Butler and Mulholland. Further, there are two additional data points for wood from Butler and Mulholland, the highest of these was from a large under-ventilated wood crib fire.
The SP data from flaming combustion with melamine and an FR-4 laminate (brominated laminate) are at the “high end” of the plot in Figure 3-31. Both of these products burn poorly due to their chemical composition, and especially the FR-4 laminate produced a very high particle yield. The data point for “SP polystyrene”

Emissions from Fires
72
show a high particle yield and a large MMAD. This product did not ignitei in the cone calorimeter test. The higher values compared to the data provided by Butler and Mulholland are therefore to be expected.
The trend with an increased MMAD with increased particle yield for the SP cone calorimeter tests should mainly be due to differences in the chemical composition of the materials, as the combustion in a standard cone calorimeter test is well-ventilated. Strongly oxygenated materials, such as wood, burn well whereas aromatic polymers, e.g. polystyrene, burn poorly and give a high soot yield [65]. The combustion conditions are also of importance for the particle yield, with higher yields obtained as the fire becomes less ventilated [65].
The data from the SP large-scale tests included in Figure 3-31 conforms well to the particle mass size distribution results seen from the SP cone calorimeter tests and the data from Butler and Mulholland. Both large-scale tests show an MMAD slightly above 0.4 µm, and the result from the automobile fire fits in nicely in the overall particle yield-MMAD trend. In the case of the SP Sofa-enclosure fire tests it was not possible to calculate a particle yield as the mass-loss from the sofa is unknown.
The particle number concentrations in the smoke gases from the automobile fire were measured continuously using the ELPI instrument. It was, therefore, possible to investigate the number size distribution and the mass size distribution at different times during this experiment. Figure 9, in Paper X, shows data from two different points in time in the 3rd phase of the automobile fire (the test when the entire vehicle was involved in the fire). At the first point in time, the fire was in the growing phase, and the maximum in particle number concentration for small particle sizes was found here. At the second point in time, the fire was at its peak, and here the maximum in particle mass concentration was found. The aerodynamic particle diameter was further generally larger at this time. This seems logical as the fire in its growing phase must have been rather well-ventilated, thereby producing many small particles. At the peak of the fire the combustion may have had an under-ventilated character, producing more products of incomplete combustion at a higher mass-loss rate. Such conditions can result in a higher particle yield and higher mean diameter.
One important question is whether the particle distribution data measured in the various fire test scenarios presented, provides a credible representation of real fire incident scenarios. The smoke gases are often sampled relatively close to the combustion zone, especially in a small-scale fire test such as the cone calorimeter, and the effect of subsequent agglomeration could be over-looked. The conformity in aerodynamic diameter of the large scale SP-data with that from the SP-cone calorimeter tests, however, gives some evidence that the cone calorimeter results are valid and useful.
Smoke ageing studies with smoke from crude oil fires have shown that smoke collected close to the combustion zone (2 m above the base of a pool fire) will agglomerate slowly when aged at a temperature of 100°C. The MMAD only increased from 0.8 µm to 1.1 µm during ageing for 90 min [144]. Further, Butler and Mulholland have concluded that “…there may not be a large change in the mass
i It is possible that the ”SP polystyrene” was a flame retarded product, or that no ignition occurred due to excessive shrinking.

Results and discussion of experimental work
73
median aerodynamic diameter as a result of coagulation for an enclosure fire from the time the smoke aerosol leaves the room of fire origin until it reaches another location. Thus if the initial size distribution indicates a large fraction of respirable particles, this will still be true for the aged particles some distance from the fire.”
Significantly, one should note that the data presented in this section of the thesis indisputably shows that a high proportion of the particles produced in fires are very small and highly respirable.

Emissions from Fires
74

Theoretical work and applications
75
4 Theoretical work and applications
4.1 Computational modelling of fires
4.1.1 Background
Computational modelling of fires can be an efficient tool to predict fire growth and smoke movement. Different computational techniques have been improved over the years, and many advanced computational models have emerged. At present, however, commercially used models have restrictions that limit their usefulness in many situations. Two of the most apparent limitations of present models are in the simulation of flame spread and the production of important toxic gases.
Zone and field modelling are the two main types of computational models used in fire simulations. Zone models emerged early in fire research, and the basic theory behind these models is relatively simple and computationally undemanding. In these models the computational domain is normally divided into an upper and a lower zone, and computational parameters are transported between and are averaged over these zones. Zone models, however, require some prior knowledge of the structure of the flow in a specific scenario and give low spatial resolution due to the averaging over the zones [145]. The concept of zone modelling has been described by, e.g.
Quintiere [146], and existing codes have been reviewed by Walton [147].
Field modelling, or CFDi modelling, is based on a more fundamental approach and gives a much more detailed representation of the computational domain. CFD is based on fundamental conservation laws for physical properties such as mass, momentum and energy. CFD modelling can theoretically provide a detailed fundamentally based description of all physical parameters of interest in a fire simulation. The numerical solution is, however, limited due to heavy computational costs which have led to the introduction of different types of assumptions and simplifications.
In CFD modelling the computational domain is divided into a large number of small often three-dimensional entities (cells) forming the computational grid. The transport processes between cells and the global conservation of physical parameters are maintained in an iterative mathematical process to reach a converged solution.
Conservation equations are solved for mass, momentum (the Navier-Stokes equations), internal energy, and in some cases chemical species. The conservation equations can be written in an illustrative form for a general variable Φ [148]:
( ) ( ) ( ) Φ+ΦΓ=Φ+∂
Φ∂Sgraddivudiv
tρρ ii (4.1)
(1) (2) (3) (4)
i CFD = Computational Fluid Dynamics ii div (divergence) and grad (gradient) are field operators used for short hand vector notation.

Emissions from Fires
76
ρ = density
t = time u = velocity (3-D vector) Γ = diffusion coefficient
ΦS = source term
The four parts (1-4) of the conservation equation (equation 4.1) have the following significances [148]:
(1) Rate of increase of Φ of fluid entity.
(2) Net rate of flow of Φ out of fluid entity.
(3) Rate of increase of Φ due to diffusion.
(4) Rate of increase of Φ due to sources.
Note that some terms are hidden within the source term in equation 4.1 to simplify the expression, in order to highlight the similarity between the conservation equations for the different physical parameters.
It is not the intention of the author to provide a full, or even partial, account of the mathematical background and quality of the conservation laws of fluid motion. Details can be found in text books on the subject, e.g., in the book by Versteeg & Malalasekera [148] from which equation 4.2 and the basic analysis of this equation was gratefully derived.
The source term ( ΦS ) in equation 4.1 is of particular importance, both regarding the
mathematical solution of the equations for momentum and for introducing chemical species into the computational domain, which will be seen below.
The modelling of combustion and flows in fires is a complicated and demanding task, requiring the mathematical modelling of non-premixed (diffusion) flame combustion in a strong turbulent field often dominated by natural buoyancy.
It is theoretically possible to solve the governing equations analytically for the turbulent flow field through direct numerical simulation (DNS). The fine resolution of the turbulent field is, however, an obstacle.
To get an impression of the resolution required to fully resolve the turbulent field one can compare the ratio between the largest and smallest turbulent length scales, i.e.
[41]:
430l
K
Rl
l≈ (4.2)
where lR is the turbulent Reynolds number, 0l is the largest length scale of the
system, and Kl is the size of the smallest turbulent eddies (the Kolmogorov length
scale). For a typical turbulent flow with 500=lR [41], the quotient of the two length
scales is ~100. Thus, to resolve the smallest turbulent eddies in three-dimensions, approximately (10×100)3 = 109 grid points are required. This set constraints on the

Theoretical work and applications
77
computational capacity required to conduct such calculations. Turbulence is further an inherently unsteady phenomenon and time-resolved computation is required. This, together with other constraints imply that the overall time for a DNS computation increases with the fourth power of the Reynolds number [41]. DNS computations are therefore only practically applicable for small domains with low Reynolds numbers.
In order to reduce the resolution of the computation, and thus the overall time for a simulation, different techniques have emerged to give an approximate solution of the Navier-Stokes equations. The most prominent of these techniques are: Large Eddy Simulation (LES) and Reynolds-averaged Navier-Stokes (RANS) simulations.
The turbulence characteristic that forms the basis for LES calculations is that small eddies contribute to a limited part of the total turbulent energy only. Large scale motions are solved exactly and approximation models are used to solve the small scale motions, without losing too much information concerning the total turbulent flow field. LES is by nature a three dimensional, unsteady flow, calculation tool. Computational costs are, however, generally much higher compared to RANS calc-ulations [145].
RANS calculation is the most frequent used type of CFD modelling tool in fire applications. In RANS field-models the Navier Stokes equations are averaged in order to solve time-mean flow variables. The flow field is thus averaged over time, which results in a smoothed flow field and loss of details in the turbulent flow pattern. Averaging the conservation equations, however, introduces a “closure problem” due to Reynolds stresses which appear as source terms in the momentum equations. Further appear turbulent fluxes as source terms in the scalar transport equation [148]. Turbulence modelling approaches are used to predict the Reynolds stresses and the scalar transport terms. The most widely used turbulence model is the k -ε turbulence modeli [41].
A RANS-model incorporating the k -ε turbulence model was used for the computational modelling discussed in Paper VIII and Section 4.1.2 below.
At this point the modelling of turbulent flows has been briefly introduced. The modelling of combustion in the largely non-premixed fire environment is important in reference to the results from computational modelling presented in this thesis. Combustion is incorporated into the CFD framework by a combustion sub-model that governs the development of species and enthalpy through the source terms of the respective conservation equation.
Non-premixed flames are often referred to as diffusion flames in recognition of the fact that the time for diffusion of fuel and oxygen towards the combustion zone is normally slow compared to the reaction rate of combustion. Hence, a simplifying approach is often taken in combustion modelling, i.e., it is assumed that chemical reactions take place infinitely fast.
The fast chemistry or “mixed is burnt” assumption is the basis [145] for the fast chemistry conserved scalar approach and the extension of this approach, the Eddy
i k is turbulent kinetic energy, and ε is the dissipation of the turbulent energy.

Emissions from Fires
78
Break-up model, which originates from the work of Spalding [149] and has since then been improved by Magnussen and Hjertager [150].
The mixing problem is greatly simplified by assuming that all components have equal diffusivity. It is further convenient to introduce a non-dimensional variable, the mixture fraction (ξ ), as a conserved scalar. To illustrate this, consider an infinitely
fast one-step reaction:
( ) Products1oxidantFuel1 kgvkgvkg +→+ (4.3)
A variable can be defined as: OxidantFuel YvY −=ψ (4.4)
where Y denotes mass fraction.
The mixture fraction is derived as:
21
2
ψψψψξ
−−
= (4.5)
where the indices 1 and 2 in equation 4.5 refer to fuel stream and oxidant stream, respectively. ξ will take the value of 0 in the oxidant stream and that of 1 in the fuel
stream, and values between this in the thin combustion sheet in a non-premixed laminar flame.
All scalar variables can actually be described as known functions of the mixture fraction only, in the simplified, fast chemistry, description of the problem [41]. As a consequence it is only necessary to solve one extra function for the combustion sub-model (a function ξ ).
The Eddy Break-up model requires an extra transport equation for the mass fraction of fuel. The rate of consumption of fuel is specified by local flow properties. In fact, the reaction rate is specified in term of the turbulence time scale, and is taken as the smallest of the turbulent dissipation rates (ε ) of fuel, oxygen and products [148]. The Eddy Break-up model is the most common combustion sub-model used in CFD modelling of fires, but it is limited by the fast chemistry approach and the inability to include detailed kinetics of combustion [145]. The quality of the predictions of the model further depend on the performance of the turbulence model [148].
An alternative approach of combustion modelling that allows the inclusion of detailed chemistry and finite rate chemical kinetics is the laminar flamelet approach[145] [151]. In this approach the turbulent diffusion flame is considered as a statistical ensemble of thin undisturbed laminar diffusion flames that are denoted flamelets. A laminar diffusion flame provides unique relationships for, e.g., chemical species and temperature, in terms of the mixture fraction (ξ ).
In order to include finite rate chemistry the rate of non-equilibrium chemical processes has to be considered. Such processes will depart further from equilibrium as mixing increases. The mixing rate between fuel and oxidizer can therefore

Theoretical work and applications
79
describe the departure from chemical equilibrium [41], using the scalar dissipation rate, χ :
( )22 ξχ gradD= (4.6)
The molecular diffusivity (which is assumed equal for all components) is denoted Din equation 4.6. The mixture fraction, ξ , was defined in equation 4.5.
An equation for, e.g., the mass-fraction (Yi) of species i (at temperature T) which includes the reaction rate ( iω ) can be derived [152] [145]:
2
2
2 ξχρωρ
∂∂
+=∂
∂ ii
i Y
t
Y (4.7)
It is, however, often assumed that the response time of the flamelets for changes in the local mixing environment is much faster compared to the global mixing time scale [145]. The Stationary Laminar Flamelet model is based on this assumption, which leads to a simplified flamelet equation:
iiY ω
ξχρ −=
∂∂
2
2
2 (4.8)
The flamelet equation is thus valid only at high Damköhler numbers, i.e. when fluid motion time scale is much longer than the characteristic reaction time. However, compared to the fast chemistry approach, the flamelet approach corresponds to real finite rate laminar flame kinetics [145].
The laminar flamelet approach actually gives a description of all scalars ( Φ denotes any scalar variable) as a function of the mixture fraction and the scalar dissipation rate, i.e.:
( )χξ ,Φ=Φ (4.9)
Scalar data for a laminar flame, according to equation 4.9, is therefore required. This data can be acquired from measurements on counter flow diffusion flames or from calculations.
By the assumption that the chemical reactions occur only in the thin flamelets, and that the chemistry is fast, the statistical uncertainties in a turbulent flow field can be decoupled from the chemistry, and the chemistry and turbulence can be calculated separately.
The (CFD) computational modelling discussed in Section 4.1.2 was conducted using a Stationary Laminar Flamelet model relying on data from calculations of chemical kinetics. The chemical kinetics was calculated at the Division of Combustion Physics at Lund University (see Paper VIII).

Emissions from Fires
80
The calculated flamelet data was included in a data base in the CFD model as pre-calculated scalar values. The mixture fraction is calculated by the flow model for each point in space. The scalar data is extracted from the flamelet library trough a probability density function (pre-described beta-function), which incorporates the statistical fluctuation of the mixture fraction in that point.
4.1.2 Modelling of HCN formation
Hydrogen cyanide, HCN, is an important asphyxiant gas in fires, about 35 times more toxic than carbon monoxide, CO (see Section 4.2.1). The influence of HCN on humans is quite difference from that of CO. HCN has a more direct effect, as it is carried rapidly to the brain by the blood, making the victim quickly incapacitated. Because of its high toxicity and fast effect, information on HCN production is important, e.g. in designing the evacuation routes from fires.
In investigations of the production and dispersion of HCN with fire-induced flows in buildings CFD has the potential to be a valuable tool. The alternative is large scale fire tests, which are very expensive, and it is further practically impossible to make detailed measurements of HCN in as many points as necessary to estimate the true dispersion pattern.
A chemical kinetic model for the prediction of HCN in fire induced flows has never before been incorporated into a CFD model. Paper VIII by Tuovinen and Blomqvist describes the first model of this kind and the results from simulations of nylon combustion within a large-scale enclosure.
Reaction mechanisms and assumptions
HCN can be formed in the combustion of any nitrogen-containing material. The nitrogen gas phase chemistry is, however, rather complex and sensitive to changes in the combustion environment, as was e.g. seen in the large-scale tests discussed in Section 3.1.1.
The nitrogen gas phase chemistry has been studied extensively. The interest in the nitrogen chemistry has arisen from the need to understand the mechanisms behind NOX pollutant formation. Earlier research by Fenimore [153] indicated that the conversion of organic nitrogen compounds to NOX was nearly independent of the parent molecule, and that local combustion conditions and the initial concentration of the nitrogen species were the dominant factors. Fenimore further speculated that an intermediate product was formed that could react to form either NO or N2 depending on the combustion conditions. Bowman [154] later proposed that for simple nitrogen containing fuels, a reasonable prediction of NOX formation could be achieved by using a global reaction step of fuel nitrogen HCN combined with the detailed HCN chemistry. HCN was thus discovered to be an intermediate product in NOX
formation from the combustion of nitrogen containing fuels.

Theoretical work and applications
81
With the postulates of Fenimore and Bowman as a background, the possibility to incorporate the gas phase chemistry of a generic nitrogen-containing fuel into a CFD model to predict HCN formation in fires was investigated in Paper VIII.
In order to model a fuel using CFD, its combustion characteristics must be well known. Further, the combustion of the fuel should be easy to control and vary. To have such properties the fuel should be in the gas phase. It is difficult, however, to find a nitrogen-containing fuel, relevant from a fire safety point of view, which is in gas phase at room temperature.
Therefore, a fictitious mixture of two fuels, ethylene and methylamine, was chosen as a generic model-fuel. A chemical kinetic model based on the stationary laminar flamelet concept described the combustion of this fuel. The original data base for the flamelet model included in the employed RANS-type CFD package SOFIE [155], contained information concerning the chemical kinetics of several thousand chemical reactions including that of hydrocarbons (C1-C4) [156] and NOX species [157, 158].
The methylamine (CH3NH2) oxidation mechanism included in this study as a sub-scheme to the flamelet data base, consists of 350 elementary reaction steps according to Kantak et al. [159]. The mechanism scheme includes e.g. H-atom abstraction, C-N bond scission and the formation of HCN and NH3. It has been shown that pathways leading to the formation of HCN are usually preceded by H-abstractions starting from methylamine, in where H2CNH is an important intermediate species [159]:
CH3NH2 intermediate smaller intermediate HCN (4.10)
The burning of nylon within an enclosure was simulated with the new model using the generic model-fuel, with proportions of ethylene and methylamine giving a content of nitrogen equivalent to that of nylon. The nylon experiments simulated were the tests discussed in Section 3.1.1.
To quantitatively compare the results of the nylon experiments with those of the simulation with the model-fuel one has to make the assumption that the pyrolysis chemistry of nylon gives the same types and proportions of breakdown products as those described by the reaction mechanism for methylamine. Such an assumption would of course not be entirely true, but based on the postulates (Fenimore, Bowman) given above, results with some significance were thought to be attainable with the proposed approach.
However, with more knowledge of the pyrolysis chemistry of nylon one would be able to make a better assessment of the justification of using methylamine as a model fuel in this case. Studying the structure of the polymer chain of nylon-6,6 (Figure 4-1) one can predict that during thermal decomposition the initial products would be a mixture of low-molecular-weight fragments, some containing nitrogen.

Emissions from Fires
82
C
O
CH2 CH2 CH2 CH2 C NH
O
CH2 CH2 CH2 CH2 CH2 CH2 NH( )n
Nylon-6,6
Figure 4-1 Structure formula of nylon-6,6.
It has been shown that the thermal decomposition of various nylons begins with a
primary scission of an –NH.CH2– bond to form amides and is followed by a complex series of secondary reactions [160]. Nitriles can, e.g., be subsequently formed from these amides through high temperature dehydration [161]. Other researchers [162]have, however, postulated that in the pyrolysis of nylon-6,6, substituted cyclo-
pentanone groups are formed by –NH.CO– bond scission and ring closure. This final decomposition route would therefore lead to the formation of NH-R fragments that would fit into the reaction scheme of methylamine (where H2CNH is important). One can conclude that the thermal decomposition and subsequent reaction chemistry of nylon is complex, but to fully investigate this topic has not been included in the present work.

Theoretical work and applications
83
Calculated flamelets
The flamelets were pre-calculated for the combustion of the model fuel in pure air and in cold/hot re-circulated vitiated air (i.e. air including the main combustion products, H2O and CO2). The effects of radiation and the strain rate were further included. The pre-calculated flamelet library is schematically outlined in Figure 4-2.
Ethylene
+
Methylamine
Hot vitiation
Cold vitiation
Vit 0.60
Vit 0.50
Vit 0.40
Vit 0.30
Vit 0.20
Vit 0.15
Vit 0.10
Vit 0.05
No vitiation
Vit 0.60
Vit 0.50
Vit 0.40
Vit 0.30
Vit 0.20
Vit 0.15
Vit 0.10
Vit 0.05
No vitiation
Vit 0.30
Vit 0.40
Vit 0.20
No radiation
Rad 1%
Rad 2%
Rad 30%
Rad 29%
No strain
Low strain rate
High strain rate
Extinction
Increasing
strain
rate
Increasing
radiation
Figure 4-2 Flamelet library structure for vitiated and non-vitiated air, for the model fuel. Each vitiation level has 30 different sets of flamelets for each radiation-loss level, and further for each radiation level there are about 30 individual sets of flamelets for varying strain rates [163].
The model was run with single values for vitiation and strain rate in the whole calculation domain at any given time, and not with individual values of these parameters for each control volume. Allowing the use of a unique description of these parameters in each control volume necessitates two additional dimensions in

Emissions from Fires
84
the flamelet data base, which leads to much more computer storage and correspondingly greater computation times. For the calculation of radiative losses, however, interpolation between flamelet sets with varying radiative losses were applied.
The effects on scalars (species and temperature) in the mixture fraction space were analysed in Paper VIII for some selected flamelet assumptions. However, only the effects of cold vitiation and variations in radiative losses were analysed. A systematic analysis of all possible variations of flamelet assumptions would have been desirable, but was not included in the frame of the project.
The analysis made is described in detail in Paper VIII, but some interesting observations regarding HCN are highlighted here. In Figure 4-3 the effects from: (a) variation in vitiation, and (b) variation in radiative losses, on the occurrence of HCN are shown.
0
0.0005
0.001
0.0015
0.002
0.0025
0 0.02 0.04 0.06 0.08 0.1
Vit-00Vit-05Vit-10Vit-15Vit-20Vit-30Vit-40Vit-50
HC
N m
ole
fra
ction
Mixture fraction
Sto
ich
iom
etr
y
0
0.0005
0.001
0.0015
0.002
0.0025
0 0.02 0.04 0.06 0.08 0.1
rad-00rad-05rad-10rad-15rad-20rad-25rad-30
HC
N m
ole
fra
ctio
n
Mixture fraction
Sto
ich
iom
etr
y
(a) (b)
Figure 4-3 (a) Flamelet data for HCN with varying degrees of (cold) vitiation; no radiation losses.(b) Flamelet data for HCN with varying degrees of radiation losses; no vitiation.
For the non-vitiated case in Figure 4-3 (a) it can be seen that HCN is not produced at all under stoichiometric conditions; only a fuel-rich mixture would yield HCN in this case. However, with increased vitiation, HCN is produced at considerably lower values of mixture fraction.
The combustion temperature is lowered considerably by taking radiative heat losses into account. This has a distinct effect on the production of HCN, which is increased in the mixture-fraction range around stoichiometric conditions with the inclusion of radiative losses, as shown in Figure 4-3 (b).

Theoretical work and applications
85
Results of model validation and conclusions
Two of the tests with nylon combusted within an enclosure, that were presented in Paper I and discussed in Section 3.1.1, were simulated as a first validation of the generic nitrogen-fuel flamelet model.
The results of these simulations were generally promising. The simulations confirmed that there was a large difference in the predicted species concentrations when using different flamelet options. A non-vitiated assumption produced lower concentrations of both CO and HCN, compared to a vitiated assumption. In part-icular, the HCN concentration was nearly 10 times lower for the first assumption. The vitiated option proved to be more correct relative to the measurements in the nylon tests. It was found, that when simulating a certain fire scenario, one must take into account whether the air in the entrainment region of the fire is vitiated or not.
The main results from this validation study were:
- The results from the simulations showed that the flamelet model was able to semi-quantitatively predict the production of HCN in a room fire.
- Both the production during well ventilated conditions, and the increased production during under-ventilated conditions were accurately captured by the model.
There are, however, some inherent weaknesses in the model:
- The flamelets are based on the chemistry of gas-phase methylamine mixed with ethylene, i.e. on the reaction kinetics of a generic model-fuel with the inherent disadvantages of such an approach.
- The heat of combustion of the model-fuel will most often deviate from that of the actual fuel. This implies a discrepancy in the fuel mass-loss rate, or alternatively HRR, between the simulation and the actual fire.
- The flamelet model assumes fast chemistry and therefore describes the flaming region best.
However, although the validation study showed some weaknesses in the applicationof the model-fuel for a solid fuel, and in some of the assumptions of the model, the results of the simulations were encouraging, proving that the flamelet model is capable of semi-quantitative predictions of HCN formation.

Emissions from Fires
86
4.2 Human incapacitation in fires
4.2.1 Toxicity of fire gases
The toxic gases produced from a fire are normally categorized into one of two groups based on the effects on human. These two groups are asphyxiant gases and irritant gases. There are additional types of toxic compounds that can be present in fire gases as seen in Section 3.2, e.g. PAHs and halogenated dioxins. These types of compounds have, however, a more long-term effect on human, and are not considered to be critical to the tenability of a fire atmosphere.
The asphyxianti gases, also referred to as narcotic gases, cause confusion and loss of consciousness followed by death from hypoxiaii when a sufficient dose has been inhaled [2]. The most important gases belonging to this group are carbon monoxide (CO) and hydrogen cyanide (HCN), however; also carbon dioxide (CO2) and oxygen (O2) are included in this group.
The irritant gases have a direct effect in that they cause sensory irritation to the eyes, nose and upper respiratory system. For sensory irritation the effects do not depend on the dose but occurs immediately, i.e. the effects are largely concentration related. In large doses, however, these gases can cause lung inflammation and oedema, which might result in death some time after exposure. Irritant gases include inorganic acid gases, e.g. hydrogen chloride (HCl), and organic irritants, e.g. aldehydes.
Critical concentrations or doses for human are not straightforward to determine, and the data found in the literature is in most cases, from tests on animals and is only partially applicable to humans. Animal toxicity data is normally expressed as LC50-values, i.e., the concentration which gives a mortality of 50 % for a specific time of exposure (normally 30 min) and a certain post-exposure period.
Of the asphyxiant gases, CO and HCN have an adverse effect in that these gases prevent the uptake and transportation of oxygen in the body. The toxicity of CO lies in that it combines with haemoglobin in the blood to form carboxyhaemoglobin (COHb) [164]. The mode of action of HCN is different to that of CO, which has the consequence that HCN does not follow Haber’s ruleiii, and very low concentrations are required to prompt a toxic reaction. HCN acts by producing intracellular hypoxic poisoning through inhibition of the cellular oxidative processes [165].
The effects from CO2 and a low-O2 are hypoxia. CO2 further increase the breathing rate and thereby increases the uptake of other toxic compounds. The effects from CO2 and a low-O2 are partly concentration related and partly dose related [2].
i Asphyxia: Suffocation, decrease in the oxygen content, and increase in the carbon dioxide content of the blood. ii Hypoxia: Reduction in the amount of oxygen available for tissue respiration. iii Haber’s rule: The principle that toxicity in inhalation toxicology depends on the dose available and that the product of concentration and exposure time is a constant.

Theoretical work and applications
87
Limiting values and rodent 30-min LC50-values are given for the asphyxiant gases in Table 4-1. Further, the tenability limits for these gases and reduced oxygen concen-tration are shown in Table 4-2.
Table 4-1 Limiting values and lethal concentrations from animal tests for asphyxiant gases.
Compound OELa, 15 min [166]
IDLH b
[89]LC50, 30-min, Rats [167]
CO 100 ppm 1200 ppm 5700 ppm
HCN 4.5 ppm 50 ppm 165 ppm
CO2 1 % 4 % -
aOEL: Swedish occupational exposure limits.
bIDLH: Immediate Dangerous to Life or Health Concentrations (NIOSH), generally based on 30 min
exposure.
Table 4-2 Tenability limits for asphyxiant gases as reported in ISO/TR 9122-1 [44].
5 min 30 min Compound
Incapacitation Death Incapacitation Death
CO 6000 – 8000 ppm 12000 – 16000 ppm 1400 – 1700 ppm 2500 – 4000 ppm
HCN 150 – 200 ppm 250 – 400 ppm 90 –120 ppm 170 – 230 ppm
Low O2 10 – 13 % < 5 % < 12 % 6 – 7 %
CO2 7 – 8 % > 10 % 6 – 7 % > 9 %
Data on the effects of the most important inorganic irritants and organic irritants are shown in Table 4-3 and Table 4-4, respectively. Specific to irritant gases is that two different effects need to be considered from a fire safety point of view: firstly, irritancy that may delay escape and, secondly, various physical effects that may lead to death. The RD50-values reported below refer to the concentration level that led to a decreased rate of respiration of test animals, i.e., when irritancy hindered normal breathing. Concentration levels giving severe irritancy for humans are further reported in the tables.

Emissions from Fires
88
Table 4-3 Irritant inorganic gases: limiting values, irritant and lethal concentrations from animal tests, and sensory irritancy for humans.
Compound OEL, 15 min (ppm) [166]
IDLH(ppm) [89]
LC50, 30-min, Mammal (ppm) [2]
RD50,Mouse
(ppm) [2]
Severe sensory irritancy in humans (ppm) [2]
SO2 5 100 300-500 117 50-100
NH3 50 300 1400-8000 303 700-1700
HF 2 30 900-3600 - 120
HCl 5 100 1600-6000 309 100
HBr 2 50 1600-6000 - 100
NO 50 100 - - -
NO2 5 20 60-250 349 80
Table 4-4 Irritant organic gases: limiting values, irritant and lethal concentrations from animal tests, and sensory irritancy for humans.
Compound OEL, 15 min
(ppm) [166]
IDLH
(ppm) [89]
LC50, 30-min, Mammal (ppm) [2]
RD50,Mouse
(ppm) [2]
Severe sensory irritancy in humans (ppm) [2]
Toluenediisocyanate (TDI)
0.005 2.5 100 0.2 1.0
Acrolein 0.3 2 140-170 1.7 1-6
Formaldehyde 1 20 700-800 3.1 5-10
Acrylonitrile 6 85 4000-4600 - > 20
Phenol 2 250 400-700 - > 50
Styrene 50 700 10000-80000 980 > 700
4.2.2 Models for exposure predictions
Several elements are of importance in a model for the exposure of humans to fire conditions. The main factors influencing people, that have an impact on evacuation behaviour, are the doses received of asphyxiant gases, concentrations of irritants, obscuration of sight by smoke and burns from radiative and convective heat. Although it can be difficult to make valid assessments of the last two factors, the modelling of the effects of the toxic gases has created the most challenges and a number of models of varying complexity have been presented.
Common for most models is the expression of the size of a hazardous component relative to the size known to cause a particular negative effect from a given time of exposure (dose), or in some cases for a given instant exposure (concentration). The

Theoretical work and applications
89
Fractional Effective Dose (FED) of a gaseous asphyxiant i can exemplify this basic concept. In calculating the FED for a specific toxicant the Ct products (concentration × time = dose) for small periods of time during the exposure are divided by the Ct
products causing the toxic effect (equation 4.11). The fractional effective doses are then summed during the exposure until the fraction reaches unity, which gives the predicted time of exposure for the toxic effect. The FED for a number of toxicants can be summed together to give the total FED for the exposure (equation 4.12).
deathortionincapacitacausetodosetCeffective
tCttimeatrecieveddoseFED
i
i
i
)(= (4.11)
( )= ⋅=
n
i
t
t
i
idt
tC
CFED
10
(4.12)
There are two main types of model available based on the FED concept: models based on small-scale test data which are related to animal lethality data, and models based on the incapacitation of humans.
Models based on small-scale test and animal exposure data
One example is the “N-gas Model” (equation 4.13) that was developed at NIST [168, 169] in order to avoid unnecessary animal testing. Additional information on this type of models can be found in ISO 13344 [167] and in ISO TR 9122-5 [170].
[ ][ ]
[ ] [ ] [ ] [ ]
HBrHClHCNO LC
HBr
LC
HCl
LC
HCN
LC
O
bCO
COmFED
,50,50,50,50
2
2 221
21+++
−
−+
−= (4.13)
The first term in the equation 4.13 describes the effects of CO2 on the toxicity of CO. The second term is included to take into account the effects for hypoxia.

Emissions from Fires
90
The original application of a calculated FED value from gas measurements in small-scale tests was to determine the lethal toxic potency of the fire effluents from a material. In order to do that, the predicted 30-min LC50 for the test specimen is calculated according to equation 4.14, where m is the specimen mass in grams and Vis the total air volume in cubic metres. Thus, the resulting predicted LC50 has the
units of grams per cubic metres and is a ‘property’ of the tested material.
VFED
mLC
×=50 (4.14)
These types of models are based upon data for rats and are particularly useful for predicting the lethality (for rats) of a chemically analysed fire atmosphere in small-scale tests. The predicted LC50 can be used for toxicity ranking of materials or in simple mass-loss models [171] [170] for estimating the toxic hazard in a fire.
However, according to ISO/TR 9122-5, these types of models (i.e. models based on rodent data) could further be used to make some predictions about the possible human lethal exposure hazard in large-scale fires where measurements of the major toxicant concentrations have been made. This naturally implies that the lethal exposure doses in rats are similar to those of human, which is considered to be approximately the case.
Thus, as long as FED in equation 4.13 is < 1 the prediction is that the death of a human being exposed to a fire atmosphere is prevented. However, in the context of tenability, the question is not how long death is prevented, but how long a human being will be capable of escaping from the fire environment through their own action. NIST [172] recommended deriving a hypothetical incapacitation level by reducing the LC50 values by a factor of 2 - 4. That is, persons will be capable of escaping from the fire as long as FED < 0.25 - 0.5.
Human incapacitation models
Human incapacitation models predict fire hazards in terms of exposure doses and time to incapacitation for human in fires and are intended for use in fire engineering calculations of modelled fires and full-scale fire tests. Human incapacitation models are based on actual physiological uptake functions and the effects of the major toxic fire gases. The equations for the models are derived primarily from experimental data obtained with human and primates.
A complete model describes the effects expected on the ability to escape from a fire, from: asphyxiant toxicants, sensory irritants, heat and visual obscuration. Each of these contributions is normally treated as acting independently although some interactions are known to occur. For example, the effects of sensory irritants on the eyes are to some extent additive with smoke obscuration resulting in additional disorientation. This synergistic effect is not taken into account in existing models.
A complete model has been proposed by Purser. Detailed information on this model can be found in the SFPE Handbook of Fire Protection Engineering [2]. A somewhat

Theoretical work and applications
91
simplified gas model, and a more detailed model for heat, can be found in ISO/TS 13571:2002 [171].
The asphyxiant gas (FED) model by Purser, and the heat model from ISO/TS 13571:2002, were used for the calculations of time to incapacitation in tunnel fires, which are discussed in Section 4.2.3.
In the model by Purser the interaction between asphyxiant gases is considered using the assumptions listed below.
1. CO and HCN are considered to be directly additive.
2. CO2 increase the uptake of CO and HCN in its proportion of effect on breathing rate.
3. The narcotic effect of low oxygen is considered to be directly additive to the effects from CO and HCN.
4. The narcotic effect of CO2 is considered to act independently of the effect of the other gases.
The detailed equations for calculating fractional incapacitating (FI) doses for the individual asphyxiant gases are not given here as they can be found elsewhere [2].
The total fractional incapacitation dose for asphyxiant gases is expressed by the following equation:
( )[ ]222
orTotal COOCOHCNCOsAsphyxiant FIFIvFIFIFI +×+= (4.15)
where2COν is a multiplicative factor for the increase of uptake of CO and HCN from
the effect of CO2 on breathing rate.
It is difficult to develop a predictive model for irritant gases according to Purser [2]. The reasons are summarized as:
1. Sensory irritation is concentration related, does not have a clear endpoint and is not lethal except under extreme conditions.
2. Lung inflammation is dose related and causes minor effects only until near lethal levels. The main predictable endpoint is death, which normally occurs several hours after exposure.
3. The identity and number of irritants in the smoke are often unknown.
4. The concentration/time/dose effects of irritants and the degree of interaction between different irritants are unknown.
Purser proposes two alternative approximate models to predict the effects from irritants [2]. First, a simple empirical model where the effects of smoke on animals from small-scale tests are used as a basis, and secondly, a model based on fire gas profiles in terms of known irritant gases.

Emissions from Fires
92
In the first type of model using small-scale test data, the concentration of irritants is represented as the mass concentration of burnt fuel in the smoke gases (i.e. mass lost in small-scale test per litre of diluent air). The second model is based on the concept of fractional irritant concentrations (FIC), see equation 4.16, and accounts for the combined effect from specific irritant components. FICs for each component are calculated as a fraction of the concentration considered being severely irritant.
organicsNOSOHFHBrHClirr FICFICFICFICFICFICFIC +++++=22
(4.16)
In a similar approach as that taken for the narcotic gases, the dose related lethal lung damage from the irritant gases is taken into account as a fractional lethal dose (FLD):
organicsNOSOHFHBrHClirr FLDFLDFLDFLDFLDFLDFLD +++++=22
(4.17)
Body surface burns and hyperthermia are the main causes for incapacitation by heat.The criteria used in modelling are the point where exposure of skin becomes painful, and the point where hyperthermia is sufficient to cause mental deterioration and threaten survival. The most important sources of heat in a fire environment are the radiant heat from the fire and the convected heat from fire gases.
It has been shown that there is an obvious cut-off point for the effect of radiant heat at a heat flux of 2.5 kW/m2 [2]. Below this limit exposure can be tolerated for 30 minutes or longer without significantly affecting the time available for escape, according to ISO/TS 13571:2002 [171]. Above this threshold value, the time to burning of skin decreases rapidly and can be calculated according to equation 4.18.
35.14 −= qtIrad (4.18)
Convected heat is treated as if the fire victim is receiving a dose of heat during the time of exposure, in the same way as for the narcotic gases. Thermal tolerance data for unprotected skin shows a limit of approximately 120°C for convected heat. Above this temperature the victim feels considerable pain and will suffer from burns. ISO/TS 13571:2002 [171] provides equations for convected heat: both for a fully clothed person (eq. 4.19), and for an unclothed or lightly clothed person (eq. 4.20).
Fully clothed: ( ) 61.38101.4 −×= Tt convI (4.19)
Unclothed or lightly clothed: ( ) 4.37105 −×= Tt convI (4.20)
According to ISO/TS 13571:2002 [171], a methodology based on additive FEDs may be applied for the effects from heat. A requirement is that the temperature of the fire is stable or increasing. The total fractional effective dose of heat can be calculated according to equation 4.21. Note that when the radiant flux to the skin is below 2.5 kW/m2, the first term in eq. 4.21 is to be set to zero.

Theoretical work and applications
93
( )∆+=2
1
/1/1t
t
IconvIradheat tttFI (4.21)
The smoke gases from a fire contain particles, resulting in visual obscuration that may impair the ability of victims to escape from the fire. The obscuration effect from particles is concentration-related and does not increase with prolonged exposure.
Limits of visual obscuration for evacuation have been proposed. Jin [173] has ,e.g.,proposed tenability limits of an extinction coefficient (K) equal to 0.15/m for subjects unfamiliar with an escape route, and 0.5/m for subjects familiar with the escape route. These numbers would approximately correspond with visibility limits of 20 m and 6 m, respectively (calculated for data on light-reflecting signs, see Section 2.2.4). Babrauskas [174], on the other hand, proposes a tenability limit corresponding to an extinction coefficient of 1.2/m, which would correspond to a visibility limit of 2.5 m. A model based on the concept of minimum detectable contrast can further be found in ISO 13571:2002 [171].
4.2.3 Incapacitation from toxic gases in tunnel fires
The results from a series of large-scale tunnel fire tests are used in this section of the thesis to exemplify the application of the FED-concept in assessments of the time to incapacitation in fires. The fire tests were conducted in the Runehamar tunnel in Norway in 2003, and were first reported at the International Symposium on Catastrophic Tunnel Fires, held in Borås in the end of 2003 [175]. Since then, Lönnermark and Ingason have published detailed accounts on the temperatures [176] and heat release rates [177], respectively, measured in the test series.
The calculations presented in this thesis are the basis for an article in work, presenting the gas measurement from the Runehamar tests, and the implication on human safety as assessed using the human incapacitation models given in Section 4.2.2. This new article is written by Lönnermark and the author of this thesis.
The Runehamar tests were run with a mock-up of a Heavy Goods Vehicle (HGV) trailer as the fire load. Four tests were run, which are described in Table 4-5. The data in the table was extracted from [176] and [177]. The mass-ratios of cellulose and plastics in the fuel load were approximately 82 %, and 18 %, respectively, in all four tests. In test T3, 800 kg of rubber tyres was added, which increased the total amount of plastic in the total fuel load of that particular test.

Emissions from Fires
94
Table 4-5 Data on the Runehamar large-scale tunnel fire tests.
Test id Description [176] Total mass (kg) [176]
Peak HRR (MW) [177]
Time from ignition to peak HRR (min) [177]
T1 Wood pallets and plastic (PE) pallets
11010 202 18.5
T2 Wood pallets and mattresses (PUR)
6920 157 14.1
T3 Furniture, fixtures + rubber tyres 7750 + 800 119 10.0
T4 Plastic cups (PS) in cardboard boxes on wood pallets
2850 66 7.4
The Runehamar tunnel has a length of 1600 m, a height of 6 m, and a width of 9 m. The HGV mock-up was placed 563 m from the west entrance, and there was an initial (forced) longitudinal ventilation flow of ~3 m/s in the east-to-west direction. More details are given in [176].
The measurement station equipped for the most detailed characterisation of the fire effluents was situated 105 m from the west entrance, i.e. 458 m from the fire source. Measurements were made at different heights in the tunnel at this station, and included: temperatures, velocities, O2, CO2, CO and HCN. Only at the height of 2.9 m from the tunnel floor all parameters were measured.
The measurements made at the height of 2.9 m from the tunnel floor were used for calculating FED of asphyxiant gases and heat. It would have been advantageous if data from a lower height had been available, which more would have represented the real exposure for a person standing on the tunnel floor. The fire effluents were, however, quite well mixed in the tunnel volume at the measuring station (458 m from the fire source), and it is reasonable to assume that not a too large error is introduced.
The effects from asphyxiant gases, on a person exposed to the fire effluents at the position 458 m from the fire source, have been estimated for test T1-T4 according to the model of Purser (see Section 4.2.2). The resulting FED for incapacitating (FI) acquired during the course of the fires are given in Figure 4-4, where the time scale starts from the time of ignition of the HGV mock-up.
The total FI from all asphyxiants, which was calculated according to equation 4.15, is shown in Figure 4-4. The total FI, excluding the effects from HCN, and the individual FI from: CO (CO*VCO2), O2 and CO2, are further shown.
A value of unity of FI is the point at where incapacitation is predicted. However, to allow safe escape for nearly all individuals exposed to asphyxiant gases, including susceptible individuals, a safety factor of 0.1 is proposed by Purser [2].

Theoretical work and applications
95
0
0.5
1
1.5
0 5 10 15 20
T1
O2
CO*VCO2
Asphynxiants
Asph. (excl HCN)
CO2
FI [-
]
Time [min]
0
0.5
1
1.5
0 5 10 15 20
T2
O2
CO*VCO2
Asphynxiants
Asp (excl HCN)
CO2
FI [-
]
Time [min]
0
0.5
1
1.5
0 5 10 15 20
T3
O2
CO*VCO2
Asphynxiants
Asphyxiants (excl HCN)
CO2
FI [-
]
Time [min]
0
0.5
1
1.5
0 5 10 15 20
T4
O2
CO*VCO2
Asphynxiants
Asphyxiants (excl HCN)
CO2
FI [-
]
Time [min]
Figure 4-4 Fraction of an incapacitation dose for asphyxiant gases analysed during the four tests in the Runehamar tunnel
In test T1 and T2, the conditions in the tunnel at the position 458 m from the fire source, become incapacitating from the effects of asphyxiant gases only a few minutes after ignition, as can be seen from Figure 4-4. The contribution to the asphyxiant effect from HCN decreases the time for incapacitation with approx-imately 5 minutes in both of these tests. Note that a person remaining at that position in the tunnel would have been incapacitated long before the fire had reached its peak (cf. Table 4-5).
The conditions were not as severe in tests T3 and T4, which gave lower peak HRR. The effects of asphyxiant gases were, however, significant for both tests. The value of FI for safe escape (FI = 0.1), was exceeded before 10 minutes after ignition in both tests.

Emissions from Fires
96
0
0.5
1
1.5
0 5 10 15 20 25 30
T1
Conv,L
Conv,F
Asphyxiants
Asph. (excl HCN)
FI [-
]
Time [min]
0
0.5
1
1.5
0 5 10 15 20 25 30
T2
Conv,L
Conv,F
Asphyxiants
Asph. (excl HCN)
FI [-
]
Time [min]
0
0.5
1
1.5
0 5 10 15 20 25 30
T3
Conv,L
Conv,F
Asphyxiants
Asphyxiants (excl HCN)
FI [-
]
Time [min]
0
0.5
1
1.5
0 5 10 15 20 25 30
T4
Conv,L
Conv,F
Asphyxiants
Asphyxiants (excl HCN)
FI [-
]
Time [min]
Figure 4-5 Fraction of an incapacitation dose for convective heat exposure compared with asphyxiant gases for the four tests in the Runehamar tunnel.
The incapacitating effect from convective heat is compared with the effect from asphyxiant gases in Figure 4-5. The incapacitating effects from convective heat for a fully clothed person (Conv, F), and for a lightly clothed person (Conv, L), are included. As the radiant heat flux never exceeded 2.5 W/m2 at this position in the tunnel, the effect from radiant heat for incapacitation was zero.
It is clear from Figure 4-5 that in all tests the incapacitation from asphyxiant gases became important before the effects from convective heat came into effect. In tests T3 and T4, however, the incapacitating effect of convective heat (for a lightly clothed person) passed that of the asphyxiants in magnitude, at a later time in the tests.
It was shown in this example of an application of FED-models, how the effect of fire gases can be assessed by using dedicated human incapacitation models. It was further clear from the application on tunnel fires, that asphyxiant fire gases can give a rapid and devastating effect on people present in a tunnel during a fire incident.

Theoretical work and applications
97
4.3 Emissions to the environment
4.3.1 Background
It was shown in Section 3 of this thesis that fires produce a mix of various combustion products with in many cases high concentrations of persistent pollutants. Fires contribute therefore to the anthropogenic emissions of pollutants to the environment.
Persson et al. [178, 179] have previously made an estimate of the emissions from fires into the atmosphere a typical year in Sweden. The work was commissioned by the Swedish Rescue Services Agency (SRV) and was implemented in 1995 using 1994 as a model year. Their work focussed on the emissions of carbon monoxide (CO), carbon dioxide (CO2), nitrogen oxides (NOX) and sulfur dioxide (SO2). They concluded that while large amounts of these species are emitted from fires each year, fires represent a minor source of these emissions with the majority coming from controlled combustion. They further proposed that fires potentially represent a major source of some environmentally important species, such as PAH, dioxins and furans. At the time of their study, however, very little information was available to corroborate this hypothesis.
The contribution from fires to the total emissions of dioxins has, since this initial work, been studied by several authors. Carroll has estimated the emissions of dioxins from PVC [126, 180] and wood [126] in house fires in the US. His conclusion was that the dioxin emissions from these materials in house fires only made a small contribution to the total emission. Thomas and Spiro [125] estimated the emissions from forest fires in the US to be significant but only a small fraction to the total. Dyke et al. [181] estimated that the emission of dioxins from fires may be one of the more important from non-industrial processes and should be studied further. In national inventories of dioxin emissions the contributions from accidental fires are alternatively not estimated at all or commented as being impaired with a high uncertainty due to lack of reliable data [182]. In the Swedish estimates for 1990 [182], 1993 [182] and 2004 [124], the only source from accidental fires included is that from landfill fires.
In 2001, a new project was commissioned by SRV aiming at estimating the emissions of VOC, PAH and dioxins from fires. In this work, 1999 was used as the model year. The results from this new estimate were reported by Blomqvist et al.
[183] and are the basis for Paper IX.
4.3.2 Estimate of total emissions to the atmosphere
The estimate of the total amounts of PCDD/F, PAH and VOC from fires during 1999 was made by combining the amounts of materials involved in building fires and fires in specific objects, with emission factors for these materials and with specific emission factors for the objects. The data on the amount of combusted material in fires was assessed from fire statistics and information from insurance companies. Emission factors were estimated from information available in the literature,

Emissions from Fires
98
although this information was limited in many cases. Details of how the total amounts of combusted materials and the emission factors were estimated can be found in Paper IX.
The estimates of the total emissions of PCDD/F, PAH and VOC from fires in Sweden during 1999 are given in Table 4-6.
Table 4-6 Estimate of total emissions (max/min limits).
Source PCDD/F(mg TEQ)
PAH(tons)
VOC(tons)
Dwellings 9/210 1.3/4.8 4.7/65
General building 2/60 0.2/1.0 1.6/17
Industry buildings 3/30 0.3/1.7 2.2/30
Other buildings 4/8 0.2/1.8 1.8/35
Forest fires ~5 0.3/2.6 2.6/52
Garbage cans, containers
210/870 0.006/0.02 0.5/1.0
Vehicles, trains ~220 ~0.1 -
Sum 500/1400 mg 2/12 tons 13/200 tons
The emission estimates in Table 4-6 are in several cases given as rather broad ranges reflecting the uncertainty in the data concerning emission of these species. There is an inherent uncertainty in the emission factors for the various material involved in the fires due to the possible variations in combustion conditions. This uncertainty is further compounded by the added uncertainty of the fire statistics due to a lack of detailed information concerning the amount of material involved in the various fires.
The estimates showed, however, that the majority of dioxin emissions were from fires in objects such as garbage cans, containers and vehicles, i.e. not from fires in buildings. A large source of PAH and VOC, however, was fires in buildings. Forest fires were another large source of PAH and VOC.
To assess the significance of the emissions from fires one must compare with data of emissions from other sources. For dioxins this type of information is available. An inventory of dioxin emissions in Sweden (1993) showed that the total emission of dioxins to the air was between 23 and 93 g TEQ [182]. The only fire related emissi-ons included in this inventory were from fires in municipal waste dumps (3-30 g). Emissions from other sources were e.g.: 0.2-1 g TEQ from traffic and 3 g TEQ from municipal waste combustion. Thus, the 0.5-1.4 g estimated in Table 4-6 reveals that emissions of dioxins from fires is a significant source, in the same range as the emission from traffic and municipal waste combustion. Note that there were no fires in waste dumps reported in the statistics for 1999.
The Swedish Environmental Protection Agency (Naturvårdsverket) has recently published a dioxin inventory for the year 2004 [124]. This inventory estimates the total air dioxin emission to be between 33 and 105 g TEQ. The estimate for

Theoretical work and applications
99
municipal waste combustion is only 1.1 g TEQ for 2004, while the figure for fires in waste dumps is estimated to be 0.4-65 g TEQ, i.e., the estimate of the total emissions has not changed significantly, whereas that for waste combustion is lowered, probably due to new emissions limits for municipal waste combustion [124]. The high limit of the estimate for waste dumps is actually the greatest contribution to the total emission estimate.
In the estimates described in Paper IX, the emission factors for dioxins and PAH from automobile fires were 0.038 mg TEQ/object and 20 g/object, respectively. These emission factors were extracted from the work of Wichmann et al. [119], the only data available at that time. The results from the full-scale automobile fire reported on in Paper X gave emission factors of 0.087 mg TEQ/object and 119 g/object for dioxins and PAHs, respectively. These new emission factors from our work are clearly higher than the old factors, but of the same order of magnitude.
An updated estimate of the dioxin emission from automobile fires in Sweden during one year (based on 4000 veichles) with the new emission factor results in an emission of 0.35g TEQ. That corresponds approximately to a third of the total emissions from municipal waste combustion in Sweden during 2004, i.e., the dioxin emissions from e.g. automobile fires are significant on a national emission level.
National inventories of PAH emissions are summarized in the EC “PAH Position Paper” [184] from 2001. It is clear from this paper that the presentation of PAH results makes inventories of PAH emissions difficult. The type of results presented varies, i.e. the number of individual PAHs included in total values is not the same in different inventories. Three different total estimates are given for Sweden [184]. The lowest total estimate is 7 tons/year and refers to benzo[a]pyrene only. Two other estimates are 153 tons/year and 282 tons/year. The first refers to the total of an undefined numbers of PAHs whether the last refers to the sum of six PAHs. The emissions of 2-12 tons of total PAHs from fires are therefore significant relative to the total estimates given above.
For the broad group of VOC compounds, there is no system for toxicity- or environmental weighting. As in the case of PAH emissions, however, the emissions of tens of tons of these species, should realistically be of some environmental significance.
The emissions from fires may, however, vary considerably between different years due to the occurrence of large, catastrophic fires. Large single fires can actually have a major effect on the overall emissions. Such potential sources of emissions were also assessed in Paper IX, and the results of this assessment are given in Table 4-7.

Emissions from Fires
100
Table 4-7 Estimate of emissions (min/max limits) from potential fires in various storage facilities.
Potential fires Amount (tons)
PCDD/F(mg TEQ)
PAH(tons)
VOC(tons)
Waste deposit 2500 100/2300 0.003/0.065 -
Wood chips 10000 ~20 1/10 10/200
Paper 4000 ~8 ~0.4 4
PVC 500 6/1100 0.5/2.5 5/25
Textiles 100 ~0.2 0.01 0.1
Tyres 1000 2/100 10 50
It was estimated that the greatest potential source of dioxins in this category would be a fire in a municipal waste deposit, or a fire involving a large amount of plastic (PVC) or tyres. The greatest potential source of PAH and VOC, however, would be a fire in wood chips or tyres.
It can be concluded that the emissions of PAH, VOC and dioxins from fires are large. The fire related emissions of PAH and dioxins have further been showed to be significant and comparable to those from many other sources. For dioxins it is further clear that large catastrophic fires can lead to major emissions.

Conclusions
101
5 Conclusions
The main objective of the work presented in this thesis was to investigate and quantify the harmful smoke gas constituents emitted from fires. This information is important in the assessment of the consequences of these compounds for humans and the environment. The work presented is put into its proper context as schematically outlined in Figure 5-1.
Figure 5-1 Schematic outline of the work presented in the thesis.
The work was principally based on the detailed analysis of the effluents from various fire experiments. The experiments were mostly large-scale, including room-fires, fires with materials in the 100-kg scale and fires with real-scale objects.
The greatest challenge was to quantitatively determine the smoke gas contents, which included all type of contents, ranging for example from major gaseous inorganic species present in percent-levels, to minor organic species present in sub ppb-levels and also sub-micron scale particulates.
Toxic inorganic fire gases such as, e.g., CO, NO, HCN, HCl and HF are a major hazard for people in fires. Some important findings regarding the production of this type of gases are given below.

Emissions from Fires
102
For large-scale experiments with pure polymers and other bulk chemicals it was shown that:
- For a number of gases (e.g. CO, NO, HCN) there is a strong dependence of the production on the equivalence ratio of the combustion.
- The type of fire scenario (in this work: open pool fires, the ISO room, a larger test enclosure with a storage configuration) does not alter the outcome of the combustion significantly, for a given level of ventilation.
Specifically for fires involving electrical cables it was seen that:
- In a fire situation where PVC containing cables show self-sustaining flame spread, the amount of HCl produced is generally equivalent to that of CO.
- There is a correlation between the production of smoke and CO from cables; and the production of smoke is significantly higher for PVC cables compared to that from halogen free cables. The production of smoke from reduced propagation (i.e.
flame retarded) PVC cables was generally the highest.
- Fires in installations with mixed types of cables can produce substantial amounts of HF from (otherwise) high performance fluoropolymer cables.
A range of organic smoke gas constituents have been identified and quantified from fires. The adverse effects of these compounds range from irritancy to carcinogenicity and reproductive effects. Some important findings regarding these compounds are given below:
- Benzene was found to be the principal organic compound present in fire effluents. Other volatile organic compounds (VOCs) of generic character for fires are toluene, phenol and styrene. Naphthalene, a volatile PAH-compound, was further a major organic constituent in all fires.
- Isocyanates are potent irritants, which were found in significant amounts in the effluents from both small-scale and large-scale fire experiments with various materials. Traces of isocyanate metabolites were further found in the urine from one person in the SP staff, working with full-scale tests involving PUR mattresses.
- Fires generally produce orders of magnitude higher yields of PAH compared to e.g. residential combustion devices. Room-fires were shown to produce a yield of approximately 1 g/kg of PAH. However, specific materials (e.g. flame retarded HIPS) were shown to produce significantly higher yields, and further a more toxic composition of the individual PAHs.
- It was shown that chlorinated dioxins (PCDD/Fs) can be produced in large amounts from fires. The size of the production was, however, shown to be very dependent on the combustion conditions in the fire. Room fires, that went to flash-over, produced moderate yields of dioxins in comparison with other (non-cleaned) combustion sources, whereas the production from a fire with an automobile, and fires with TV-sets, where high.
- Products containing brominated flame retardants were seen to produce large amounts of, predominately, brominated furans (PBDFs). The fire conditions are, however, very determining for the production. A high production of PBDFs were

Conclusions
103
found in tests with free-burning objects (TV and sofa), whereas room-tests including the same products gave a much lower total production.
An estimate of the total amounts of dioxin, PAH and VOC from fires in Sweden during a specific year was made, by combining the amounts of materials involved in fires with emission factors for these fires. It was concluded from this estimate that the emissions of PAH, VOC and dioxins from fires are large. The fire related emissions of PAH and dioxins were further shown to be significant and comparable to those from many other sources. For dioxins it was further clear that large catastrophic fires can lead to major emissions.
Submicron sized particles have an adverse health effect. The characterisation of the particulate phase in the smoke from both small-scale and large-scale fire tests has shown that:
- The maximum in the mass size distribution of particles in fires (the largest mass of particles) is generally below 1 µm, and often around 0.3 µm.
- The maximum in the number size distribution (the largest number of particles) is generally at a much smaller particle size, < 0.1 µm.
- The median (mass) diameter of particles produced from fires is related to the quantitative particle yield of the combustion. A high particle yield results in a large particle size.
An alternatively route for obtaining information concerning gas production in fires, is numerical simulation, relying on detailed chemical kinetics. The feasibility of incorporating the gas phase chemistry of a generic nitrogen-containing fuel through a stationary laminar flamelet model into CFD, to predict HCN formation in fires was investigated. The assessment of the modelling concept showed that:
- The flamelet model was able to semi-quantitatively predict the production of HCN from a room fire.
- Both the production during well ventilated conditions and the increased product-ion during under-ventilated conditions were accurately captured by the model.
Information on the production of toxic gases, such as e.g. HCN, is important for estimating the time for evacuation in the case of fires in buildings. An application of a FED-type human incapacitation model for asphyxiant gases, showed that these gases were the greatest danger in a series of experimental tunnel fires, and that HCN had a major impact in these fire tests.
A general conclusion from the work presented in this thesis is that the dangers from fire effluents are multitude, and that they are in many cases difficult to anticipate without detailed information concerning the fuel composition and fire conditions.
In fire engineering design of buildings, e.g., it is not enough to make assessments of the fire safety of single materials or objects, as a product with nominally excellent fire behaviour, could represent a major hazard in a real installation. This was exemplified by the high production of HF from fluoropolymer cables in a mixed cable installation.

Emissions from Fires
104
Further, fire retarded materials are in many cases necessary to achieve adequate fire safety. If, however, these materials are subjected to high external heat levels, the consequences, in the form of emissions, can be severe. It was, e.g., shown that HIPS treated with brominated flame retardants emitted very high amounts of brominated furans in a free-burning fire scenario.

References
105
6 References
1. SRV, "Räddningstjänst i siffror 02", Räddningsverket (SRV), I99-102/03 ISBN 91-7253-201-7, Karlstad, 2003 (in Swedish).
2. Purser, D. A., "Toxicity Assessment of Combustion Products". In The SFPE
Handbook of Fire Protection Engineering (P. J. DiNenno, Ed.), NFPA, 2:83-171, Quincy, Massachusetts, USA, 2002.
3. Statens haverikommission, " Branden på Herkulesgatan i Göteborg, O Län, den 29-30 oktober 1998." Statens Haverikommission, RO 2001:02, O-07/98, 1998 (in Swedish).
4. Robinson, A., and Bourgoyne, J. H., "The Scandinavian Star Incident - A Case Study", IFE Journal, 1999.
5. Hall, J. R. J., "How Many People are Exposed to Sublethal Fire Smoke?" Fire Technology, 40, 2, 101-116, 2004.
6. Gann, R. G., Babrauskas, V., Peacock, R. D., and Hall, J. R. J., "Fire cond-itions for smoke toxicity measurement", Fire and materials, 18, 193-199, 1994.
7. SCB, "Dödsfall vid bränder mm i Skandinavien England och Wales", Statistiska Centralbyrån (SCB), 1979:5, Stockholm, 1979 (in Swedish).
8. Council Directive 89/106/EEC, "Classification of the resistance to fire performance of construction products, construction works and parts thereof", 1988.
9. IMO Resolution, "IMO FTP Code Resolution MSC. 61(67), chapter 1, Annex 1, Part 2." IMO, 1998.
10. Airbus, "Airbus Industry document ABD0031, 7-4, Toxicity".
11. Gann, R. G., "Sublethal Effects of Fire Smoke", Fire Technology, 40, 2, 95-99, 2004.
12. Nelson, G. L., "Carbon Monoxide and Fire Toxicity: A Review and Analysis of Recent Work", Fire Technology, 34, 1, 1998.
13. Tewarson, A., "Generation of Heat and Chemical Compounds in Fires". In SFPE Handbook of Fire Protection Engineering (P. J. DiNenno, Ed.), NFPA, 3:83-161, Quincy, Massachusetts, 2002.
14. Pitts, W. M., "The Global Equivalence Ratio Concept and the Formation Mechanisms of Carbon Monoxide in Enclosure Fires", Prog. Energy Combust. Sci., 21, 197-237, 1995.
15. Tuovinen, H., "CO Formation from Soot and CO2 in the Hot Gas Layer", SP Swedish National Testing and Research Institute, 2002:08, Borås, 2002.
16. Morikawa, T., "Evolution of Hydrogen Cyanide During Combustion and Pyrolysis." Journal of Combustion Toxicology, 5, August, 315-330, 1978.
17. Michal, J., "Determination of Hydrogen Cyanide in Thermal Degradation Products of Polymeric Materials", Fire and Materials, 6, 1, 13-15, 1982.

Emissions from Fires
106
18. Simonson, M., Tuovinen, H., and Emanuelsson, V., "Formation of Hydrogen Cyanide in Fires - A Literature and Experimental Investigation", SP Swedish National Testing and Research Institute, 2000:27, Borås, 2000.
19. Mitera, J., and Michal, J., "The Combustion Products of Polymeric Materials - III: GC-MS Analysis of the Combustion Products of Polyethylene, Polypropylene, Polystyrene and Polyamide", Fire and Materials, 9, 3, 111-116, 1985.
20. Levin, B. C., "A summary of the NBS Literature Reviews on the Chemical Nature and Toxicity of the Pyrolysis and Combustion Products from Seven Plastics: ABS, Nylons, Polyester, Polyethylenes, PVC and Rigid Polyurethane Foams", Fire and Materials, 11, 143-157, 1987.
21. Leung, L., and Kasprzak, D., "Determination of Acrolein, Formaldehyde and Other Volatile Components From Combustion of Conductor Wires From Polyolefin Coated Communication Cables", Sixth (6th) International Sym-posium. International Association for Fire Safety Science (IAFSS). 1165-1165, Poitiers, France, July 5-9, 1999.
22. Peacock, R. D., Averill, J. D., Reneke, P. A., and Jones, W. W., "Characteristics of Fire Scenarios in Which Sublethal Effects of Smoke are Important", Fire Technology, 40, 2, 127-147, 2004.
23. Gendre, P., and Vasseur, Y. M., "Rapport relatif a l'accident survenu le jeudi 29 octobre 1987 dans l'entrepot exploité par la Société Loiret et Haentjens S.A. Quai de Roche Maurice a Nantes." DRIR, 1987.
24. Engineers, I. o. C., "The Sandoz Warehouse Fire", In Loss Prevention
Bulletin, 1987.
25. Wäckerlig, H., "The aftermath of the Sandoz fire", Fire Prevention, 199, 13-20, 1987.
26. Nammari, D. R., Hogland, W., Marques, M., Nimmermark, S., and Moutavtchi, V., "Emissions from a controlled fire in municipal solid waste bales", Waste Management, 24, 9-18, 2004.
27. Smith-Hansen, L., STEP-Combustion of Chemical Substances and the Impact
on the Environment of the Fire Products: Final Report, Risö National Laboratory, Denmark, Roskilde, 1994.
28. Pedersen, K. E., and Markert, F., Assessment of Fires in Chemical
Warehouses-An Overview of the TOXFIRE Project, Risö National Laboratory, Denmark, Roskilde, 1997.
29. BS 7982:2001, "Guidance on the environmental impact of large-scale fires involving plastics materials", BS 7982:2001, 2001.
30. Månsson, M., Lönnermark, A., Blomqvist, P., Persson, H., and Babrauskas, V., "TOXFIRE-Fire Characteristics and smoke Gas Analysis in Under-ventilated Large-scale Combustion Experiments", SP Swedish National Testing and Research Institute, 1996:44, Borås, 1998.
31. Månsson, M., Dahlberg, M., Blomqvist, P., and Rydeman, A., "Combustion of Chemical Substances: Fire Characteristics and Smoke Gas Components in Large-Scale Experiments." SP Swedish National Testing and Research Institute, 1994:28, Borås, 1995.

References
107
32. Axelsson, J., Van Hees, P., and Blomqvist, P., "Cables Fires in difficultly accessible areas", SP Swedish National Testing and Research Institute, 2002:12, Borås, 2002.
33. Grayson, S. J., Van Hees, P., Vercellotti, U., Breulet, H., and A., G., "Fire Performance of Electric Cables (FIPEC) - new test methods and measurement techniques.", Final Report on the EC SMT Sponsored Research Project SMT4-CT96-2059, 2000.
34. Simonson, M., and Blomqvist, P., "SAFIR, Work Package 4 Report - Large scale experiments performed at SP", SP Swedish National Testing and Research Institute, N34, Borås, 1998.
35. Simonson, M., Blomqvist, P., Boldizar, A., Möller, K., Rosell, L., Tullin, C., Stripple, H., and Sundqvist, J. O., "Fire-LCA Model: TV Case Study", SP, 2000:13, Borås, 2000.
36. Andersson, P., Simonson, M., Rosell, L., and Blomqvist, P., "Fire-LCA Model: Furniture Study", SP Swedish National Testing and Research Institute, 2003:22, Borås, 2003.
37. Hertzberg, T., Blomqvist, P., Dalene, M., and Skarping, G., "Particles and Isocyanates from Fires", SP Swedish National Testing and Research Institute, 2003:05, Borås, 2003.
38. Hakkarainen, T., Smoke gas analysis by Fourier transform infrared
spectroscopy - The SAFIR project, VTT Technical Research Centre of Finland, ESPOO, 1999.
39. Blomqvist, P., and Simonson, M., "Rökgasmätningar med FTIR mätteknik - Utvärdering av mjukvara utvecklad som del av SAFIR", SP Sveriges Provnings- och Forskningsinstitut, SP-AR 1999:45, Borås, 1999 (in Swedish).
40. Beyler, C. L., and Hirschler, M. M., "Thermal Decomposition of Polymers". In SFPE Handbook of Fire Protection Engineering (P. J. DiNenno, Ed.), NFPA, 111-131, Quincy, Massachusetts, USA, 2002.
41. Warnatz, J., Maas, U., and Dibble, R. W., COMBUSTION - Physical and
Chemical Fundamentals, Modelling and Simulation, Experiments, Pollutant Formation, 2nd ed., Springer, 1999.
42. Lewin, M., and Weil, E. D., "Mechanisms and modes of action in flame retardancy of polymers". In Fire retardant materials (A. R. Horrocks and D. Price, Eds.), Woodhead Publishing Limited, 31-57, Cambridge, England, 2001.
43. Price, D., Anthony, G., and Carthy, P., "Introduction: polymer combustion, condensed phase pyrolysis and smoke formation". In Fire retardant materials
(A. R. Horrocks and D. Price, Eds.), Woodhead Publishing Limited, 1-28, Cambridge, England, 2001.
44. ISO/TR 9122-1:1989, "Toxicity testing of fire effluents - Part 1: General", ISO, ISO/TR 9122-1:1989(E), 1989.
45. Babrauskas, V., Parker, W. J., Mulholland, G., and Twilley, W. H., "The Phi meter: A simple, fuel-independent instrument for monitoring combustion equivalence ratio", Rev.Sci.Instrum., 1994.

Emissions from Fires
108
46. Blomqvist, P., "Measurement of Toxic Combustion Gases in Large-Scale Fire Experiments", Licentiate Thesis, Inorganic Chemistry, Department of Chemistry, Göteborg, Göteborg, 2000.
47. ISO, "Toxicity testing of fire effluents - Part 3: Methods for the analysis of gases and vapours in fire effluents", ISO, ISO TR 9122-3, 1993.
48. Naturvårdsverket, "Mätmetoder för Kväve- och Svaveloxidutsläpp", Natur-vårdsverket, Allmänna råd 91:6, 1991 (in Swedish).
49. Michelson, A. A., Light Waves and Their Uses, University of Chicago Press, 1902.
50. Griffiths, P. R., and de Haseth, J. A., Fourier Transform Infrared Spectro-
metry, Wiley-Interscience, 1986.
51. Kallonen, R., "Smoke Gas Analysis by FT-IR Method. Preliminary Investigation", Journal of Fire Science, 8, September/October 1990, 343-361, 1990.
52. Kinsella, K., Nelson, C. M., Haigis, J. R., Carangelo, M. D., Ditaranto, M. B., and Markham, J. R., "High Temperature Oxygen Index Instrument with Quantitative FT-IR Gas Analysis", Journal of Fire Science, 13, May/June 1995, 197-213, 1995.
53. Nyden, M. R., and Babrauskas, "Use of FT-IR Spectroscopy for Multi-Component Quantitation in Combustion Toxicology", Combined Meetings of the Combustion Institute and the National Bureau of Standards Centre for Fire Research, 1071-1074, Gaithersburg, MD, USA, 1987.
54. Simonson, M., Blomqvist, P., Deleu, C., and Fardell, P., "SAFIR-Work Package 2 Report (Large Scale Tests/Sampling)", SP Swedish National Testing and Research Institute, N13, Borås, 1998.
55. Blomqvist, P., Lindberg, P., and Månsson, M., "TOXFIRE-Fire Characteristics and smoke Gas Analysis in Under-ventilated Large-scale Combustion Experiments: FTIR Measurements", SP Swedish National Testing and Research Institute, 1996:47, Borås, 1998.
56. Lönnermark, A., Blomqvist, P., Månsson, M., and Persson, H., "TOXFIRE-Fire Characteristics and smoke Gas Analysis in Under-ventilated Large-scale Combustion Experiments: Tests in the ISO 9705 room", SP Swedish National Testing and Research Institute, 1996:45, Borås, 1997.
57. Månsson, M., Blomqvist, P., Isaksson, I., and Rosell, L., "Sampling and Chemical Analysis of Smoke Gas Components from the SP Industry Calorimeter", SP Swedish National Testing and Research Institute, 1994:35, Borås, 1995.
58. Wallin, P.-A., "FTIR-teknik för emissionsmätningar - praktiska erfarenheter", Värmeforsk, B1-207, 1993 (in Swedish).
59. Galloway, F. M., and Hirschler, M. M., "A Model for the Spontaneous Removal of Airborne Hydrogen Chloride by Common Surfaces", Fire Safety
Journal, 14, 251-268, 1989.
60. ISO 5660-1, "Fire tests - Reaction to fire - Part 1: Rate of heat release from building products (cone calorimetric method)", ISO, ISO 5660-1:1993, 1993.
References
109
61. ASTM D 1605-60, "Sampling Atmospheres for Analysis of Gases and Vapours", D 1605-60, 1960.
62. Spanne, M., "On the Determination of Reactive Compounds in Aerosols", PhD Thesis, Department of Design Sciences, Division of Ergonomics and Aerosol Technology, Lund Institute of Technology, Lund, 2000.
63. Karlsson, D., "Airborne Isocyanates, Aminoisocyanates and Amines", PhD Thesis, Analytical Chemistry, Work Environment Chemistry, Lund University, Lund, 2001.
64. EN1948-1, "Stationary source emissions - Determination of the mass concentration of PCDDs/PCDFs - Part 1: Sampling", 1997.
65. Mulholland, G. W., "Smoke productions and properties". In SFPE Handbook
of Fire Protection Engineering (NFPA, Ed.), NFPA, 2.258-2.268, Quincy, MA, USA, 2002.
66. EPA, U. S. E. P. A., "Basic Concepts in Environmental Sciences, Module 3: Characteristics of Particles", EPA, 2005.
67. Johansson, L. S., "Characterisation of Particle Emissions from Small-Scale Biomass Combustion", Licentiate Thesis, Department of Energy Technology, Chalmers University of Technology, Göteborg, 2002.
68. Hinds, W. C., Aerosol Technology, 2´nd ed., A Wiley-Interscience pub-lication, 1999.
69. Smith-Hansen, L., "STEP - Combustion of chemical substances and the impact on the environment of the fire products, Final report", Risø National Laboratory, Denmark, Risø-R-764(EN), Roskilde, 1994.
70. Lönnermark, A., Blomqvist, P., Månsson, M., and Persson, H., "TOXFIRE-Fire Characteristics and smoke Gas Analysis in Under-ventilated Large-scale Combustion Experiments: Storage configuration tests", SP Swedish National Testing and Research Institute, 1996:46, Borås, 1996.
71. Drysdale, D., An Introduction to Fire Dynamics, John Wiley and Sons Ltd, UK, 1994.
72. Woolley, W. D., and Fardell, P. J., "Basic Aspects of Combustion Toxicology", Fire Safety Journal, 5, 29-48, 1982.
73. Gottuk, D. T., "Generation of Carbon Monoxide in Compartment Fires", NIST, NIST-GCR-92-619, 1992.
74. Glassman, I., Combustion, 3 ed., Academic Press, 1977.
75. Glarborg, P., Miller, J. A., and Kee, R. J., "Kinetic modelling and sensitivity analysis of nitrogen oxide formation in well-stirred reactors", Combustion
and Flame, 65, 2, 177-202, 1986.
76. Markert, F., Holmstedt, G., and Rasmussen, B., "Experiments and Risk Assessment Concerning Chemical Warehouse Fires", Second International Conference on Fire Research and Engineering, 325-336, Gaithersburg, Maryland, USA, 1997.

Emissions from Fires
110
77. Andersson, B., Markert, F., and Holmstedt, G., "Combustion products generated by hetero-organic fuels on four different fire test scales", Fire
Safety Journal, 40, 439-465, 2005.
78. Clarke, F. B., Kuijk, H. V., Valentine, R., Makovec, G. T., Seidler, W. C., Baker, B. B., Kasprzak, D. J., Bonesteel, J. K., Janssens, M., and Herpol, C., "The Toxicity of Smoke from Fires Involving Perfluoropolymers: Full-Scale Fire Studies", Journal of Fire Science, 10, 6, 488-527, 1992.
79. R.J. Lewis, S., Ed. "Sax's dangerous properties of industrial materials," Van Nostrand Reinhold, New York, 1992.
80. Su, J. Z., Kim, A. K., and Kanabus-Kaminska, M., "FTIR spectroscopic measurement of halogenated compounds produced during fire suppression tests of two halon replacements", Fire Safety Journal, 31, 1-17, 1998.
81. Shimanouchi, T., "Tables of Molecular Vibrational Frequencies Consolidated Volume II", J. Phys. Chem. Ref. Data, 6, 3, 993-1102, 1972.
82. Paabo, M., and Levin, B. C., "A Literature Review of the Chemical Nature and Toxicity of the Decomposition Products of Polyethylenes", Fire and
Materials, 11, 55-70, 1987.
83. Levin, B. C., "A summary of the NBS literature reviews on the chemical nature and toxicity of the pyrolysis and combustion products from seven plastics: Acrylonitrile-butadiene-styrene (ABS), nylons, polyesters, poly-styrenes, poly(vinyl chlorides) and rigid polyurethane foams", Fire and
Materials, 11, 143-157, 1987.
84. Andersson, P., Blomqvist, P., Rosell, L., and Simonson, M., "The environmental effect of furniture", Interflam '04, 1467-1478, Edinburgh, Scotland, 2004.
85. EPA, U. S. E. P. A., "Integrated Risk Information System", EPA, 1995.
86. D’Annaa, A., and Kentb, J. H., "Aromatic formation pathways in non-premixed methane flames", Combustion and Flame, 132, 715–722, 2003.
87. Bakke, J. V., "International Consensus Report on: Isocyanates – Risk assessment and management", International Consensus Report on: Isocyanates – Risk assessment and management. Meeting funded by Nordic Council of Ministers, Hoesbjoer, Norway, 2001.11.20-22, 2001.
88. KEMI, "Klassificering och märkning av kemiska produkter. KIFS 2001:3 (omtryck av KIFS 1994:12) ändrad KIFS 2002:3 och KIFS 2004:7. Bilaga 5 och 6." Kemikalieinspektionen, 2004 (in Swedish).
89. NIOSH, NIOSH Chemical Listing and Documentation of Revised IDLH
Values (as of 3/1/95), NIOSH, Taft Laboratories, Cincinnati, USA, 1995.
90. Birgersson, B., Sterner, O., and Zimerson, E., Kemiska Hälsorisker -
Toxikologi i kemiskt perspektiv, 1 ed., LiberHermods, Stockholm, 1983 (in Swedish).
91. Häggroth, T., "Arbetsmiljöutredning - Isocyanater", Räddningsverket, P21-351/00, Karlstad, 2000 (in Swedish).
92. Szpilman, J., "Toxic Hazards During Fire - insulating materials", Dantest, National Institute for Testing and Verification, Kopenhagen, 1982.

References
111
93. Marlair, G., Prager, F. H., and Sand, H., "The Behaviour of Commercially Important Di-isocyanates in Fire Conditions Part 1: Toluene Di-isocyanate (TDI)", Fire and Materials, 17, 91-102, 1993.
94. Marlair, G., Prager, F. H., and Sand, H., "The Behaviour of Commercially Important Diisocyanates in Fire Conditions Part 2: Polymeric Diphenyl Methane-4,4´-diisocyanate (PMDI)", Fire and Materials, 18, 17-30, 1994.
95. ISO 9705, "Fire tests - Full-scale room test for surface products", ISO 9705, 1993.
96. Karlsson, D., Dalene, M., Skarping, G., and Marand, Å. "Determination of isocyanate acid in air", Journal of Environmental Monitoring, 3, 432-436, 2001.
97. Delistraty, D., "Toxic equivalency factor approach for risk assessment of polycyclic aromatic hydrocarbons", Toxicological and Environmental
Chemistry, 64, 81-108, 1997.
98. Manahan, S. E., Environmental Chemistry, 6:th ed., Lewis Publishers, 1994.
99. Nisbet, I. C. T., and LaGoy, P. K., "Toxic Equivalence Factors (TEFs) for Polycyclic Aromatic Hydrocarbon (PAHs)", Regulatory Toxicology and
Pharmacology, 16, 290-300, 1992.
100. Reeves, W. R., Barhoumi, R., Burghardt, R. C., Lemke, S. L., Mayura, K., McDonald, T. J., Phillips, T. D., and Donnely, K. C., "Evaluation of Methods for Predicting the Toxicity of Polycyclic Aromatic Hydrocarbon Mixtures", Environmental Science & Technology, 35, 8, 1630-1636, 2001.
101. EPA, "Integrated Risk Information System (IRIS). Chemical Specific Reference Doses and Cancer Potency Factors", Environmental Protection Agency, Cincinnatti, USA.
102. IARC, "IARC Monographs on the Evaluation of Carcinogenic Risks to Humans", IARC International Agency for Research on Cancer.
103. Lemieux, P. M., Lutes, C. C., and Santoianni, D. A., "Emissions of organic air toxics from open burning: a comprehensive review", Progress in Energy
and Combustion Science, 30, 1-32, 2004.
104. Johansson, L. S., Leckner, B., Gustavsson, L., Cooper, D., Tullin, C., and Potter, A., "Emission characteristics of modern and old-type residential boilers fired with wood logs and wood pellets", Atmospheric Environment,
38, 4183–4195, 2004.
105. Lillieblad, L., Szpila, A., Strand, M., Pagels, J., Rupar-Gadd, K., Gudmundsson, A., Swietlicki, E., Bohgard, M., and Sanati, M., "Boiler Operation Influence on the Emissions of Submicrometer-Sized Particles and Polycyclic Aromatic Hydrocarbons from Biomass-Fired Grate Boilers", Energy & Fuels, 18, 410-417, 2004.
106. Lemieux, P. M., "Evaluation of Emissions From the Open Burning of Household Waste in Barrels", EPA, EPA-600/R-97-134a, 1997.
107. WHO, "Assessment of the health risk of dioxins: re-evaluation of the Tolerable Daily Intake (TDI)", WHO, Geneva, Switzerland, 1998.

Emissions from Fires
112
108. Birnbaum, L. S., and DeVito, M. J., "Use of toxic equivalency factors for risk assessment for dioxins and related compounds", Toxicology, 105, 391-401, 1995.
109. Eadon, G., Kammsky, L., Silkworth, J., Aldous, K., Hilker, D., O'Keefe, P., Smith, R., Gierthy, J. F., Hawlwy, J., Kim, N., and DeCaprio, A., "Calculation of 2,3,7,8-TCDD equivalent concentrations of complex environmental conformant mixtures." Environmental Health Perspectives,
70, 221-227, 1986.
110. Ahlborg, U. m. f., "Nordisk dioxinriskbedömning", 1988:7, 1988 (in Swedish).
111. Kutz, F. W., Barnes, D. G., Bretthauer, E. W., Bottimore, D. P., and Greim, H., "The International Toxicity Equivalency Factor (I-TEF). Method for Estimating Risks Associated with Exposures to Complex Mixtures of Dioxins and Related Compounds." Toxicol. Environ. Chem., 26, 99-110, 1990.
112. Stanmore, B. R., "The formation of dioxins in combustion systems", Combustion and Flame, 136, 398–427, 2004.
113. Wikström, E., "The role of Chlorine during Waste Combustion", PhD Thesis, Department of Chemistry, Environmental Chemistry, Umeå University, Umeå, 1999.
114. Gullet, B. K., Lemieux, P. M., Lutes, C. C., Winterrowd, C. K., and Winters, D. L., "Emissions of PCDD/F from uncontrolled, domestic waste burning", Chemosphere, 43, 721-725, 2001.
115. Marklund, S., Andersson, R., Tysklind, M., and Rappe, C., "Emissions of PCDDs and PCDFs from a PVC-Fire in Holmsund, Sweden", Chemosphere,
18, 1031-1038, 1989.
116. Wobst, M., Wichmann, H., and Bahadir, M., "Surface Contamination with PASH, PAH and PCDD/F after Fire Accidents in Private Residences", Chemosphere, 38, 7, 1685-1691, 1999.
117. Ruokojärvi, P., Aatamila, M., and Ruuskanen, J., "Toxic chlorinated and polyaromatic hydrocarbons in simulated house fires", Chemosphere, 41, 825-828, 2000.
118. Ruokojärvi, P., Ettala, M., Rahkonen, P., Tarhanen, J., and Ruuskanen, J., "Polychlorinated Dibenzo-p-dioxins and -furans (PCDDs and PCDFs) in Municipal Waste Land Fires", Chemosphere, 30, 9, 1697-1708, 1995.
119. Wichmann, H., Lorenz, W., and Bahadir, M., "Release of PCDD/F and PAH during Vehicle Fires in Traffic Tunnels", Chemosphere, 31, 2, 2755-2766, 1995.
120. Vikelsøe, J., and Johansen, E., "Estimation of dioxin emissions from fires in chemicals", Chemosphere, 40, 165-175, 2000.
121. Andersson, P., Rosell, L., Simonson, M., and Emanuelsson, V., "Small and Large Scale Fire Experiments with Electric Cables under Well-Ventilated and Vitiated Conditions", Fire Technology, 40, 247–262, 2004.

References
113
122. Söderström, G., and Marklund, S., "PBCDD and PBCDF from Incineration of Waste-Containing Brominated Flame Retardants", ENVIRONMENTAL
SCIENCE & TECHNOLOGY, 36, 9, 1959-1964, 2002.
123. Lemieux, P. M., Stewart, E. S., and Ryan, J. V., "Pilot-scale studies on the effect of bromine addition on the emissions of chlorinated organic combustion by-products", Waste Management, 22, 381–389, 2002.
124. Naturvårdsverket, S., "Kartläggning av källor till oavsiktligt bildade ämnen, Rapport till regeringen 2005-03-31", 5462, Stockholm, 2005 (in Swedish).
125. Thomas, V. M., and Spiro, T. G., "The U.S. Dioxin Inventory: Are There Missing Sources?" Environmental Science & Technology, 30, 2, 82-85, 1996.
126. Carroll, W. F., "The relative contribution of wood and poly(vinyl chloride) to emissions of PCDD and PCDF from house fires", Chemosphere, 45, 1173-1180, 2001.
127. Birnbaum, L. S., Staskal, D. F., and Diliberto, J. J., "Health effects of polybrominated dibenzo-p-dioxins (PBDDs) and dibenzofurans (PBDFs)", Environment International, 29, 855– 860, 2003.
128. Buser, H.-R., "Polybrominated Dibenzofurans and Dibenzo-p-dioxins: Thermal Reaction Products of Polybrominated Diphenyl Ether Flame Retardants", Environmental Science Technology, 20, 4, 404-408, 1986.
129. Luijk, R., Wever, H., Olie, K., Govers, H. A. J., and Jaap J, B., "The influence of the polymer matrix on the formation of polybrominated dibenzo-p-dioxins (PBDDs) and polybrominated dibenzofurans (PBDFs)", Chemosphere, 23, 8-10, 1173-1183, 1991.
130. Eber, J., and Bahadir, M., "Formation of PBDD/F from flame-retarded plastic materials under thermal stress", Environmental International, 29, 711-716, 2003.
131. Weber, R., and Kuch, B., "Relevance of BFRs and thermal conditions on the formation pathways of brominated and brominated-chlorinated dibenzo-dioxins and dibenzofurans", Environment International, 29, 699-710, 2003.
132. Zelinski, V., Lorenz, W., and Bahadir, M., "Brominated flame retardants and resulting PBDD/F in accidental fire residues from private residences", Chemosphere, 27, 8, 1519-1528, 1993.
133. Söderström, G., and Marklund, S., "Fire of a flame retarded TV", Organohalogen Compounds, 41, 269-272, 1999.
134. Fabarius, G., Wilken, M., Borgas, M., and Zeschmar-Lahl, B., "Release of organic pollutants during accidental fires", Organohalogen Compounds, 3,
373-377, 1990.
135. Jaenicke, R., "Aerosol-Cloud-Climate Interactions". In Tropospheric Aero-
sols Academic Press Inc., 1-31, 1993.
136. Pope, C. A., and al., e., "Daily mortality and PM10 pollution in Utah Valley", Ach Environment Health, 47, 211-217, 1992.
137. Stone, P. H., and al., e., "First step toward understanding the pathophysio-logic link between air pollution and cardiac mortality", Am. Heart J., 128, 804-807, 1999.

Emissions from Fires
114
138. Siegmann, K., and H.C., S., "The Formation of Carbon in Combustion and how to Quantify the Impact on Human Health", Europhysics News, 28, 50-57, 1997.
139. Jokiniemi, J. K., and al., e., "Numerical simulation of vapour-aerosol dynamics in combustion processes", j.Aerosol Sci., 25, 3, 429-446, 1994.
140. D'Alessio, A., D'Anna, A., G., G., Minutolo, P., Sgro, L. A., and Violo, A., "Combustion-generated Nanoparticles", Chim. Ind., 81, 1001-1006, 1999.
141. Wichmann, H.-E., and al., e., "Daily Mortality and Fine and Ultrafine Particles in Erfurt, Germany. Part I: Role of Particle Number and Particle Mass", Health Effects Institute, 2000.
142. Butler, K. M., and Mulholland, G. W., "Generation and Transport of Smoke Components", Fire Technology, 40, 2, 149-176, 2004.
143. Dederichs, A. S., "Flamelet Modelling of Soot Formation in Diffusion Flames", PhD Thesis, Department of Fire Safety Engineering, Lund University, Lund, 2004.
144. Evans, D. D., Baum, H. R., Mulholland, G. W., Bryner, N. P., and Forney, G. P., "Smoke Plumes from Crude Oil Burns", Twelfth Arctic and Marine Oil Sill Program Technical Seminar, 1-22, Calgary, Alberta, 1989.
145. Novozhilov, V., "Computational fluid dynamics modelling of compartment fires", Progress in Energy and Combustion Science, 27, 611-666, 2001.
146. Quintiere, J. A., "Compartment Fire Modelling". In SFPE Handbook of Fire
Protection Engineering (P. J. DiNenno, Ed.), NFPA, 3:162-170, Quincy, Massachusetts, 2002.
147. Walton, W. D., "Zone Computer Fire Models for Enclosures". In SFPE
Handbook of Fire Protection Engineering (P. J. DiNenno, Ed.), NFPA, 3:189-193, Quincy, Massachusetts, 2002.
148. Versteeg, H. K., and Malalasekera, W., An introduction to Computational
Fluid Dynamics, 1st ed., Pearson Education Limited, Harlow, England, 1995.
149. Spalding, D., "Mixing and chemical reaction in steady confined turbulent flames", 13th International Symposium on Combustion, 649-657, University of Utah, USA, 1970.
150. Magnussen, B., and Hjertager, G. H., "On mathematic modelling of turbulent combustion with special emphasis on soot formation and combustion", 16th International Symposium on Combustion, 719-729, Pittsburgh, PA, The Combustion Institute, 1976.
151. Tuovinen, H., "Simulation of Combustion and Fire-Induced Flows in Enclosures", PhD Thesis, Department of Fire Safety Engineering, Lund University, Lund, 1995.
152. Peters, N., "Laminar diffusion flamelet models in non-premixed turbulent combustion", Progress in Energy and Combustion Science, 10, 3, 319-339, 1984.
153. Fenimore, C. P., "Formation of Nitric Oxide From Fuel Nitrogen in Ethylene Flames", Combustion and Flame, 19, 2, 289–296, 1972.

References
115
154. Bowman, C. T., Fossil Fuel Combustion-A source Book, John Wiley, New York, 1991.
155. Rubini, P., "SOFIE V 3.0 Users guide", School of Mechanical Engineering, Cranfield, England, 2000.
156. Hoyermann, K., Mauss, F., and Zeuch, T., "A detailed chemical reaction mechanism for the oxidation of hydrocarbons and its application to the analysis of benzene formation in fuel rich premixed laminar acetylene and propene flames", Physical Chemistry Chemical Physics, 2004.
157. Klaus, P., "Entwicklung eines Detailierten Reaktionsmechanismus zur Modellierung der Bildung von Stickoxiden in Flammenfronten", Universtät Heidelberg, 1997.
158. Klaus, P., and Warnatz, J. A., "Further contribution towards a complete mechanism for the formation of NO in flames", VDI Berichte, Nr. 1313,
1997.
159. Kantak, M. V., Manrique, K. S. D., Aglave, R. H., and Hesketh, R. P., "Methylamine Oxidation in a Flow Reactor: Mechanism and Modelling", Combustion and Flame, 108, 235-265, 1997.
160. Braun, E., and Levin, B. C., "Nylons: A Review of the Literature on Products of Combustion and Toxicity", Fire and Materials, 11, 71-88, 1987.
161. Leichtnam, J.-N., Schwartz, D., and Gadiou, R., "The behaviour of fuel-nitrogen during fast pyrolysis of polyamine at high temperature", Journal of
Analytical and Applied Pyrolysis, 55, 255-268, 2000.
162. Conway, D. C., and Marak, R., "Analysis of polymers by pyrolysis/chemical ionization mass spectrometry", Journal of Polymer Science, Polymer
Chemistry, 20, 1765-1774, 1982.
163. Tuovinen, H., and Blomqvist, P., "Modelling of Hydrogen Cyanide Formation in Room Fires", SP Swedish National Testing and Research Institute, 2003:10, Borås, 2003.
164. Steward, R., "The effect of carbon monoxide on humans", Annu Rev
Pharmacol., 15, 409-23., 1975.
165. Meyers, R. A. M., and Thom, "Carbon monoxide and cyanide poisoning". In Hyperbaric Medicine Practice (E. P. Kindwall, Ed.), Flagstaff, AZ, Best Publishing, 343-372, 1995.
166. Arbetsmiljöverket, "Hygieniska gränsvärden och åtgärder mot luft-föroreningar", Arbetsmiljöverket, AFS 2005:17, 2005 (in Swedish).
167. ISO 13344:1996(E), "Determination of the lethal toxic potency of fire effluents", ISO, ISO 13344:1996(E), 1996.
168. Levin, B. C., "Effects of Exposure to Single or Multiple Combinations of the Predominant Toxic gases and Low Oxygen Atmospheres Produced in Fires", Fundamental and Applied Toxicology, 9, 236-250, 1987.

Emissions from Fires
116
169. Levin, B. C., Braun, E., Navarro, M., and Paabo, M., "Further Development of the N-Gas Mathematical Model: An Approach for Predicting the Toxic Potency of Complex Combustion Mixtures", American Chemical Society. Fire and Polymers II: Materials and Tests for Hazard Prevention. National Meeting, 208th., 293-311, Washington, DC, 1995.
170. ISO/TR 9122-5:1993, "Toxicity testing of fire effluents - Part 5: Prediction of toxic effects of fire effluents", ISO, ISO/TR 9122-51993(E), 1993.
171. ISO/TS 13571:2002, "Life threat from fires - Guidance on the estimation of time available for escape using fire data", ISO, ISO/TS 13571:2002, 2002.
172. Babrauskas, V., "Toxicity for the primary gases found in fires", Fire Science and Technology Inc., 2000.
173. Jin, T., "Visibility trough fire smoke, Part 5. Allowable smoke density for escape from fire", Fire Research Institute of Japan, 42, 1975.
174. Babrauskas, V., "Technical Note 1103", National Bureau of Standards, 1103, Washington, 1979.
175. Ingason, H., "Proceedings of the International Symposium on Catastrophic Tunnel Fire", International Symposium on Catastrophic Tunnel Fire, 231, Borås, 2003.
176. Lönnermark, A., and Ingason, H., "Gas temperatures in heavy goods vehicle fires in tunnels", Fire Safety Journal, 40, 506-527, 2005.
177. Ingason, H., and Lönnermark, A., "Heat release rates from heavy goods vehicle trailer fires in tunnels", Fire Safety Journal, (article in press), 2005.
178. Persson, B., Simonson, M., and Månsson, M., "Utsläpp från bränder till atmosfären", SP, 1995:70, Borås, 1995 (in Swedish).
179. Persson, B., and Simonson, M., "Fire Emissions into the Atmosphere", Fire
Technology, 34, 3, 267-279, 1998.
180. Carroll, W. F., "Is PVC in House Fires the Great Unknown Source of Dioxin?" Fire and Materials, 20, 161-166, 1996.
181. Dyke, P. H., Foan, C., Wenborn, M., and Coleman, P. J., "A review of dioxin releases to land and water in the UK", The science of the Total Environment,
207, 119-131, 1997.
182. UNEP, "Dioxin and Furan Inventories, National and Regional Emissions of PCDD/PCDF", UNEP Chemicals, Geneva, Switzerland, 1999.
183. Blomqvist, P., Persson, B., and Simonson, M., "Utsläpp från bränder till miljön - Utsläpp av dioxin, PAH och VOC till luften", Räddningsverket, P21-407/02, Karlstad, 2002 (in Swedish).
184. European Commission, "Ambient air pollution by Polycyclic Aromatic Hydrocarbons (PAH). Position Paper", Office for Official Publications of the European Communities, ISBN 92-894-2057-X, Luxembourg, 2001.