
Emission Factor Documentation for AP-42 Natural … Factor Documentation for AP-42 Section 9.6.1...
32
Emission Factor Documentation for AP-42 Section 9.6.1 Natural and Processed Cheese Final Report For U. S. Environmental Protection Agency Office of Air Quality Planning and Standards Emission Factor and Inventory Group EPA Contract 68-D2-0159 Work Assignment No. 4-04 MRI Project No. 4604-04 July 1997
Transcript of Emission Factor Documentation for AP-42 Natural … Factor Documentation for AP-42 Section 9.6.1...
Emission Factor Documentation for AP-42Section 9.6.1
Natural and Processed Cheese
Final Report
For U. S. Environmental Protection AgencyOffice of Air Quality Planning and Standards
Emission Factor and Inventory Group
EPA Contract 68-D2-0159Work Assignment No. 4-04
MRI Project No. 4604-04
July 1997

Emission Factor Documentation for AP-42Section 9.6.1
Natural and Processed Cheese
Final Report
For U. S. Environmental Protection AgencyOffice of Air Quality Planning and Standards
Emission Factor and Inventory GroupResearch Triangle Park, NC 27711
Attn: Mr. Dallas Safriet (MD-14)
EPA Contract 68-D2-0159Work Assignment No. 4-04
MRI Project No. 4604-04
July 1997

ii
NOTICE
The information in this document has been funded wholly or in part by the United StatesEnvironmental Protection Agency under Contract No. 68-D2-0159 to Midwest Research Institute. It hasbeen reviewed by the Office of Air Quality Planning and Standards, U. S. Environmental Protection Agency,and has been approved for publication. Mention of trade names or commercial products does not constituteendorsement or recommendation for use.

iii
PREFACE
This report was prepared by Midwest Research Institute (MRI) for the Office of Air Quality
Planning and Standards (OAQPS), U. S. Environmental Protection Agency (EPA), under Contract
No. 68-D2-0159, Work Assignment No. 4-04. Mr. Dallas Safriet was the requester of the work.
Approved for:
MIDWEST RESEARCH INSTITUTE
Roy NeulichtProgram ManagerEnvironmental Engineering Department
Jeff ShularDirector, Environmental Engineering Department
July 31, 1995

iv
v
TABLE OF CONTENTS
Page
1. INTRODUCTION . . . . . . . . . . . . . . . . . . . . . . . . . . . . . . . . . . . . . . . . . . . . . . . . . . . . . . . . . . . . . . . 1-1
2. INDUSTRY DESCRIPTION . . . . . . . . . . . . . . . . . . . . . . . . . . . . . . . . . . . . . . . . . . . . . . . . . . . . . . . 2-12.1 INDUSTRY CHARACTERIZATION . . . . . . . . . . . . . . . . . . . . . . . . . . . . . . . . . . . . . . . . . . . 2-12.2 PROCESS DESCRIPTION . . . . . . . . . . . . . . . . . . . . . . . . . . . . . . . . . . . . . . . . . . . . . . . . . . . 2-1
2.2.1 Natural Cheese Manufacture . . . . . . . . . . . . . . . . . . . . . . . . . . . . . . . . . . . . . . . . . . . . . 2-62.2.2 Processed Cheese Manufacture . . . . . . . . . . . . . . . . . . . . . . . . . . . . . . . . . . . . . . . . . . . 2-12
2.3 EMISSIONS . . . . . . . . . . . . . . . . . . . . . . . . . . . . . . . . . . . . . . . . . . . . . . . . . . . . . . . . . . . . . . . . 2-142.4 EMISSION CONTROL TECHNOLOGY . . . . . . . . . . . . . . . . . . . . . . . . . . . . . . . . . . . . . . . . 2-14
3. GENERAL DATA REVIEW AND ANALYSIS PROCEDURES . . . . . . . . . . . . . . . . . . . . . . . . . 3-13.1 LITERATURE SEARCH AND SCREENING . . . . . . . . . . . . . . . . . . . . . . . . . . . . . . . . . . . . 3-13.2 DATA QUALITY RATING SYSTEM . . . . . . . . . . . . . . . . . . . . . . . . . . . . . . . . . . . . . . . . . . 3-13.3 EMISSION FACTOR QUALITY RATING SYSTEM . . . . . . . . . . . . . . . . . . . . . . . . . . . . . . 3-3
4. REVIEW OF SPECIFIC DATA SETS . . . . . . . . . . . . . . . . . . . . . . . . . . . . . . . . . . . . . . . . . . . . . . 4-14.1 REVIEW OF SPECIFIC DATA SETS . . . . . . . . . . . . . . . . . . . . . . . . . . . . . . . . . . . . . . . . . . . 4-1
4.1.1 Reference 1 . . . . . . . . . . . . . . . . . . . . . . . . . . . . . . . . . . . . . . . . . . . . . . . . . . . . . . . . . . . 4-14.1.2 Reference 2 . . . . . . . . . . . . . . . . . . . . . . . . . . . . . . . . . . . . . . . . . . . . . . . . . . . . . . . . . . . 4-14.1.3 Reference 3 . . . . . . . . . . . . . . . . . . . . . . . . . . . . . . . . . . . . . . . . . . . . . . . . . . . . . . . . . . . 4-14.1.4 Reference 4 . . . . . . . . . . . . . . . . . . . . . . . . . . . . . . . . . . . . . . . . . . . . . . . . . . . . . . . . . . . 4-14.1.5 Reference 5 . . . . . . . . . . . . . . . . . . . . . . . . . . . . . . . . . . . . . . . . . . . . . . . . . . . . . . . . . . . 4-24.1.6 Reference 6 . . . . . . . . . . . . . . . . . . . . . . . . . . . . . . . . . . . . . . . . . . . . . . . . . . . . . . . . . . . 4-24.1.7 Reference 7 . . . . . . . . . . . . . . . . . . . . . . . . . . . . . . . . . . . . . . . . . . . . . . . . . . . . . . . . . . . 4-2
4.2 DEVELOPMENT OF CANDIDATE EMISSION FACTORS . . . . . . . . . . . . . . . . . . . . . . . . 4-34.2.1 General Procedures . . . . . . . . . . . . . . . . . . . . . . . . . . . . . . . . . . . . . . . . . . . . . . . . . . . . . 4-34.2.2 Cheese Dryers . . . . . . . . . . . . . . . . . . . . . . . . . . . . . . . . . . . . . . . . . . . . . . . . . . . . . . . . . 4-34.2.3 Whey Dryers . . . . . . . . . . . . . . . . . . . . . . . . . . . . . . . . . . . . . . . . . . . . . . . . . . . . . . . . . . 4-3
5. PROPOSED AP-42 SECTION . . . . . . . . . . . . . . . . . . . . . . . . . . . . . . . . . . . . . . . . . . . . . . . . . . . . 5-1
vi
LIST OF FIGURES
Figure Page
2-1 Locations of cheese manufacturing facilities in the United States . . . . . . . . . . . . . . . . . . . . 2-32-2 Natural cheese manufacture . . . . . . . . . . . . . . . . . . . . . . . . . . . . . . . . . . . . . . . . . . . . . . . . . . 2-7
LIST OF TABLES
Table Page
2-1. PRODUCTION OF CHEESE AND CHEESE PRODUCTS IN THE UNITED STATES . . . . . . . . . . . . . . . . . . . . . . . . . . . . . . . . . . . . . . . . . . . . . . . . . . . . . . . . . . . . . . . . . 2-2
2-2. CHARACTERISTICS OF SEVERAL TYPES OF NATURAL CHEESES . . . . . . . . . . . . 2-42-3. DIFFERENCES IN SELECTED CHEESEMAKING STEPS . . . . . . . . . . . . . . . . . . . . . . . 2-52-4. TYPES OF MILK USED TO PRODUCE DIFFERENT VARIETIES OF CHEESE . . . . . 2-84-1. SUMMARY OF TEST DATA FOR NATURAL AND PROCESSED CHEESE
MANUFACTURING . . . . . . . . . . . . . . . . . . . . . . . . . . . . . . . . . . . . . . . . . . . . . . . . . . . . . . 4-44-2. PARTICULATE EMISSION FACTORS FOR NATURAL AND PROCESSED
CHEESE MANUFACTING . . . . . . . . . . . . . . . . . . . . . . . . . . . . . . . . . . . . . . . . . . . . . . . . . 4-5
1-1
EMISSION FACTOR DOCUMENTATION FOR AP-42 SECTION 9.6.1Natural and Processed Cheese
1. INTRODUCTION
The document Compilation of Air Pollutant Emission Factors (AP-42) has been published by theU. S. Environmental Protection Agency (EPA) since 1972. Supplements to AP-42 have been routinelypublished to add new emission source categories and to update existing emission factors. AP-42 is routinelyupdated by EPA to respond to new emission factor needs of EPA, State and local air pollution controlprograms, and industry.
An emission factor is a representative value that attempts to relate the quantity of a pollutant releasedto the atmosphere with an activity associated with the release of that pollutant. Emission factors usually areexpressed as the weight of pollutant divided by the unit weight, volume, distance, or duration of the activitythat emits the pollutant. The emission factors presented in AP-42 may be appropriate to use in a number ofsituations, such as making source-specific emission estimates for areawide inventories for dispersionmodeling, developing control strategies, screening sources for compliance purposes, establishing operatingpermit fees, and making permit applicability determinations. The purpose of this report is to providebackground information from test reports and other information to support preparation of AP-42Section 9.6.1, Natural and Processed Cheese.
This background report consists of five sections. Section 1 includes the introduction to the report. Section 2 gives a description of the cheese production industry. It includes a characterization of the industry,a description of the different process operations, a characterization of emission sources and pollutantsemitted, and a description of the technology used to control emissions resulting from these sources. Section 3is a review of emission data collection procedures. It describes the literature search, the screening of emissiondata reports, and the quality rating system for both emission data and emission factors. Section 4 details howthe new AP-42 section was developed. It includes the review of specific data sets and a description of howcandidate emission factors were developed. Section 5 presents the AP-42 Section 9.6.1, Natural andProcessed Cheese. Supporting documentation for the emission factor development is presented in theAppendices.
2-1
2. INDUSTRY DESCRIPTION
This section provides an overview of the U.S. production of natural and processed cheese. It isdivided into four subsections: industry characterization (2.1), process description (2.2), emissions (2.3), andemission control technology (2.4). The production of natural and processed cheese, except for cottage cheese,is classified in Standard Industrial Classification (SIC) Code 2022; cottage cheese is classified in SIC Code2026.
2.1 INDUSTRY CHARACTERIZATION1-3
Cheese represents the largest percentage of world milk consumption (34 percent), followed by butter(33 percent), liquid milk (27 percent), and powdered milk (6 percent). Approximately one-third of the cow'smilk produced in the United States is used to make cheese. Most of the cheese produced in the United Statesis made from a type of cow's milk, such as cream, whole milk, lowfat milk, and skim milk. However, goat'sand sheep's milk may also be used in cheese production.
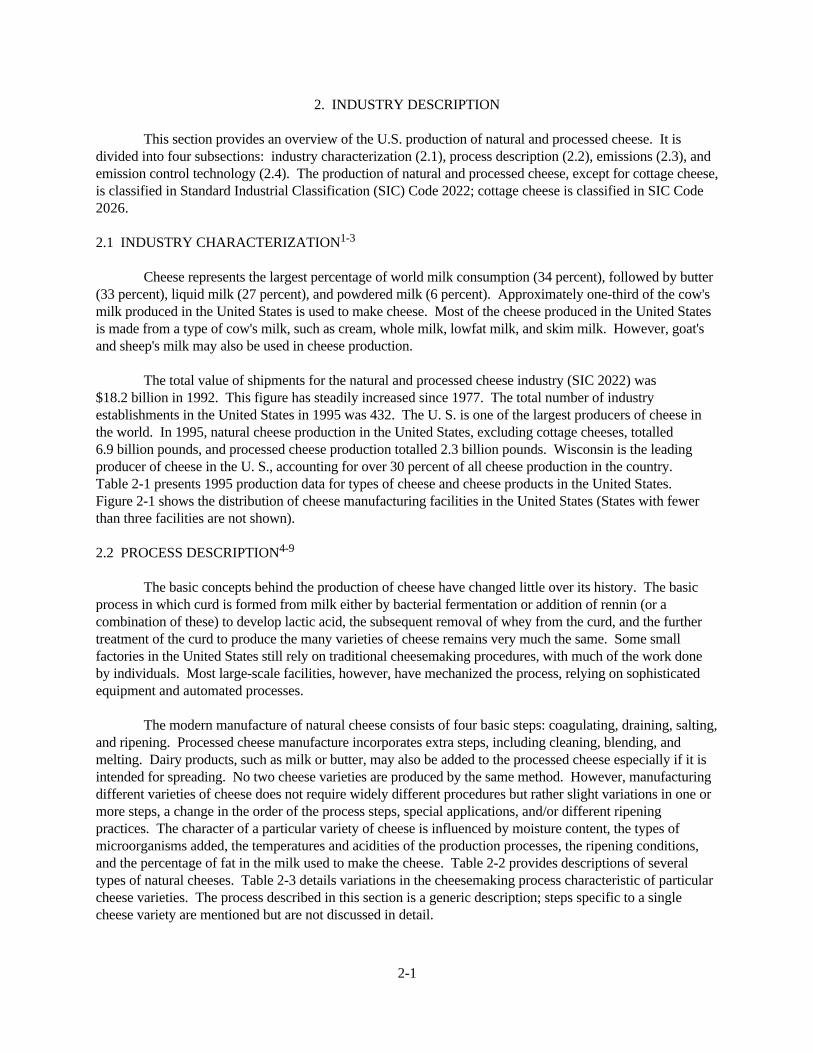
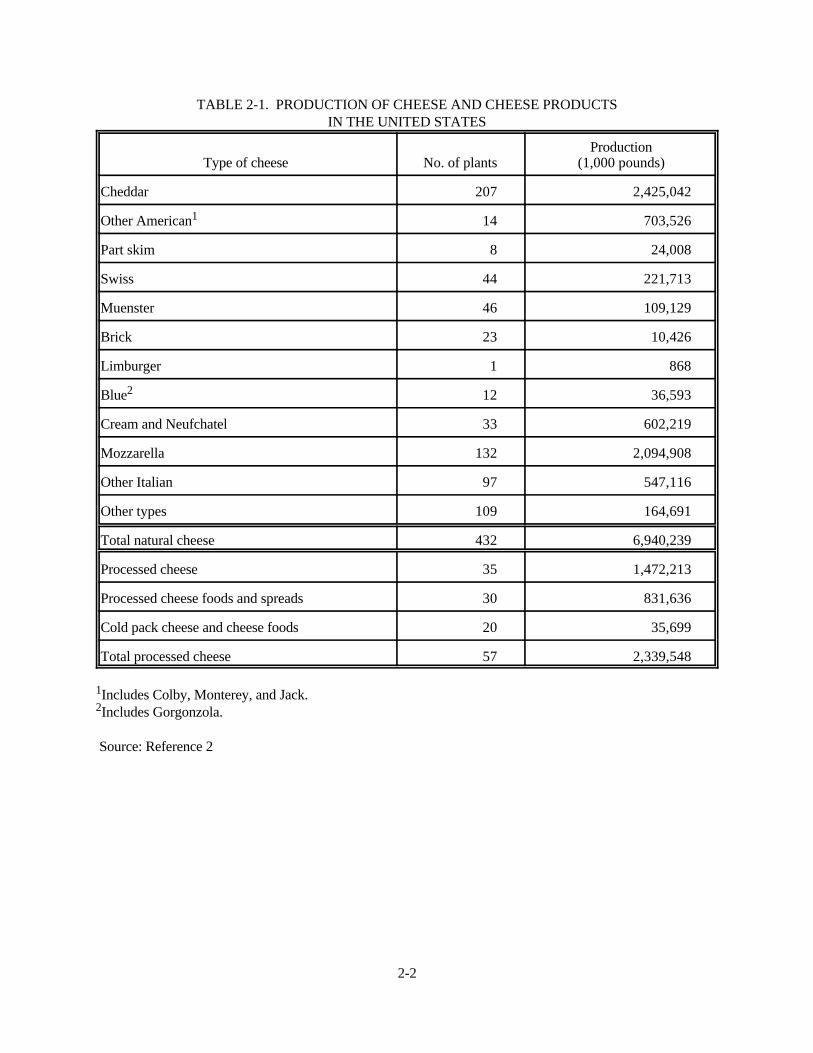
The total value of shipments for the natural and processed cheese industry (SIC 2022) was$18.2 billion in 1992. This figure has steadily increased since 1977. The total number of industryestablishments in the United States in 1995 was 432. The U. S. is one of the largest producers of cheese inthe world. In 1995, natural cheese production in the United States, excluding cottage cheeses, totalled6.9 billion pounds, and processed cheese production totalled 2.3 billion pounds. Wisconsin is the leadingproducer of cheese in the U. S., accounting for over 30 percent of all cheese production in the country. Table 2-1 presents 1995 production data for types of cheese and cheese products in the United States. Figure 2-1 shows the distribution of cheese manufacturing facilities in the United States (States with fewerthan three facilities are not shown).
2.2 PROCESS DESCRIPTION4-9
The basic concepts behind the production of cheese have changed little over its history. The basicprocess in which curd is formed from milk either by bacterial fermentation or addition of rennin (or acombination of these) to develop lactic acid, the subsequent removal of whey from the curd, and the furthertreatment of the curd to produce the many varieties of cheese remains very much the same. Some smallfactories in the United States still rely on traditional cheesemaking procedures, with much of the work doneby individuals. Most large-scale facilities, however, have mechanized the process, relying on sophisticatedequipment and automated processes.
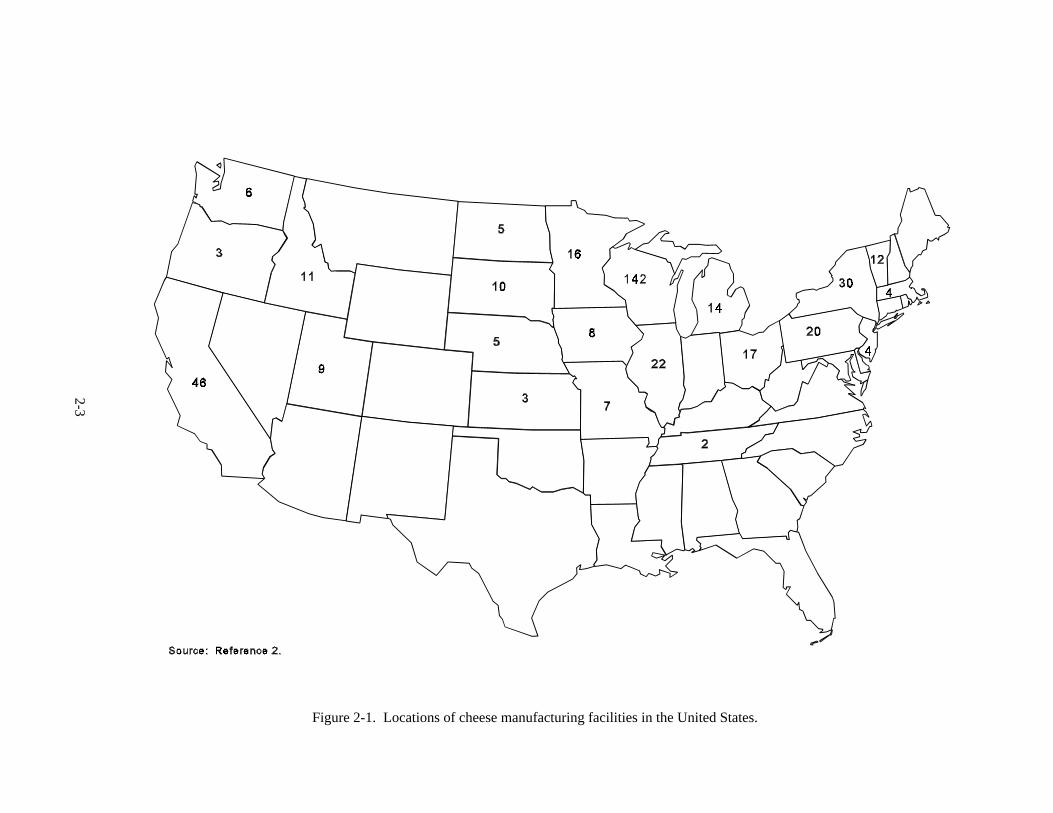
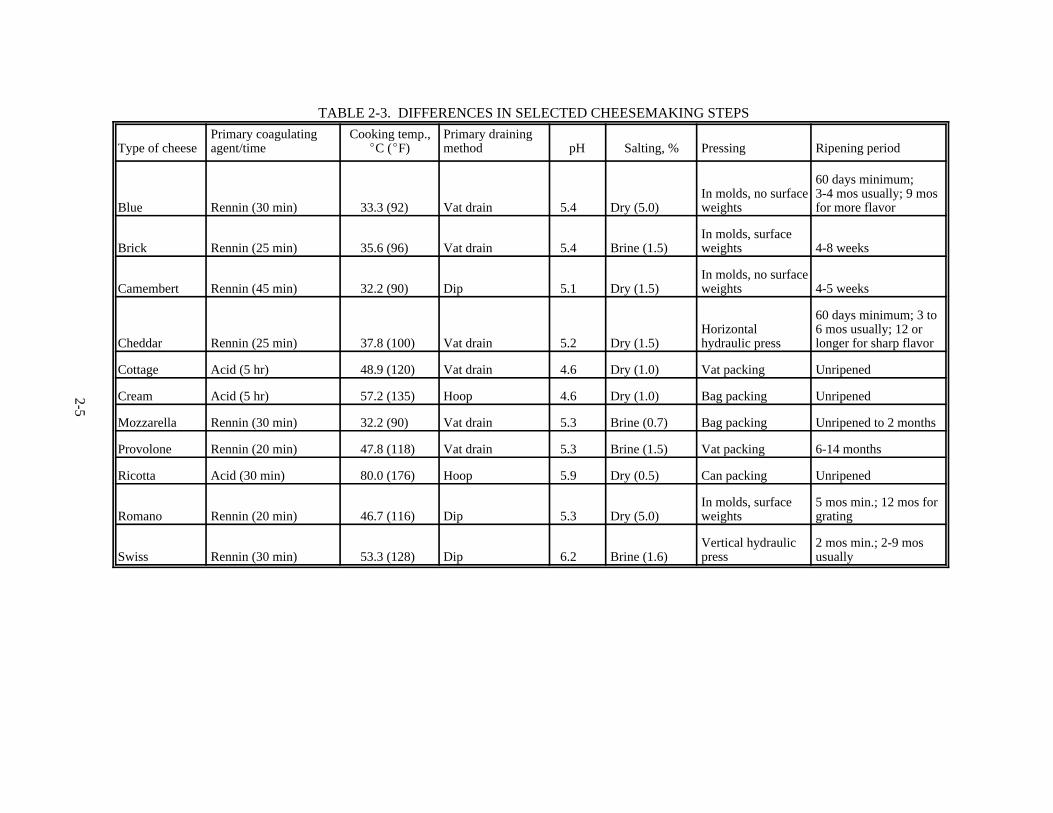
The modern manufacture of natural cheese consists of four basic steps: coagulating, draining, salting,and ripening. Processed cheese manufacture incorporates extra steps, including cleaning, blending, andmelting. Dairy products, such as milk or butter, may also be added to the processed cheese especially if it isintended for spreading. No two cheese varieties are produced by the same method. However, manufacturingdifferent varieties of cheese does not require widely different procedures but rather slight variations in one ormore steps, a change in the order of the process steps, special applications, and/or different ripeningpractices. The character of a particular variety of cheese is influenced by moisture content, the types ofmicroorganisms added, the temperatures and acidities of the production processes, the ripening conditions,and the percentage of fat in the milk used to make the cheese. Table 2-2 provides descriptions of severaltypes of natural cheeses. Table 2-3 details variations in the cheesemaking process characteristic of particularcheese varieties. The process described in this section is a generic description; steps specific to a singlecheese variety are mentioned but are not discussed in detail.
2-2
TABLE 2-1. PRODUCTION OF CHEESE AND CHEESE PRODUCTSIN THE UNITED STATES
Type of cheese No. of plantsProduction
(1,000 pounds)
Cheddar 207 2,425,042
Other American1 14 703,526
Part skim 8 24,008
Swiss 44 221,713
Muenster 46 109,129
Brick 23 10,426
Limburger 1 868
Blue2 12 36,593
Cream and Neufchatel 33 602,219
Mozzarella 132 2,094,908
Other Italian 97 547,116
Other types 109 164,691
Total natural cheese 432 6,940,239
Processed cheese 35 1,472,213
Processed cheese foods and spreads 30 831,636
Cold pack cheese and cheese foods 20 35,699
Total processed cheese 57 2,339,548
Includes Colby, Monterey, and Jack.1
Includes Gorgonzola.2
Source: Reference 2
2-3
Figure 2-1. Locations of cheese manufacturing facilities in the United States.
2-4
TABLE 2-2. CHARACTERISTICS OF SEVERAL TYPES OF NATURAL CHEESES
Processing Characteristics Typical varieties
Curd particles kept mattedtogether
Close texture; firm body Cheddar
Curd particles kept separate More open texture Colby, Monterey
Bacteria-ripened throughoutinterior with eye formation
Gas holes or eyes throughoutthe cheese
Swiss, Gouda, Samsoe, Edam
Prolonged curing period Granular texture; brittle body Parmesan, Romano
Pasta filata Plastic curd; threadlike or flaky Provolone, Mozzarella
Mold-ripened throughoutinterior
Visible grains of mold;piquant, spicy flavor
Blue, Roquefort, Stilton,Gorgonzola
Surface ripened primarily bybacteria and yeasts
Surface growth; soft, smooth,waxy body; mild to robustflavor
Brick, Limburger
Surface ripened primarily bymold
Edible crust; soft, creamyinterior; pungent flavor
Camembert, Brie
Curd coagulated primarily byacid
Delicate, soft curd Cream, Neufchatel, Cottage
Protein of whey or whey andmilk coagulated by acid andheat
Sweetish cooked flavor ofwhey
Ricotta, Gjetost
Source: Reference 6
2-5
TABLE 2-3. DIFFERENCES IN SELECTED CHEESEMAKING STEPS
Type of cheesePrimary coagulatingagent/time
Cooking temp.,EC (EF)
Primary drainingmethod pH Salting, % Pressing Ripening period
Blue Rennin (30 min) 33.3 (92) Vat drain 5.4 Dry (5.0)In molds, no surfaceweights
60 days minimum;3-4 mos usually; 9 mosfor more flavor
Brick Rennin (25 min) 35.6 (96) Vat drain 5.4 Brine (1.5)In molds, surfaceweights 4-8 weeks
Camembert Rennin (45 min) 32.2 (90) Dip 5.1 Dry (1.5)In molds, no surfaceweights 4-5 weeks
Cheddar Rennin (25 min) 37.8 (100) Vat drain 5.2 Dry (1.5)Horizontalhydraulic press
60 days minimum; 3 to6 mos usually; 12 orlonger for sharp flavor
Cottage Acid (5 hr) 48.9 (120) Vat drain 4.6 Dry (1.0) Vat packing Unripened
Cream Acid (5 hr) 57.2 (135) Hoop 4.6 Dry (1.0) Bag packing Unripened
Mozzarella Rennin (30 min) 32.2 (90) Vat drain 5.3 Brine (0.7) Bag packing Unripened to 2 months
Provolone Rennin (20 min) 47.8 (118) Vat drain 5.3 Brine (1.5) Vat packing 6-14 months
Ricotta Acid (30 min) 80.0 (176) Hoop 5.9 Dry (0.5) Can packing Unripened
Romano Rennin (20 min) 46.7 (116) Dip 5.3 Dry (5.0)In molds, surfaceweights
5 mos min.; 12 mos forgrating
Swiss Rennin (30 min) 53.3 (128) Dip 6.2 Brine (1.6)Vertical hydraulicpress
2 mos min.; 2-9 mosusually

2-6
Popular types of natural cheeses include unripened (e.g., cottage cheese, cream cheese), soft (e.g.,Brie, Camembert), semi-hard (e.g., Brick, Muenster), hard (e.g., Colby, Cheddar), blue veined (e.g., Blue,Gorgonzola), cooked hard cheeses (e.g., Swiss, Parmesan), and pasta filata (stretched curd, e.g., Mozzarella,Provolone). Examples of processed cheeses include American cheese and various cheese spreads, which aremade by blending two or more varieties of cheese or blending portions of the same type of cheese that are atdifferent stages of ripeness.
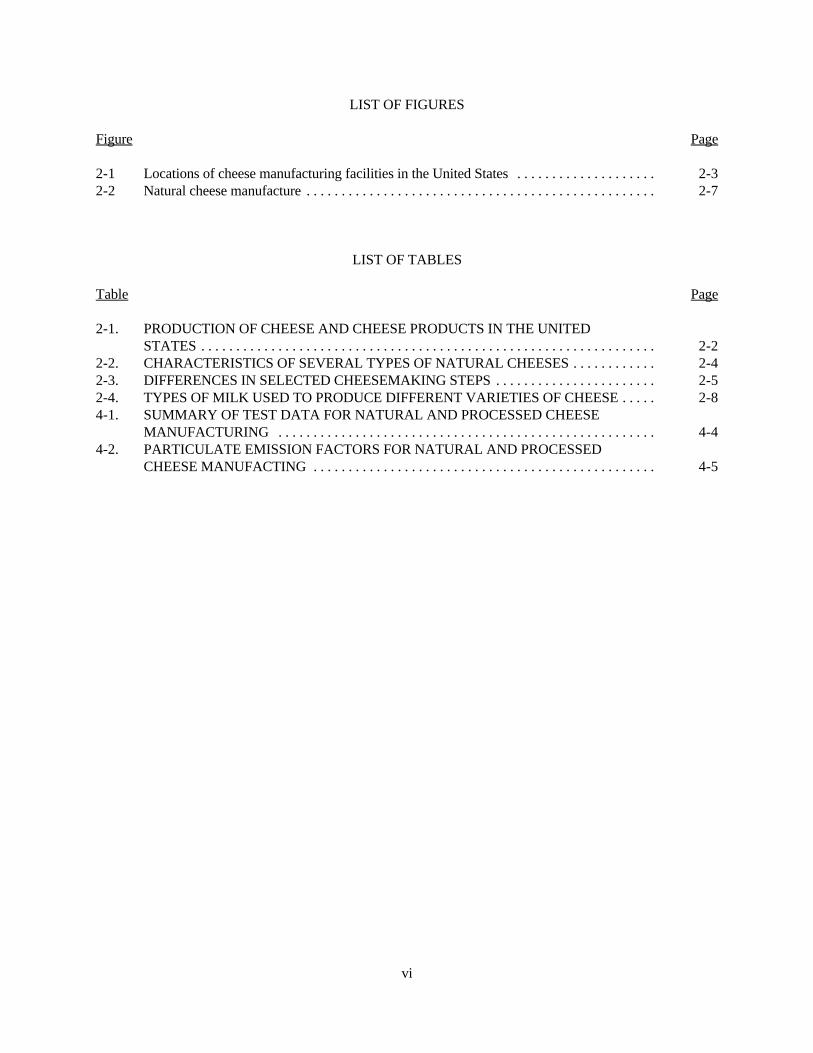
2.2.1 Natural Cheese Manufacture
The following sections describe the steps in the manufacture of natural cheese. Figure 2-2 presents ageneral process diagram.
2.2.1.1 Milk Preparation. Cheese can be made from cow, ewe, goat, or buffalo milk. Table 2-4shows the varieties of milk used to produce different types of cheese. Cow's milk is the most widely usedmilk in cheese processing. Cheese can be made from almost any form of milk, including whole milk, skimmilk, buttermilk, or cream. In the past, raw milk was used almost exclusively in cheesemaking; however, afocus on public safety has forced manufacturers to use heat-treated or pasteurized milk.
The milk is stored in silo tanks at the cheesemaking plant. These tanks are insulated or cooled tokeep the milk at the optimum storage temperature. In the tanks, the milk is agitated by a mechanical rotaryblade from top to bottom to prevent cream formation. After storage, the milk is homogenized to ensure aconstant fat level. A standardizing centrifuge, which skims off the surplus fat as cream through a controlvalve, is often used to obtain the fat levels appropriate for different varieties of cheese.
Homogenized milk is used in soft cheeses such as Brie, Camembert, and cream. This type of milkresults in less moisture and fat loss during ripening and increased surface area of the fat globules; thisincrease accelerates hydrolysis of milkfat by mold enzymes. For other cheeses, milk is filtered or clarified toremove suspended matter. In Swiss cheese, clarified milk improves the size and uniformity of eye formation;in Cheddar cheese, clarification improves the texture and firmness of the cheese.
Following homogenization, the milk is ready for heat treatment (pasteurization), which is necessaryto destroy harmful microorganisms and bacteria. Small volume factories are equipped with open and/orclosed vats, presses, and a hot water or steam boiler for heat treatment. Large-scale factories rely on enclosedheat exchangers, which may be the tubular or multi-plate type. All equipment and systems involved in milkpasteurization are connected so that outside air does not come in contact with the milk being processed. Anydisease-bearing bacteria present in the milk are destroyed by pasteurization, and the milk is ready forcoagulation.
2.2.1.2 Coagulation. Coagulation, or clotting of the milk, is the basis of cheese production. Coagulation is brought about by physical and chemical modifications to the constituents of milk and leads tothe separation of the solid part of milk (the curd) from the liquid part (the whey).
Coagulation is the physicochemical change of the casein (protein) in milk, due to the action of lacticacid and/or enzymes, into a protein network called a coagulum or gel. To initiate coagulation, milk is mixedwith a starter, which is a culture of harmless, active bacteria that will impart certain characteristics andqualities to the cheese. The starter sours the milk by fermenting the lactose (milk sugar) to lactic acid, whichcreates the acid conditions necessary for a special enzyme, rennin, to act. Lactic acid causes the formation ofcalcium lactate and the conversion of the calcium caseinate in the milk to casein.

CURD TREATMENT
COAGULATING VOC
CURD DRAININGDISPOSAL OR
FURTHER PROCESSING
WHEY
MILK PREPARATION(HOMEGENIZING, PASTEURIZING)
CURD KNITTING
SALTING
PRESSING
PACKAGING
RIPENING VOC
WHEY DRYER(3-02-030-10)
GRINDING, GRATING, OR SHREDDING
CHEESEDRYER
(3-02-030-20)
DRIEDCHEESE
PRODUCTS
PM, POSSIBLE VOC
PM, POSSIBLE VOC
PM
POSSIBLE VOC
2-7
Figure 2-2. Natural cheese manufacture.

2-8
TABLE 2-4. TYPES OF MILK USED TO PRODUCE DIFFERENT VARIETIES OF CHEESE
Cheese typeCow's milk,
wholeCow's milk,
lowfatCow's
milk, skim Goat's milk Sheep's milk Cream
Blue X X
Brick X
Camembert X
Cheddar X
Colby X
Cottage X X
Cream X X
Edam X
Feta X X X
Gouda X
Limburger X X
Monterey Jack X X X
Mozzarella X X
Muenster X
Neufchatel X X X
Parmesan X
Provolone X
Ricotta X X X
Romano X X
Roquefort X
Stilton X X
Swiss X
Source: Reference 9.
2-9
During coagulation, whey droplets appear on the surface of the coagulum and grow into a liquidenvelope; the curd is in a gel-like form. The coagulum decreases in volume as it expels water and solidconstituents. Most of the fat and protein from the milk are retained in the curd, but nearly all of the lactoseand some of the minerals, protein, and vitamins escape into the whey. Coagulation takes place in large pans,vats, or tanks, depending on the size of the cheesemaking facility.
Temperature and coagulation time vary and influence properties of the coagulum, such as cohesion. The temperature for milk coagulation is carefully controlled, varies with the type of cheese being made, and,for most kinds of cheeses, is between 22EC (72EF) and 35EC (95EF). Curd produced primarily by acidcoagulation results in the delicate, soft curd in cottage and cream cheeses. Table 2-3 provides the primarycoagulating agents and the coagulating times necessary for different varieties of cheese.
2.2.1.3 Curd Treatment. After formation in the coagulating vats, the curd is cut into small pieces. Cutting the curd speeds expulsion of the whey and contributes to a uniform cook-through of the curd byincreasing the surface area. The cutting occurs in the process vessel and is accomplished by hand or by usingmechanical cutting devices. The curd particles are cut into various sizes depending on the variety of cheesebeing made. For example, cutting the curd into small cubes reduces the moisture content of the curd, whereascreating larger cubes causes the curd to retain more moisture.
Following the cutting step, the curd is heated, or cooked, which contracts the curd particles to removewhey, develop texture, and establish moisture control. Cooking involves exposing the cut curds and whey toheat for specific time periods while agitating the product. Cooking may take place by different methods,including the use of direct steam, jacketed water, and radio-frequency. Cooking temperatures may varydepending on the variety of cheese being produced, from 32EC (90EF) for Mozzarella cheese (a high-moisture cheese) to 53EC (128EF) for Swiss cheese (a low-moisture cheese). For some high-moisturecheeses (for example, Colby and Monterey), the curds are washed with cool water to increase the moisturecontent of the curd. Table 2-3 provides the cooking temperatures required to produce typical varieties ofcheeses.
2.2.1.4 Curd Drainage. The next step in cheese manufacture, drainage, involves separating the wheyfrom the curd. Drainage reduces the curd to a definite water content and controls the demineralization(migration of calcium into the whey) and the removal of lactose from the curd. The process can beaccelerated by either heat treatment or mechanical treatment, such as cutting, stirring, oscillating, or pressing.
In large-scale facilities, the draining system typically consists of a long rectangular tank with amoveable screen belt as a base. One end of the tank has a liquid-tight, but moveable door. The curd/wheymixture travels along a conveyor from the curd vat into the tank. The whey drains through the base screen,leaving the curd level and dry. After the curd is dry, it moves through the open end of the tank and is cut intoblocks. These blocks can then be filled into cheese hoops for further draining and pressing.
Other types of draining methods include vat drainage, hoop drainage, and dipping. During vatdrainage, cubes of curd are left immersed in the whey and agitated to prevent them from sticking together; thewhey is later decanted and hoop drainage sometimes follows. For hoop drainage, a mass of curd is put intocloth-lined cylindrical metal hoops. The whey separates from the curd by draining through the cloth. Thisprocess is usually accompanied by lateral pressing. The dipping method involves ladling the curds out of thevat into perforated molds. The whey is slowly drained off through the activity of lactic acid bacteria withinthe cheese and the turning of the molds. Table 2-3 gives the primary draining methods for a variety ofcheeses.

2-10
For some cheeses, special applications and procedures occur immediately before, during, or after thedraining stage. For example, internally ripened, or blue-veined, cheeses (e. g., Blue, Roquefort) are usuallyseeded with penicillium powder prior to drainage. Cooked hard cheeses (e. g., Parmesan) are stirred andwarmed to accelerate and complete the separation of the whey. Flavorings can also be added to cheesesduring the drainage stage.
The separated whey may be treated and disposed of; shipped offsite in liquid or concentrated formfor use as animal feed; used to make whey cheese; dried for lactose, mineral, or protein recovery; or dried foruse as a food additive or in the manufacture of processed cheese. Fluid cheese whey is very rich nutritionally,retaining many of the nutrients of the milk used in the cheese manufacture. In the manufacture of wheycheese, the whey is strained, heated, and stirred; milk is added to facilitate formation of the curd; and stirringis stopped when a thick layer of curd forms on the surface. Heating is stopped when the curd layer breaks,and the curd layer is removed and drained. When drained sufficiently, the solid cheese is soft and has a shortshelf life. The whey cheese may also be salted and dried.
2.2.1.5 Curd Knitting. Knitting, or transforming, the curd allows the accumulating lactic acid tochemically change the curd; knitting also includes salting and pressing. This step leads to the characteristictexture of different varieties of cheese and, therefore, varies according to the particular variety. During thecurd knitting stage, Cheddar cheese is "cheddared"; Brick and Blue cheeses undergo preliminary packaging;Provolone and Mozzarella cheeses are pulled and processed (these cheeses are then kneaded, drawn, shaped,and smoothed); a bean gum or some other type of gum is added to cream cheese to stabilize and stiffen it; anda creaming agent (cream and/or milk) is added to cottage cheese. During this period, specific pH levels arecontrolled to produce different varieties of cheese (see Table 2-3).
After knitting, the cheese is salted. This step consists of manually or mechanically spreading coarsesalt over the curd surfaces or immersing the pressed cheese in a salt solution or brine. In some instances, thecheese is loaded on racks that are lowered into brine tanks. Large tanks may circulate the brine throughoutthe tank to speed up the process.
Salting further completes the drainage of the cheese by helping remove residual water. It also affectsrind formation, growth of microorganisms, and enzyme activity. Salting the cheese improves its flavor,texture, and appearance. When the salting process is finished, the salt is concentrated in the surface layers ofthe cheese but continues to migrate into the cheese over time, creating a concentration gradient. The saltcontent of most varieties of cheese varies from about one percent in cottage and cream cheeses to about fivepercent in Parmesan and Blue cheeses. Table 2-3 provides the salting method and salt percentage necessaryto produce a particular variety of cheese.
The next step, pressing, determines the characteristic shape of the cheese by compacting the texture,extruding free whey from the curds, and completing the curd knitting. Pressing involves confining the wet,warm curds in a constricted wooden or metal form or cloth bag. Depending on the type of cheese, externalweights (often hydraulic pressure plates) are used, or the curd is allowed to rest on itself in a vat for a fixedperiod of time. With some cheeses, vertical pressing is used; others require vacuum pressing to removeoccluded air and give a close-knit body. Multi-row, tunnel automated presses have become common in largefacilities. See Table 2-3 for the different pressing practices for various cheeses.
2.2.1.6 Ripening. During the ripening or curing stage, the varieties of cheeses acquire their ownunique textures, aromas, appearances, and tastes through physical and chemical changes that occur in thebody and rind. The cheese is populated by microorganisms and is transformed by the action of enzymesoriginally present in the curd or produced by bacterial synthesis. The complex biochemical reactions are
2-11
controlled as much as possible by adjusting temperature, humidity, and duration of ripening. Unripenedcheeses include cottage and cream cheeses and are generally ready for consumption after the curd has beencollected. Because they are not ripened, they usually have a bland flavor and soft body.
Some cheeses require the application of a special ripening agent to create a particular taste or texture. For example, some cheeses rely wholly on surface bacteria and yeast applied to their exteriors for curing andripening; these cheeses are called "surface-ripening" cheeses and include Brick, Brie, Camembert, Limburger,and Muenster. Others require injection of particular bacteria and molds (e. g., Blue) or gas-formingmicroorganisms (e. g., Swiss).
For those cheeses ripened primarily by surface bacteria, cheese makers massage the surface of afreshly salted cheese block to uniformly spread the desirable bacteria. In a mechanized process, the bacteriaare smeared onto the surface of the cheese block with a cheese brushing machine. The bacteria break downpart of the cheese protein during ripening, resulting in the characteristic flavor and aroma of Brick andMuenster cheeses.
For those cheeses ripened primarily by mold, mold spores are injected into the cheese after draining(e. g., Blue cheese) or smeared in a manner similar to those ripened by bacteria (e. g., Brie cheese). For thosethat are injected, air passages are bored into the cheese to encourage the growth of the mold. This processresults in the crumbly texture and characteristic flavor of Blue and Roquefort cheeses.
Three types of rooms are used in succession for ripening cheeses: the drying room; the cellars orother premises for preripening or ripening; and the cold room for storage. Each room is thermally insulatedand maintained at a constant temperature and humidity by an air conditioning system. After salting, thecheeses are placed in the drying room at 10E to 14EC (50E to 57EF) and 60 to 80 percent relative humidity. Excess water that appears on the surface of the cheese is quickly removed by the cool air. The cheeses arekept in this environment for several hours to several days. Preripening is sometimes carried out for softcheeses at a slightly higher temperature and lower humidity than the end stages of ripening, but most of thetime, ripening is carried out under constant conditions. It is important to maintain the ripening room at theatmospheric conditions and temperatures appropriate for the desired variety of cheese, since the ripeningprocess has a major influence on the texture and taste of a cheese. Some ripening rooms are also equipped tofunction as cold storage rooms. In these, the unwrapped cheeses are kept at a very low temperature and highhumidity to prevent them from drying out. For short term storage before shipment, it is more practical tohave a specialized cold storage room that keeps wrapped cheeses at 1E to 5EC (34E to 51EF) without the needto maintain a high humidity, because maintaining a high humidity consumes a great deal of energy. Maintaining a controlled humidity and temperature is important, and most manufacturers have ripeningrooms in which the temperature and humidity are automatically controlled with regulated ventilation. Infacilities where large amounts of cheese are conveyed to and from storage, racks or grids on wheels arecommonly used, which allow the cheese to be automatically turned.
It is during the ripening stage that the rind or crust forms on the cheese's surface. The rind firstappears as an outer layer of curd that is denser and less moist than the rest of the curd. The rind controls theloss of moisture from the internal part of the cheese and regulates the escape of gases released duringripening.
Conditions during ripening vary for different cheeses. For example, soft cheeses are usually ripened12 to 30 days at 10E to 14EC (50E to 57EF) and 90 to 95 percent humidity, while Cheddar cheeses can beripened from 3 months to a year at 5E to 12EC (41E to 54)EF) and 87 to 95 percent humidity. Cheesesripened by internal mold (blue-veined cheeses) usually require 15 to 60 days at 4E to 12EC (39E to 54EF) and

2-12
85 to 95 percent humidity. Changes in composition during ripening include lactose fermentation anddegradation of lactic acid, hydrolysis of fats and conversion of fatty acids, and degradation of proteins andconversion of amino acids. See Table 2-3 for a list of the curing and ripening conditions for differentcheeses.
2.2.1.7 Preserving and Packaging. Modern cheese packaging protects the food frommicroorganisms and saves on waste and moisture loss. Ripened cheeses must undergo special proceduresduring packaging for preservative reasons. Unripened cheeses (cottage and cream cheeses) are packagedimmediately after the curd is collected. These cheeses are packaged by automatic machines in moisture-proofcontainers. Because these cheese are highly perishable, they must be immediately refrigerated.
Many ripened cheeses are coated in wax to protect them from mold contamination and to reduce therate of moisture loss. Cheeses that naturally develop a thick, tightly woven rind, such as Swiss, do not requirewaxing. Before waxing, the cheese is dried on the cheese shelves at 10E to 16EC (50E to 60EF) at a relativehumidity of 65 to 70 percent for 3 days and is turned daily. The waxing process takes place in a steampressure, electric-heated wax tank into which a paraffin wax block is placed. The wax is heated and thecheese is then submerged in the wax for 5 to 6 seconds and allowed to dry for 1 minute. After the wax hascooled and solidified, it is rinsed with warm water to enhance surface luster. If necessary, the cheese may berewaxed within a few days. The cheese is then ready for commercial packaging.
A second method of ripened cheese packaging involves applying laminated cellophane films tounwaxed cheese surfaces. The most common packaging film consists of two laminated cellophane sheets anda brown paper overlay necessary for shipping. A variation includes a metal foil wrap. During packaging, amechanical lifter applies a sheet of film to a block of cheese traveling along a conveyor. The block thenreaches an evacuator area where the air between the cheese and the film is removed, resulting in an air-tightseal. A similar process is used to vacuum-pack rindless cheese. This procedure involves wrapping the cheesein a film, subjecting it to a partial vacuum, and exposing the product to high heat (approximately 77EC[171EF]) which shrinks the film to tightly conform to the cheese.
2.2.2 Processed Cheese Manufacture
Nearly one-third of all cheese produced in the United States consists of processed cheese andprocessed cheese products. There are many different types of final products in processed cheese manufacture. These cheeses are distinguished from one another not only by their composition (cheese used, texture,additives, etc.) but by their presentation as individual portions, individual slices, rectangular blocks, or specialpresentation as cylinders or tubes.
Processed cheese was developed around the end of the 19th century when several European countrieswanted to export cheeses to hot-climate countries but had problems keeping the product cool throughoutmanufacture and distribution. Soft cheese could simply be put into cans and heat treated to effectivelypasteurize the cheese, but this process did not work for hard cheeses. To produce processed cheese from hardcheese, the rind must be removed and the cheese warmed to about 80EC (176EF) and stirred with sodiumcitrate or sodium polyphosphates to form a mixture, which can be packaged while hot and cooled to form agel.
Processed cheese is made by pasteurizing, emulsifying, and blending natural cheeses only; it containsno other ingredients. Processed cheese foods, spreads, and cold pack cheeses, however, contain additionalingredients, such as nonfat milk solids and condiments. Several varieties of natural cheeses may be mixed(emulsifying salts are always added to this mixture) and powdered milk, whey, cream or butter, and water

2-13
may be added. The mixture is then heated and stirred to evenly distribute the ingredients and create ahomogenous mixture. The following section describes the basic steps necessary for producing pasteurizedprocess cheese, the most common processed cheese.
2.2.2.1 Pasteurized Process Cheese. Cheeses are selected to be processed from both mild and sharpcheeses by choosing those whose flavor and texture will readily blend to produce a uniform product. Forexample, American cheese is made from Cheddar and Colby cheeses. Once selected, the cheeses must beanalyzed for their fat and moisture contents to determine the proper amount of emulsifiers and salts to beadded.
Cheese surfaces are cleaned by scraping and trimming, and the rinds are removed. After cleaning,the cheese blocks are ground. The cheese mixture then passes through continuous cookers, where the mixtureis heated to 130E to 145EC (266E to 293EF) for 2 to 3 minutes. The temperature and time are closelymonitored to avoid browning and thickening of the product. The melted cheese separates into a fat and serumand emulsifiers are added to disperse the fat. The cheese mass becomes uniform, homogeneous, and smoothin texture.
The molten cheese is removed quickly from the cookers and is pumped or dropped into packaginghoppers. The cheese is packaged in the absence of oxygen to inhibit the growth of mold. The cheese isusually wrapped in lacquered aluminum foil or in aluminum foil-lined cardboard or plastic boxes. For slicedprocessed cheese, the molten cheese is spread uniformly by chilled steel rollers and cut by rotary knives toconsumer size.
2.2.2.2 Processed Cheese Foods. Other processed cheese products are manufactured usingprocedures similar to that for pasteurized process cheese. For example, to produce pasteurized processcheese food, one or more of the following optional dairy ingredients are added: cream, milk, skim milk,buttermilk, and/or cheese whey. The result is a processed cheese food that is higher in moisture and lower infat than pasteurized process cheese. After heating, processed cheese intended for spreading undergoes acreaming step. This step includes mechanical kneading of the hot cheese and addition of various dairyproducts, such as milk, which promotes creaming, and whey, which reduces the viscosity of the mixture. Anedible stabilizer and gums or gelatins are also added to give the food a spreading quality. Other processedcheese products include cold-packed cheese, cold-packed cheese food, and reduced fat cheeses. Processedcheeses may be enhanced with salt, artificial colorings, spices or flavorings, fruits, vegetables, and meats.
Grated and powdered cheeses are produced by removing the moisture from one or more varieties ofcheeses and grinding, grating, or shredding the cheese(s). Mold-inhibiting ingredients and anticaking agentsmay be added as well. For example, a Cheddar cheese powder may contain aged Cheddar cheese, sodiumphosphate, salt, lactic acid, and color, and have a moisture content of 3 to 4 percent. A grated cheese usuallyhas 14 to 18 percent moisture. Dehydration takes such forms as tray drying, spray or atomized drying, andfreeze drying. Popular types of grated cheese include Parmesan, Romano, Mozzarella, and Cheddar. Cheesepowders, such as those made from Cheddar cheese, may be used to flavor pasta, or added to bread dough,potato chips, or dips.
2.3 EMISSIONS
Particulate emissions from cheese manufacture occur during cheese drying and whey drying, and mayoccur when cheese is grated or ground before drying. Cheese dryers are used in the manufacture of grated orpowdered cheeses. Whey dryers are used in some facilities to dry the whey after it has been separated fromthe curd following coagulation. Emissions of CO occur during drying, but may be primarily due to fuel2
2-14
combustion, especially if the dryer is direct-fired. VOC emissions may occur during the coagulation and/orripening stages.
2.4 EMISSION CONTROL TECHNOLOGY
Particulate emissions from cheese and whey dryers are controlled by wet scrubbers or fabric filters. Cyclones are also used to control particulate emissions and for product recovery.
REFERENCES FOR SECTION 2
1. 1992 Census of Manufactures: Dairy Products, U.S. Department of Commerce, Bureau of Census,Washington, DC, 1994.
2. U. S. Department of Agriculture, National Agriculture Statistics Service, Dairy Products 1995Summary, Washington, DC, April 1996. http://usda.mannlib.cornell.edu/reports
3. B. Battistotti, et al., Cheese: A Guide to the World of Cheese and Cheesemaking, Facts On FilePublications, NY, 1984.
4. A. Eck, ed., Cheesemaking: Science and Technology, Lavoisier Publishing, New York, 1987.
5. A. Meyer, Processed Cheese Manufacture, Food Trade Press Ltd., London, 1973.
6. Newer Knowledge of Cheese and Other Cheese Products, National Dairy Council, Rosemont, IL, 1992.
7. M.E. Schwartz, Cheesemaking Technology, Noyes Data Corporation, Park Ridge, NJ, 1973.
8. F. Kosikowski, Cheese and Fermented Milk Foods, Edwards Brothers, Ann Arbor, MI, 1977.
9. New Standard Encyclopedia, Vol.4, "Cheese," Standard Educational Corporation, Chicago, IL, pp. 238-240.
3-1
3. GENERAL DATA REVIEW AND ANALYSIS PROCEDURES
3.1 LITERATURE SEARCH AND SCREENING
Data for this investigation were obtained from a number of sources within the Office of Air QualityPlanning and Standards (OAQPS) and from outside organizations. The Factor Information and Retrieval(FIRE), Crosswalk/Air Toxic Emission Factor Data Base Management System (XATEF), and VOC/PMSpeciation Data Base Management System (SPECIATE) data bases were searched for identification of thepotential pollutants emitted and emission factors for those pollutants.
Information on the industry, including number of plants, plant location, and annual productioncapacities, was obtained from the Census of Manufactures and the USDA's Dairy Products 1995 Summary. The Aerometric Information Retrieval System (AIRS) data base also was searched for data on the number ofplants, plant location, and estimated annual emissions of criteria pollutants. A number of sources ofinformation were investigated specifically for emission test reports and data. The Source Test InformationRetrieval System (STIRS) data base was searched for test reports from cheese manufacturing facilities. TheEPA library was searched for additional test reports. Using information obtained on plant locations, Stateand Regional offices were contacted about the availability of test reports. In addition, representative tradeassociations, including the American Cheese Society, were contacted for assistance in obtaining informationabout the industry and emissions.
To screen out unusable test reports, documents, and information from which emission factors couldnot be developed, the following general criteria were used:
1. Emission data must be from a primary reference:
a. Source testing must be from a referenced study that does not reiterate information from previousstudies.
b. The document must constitute the original source of test data. For example, a technical paper wasnot included if the original study was contained in the previous document. If the exact source of the datacould not be determined, the document was eliminated.
2. The referenced study should contain test results based on more than one test run. If results fromonly one run are presented, the emission factors must be down rated.
3. The report must contain sufficient data to evaluate the testing procedures and source operatingconditions (e. g., one-page reports were generally rejected).
A final set of reference materials was compiled after a thorough review of the pertinent reports,documents, and information according to these criteria.
3.2 DATA QUALITY RATING SYSTEM1
As part of the analysis of the emission data, the quantity and quality of the information contained inthe final set of reference documents were evaluated. The following data were excluded from consideration:
3-2
1. Test series averages reported in units that cannot be converted to the selected reporting units;
2. Test series representing incompatible test methods (i.e., comparison of EPA Method 5 front halfwith EPA Method 5 front and back half);
3. Test series of controlled emissions for which the control device is not specified;
4. Test series in which the source process is not clearly identified and described; and
5. Test series in which it is not clear whether the emissions were measured before or after the controldevice.
Test data sets that were not excluded were assigned a quality rating. The rating system used was thatspecified by EFIG for preparing AP-42 sections. The data were rated as follows:
A—Multiple test runs that were performed using sound methodology and reported in enough detailfor adequate validation. These tests do not necessarily conform to the methodology specified in EPAreference test methods, although these methods were used as a guide for the methodology actually used.
B—Tests that were performed by a generally sound methodology but lack enough detail for adequatevalidation.
C—Tests that were based on an unproven or new methodology or that lacked a significant amount ofbackground information.
D—Tests that were based on a generally unacceptable method but may provide an order-of-magnitude value for the source.
The following criteria were used to evaluate source test reports for sound methodology and adequatedetail:
1. Source operation. The manner in which the source was operated is well documented in the report. The source was operating within typical parameters during the test.
2. Sampling procedures. The sampling procedures conformed to a generally acceptablemethodology. If actual procedures deviated from accepted methods, the deviations are well documented. When this occurred, an evaluation was made of the extent to which such alternative procedures couldinfluence the test results.
3. Sampling and process data. Adequate sampling and process data are documented in the report,and any variations in the sampling and process operation are noted. If a large spread between test resultscannot be explained by information contained in the test report, the data are suspect and are given a lowerrating.
4. Analysis and calculations. The test reports contain original raw data sheets. The nomenclatureand equations used were compared to those (if any) specified by EPA to establish equivalency. The depth ofreview of the calculations was dictated by the reviewer's confidence in the ability and conscientiousness of thetester, which in turn was based on factors such as consistency of results and completeness of other areas ofthe test report.
3-3
3.3 EMISSION FACTOR QUALITY RATING SYSTEM1
The quality of the emission factors developed from analysis of the test data was rated using thefollowing general criteria:
A—Excellent: Developed from A- and B-rated source test data taken from many randomly chosenfacilities in the industry population. The source category is specific enough so that variability within thesource category population may be minimized.
B—Above average: Developed only from A- or B-rated test data from a reasonable number offacilities. Although no specific bias is evident, it is not clear if the facilities tested represent a random sampleof the industries. The source category is specific enough so that variability within the source categorypopulation may be minimized.
C—Average: Developed only from A-, B- and/or C-rated test data from a reasonable number offacilities. Although no specific bias is evident, it is not clear if the facilities tested represent a random sampleof the industry. In addition, the source category is specific enough so that variability within the sourcecategory population may be minimized.
D—Below average: The emission factor was developed only from A-, B-, and/or C-rated test datafrom a small number of facilities, and there is reason to suspect that these facilities do not represent a randomsample of the industry. There also may be evidence of variability within the source category population. Limitations on the use of the emission factor are noted in the emission factor table.
E—Poor: The emission factor was developed from C- and D-rated test data, and there is reason tosuspect that the facilities tested do not represent a random sample of the industry. There also may beevidence of variability within the source category population. Limitations on the use of these factors arefootnoted.
The use of these criteria is somewhat subjective and depends to an extent upon the individualreviewer. Details of the rating of each candidate emission factor are provided in Section 4.
REFERENCE FOR SECTION 3
1. Procedures for Preparing Emission Factor Documents, EPA-454/B-93-050, Office of Air QualityPlanning and Standards, U. S. Environmental Protection Agency, Research Triangle Park, NC, September1995.

4-1
4. REVIEW OF SPECIFIC DATA SETS
This section describes how the AP-42 section on natural and processed cheese was developed. First,descriptions of data sets that were reviewed for this report are presented, followed by a discussion of howcandidate emission factors were developed from the data.
4.1 REVIEW OF SPECIFIC DATA SETS
Seven emission test reports containing data on particulate emissions from cheese and whey dryingwere reviewed. Emission factors were developed from all seven documents. A review of the references isprovided in the following paragraphs.
4.1.1 Reference 1
This report documents a March 30, 1993, particulate emissions test conducted on a Parmesan cheesedryer controlled by a scrubber. The dryer is direct-fired with natural gas and has a rated capacity of 6,250pounds of dry product per hour. Testing was performed at the both inlet and outlet of the scrubber. Particulate emissions were quantified using Method 5 and included measurements of both filterable andcondensible PM (organic and inorganic). Orsat analysis was used to measure CO emissions. Three test runs2were performed at the control device inlet and outlet. Each run lasted 1 hour and no problems were reported. No details about the process were given and an average production rate during testing was reported. Thesedata are rated B, except for the condensible inorganic PM (CIPM) data from the scrubber outlet testing. These data are not rated because they were higher than the CIPM data from the inlet testing. Therefore, theCIPM test data from the scrubber outlet were not used to develop emission factors.
4.1.2 Reference 2
This report documents a particulate emissions test conducted December 28, 1988, on a Cheddarcheese dryer controlled by a venturi scrubber. The dryer is direct-fired with natural gas. Particulateemissions were measured using Method 5 and included measurements of filterable, condensible inorganic,and condensible organic PM. Orsat analysis was used to measure CO emissions. Three 1-hour test runs2were conducted at the outlet of the control device, and no problems were reported during the test. No detailson the process were given and an average production rate during testing was reported. These data are ratedB.
4.1.3 Reference 3
This report documents a particulate emissions test on a Cheddar cheese dryer conducted onMarch 29, 1990. The dryer tested is a spray dryer direct-fired with natural gas. It is controlled by a venturiscrubber. Three one-hour runs were conducted using Method 5. Filterable, condensible inorganic, andcondensible organic PM were measured, and no problems were reported during testing. Orsat analysis wasused to measure CO emissions. No details about the process were given. These data are rated B.2
4.1.4 Reference 4
This report documents a particulate emissions test on a whey dryer. The whey is dried in two stages. First, the whey concentrate is sprayed under pressure into the primary dryer; then, the partially dehydratedpowder passes to a secondary dryer for final drying. The emission source tested was the primary dryer, whichis fired with natural gas. The production rate during the test averaged 5,549 pounds of dry product per hour.
4-2
Emissions from the dryer are controlled by two cyclones; no information was given on the types of cyclonesor their operating parameters. Testing was stopped after two runs, when emissions did not look normal toplant personnel. It was discovered that a cyclone was plugged. Three more one-hour runs were thenconducted, using Method 5 to measure filterable and condensible PM; runs 3-5 are reported in this documentand were used to develop emission factors. Orsat analysis was used to measure CO emissions. These data2are rated B.
4.1.5 Reference 5
This report documents particulate emissions testing on a whey drying and bagging process onMarch 29, 1988. The dryer has a rated capacity of 2,500 pounds of dry product per hour (5,000 pounds perhour at 50 percent moisture) and is direct-fired with natural gas. The drying system emissions are controlledby a venturi scrubber followed by a cyclone. Emissions from the bagging operation are controlled by abaghouse, with emissions from the baghouse vented back to the main exhaust duct, just before the venturiscrubber. There are also four product recovery cyclones, but emissions from these cyclones are kept withinthe dryer system. Method 5 was used to measure filterable, condensible organic, and condensible inorganicPM emissions; three 1-hour runs were conducted. Orsat analysis was used to measure CO emissions. No2problems were reported during the test. These data are rated A.
This source test present results froma combination of two operations which cannot be separated intodryer emissions and bagger emissions. All other cited whey dryer test results are only for dryer emissions;therefore, the results of this test are cited in Table 4-1 but are not used for emission factor development.
4.1.6 Reference 6
This report documents particulate emissions testing conducted on a whey dryer on November 8,1988. The dryer is direct-fired with natural gas and has a rated output capacity of 4,000 pounds per hour. Particulate emissions from the dryer are controlled by a fabric filter system. Method 5 was used to measurefilterable, condensible organic, and condensible inorganic PM emissions; only two 100-minute runs wereperformed (the sampling time was increased because of poor flow distribution). Orsat analysis was used tomeasure CO emissions. No details about the process were given. These data are rated B.2
4.1.7 Reference 7
This report documents particulate testing on a whey dryer on April 20, 1989. The whey slurry issprayed into the drying chamber of the dryer and falls onto a moving belt where additional drying and coolingtake place. Emissions are controlled by a series of cyclones, followed by a wet scrubber. The dryer has anormal production rate of 22,000 to 27,000 pounds per hour at 50 to 54 percent solid whey concentrate. Measurements of condensible and filterable PM emissions were made using Method 5. Emissions of CO2were measured using Orsat analysis. Three 72-minute runs were performed. During Run 3, there wereproblems maintaining the spray pattern in the dryer and plugging in the dry powder receiver, but these eventsdo not appear to have influenced the test results. The average production rate during testing was reported. These data are rated B. The condensible organic PM data are not rated because the tare weight of theparticulate was less than the measured blank weight; a value of zero was used for that data.
4-3
4.2 DEVELOPMENT OF CANDIDATE EMISSION FACTORS
Table 4-1 summarizes the emission data used to develop emission factors for cheese and whey dryingduring natural and processed cheese manufacturing. The emission factors for natural and processed cheesemanufacture are presented in Table 4-2. The following paragraphs describe how the data presented inTable 4-1 were used to develop emission factors for the AP-42 section on natural and processed cheese.
4.2.1 General Procedures
The data sets were screened and evaluated, and the candidate emission factors were rated accordingto the criteria presented in Sections 3.2 and 3.3 of this report. The candidate emission factors generally weredeveloped by grouping the data from similar combinations of source and control device, discarding inferiordata sets, and averaging the emission factor derived from each data set. Factors for particulate emissionsfrom cheese dryers and whey dryers are presented in kg/Mg and lb/ton.
4.2.2 Cheese Dryers
Because there were only three tests for cheese dryers, the data were combined and emission factorsfor filterable PM, condensible organic PM, and condensible inorganic PM were developed for dryerscontrolled by a wet scrubber. The condensible inorganic PM factor from Reference 1 that was not rated wasexcluded from the emission factor calculations. All data used were rated B. Due to the small amount of dataavailable, these factors are rated D. Data representing uncontrolled emissions (inlet data from reference 1)were available for only one test; emission factors were not developed based on this single test.
4.2.3 Whey Dryers
There were four tests with emissions data from whey dryers. Data from three tests were used todevelop emission factors for filterable PM, condensible organic PM, and condensible inorganic PM emissionsfrom whey dryers. Factors were developed from A- and B-rated data and are rated D. The factor forcondensible organic PM emissions from whey dryers controlled by a scrubber was not rated because ofanalysis problems. Data from one test for whey drying and bagging operations were not used to developemission factors.

4-4
TABLE 4-1. SUMMARY OF TEST DATA FOR NATURAL AND PROCESSEDCHEESE MANUFACTURING
Process APCD Pollutant No. of runs Data rating Ref. No.Min Max Avg Avg
Emission factor
lb/ton kg/Mg
Cheese drying None Filterable PM 3 B 0.47 0.83 0.63 0.32 1
Cheese drying Wet Filterable PM 3 B 0.16 0.43 0.27 0.14 1scrubber
Cheese drying None Condensible 3 B 0.024 0.060 0.043 0.021 1organic PM
Cheese drying Wet Condensible 3 B 0.021 0.048 0.033 0.017 1scrubber organic PM
Cheese drying None Condensible 3 B 0.12 0.46 0.25 0.13 1inorganic PM
Cheese drying Wet Condensible 3 NR 0.26 0.58 0.47 0.23 1scrubber inorganic PM
Cheese drying Venturi Filterable PM 3 B 4.3 5.1 4.6 2.3 2scrubber
Cheese drying Venturi Condensible 3 B 0.30 0.47 0.39 0.19 2scrubber inorganic PM
Cheese drying Venturi Condensible 3 B 0.13 0.58 0.36 0.18 2scrubber organic PM
Cheese drying Venturi Filterable PM 3 B 2.0 3.6 2.6 1.3 3scrubber
Cheese drying Venturi Condensible 3 B 0.12 0.29 0.19 0.094 3scrubber inorganic PM
Cheese drying Venturi Condensible 3 B 0.73 1.1 0.92 0.46 3scrubber organic PM
Whey drying Cyclone Filterable PM 3 B 0.72 0.85 0.77 0.39 4
Whey drying Cyclone Condensible PM 3 B 0.63 1.0 0.75 0.38 4
Whey drying and Venturi Filterable PM 3 A 0.40 0.45 0.42 0.21 5bagging scrubber
and cyclone
Whey drying and Venturi Condensible 3 A 0.14 0.44 0.28 0.14 5bagging scrubber inorganic PM
and cyclone
Whey drying and Venturi Condensible 3 A 0.082 0.15 0.11 0.053 5bagging scrubber organic PM
and cyclone
Whey drying Fabric filter Filterable PM 2 B 1.9 2.4 2.2 1.1 6
Whey drying Fabric filter Condensible 2 B 0.011 0.083 0.047 0.024 6inorganic PM
Whey drying Fabric filter Condensible 2 B 0.056 0.14 0.10 0.048 6organic PM
Whey drying Cyclone and Filterable PM 3 B 0.65 0.86 0.76 0.38 7Wetscrubber
Whey drying Cyclone and Condensible 3 B 0.020 0.059 0.044 0.022 7Wet inorganic PMscrubber
Whey drying Cyclone and Condensible 3 NR 0.0 0.0 0.0 0.0 7Wet organic PMscrubber

4-5
TABLE 4-2. PARTICULATE EMISSION FACTORS FOR NATURAL ANDPROCESSED CHEESE MANUFACTUREa
Source Control Pollutant lb/ton kg/Mg Rating Ref.
Average emission factor
Cheese dryer Wet scrubber Filterable PM 2.5 1.2 D 1,2,3Wet scrubber Cond. inorg. PM 0.29 0.15 D 2,3Wet scrubber Cond. org. PM 0.44 0.22 D 1,2,3
Whey dryer Cyclone Filterable PM 0.77 0.39 D 4Cyclone Condensible PM 0.75 0.38 D 4Fabric filter Filterable PM 2.2 1.1 D 6Fabric filter Cond. inorg. PM 0.047 0.024 D 6Fabric filter Cond. org. PM 0.1 0.048 D 6Wet scrubber Filterable PM 0.76 0.38 D 7Wet scrubber Cond. inorg. PM 0.044 0.022 D 7Wet scrubber Cond. org. PM 0 0 NR 7
Emission factor units are lb/ton of dry product. To convert from lb/ton to kg/Mg, multiply by 0.5. NR = not rated.a

4-6
REFERENCES FOR SECTION 4
1. Air Emission Test Report: Results of Source Emission Test Performed on Parmesan Cheese Dryer,Kraft Foods, Inc., Wausau, WI. Twin City Testing Corporation, St. Paul, MN. May 7, 1993.
2. Results of the December 28, 1988 Particulate Emission Compliance Test on the Rogers Dryer at theLand O'Lakes Plant Located in Spencer, Wisconsin. Interpoll Laboratories, Inc., Circle Pines, MN. December 30, 1988.
3. Results of the March 29, 1990 Particulate Emission Compliance Test on the Rogers Dryer at theLand O'Lakes Cheese Division Plant Located in Spencer, Wisconsin. Interpoll Laboratories, Inc.,Circle Pines, MN. April 18, 1990.
4. Whey Dryer Emission Test at Northland Food Cooperative, Shawano, WI, April 9-10, 1986. BadgerLaboratories and Engineering Co., Inc., Appleton, WI. April 30, 1986.
5. Results of the March 29, 1988 Particulate Emission Compliance Test on the Whey Dryer at the F&ADairy in Dresser, Wisconsin. Interpoll Laboratories, Circle Pines, MN. April 12, 1988.
6. Results of the November 8, 1988 Particulate Emission Compliance Test on the Whey Dryer at theEllsworth Coop Creamery in Ellsworth, Wisconsin. Interpoll Laboratories, Circle Pines, MN. December 9, 1988.
7. Whey Dryer Emission Tests at Alto Dairy, Waupun, WI, April 20, 1989. Badger Laboratories,Appleton, WI. June 9, 1989.

5-1
5. PROPOSED AP-42 SECTION
The proposed AP-42 Section 9.6.1, Natural and Processed Cheese, is presented on the followingpages as it would appear in the document.


![Luxurious Holiday Gourmet Chest Item · PDF fileNet Wt. 3.5 oz. (99g) INGREDIENTS: NATURAL CHEESE (CHEDDAR CHEESE [MILK, CHEESE CULTURES, SALT, ENZYMES]), WATER, CREAM, MILK ... MANUFACTURED](https://static.fdocuments.us/doc/165x107/5a8987917f8b9afe568b52d3/luxurious-holiday-gourmet-chest-item-wt-35-oz-99g-ingredients-natural.jpg)