EMERGING TECH COMPANY BENEFITS SURVEY · survey info this is the first mercer emerging tech...
29
HEALTH WEALTH CAREER EMERGING TECH COMPANY BENEFITS SURVEY 2016 BENCHMARKING RESULTS
Transcript of EMERGING TECH COMPANY BENEFITS SURVEY · survey info this is the first mercer emerging tech...

H E A L T H W E A L T H C A R E E R
E M E R G I N G T E C H C O M P A N Y B E N E F I T SS U R V E Y
2 0 1 6 B E N C H M A R K I N G R E S U L T S

© MERCER 2016 1
S U R V E Y I N F O
T H I S I S T H E F I R S T M E R C E R E M E R G I N G T E C HC O M PAN I E S S U R V E Y W I T H A F O C U S ON :
VAR I O U S P E R Q U I S I T E S O F F E R E D AM O N G T H E G R O U P
& B E N C H M AR K I N G F OR M E D I C AL , D E N TAL AN DV I S I O N P R O G R AM S
T HE S U RV E Y G RO UP R E P R E S E NT S :
3 5 C O M PAN I E S2 5 , 0 0 0 E L I GI B LE E M P L OYE E S
$ 2 5 0 M I N AN N U AL M E D I C AL S P E N D
F I GU R E S US E D AR E AL L S I M P LE AV E R AG E SAM O N G AL L R E S P O N D E N T S
( N O W E I GH T IN G B A S E D O N E N R O L L M E N T, E T C . )

© MERCER 2016 2
T O P S T O R I E S
Just about half of companiessurveyed had an unlimited or
untracked PTO policy. Untrackedemployees took around 20%
more time off
Paid Time Off
Low prevalence of advancedautism benefits, infertility
benefits or LGBT benefits.These benefits are a hot topic
among mature tech firms
What wasn’t offered?
The benefits programs offered are veryrich relative to national benchmarks.
Employees paid 26% (14% contributions +12% out of pocket) of total covered cost
compared to 40% nationally
Rich Plan Benefits
International Presence
66% of those surveyed had aninternational population whichwas, on average, 32% of the
total population
As this group ages, and grows infamily size to mirror mature tech firmsannual medical costs are projected to
rise by $2,168
Benefit Costs - TomorrowBenefit Costs - Today
The average total annual cost peremployee was $12,272 – in line with
national benchmarks$10,987 Medical + $1,098 Dental +
$187 Vision

© MERCER 2016 3© MERCER 2015
PERQUISITES

© MERCER 2016 4
Prof
essi
onal
Dev
elop
men
tTr
ansp
orta
tion
&H
ousi
ngB
enef
itspr
ogra
ms
0% 10% 20% 30% 40% 50% 60% 70% 80% 90% 100%
Tuition Assistance
Professional Designation expense reimbursements
Paid Relocation program
Employer Paid Housing
Employer Subsidized Housing
Commuter Shuttle Service
Onsite Bikes (or other mode of transport)
Electric vehicle charging stations
Other Subsidized Commuting Benefits (Bus Passes, Etc.)
Advanced Infertility Benefits (i.e. Egg-freezing, In-vitro fertilization)
On-Site Clinic
LGBT Specific Benefits
Advanced Autism Benefit (i.e. ABA therapy)
Mobile Communication of Benefits
Telemedicine Offering
401K Company Matching
P E R Q U I S I T E S ( 1 / 3 )
W HAT P E R K S W E RE O F FE R E D TO D OM E S T IC E M P L OYE E S ?

© MERCER 2016 5
Food
&D
rink
Ente
rtai
nmen
t&Fu
n
0% 10% 20% 30% 40% 50% 60% 70% 80% 90% 100%
On-site entertainment events (I.e. concerts)
Team outings / vacations
Company Discounts at retailers/ telecoms, etc.
Fun Room (Arcade, Foosball, Ping Pong, etc.)
Smoothie Bar
Food Allowance (Amazon Fresh, post mates, etc.)
On-Site Barista
Free Dinner
Food - Company Subsidized (On-site cafeteria orrestaurants)
Free Breakfast
Free Lunches
Beer/Wine Fridge
Free Snacks
Free Beverages (Cans/Bottles/Coffee)
P E R Q U I S I T E S ( 2 / 3 )
W HAT P E R K S W E RE O F FE R E D TO D OM E S T IC E M P L OYE E S ?

© MERCER 2016 6
Oth
erW
elln
ess
Wor
k-Li
feB
alan
ce&
Life
styl
e
0% 10% 20% 30% 40% 50% 60% 70% 80% 90% 100%
Matching company charitable gifts
Hackathon Events
Phone / TV Credits
Desk / Computer Setup Budget
"Puppy Therapy" - Animals on-site for stress relief (can…
Free Fitbit or other wellness tracker
Subsidized Gym membership
On-site massages / Massage Credits
Onsite Gym
Wellness Program
On-Site health checkup / flu shot
Onsite Shower
Standing Desks
Daycare Services
100% Employer Paid Vacations (ie: airfare, lodging, etc)
Laundry Service (Pick-up or on-site)
Use of company time for personal projects
Allow pets at work
Relaxation Room / Sleep Pods
Company Sponsored volunteer events
P E R Q U I S I T E S ( 3 / 3 )
W HAT P E R K S W E RE O F FE R E D TO D OM E S T IC E M P L OYE E S ?

© MERCER 2016 7
P A I D T I M E O F F
H O W M U C H T I M E O FF W OR K D I D E M P L O YE E S R E C E I V E A N D U S E ?
4 6 % O F T HO S E S U RV E YE D H AV E AN U N LI M I TE D /U N T R AC K E D P T O P O L I C Y
AM O N G T H O S E W I T H OU T ANU N L I M I T E D P TO P O L I C Y:
The average new hire earned15.8 PTO days annually
Which increased at rate of 1 dayfor each year of tenure
Employees used an average of12.9 days a year…
…Compared to those which had unlimitedPTO, who used an average of 15.8 vacation
days/year
44% tracked sick days separatelyfrom Paid time off
With an average of 7 Sick daysoffered annually

© MERCER 2016 8
I N T E R N A T I O N A L B E N E F I T S - P R O F I L E
6 6 % O F E M P L OYE R S H AV E ANI N T E R N AT I O N AL P O P U L AT I O N
W IT H AN AV E R AG E O F 3 2 %O F I N TE R N AT I O N AL
E M P L OYE E S
*Among companies with a population in a country
I N T E R N AT I O N AL E M P L O YE E S W E R E A S U B S TAN T I AL P O R T I O N O F T H EG R O U P P O P U L AT I O N :
Country% withPopulation*
UK 65%Germany 52%Canada 35%Australia 30%China 26%France 22%Japan 22%India 17%Netherlands 17%Brazil 13%Ireland 13%Israel 13%Singapore 13%Philippines 9%Hungary 9%Austria 4%Bolivia 4%England 4%Hong Kong 4%Russia 4%South Korea 4%Switzerland 4%Taiwan 4%Colombia 4%Indonesia 4%*among those with an Int'l Population
34%
36%
11%
9%
29%
China
Canada
Australia
Germany
UK
Average % Employees for top countries*

© MERCER 2016 9
I N T E R N A T I O N A L B E N E F I T S - P E R Q U I S I T E SAM O N G T H O S E W I T H AN I N T E R N AT I O N AL P O P U L AT I O N , E M P L O Y E R SO FF E RE D T HE F OL LO WI N G P E R KS :
0% 10% 20% 30% 40% 50% 60%
Advanced Autism Benefit (i.e. ABA therapy)
LGBT Specific Benefits
Employer Subsidized Housing
Free Dinner
Onsite Gym
Tuition Assistance
401K Company Matching
Onsite Shower
Food - Company Subsidized (On-site cafeteria or restaurants)
On-site massages / Massage Credits
Mobile Communication of Benefits
Other Subsidized Commuting Benefits (Bus Passes, Etc.)
Free Breakfast
Wellness Program
Professional Designation expense reimbursements
Subsidized Gym membership
Free Lunches
Paid Relocation program
Expat International Medical

© MERCER 2016 10© MERCER 2015
BENEFIT PROGRAMBENCHMARKING
© MERCER 2016 11
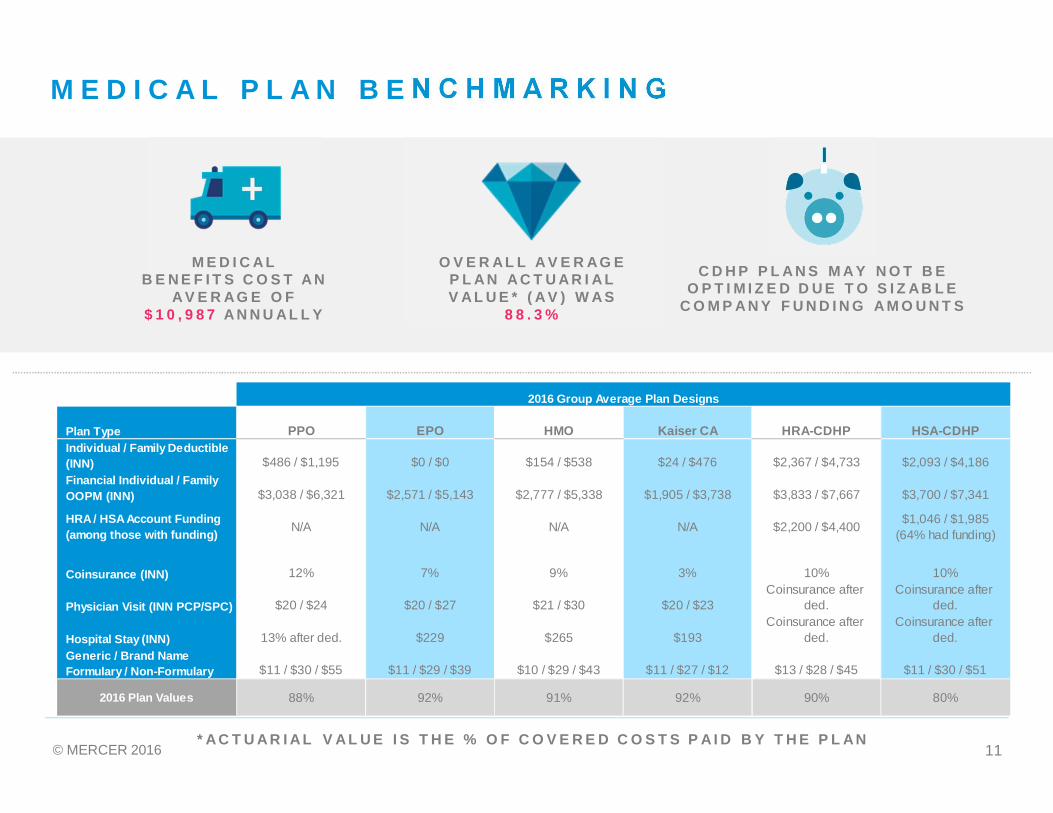
Plan Type PPO EPO HMO Kaiser CA HRA-CDHP HSA-CDHPIndividual / Family Deductible(INN) $486 / $1,195 $0 / $0 $154 / $538 $24 / $476 $2,367 / $4,733 $2,093 / $4,186Financial Individual / FamilyOOPM (INN) $3,038 / $6,321 $2,571 / $5,143 $2,777 / $5,338 $1,905 / $3,738 $3,833 / $7,667 $3,700 / $7,341
HRA / HSA Account Funding(among those with funding) N/A N/A N/A N/A $2,200 / $4,400 $1,046 / $1,985
(64% had funding)
Coinsurance (INN) 12% 7% 9% 3% 10% 10%
Physician Visit (INN PCP/SPC) $20 / $24 $20 / $27 $21 / $30 $20 / $23Coinsurance after
ded.Coinsurance after
ded.
Hospital Stay (INN) 13% after ded. $229 $265 $193Coinsurance after
ded.Coinsurance after
ded.Generic / Brand NameFormulary / Non-Formulary $11 / $30 / $55 $11 / $29 / $39 $10 / $29 / $43 $11 / $27 / $12 $13 / $28 / $45 $11 / $30 / $51
2016 Plan Values 88% 92% 91% 92% 90% 80%
2016 Group Average Plan Designs
M E D I C A L P L A N B E N C H M A R K I N G
M E D I C A LB E N E F I T S C O S T A N
A V E R A G E O F$ 1 0 , 9 8 7 A N N U A L L Y
O V E R AL L A V E R AG EP L A N A C T U A R I A LV A L U E * ( A V ) W A S
8 8 . 3 %
C D H P P L A N S M A Y N O T B EO P T I M I Z E D D U E T O S I Z AB L E
C O M P A N Y F U N D I N G A M O U N T S
* A C T U A R I A L V A L U E I S T H E % O F C O V E R E D C O S T S P A I D B Y T H E P L AN

© MERCER 2016 12
M E D I C A L C O N T R I B U T I O N B E N C H M A R K I N G
Plan Type PPO EPO HMO Kaiser CA HRA-CDHP HSA-CDHP% with Zero Contributions 10% 29% 0% 19% 33% 19%
Average contributons(for those with non-zero contribution)
Employee Only $84 $102 $43 $39 $106 $46
Employee + Spouse $269 $241 $182 $188 $242 $174
Employee + Child(ren) $198 $111 $119 $146 $88 $129
Employee + Family $435 $343 $330 $309 $364 $298
Plan Count by Type 48 7 13 21 3 21
2016 Group Average Plan Contrbituions
E M P L O Y E E S P A I D1 7 % O F G R O S S
M E D I C A L C O S T S
1 O F 5R E S P O N D E N T S
O F F E R E D A F R E EM E D I C A L P L A N

© MERCER 2016 13
M E D I C A L P L A N B E N C H M A R K I N G
Plan costs varied bytype, and the mix of
plan types offered canaffect overall costs
Generally HSA andKaiser plans were
the lowest costoptions
while PPO (andHRA) Plans werethe highest cost
offerings
Looking at cost sharing:Kaiser had the lowest cost
sharing on both a grossand allowed basis

© MERCER 2016 14
2016 Group AverageDental Plan
Individual in-network deductible $46
What is the maximum annualbenefit per participant? $1,868
What is the lifetime maximumbenefit for orthodontia? $1,500
Is orthodontia available to adults? 74% Offered to adults
Coinsurance for:
Preventive services 100%
Basic and diagnostic services 88%
Major services 58%
Orthodontia 57%
D E N T A L P L A N B E N C H M A R K I N G
D E N TAL B E N E F IT S C O S T ANAV E R AG E O F $ 1 , 0 9 8 AN N U AL LY
E M P L O Y E E S PAI D 2 2 % O FG R O S S D E N TAL C O S T S
2016 Group AverageDental Plan Contributions
% with Zero Contributions20%
Average contributons(among those with non-zero contribution)
Employee Only $9Employee + Spouse $26Employee + Child(ren) $25Employee + Family $50

© MERCER 2016 15
E M P L O Y E E S PAI D 2 6 % O FG R O S S V I S I O N C O S T S
V I S I O N P L A N B E N C H M A R K I N G
2016 Group Average Vision Plan
In Network Eye exam Copay $12
In Network Lens Allowance 80% had copay only20% had an allowance, averaging: $147
In Network Frames Allowance 14% had copay only86% had an allowance, averaging: $142
Contacts allowance (in lieu ofglasses)
23% had copay only77% had an allowance, averaging: $138
How often are Exams Covered? Every 12 Months
How often are Lenses covered? Every 12 Months
How often are Frames covered? Every 12 months: 55%Every 24 months: 45%
V I S I O N B E N E F I T S C O S T ANAV E R AG E O F $ 1 8 7 AN N U AL LY
2016 Group Average Vision PlanContributions
% with Zero Contributions 21%
Average contributons(among those with non-zero contribution)
Employee Only $2Employee + Spouse $5Employee + Child(ren) $5Employee + Family $10

© MERCER 2016 16
M E D I C A L P L A N D E T A I L
Medical costs are madeup of three components:
Out of pocket employee (OOP) costs –Copays, Coinsurance, Deductibles fall
in this category
Employee contributions – Typicallydefined as a % of premium, these take
the form of paycheck contributions
Employer paid costs – The balance ofcosts paid by the employer either as %
of premium, or actual claims if self-funded
Gross Employee Cost sharingdoesn’t factor in the OOP costs an
employee will ultimately pay$1,861 / $10,987 = 17%
Allowed Employee Cost sharingis based on the total expense employees
pay, with both contributions and OOP costs$3,313 / $12,440 = 27%
$9,126
$1,861
$1,452
$12,440
Group Average
Annual Medical Plan Costs

© MERCER 2016 17
M E D I C A L P E R F O R M A N C E I N D E X ( M P x )W H A T I S I T ?
The MPx Score is a measure ofmedical plan performance, afternormalizing for demographics,
geography, and plan design
All scores are relative to the groupaverage among all participants.
Scores above 100% indicate that,after adjustments, costs are below
group average
The next two slides illustrate theadjustments being made, followed
by your specific MPx results(All costs considered are Medical Gross costs)
The adjusted medical costassumes each participanthad the same average planvalue, geographic footprint,and demographic profile.
The waterfall illustrates theeffect of each adjustment,moving from unadjusted toadjusted costs
The MPx is a comparison ofthe adjusted costs to thegroup average.
Cost differential betweencurrent MPx and average isshown in the chart, alongwith potential cost savingsassociated with a 1%improvement in MPx
Your Medical Performance Index (MPx) is: 110.0%(Higher is Better)
TODAYCompared to the SVEF average, you currently pay: 10.0% less in medical costs, based on efficiency
Which translates to: $1,372 per employee per year
Or, in Aggregate: $1.0M Based on 1,000 enrolled in medical plans
TOMORROWIf you improved index by 1% further, you save: $137 per employee per year
Or, in Aggregate: $100K Based on 1,000 enrolled in medical plans
*Sample Data

© MERCER 2016 18
C O S T A D J U S T M E N T SD E M O G R A P H I C S A N D G E O G R A P H Y
AGE37
M I N : 2 9 M AX : 4 6
FAMILY SIZE2.0
M I N : 1 . 4 M AX : 3 . 2
GEOGRAPHY
T O P 5 L O C AT I O N S
CA45%
WA12%
UT12%
TX4%
PA3%
Other24%
Geographical scores are calculatedbased on top 5 employee locations
by state, and adjusted to theaverage score
A 2% adjustment is appliedper year of difference from
the group average
A 60% adjustment isapplied per
additional memberfrom group average
© MERCER 2016 19
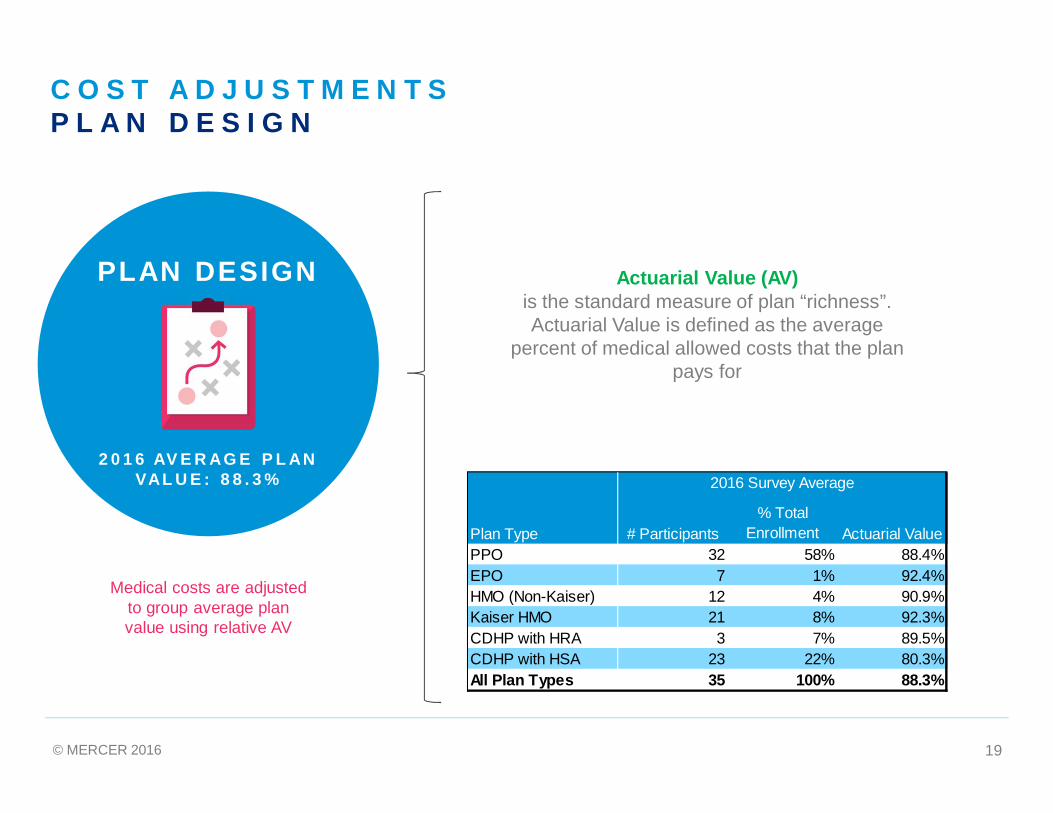
2016 Survey Average
Plan Type # Participants% Total
Enrollment Actuarial ValuePPO 32 58% 88.4%EPO 7 1% 92.4%HMO (Non-Kaiser) 12 4% 90.9%Kaiser HMO 21 8% 92.3%CDHP with HRA 3 7% 89.5%CDHP with HSA 23 22% 80.3%All Plan Types 35 100% 88.3%
2016 Survey Average
Plan Type # Participants% Total
Enrollment Actuarial ValuePPO 32 58% 88.4%EPO 7 1% 92.4%HMO (Non-Kaiser) 12 4% 90.9%Kaiser HMO 21 8% 92.3%CDHP with HRA 3 7% 89.5%CDHP with HSA 23 22% 80.3%All Plan Types 35 100% 88.3%
C O S T A D J U S T M E N T SP L A N D E S I G N
PLAN DESIGN
2 0 1 6 AV E R AG E P L ANVAL U E : 8 8 . 3 %
Medical costs are adjustedto group average planvalue using relative AV
Actuarial Value (AV)is the standard measure of plan “richness”.Actuarial Value is defined as the average
percent of medical allowed costs that the planpays for

© MERCER 2016 20
Un-AdjustedPEPYCost
$9,175Adjusted
PEPYCost
$8,922
+$63
+$363
-$167
-$513
$8,000
$8,200
$8,400
$8,600
$8,800
$9,000
$9,200
$9,400
Plan Design Geography Age Family Size
PEPY
Cost
Cost Adjustment - SAMPLE
M E D I C A L P E R F O R M A N C E I N D E X ( M P x )
Adjusted CostsThe projected total medical cost
assuming each participant had the sameaverage plan value, geographic
footprint, and demographic profile
Medical Performance Index (MPx)The comparison of each participant’s
adjusted cost to the overallgroup average of $10,987 PEPY

© MERCER 2016 21
Your Medical Performance Index (MPx) is: 104.9%(Higher is Better)
TODAYCompared to the group average, you currently pay: 4.9% less in medical costs, based on efficiency
Which translates to: $734 per employee per year
Or, in Aggregate: $1.0M Based on 1,000 enrolled in medical plans
TOMORROWIf you improved index by 1% further, you save: $151 per employee per year
Or, in Aggregate: $100K Based on 1,000 enrolled in medical plans
8/23/2016
M E D I C A L P E R F O R M A N C E I N D E X ( M P x )
• MPx scores above 100% indicate that afteradjusting for plan design, geography, anddemographics, costs are below groupaverage
• Cost differential between current MPx andaverage shown in chart, along withpotential cost savings associated with a1% improvement in MPx
Examples of how to improve MPx
Continue to build culture of wellness andconsumerism through program design and
plan offerings
Custom care management programs tomanage high cost claimant and chronic
condition incidence
Medical carrier marketing to improvediscounts and fixed fees
Re-structuring of dependent contributionsto avoid being a dependent magnet
SAMPLE

© MERCER 2016 22
C O M P A R I S O N T O M AT U R E H I G H - T E C HA G L I M P S E I N T O T H E F U T U R E
By comparing the demographics of survey respondents to mature high tech firms, we can take aglimpse at what the future might hold for emerging tech companies as they mature, and how
much it could cost.
S U R V E Y PAR T I C I PAN T S M AT U R EH I G H - T E C H
B E N C H M AR KEarly Stage / Pre-IPO Post-IPO
Average Annual (Gross)Medical Costs
Average Age
Average Family Size
36.4
1.8
40.8
2.4
$13,466
41.2
2.5
Adjusting the averagecost of $10,990 up tobenchmarkdemographics, thesurvey group isestimated to cost$13,156 – right in linewith benchmark
$10,471 $12,215

© MERCER 2016 23
A D D I T I O N A L A R E A S F O R C O N S I D E R AT I O N
C O R EB E N E F I T S
The majority of mature firms areself-funded which typically
yields a 5% -10% cost reductionin the long-term over a fully
insured arrangement.
If you are fully insured, makesure you are receiving credit for
the 2016 Health InsuranceProvider (HIP) fee moratorium
B E S T I NC LAS S &
TAR GE T E DP R O G R AM S
F O C U S O NFAM I LY
B E N E F I T S
Many mature firms offerprograms specific to certain
conditions to improveoutcomes and compete for
diverse talent.
Examples include expertmedical opinion and
LGBT specific benefits
As more spouses and childrenenter your benefit plans,
consider programs specific tofamilies
Examples include autismprograms, infertility benefits,
and childcare programs

© MERCER 2016 24© MERCER 2015
APPENDIX

© MERCER 2016 25
C O S T B E N C H M A R K I N G R E S U L T S S U M M A R Y
Gross Cost: full premium orpremium equivalent rates,both employee andemployer paid
Allowed Cost: gross costs +the out of pocket costsincurred by an employee
Benchmarking Results Survey AverageMedical Performance Index (MPx) 100.0%
2016 PEPY Unadjusted Gross Cost $10,9872016 PEPY Adjusted Gross Cost $10,9872016 PEPY Medical Allowed Cost (includes OOP) $12,4402016 Employee Contribution % of Premiums 16.7%2016 Employee Cost Share as % of Medical Allowed Costs 26.1%2016 PEPY Employee Contributions $1,8612016 PEPY Employee Cost (Contribution + OOP) $3,3142016 PEPY Unadjusted Net Costs $9,126
2016 PEPY Dental Costs $1,0982016 Dental Cost Sharing 22.1%
2016 PEPY Vision Costs $1872016 Vision Cost Sharing 25.8%
Cost Adjustment Survey AveragePlan Design 88.3%Average Age* 37.4Member/EE Ratio* 1.99

© MERCER 2016 26
M E T H O D O L O G Y A N D A S S U M P T I O N S
• To the extent possible, data used as provided– Adjustments made if internal inconsistencies found– Data supplemented from additional sources if available
• Costs inclusive of claims and fixed fees associated with medical, prescription drug, and behavioral healthcoverages– For CDHPs, costs include value of employer HRA or HSA funding– Total cost by participant reflects weighted average by enrollment across all plan types offered– Allowed costs include member out-of-pocket spend estimated through Mercer’s plan valuation tool
• Total of 35 participants in cost benchmarking survey – averages for the group calculated on an un-weightedbasis
• Plan Design Factors– Based on in-network plan designs provided and valued using Mercer’s plan design valuation tool– Out-of-network design for PPO and CDHP plans assumed to be consistent across all participants
- Deductible and OOP maximum: 2x in-network amounts- Coinsurance: 20% lower than in-network amount
– 1.0 plan design factor set at overall average plan design across all participant’s plans– Relative factor reflects difference compared to overall average (e.g. 1.10 factor indicates plan design
that is 10% richer than overall average)

© MERCER 2016 27
M E T H O D O L O G Y A N D A S S U M P T I O N S ( C O N T ’ D )• Geographic Factors
– Based on Mercer study of relative cost across United States by 3-digit zip code, factors aggregated tostate-level based on U.S. census data
– Geographic factors by state assigned to each participant’s top 5 locations- For locations not covered within top 5 locations, assigned a 1.0 average geographic factor
– Northern California specific factor used of each participant’s California population– 1.0 average set at overall average geographic factor across all participant’s locations– Relative factor reflects difference compared to overall average (e.g. 1.10 factor indicates population in
locations that are 10% more costly than overall average)
• Demographic Factors – comprised of two components– Average age
- Each participant’s average age compared to overall average, cost factor of 2% for each yeardifference
– Average family size (member/employee ratio)- Each participant’s average family size compared to overall average, 60% cost factor applied to each
additional member– 1.0 average set at overall average member/employee ratio across all participants– Relative factor reflects difference compared to overall average (e.g. 1.10 family size factor indicates
population which covers 10% more dependents than overall average)

© MERCER 2016 2828