
Emerging regional climate change signals for Europe under varying large-scale circulation...
17
CLIMATE RESEARCH Clim Res Vol. 56: 103–119, 2013 doi: 10.3354/cr01146 Published online March 12 1. INTRODUCTION Climate projections for the 21st century show suc- cessive and substantial changes in regional climate aspects related to global warming (e.g. Christensen et al. 2007). Large-scale patterns such as a larger warming over the continents than over the oceans, maximum warming in the Arctic region and a gen- eral amplification of the hydrological cycle are com- mon to all projections. However, there are also im- portant differences. On the global scale, differences between projections are related to uncertainties in the climate forcing itself (emission pathways), the climate sensitivity and, especially for the early part of the century, internal variability of the climate system (Hawkins & Sutton 2009). The latter is even more of an issue on regional scales than on the global scale (Hegerl & Zwiers 2011) and thus is an important source of uncertainty in understanding regional- scale climate change signals. These uncertainties warrant careful consideration with ensemble ap- proaches that enable characterization of both the common features in the projections and the uncer- tainties. This includes an improved understanding of the role of the large-scale internal variability as it may severely mask the externally driven climate © Inter-Research 2013 · www.int-res.com *Email: [email protected] Emerging regional climate change signals for Europe under varying large-scale circulation conditions Erik Kjellström 1,2, *, Peter Thejll 3 , Markku Rummukainen 1,4 , Jens H. Christensen 3 , Fredrik Boberg 3 , Ole B. Christensen 3 , Cathrine Fox Maule 3 1 Swedish Meteorological and Hydrological Institute, 60176 Norrköping, Sweden 2 Department of Meteorology, Stockholm University, 10691 Stockholm, Sweden 3 Danish Meteorological Institute, 2100 Copenhagen, Denmark 4 Centre for Environmental and Climate Research, Lund University, 22362 Lund, Sweden ABSTRACT: A large ensemble of regional climate model projections was investigated regarding if and when they show an emergence of significant climate change signals in seasonal tempera- ture and precipitation within Europe. The influence of the North Atlantic Oscillation (NAO), as simulated in the projections, was investigated. In most parts of Europe, the projections indicate robust emergence of temperature change in the first 2 decades of the 21st century, typically earlier for summer than for winter. For precipitation changes, signals generally emerge much later than for temperature. For Europe as a whole, the precipitation signals tend to emerge some 40 to 60 yr later than the temperature signals. In some sub-regions, robust signals for precipitation are not found within the studied period, i.e. until 2100. Some sub-regions, notably the Mediterranean area and Scandinavia, show different behaviour in some aspects compared to the ensemble-based results as a whole. NAO has some influence on the temperature change signals, which emerge earlier in winter for some models and regions if NAO is accounted for. For summer temperatures, the influence of NAO is less evident. Similarly, for precipitation, accounting for NAO leads to an earlier emergence in some regions and models. Here, we find an impact for both summer and winter. KEY WORDS: Climate change · Emerging trends · Europe · Regional climate models · NAO Resale or republication not permitted without written consent of the publisher OPEN PEN ACCESS CCESS
-
Upload
elisabeta-oprisan -
Category
Documents
-
view
7 -
download
0
description
A large ensemble of regional climate model projections was investigated regarding if and when they show an emergence of significant climate change signals in seasonal temperature and precipitation within Europe. The influence of the North Atlantic Oscillation (NAO), as simulated in the projections, was investigated. In most parts of Europe, the projections indicate robust emergence of temperature change in the first 2 decades of the 21st century, typically earlier for summer than for winter. For precipitation changes, signals generally emerge much later than for temperature. For Europe as a whole, the precipitation signals tend to emerge some 40 to 60 yr later than the temperature signals.
Transcript of Emerging regional climate change signals for Europe under varying large-scale circulation...

CLIMATE RESEARCHClim Res
Vol. 56: 103–119, 2013doi: 10.3354/cr01146
Published online March 12
1. INTRODUCTION
Climate projections for the 21st century show suc-cessive and substantial changes in regional climateaspects related to global warming (e.g. Christensenet al. 2007). Large-scale patterns such as a largerwarming over the continents than over the oceans,maximum warming in the Arctic region and a gen-eral amplification of the hydrological cycle are com-mon to all projections. However, there are also im -portant differences. On the global scale, differencesbetween projections are related to uncertainties inthe climate forcing itself (emission pathways), the
climate sensitivity and, especially for the early part ofthe century, internal variability of the climate system(Hawkins & Sutton 2009). The latter is even more ofan issue on regional scales than on the global scale(Hegerl & Zwiers 2011) and thus is an importantsource of uncertainty in understanding regional-scale climate change signals. These uncertaintieswarrant careful consideration with ensemble ap -proaches that enable characterization of both thecommon features in the projections and the uncer-tainties. This includes an improved understanding ofthe role of the large-scale internal variability as itmay severely mask the externally driven climate
© Inter-Research 2013 · www.int-res.com*Email: [email protected]
Emerging regional climate change signalsfor Europe under varying large-scale
circulation conditions
Erik Kjellström1,2,*, Peter Thejll3, Markku Rummukainen1,4, Jens H. Christensen3, Fredrik Boberg3, Ole B. Christensen3, Cathrine Fox Maule3
1Swedish Meteorological and Hydrological Institute, 60176 Norrköping, Sweden2Department of Meteorology, Stockholm University, 10691 Stockholm, Sweden
3Danish Meteorological Institute, 2100 Copenhagen, Denmark4Centre for Environmental and Climate Research, Lund University, 22362 Lund, Sweden
ABSTRACT: A large ensemble of regional climate model projections was investigated regardingif and when they show an emergence of significant climate change signals in seasonal tempera-ture and precipitation within Europe. The influence of the North Atlantic Oscillation (NAO), assimulated in the projections, was investigated. In most parts of Europe, the projections indicaterobust emergence of temperature change in the first 2 decades of the 21st century, typically earlierfor summer than for winter. For precipitation changes, signals generally emerge much later thanfor temperature. For Europe as a whole, the precipitation signals tend to emerge some 40 to 60 yrlater than the temperature signals. In some sub-regions, robust signals for precipitation are notfound within the studied period, i.e. until 2100. Some sub-regions, notably the Mediterranean areaand Scandinavia, show different behaviour in some aspects compared to the ensemble-basedresults as a whole. NAO has some influence on the temperature change signals, which emergeearlier in winter for some models and regions if NAO is accounted for. For summer temperatures,the influence of NAO is less evident. Similarly, for precipitation, accounting for NAO leads to anearlier emergence in some regions and models. Here, we find an impact for both summer and winter.
KEY WORDS: Climate change · Emerging trends · Europe · Regional climate models · NAO
Resale or republication not permitted without written consent of the publisher
OPENPEN ACCESSCCESS
Clim Res 56: 103–119, 2013
change signal if not properly addressed in a chang-ing climate, where this variability may undergo itsown changes.
Existing ensembles of regional climate projectionsfor Europe include those based on global (e.g. Meehlet al. 2007) and regional climate models (e.g. Chris-tensen & Christensen 2007, Haugen & Iversen 2008,Kjellström et al. 2011, Déqué et al. 2012). The resultsindicate robust strong warming trends that are sea-sonally most pronounced in Northern Europe in win-ter and in Southern Europe in summer. Also, thehydrological climate is expected to change with gen-erally more precipitation in the north, especially inwinter, and less precipitation in the south.
The projected changes in temperature and precip-itation emerge gradually over time. Detection of con-temporary temperature and precipitation changeshas been achieved on global and continental scales(Hegerl et al. 2007, Stott et al. 2010). The signal-to-noise ratio is more of a constraint on smaller scales.The noise concerns internal variability that mayamplify or suppress the long-term trends and subse-quently complicate early detection of emerging cli-mate change signals (Déqué et al. 2007, Kendon et al.2010, Diffenbaugh et al. 2011, Hawkins & Sutton2012). Giorgi & Bi (2009), Diffenbaugh et al. (2011)and Hawkins & Sutton (2012) showed that in globalclimate model (GCM) projections, regional-scaleprojected changes emerge over different time peri-ods, depending on the region. In many cases, how-ever, definite signals, not least in temperature, areex pected during the next 1 to 2 decades. Forinstance, Sheffield & Wood (2008) showed that airtemperature changes are detectable within the firsthalf of the 21st century at annual and seasonal timescales in the Mediterranean region based on an en -semble of GCMs. A similar result was deduced byChristensen et al. (2007). Precipitation changes,where appropriate, generally become discernible be -yond the emergence of temperature-change signals(e.g. Christensen et al. 2007, Mahlstein et al. 2012),which is in line with the generally lower signal-to-noise ratio in precipitation compared to temperature.
In the present study, we look into if and when sta-tistically significant changes in seasonal mean pre-cipitation and temperature could be expected toemerge in Europe. This is interesting for example foradaptation planning and policy (e.g. Joshi et al.2011). We also consider sub-regions of Europe, andour point of departure is an ensemble of regional cli-mate model (RCM) projections from the ENSEM-BLES project (van der Linden & Mitchell 2009),which differs from the above-mentioned studies
based on GCMs. RCMs offer a better resolved simu-lation of temperature and precipitation and how theirdistributions, and possibly changes, are affected bytopography (Rummukainen 2010, Feser et al. 2011).We also investigate how the emergence of regionalclimate change signals is influenced by variations inthe North Atlantic Oscillation (NAO). The latter ismotivated by the fact that large-scale circulationmodes in the North Atlantic/Eurasian region have aprofound impact on the inter-annual and decadalvariability in the region, and of these, the NAO is aprime example with its positive (negative) phaseleading to unseasonally mild (cold) winters in North-ern Europe (Hurrell 1995). Possible future change inNAO is an important driver for changes in regionalclimate properties in central Europe (van Olden-borgh et al. 2009), and it has a profound influence onthe regional inter-annual variability.
104
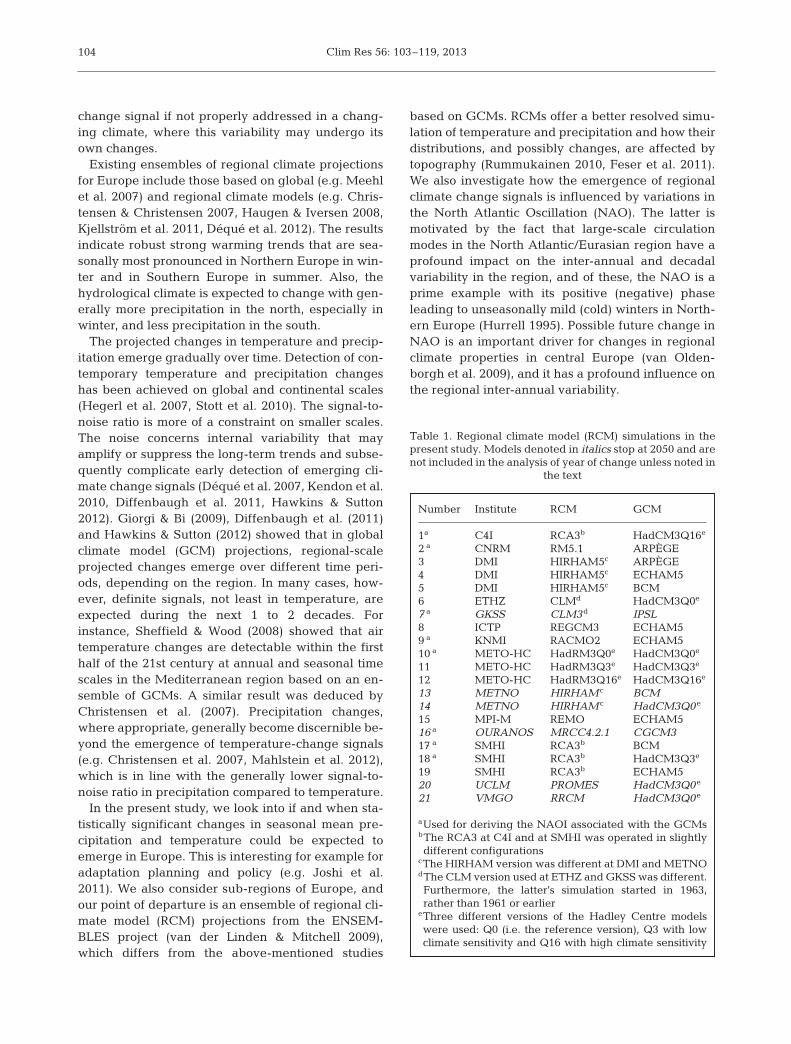
Number Institute RCM GCM 1a C4I RCA3b HadCM3Q16e
2 a CNRM RM5.1 ARPÈGE3 DMI HIRHAM5c ARPÈGE4 DMI HIRHAM5c ECHAM55 DMI HIRHAM5c BCM6 ETHZ CLMd HadCM3Q0e
7 a GKSS CLM3d IPSL8 ICTP REGCM3 ECHAM59 a KNMI RACMO2 ECHAM510 a METO-HC HadRM3Q0e HadCM3Q0e
11 METO-HC HadRM3Q3e HadCM3Q3e
12 METO-HC HadRM3Q16e HadCM3Q16e
13 METNO HIRHAM c BCM14 METNO HIRHAM c HadCM3Q0e
15 MPI-M REMO ECHAM516 a OURANOS MRCC4.2.1 CGCM317 a SMHI RCA3b BCM18 a SMHI RCA3b HadCM3Q3e
19 SMHI RCA3b ECHAM520 UCLM PROMES HadCM3Q0 e
21 VMGO RRCM HadCM3Q0 e
aUsed for deriving the NAOI associated with the GCMsbThe RCA3 at C4I and at SMHI was operated in slightlydifferent configurations
cThe HIRHAM version was different at DMI and METNOdThe CLM version used at ETHZ and GKSS was different.Furthermore, the latter’s simulation started in 1963,rather than 1961 or earlier
eThree different versions of the Hadley Centre modelswere used: Q0 (i.e. the reference version), Q3 with lowclimate sensitivity and Q16 with high climate sensitivity
Table 1. Regional climate model (RCM) simulations in thepresent study. Models denoted in italics stop at 2050 and arenot included in the analysis of year of change unless noted in
the text

Kjellström et al.: Emerging regional climate change in Europe
2. DATA AND METHODS
2.1. Regional climate model data
We used monthly mean temperature, precipitationand mean sea level pressure (MSLP) fields from21 RCM simulations from the ENSEMBLES data-base at DMI (ENSEMBLES 2012) (Table 1). Webased most of our analysis on the 15 simulationsthat cover the full 1961−2099 period and use theremaining 6 ending in 2050 to discuss the uncer-tainty in the re sults. The ENSEMBLES simulationswere made with 11 different RCMs. Some of thesewere run with different set-ups. For instance, theHadley Centre RCM, HadRM3, was used in 3 dif-ferent configurations with different parameter set-tings from a perturbed phy sics ensemble (Collins etal. 2011). The RCMs’ boundary conditions werederived from 8 different GCMs. The anthropogenicclimate forcing followed the A1B emission scenario(Nakicenovic & Swart 2000). In some RCMs, directand indirect effects on the climate from sulphateaerosols were included in addition to the effect ofincreased amounts of greenhouse gases (GHG),while in others, only the GHG increases wereaccounted for.
2.2. Observational data
In addition to the RCM data, weused gridded ob servational tempera-ture and precipitation data from E-OBS5.0 (Haylock et al. 2008) for com-paring spatial patterns and temporaltrends. The E-OBS data are availableat the same rotated 25 × 25 km gridthat is used by most of the ENSEM-BLES RCMs. NAO was characterizedwith a station-based seasonal meanNAO index (NAOI) (NAO 2012).
2.3. Methods
Temperature and precipitation datawere averaged for the 9 regionsshown in Fig. 1 for both the RCMsand the E-OBS data. Anomalies werethen calculated by subtracting theaverage in the period 1961−1990(ex cept for Model 7, for which 1963−1990 was used as no data were
available prior to 1963). We calculated when thetemperature and precipitation deviated from the1961− 1990 reference period for winter (Decemberto February, DJF) and summer (June to August,JJA) in each region. These deviations were ex -pressed as a probability given the standard devia-tions of 2 samples; one from the reference periodcovering 30 yr and the other from a sliding windowof length of 30 yr. The probability that these 2 sam-ples were drawn from the same population wasthen calculated using Student’s means test. If thehypothesis that they were drawn from the samepopulation could be rejected at the 1% level (a 1%chance that the rejection was due to a chanceoccurrence), then the centre year of the sampleinterval for that model (cf. Fig. 2) was assigned asthe time when the climate change signal emerged.Temporal autocorrelation was not accounted for inthe calculation of the t-test statistics. This meansthat the estimated climate change signal mayemerge too early. However, the autocorrelation forseasonal mean temperature and precipitation in theRCM data is relatively small (data not shown),implying that the inferred error is small. Also, wenote that the autocorrelation is of similar size fortemperature and precipitation, implying that thetime of emergence (ToE) can be compared between
105
Fig. 1. Areas used in the analysis. The overall European region (EU) encompassesthe entire domain shown in the figure. The colours represent the oro graphy as
prescribed in the HIRHAM5 model at DMI. See Table 2 for abbreviations

Clim Res 56: 103–119, 2013
the 2 variables. The test was applied for all RCMsagainst the 1961−1990 reference period drawn fromthe respective model and also for the E-OBS dataagainst the E-OBS 1961−1990 period.
As the westward extension in the ENSEMBLESRCMs precludes the use of a standard EOF-basedanalysis of the NAO index (NAOI), we used the sta-tion-based formulation by Hurrell (1995). This is thedifference between the normalized MSLP anomaliesin Stykkishólmur in Iceland and in Lisbon in Portu-gal. The anomaly for an individual 3 mo season isnormalized by the long-term standard deviation(σMSLP) according to the following relation:
(1)
where the overbar denotes an average over all of theindividual years (i) in the period.
Here, NAOI characterises the large-scale circula-tion in the GCMs that provided the RCMs withboundary conditions. Specifically, we used the MSLPfrom 8 of the RCM simulations that had been forcedby different GCMs (Table 1). The NAOI time serieswere then also used for the other RCMs that hadbeen forced with the same GCMs, as appropriate.
Temporal correlations between the NAOI andseasonal mean temperature and precipitation werecalculated by the ordinary Pearson product-momentprocedure for each grid point. Statistical signifi-cance of the correlations was established by MonteCarlo testing using the ‘randomized phases’ methodwhere in surrogate data are generated with thesame auto-correlation spectrum as the original data(e.g. Ebisuzaki 1997). Significance levels were esti-mated from the histogram of correlations generatedfrom repeated tests on surrogate data. We arbitrarilychose a cutoff at the 95% significance level, esti-mated from Monte Carlo trials on surrogate datagenerated by the ‘scrambled phases’ method (Thejll2001).
Finally, we removed the influence from the NAOand repeated our analysis of when significantchanges occur. The influence of the NAO was deter-mined by linear regression in which a statisticalmodel was first fitted to the relation between theNAOI and the variable in question using the follow-ing equation:
X = a + b × NAOI + ε (2)
where X is either temperature or precipitation, a andb are regression coefficients, and ε is the noise. Theresiduals were then used in the repeated analysisafter removing the linear trend (b × NAOI).
3. TEMPERATURE AND PRECIPITATION SIGNALS
Time series for temperature and precipitationchanges in the overall European region (‘EU’; Fig. 1)are shown in Fig. 2. To reduce the number of lines,only the 2 models for which a statistically significantchange emerges the earliest and the 2 for which itemerges the latest in the 21st century are plotted.The RCM results are characterized by increasingtemperatures, while for precipitation, there is an in -crease in winter and a summertime decrease in 3 outof 4 of the models shown in Fig. 2. The ‘early’ modelsshow emergence of changes in temperature as earlyas the E-OBS data does. The ‘late’ models show amuch later ToE. For winter, the simulated inter-annual variability in 1961−1990 is similar in the 2‘early’ RCMs and also in line with that in the E-OBSdata both in terms of the geographical distributionand also amplitude (data not shown). For both of the‘late’ models, the inter-annual variability is smallerthan in E-OBS and the 2 ‘early’ RCMs. This relationbetween strong inter-annual variability in the ‘early’models and weak in the ‘late’ ones implies that it isthe amplitude of the change as seen in Fig. 2 that isresponsible for the ToE and that inter-annual vari-ability plays a less important role. Also, in summer,the amplitude of the change ap pears to be moreimportant for discriminating be tween ‘early’ and‘late’ models as all 4 in this case show an inter-annualvariability in 1961−1990 that is similar to each otherand also close to that in E-OBS (data not shown). Forprecipitation, there is no significant change in the E-OBS data on the pan-European level, which fits wellwith the tendency of precipitation trends to differamong different areas (e.g. van Haren et al. 2012).
The spatial distribution of the RCM simulated cli-mate change signal for Europe is shown in Fig. 3using lower, median and upper percentiles of the cli-mate change between 2021−2050 and 1961−1990 inthe 21-member RCM ensemble for seasonal meantemperature and precipitation. These results alignwell with those from previous studies (e.g. Chris-tensen & Christensen 2007, Kjellström et al. 2011,Déqué et al. 2012). The temperature increases aregenerally larger over land than over the Atlantic,with the largest increases in the northeast duringwinter and in the south during summer. In SouthernEurope, where present day precipitation amountsare already low, precipitation decreases, especiallyin summer. On a more detailed level, another typicalRCM scenario feature shows up as a relatively largeincrease in summertime precipitation over the Baltic
NAOIMSLP MSLP MSLP MSLP
MSLP Lisbon MSi
i i=−
−−⎛
⎝⎜⎞⎠⎟σ σ LLP Stykkisholmur
⎛⎝⎜
⎞⎠⎟
106

Kjellström et al.: Emerging regional climate change in Europe
Sea, likely connected to high sea surface tempera-tures in the underlying GCMs (cf. Kjellström & Ruos-teenoja 2007). Although the large-scale patterns arevery similar across the models, there is a large spreadin the actual numbers, especially for precipitation. Insome areas, there is a lack of agreement about thesign of projected precipitation change, which impliessmall projected changes that do not reach outsidethe baseline variability limits. It could also be thatdifferent models do simulate statistically significantchanges but of opposite sign.
Fig. 4 shows the same change as in Fig. 3, but nowdivided by the inter-annual variability in the 1961−1990 period. This gives an indication of where thesignal-to-noise ratio is high and consequently wherean early emergence of a climate change signal canbe expected. For temperature, the signal-to-noiseratio is generally largest in the Mediterranean area inboth summer and winter. The ratio is lower in North-ern Europe due to a relatively weak change in sum-mer (Fig. 3). This is also the case in winter for theBritish Isles, while it is the large inter-annual vari-
107
Tem
per
atur
e (°
C)
Winter Summer
Pre
cip
itatio
n ra
te (m
m d
–1)
Fig. 2. Temporal evolution of temperature (top) and precipitation anomalies (bottom) for winter (left) and summer (right) for theEU region (see Fig. 1). The diamonds show the first year of change (YC) for 4 models and the E-OBS data. The 4 RCMs shownwere the 2 first and 2 last models to show such a YC inside the data interval. For E-OBS, diamonds are only shown for tempera-ture as a YC is not detectable for precipitation. RCM and E-OBS are compared to the reference period (1961−1990, indicated bythe black horizontal line) for the respective data sets. E-OBS is always shown in black, while the RCMs are colour coded red,blue, green, and orange for RCMs 3, 2, 8 and 4 (cf. Table 1) for winter temperature; 18, 10, 5 and 4 (summer temperature); 5, 1,18 and 10 (winter precipitation); and 1, 15, 3 and 10 (summer precipitation), respectively. The data were smoothed with a 30 yr
window, starting from 1991

Clim Res 56: 103–119, 2013108
Fig. 3. Seasonal change in temperature and precipitation for the 21 RCMs for the period 2021−2050 relative to 1961−1990. The3 percentiles are calculated separately for each grid point by use of the nearest rank, i.e. models ranking 2nd, 11th and 20th

Kjellström et al.: Emerging regional climate change in Europe 109
Fig. 4. Seasonal change for the 21 RCMs for the period 2021−2050 relative to 1961−1990 divided by the inter-annual variability in 1961−1990. See Fig. 3 for further detail

Clim Res 56: 103–119, 2013110
Winter
Summer Fall
BI IP FR ME SC AL MD EE EU BI IP FR ME SC AL MD EE EU
BI IP FR ME SC AL MD EE EU BI IP FR ME SC AL MD EE EU
Temperature
Precipitation
Spring
Winter
Summer Fall
Spring
Fig. 5. Bar-whisker plots of the years of first significant change in temperature for all regions and seasons. The box encloses theinterquartile range (IQR); the whiskers extend from the median to 1.5-fold the 1st or the 3rd quartile or to the maximum or min-imum of the data if any of these lie within this interval. If data lie beyond this range, they are considered outliers and markedwith a circle. The year 2012 is shown with a dashed line. The numbers presented for each region denote how many modelsreached a significant change before 2100 and thereby are included in the box-whisker plots. See Table 2 for abbreviations
Kjellström et al.: Emerging regional climate change in Europe
ability (data not shown) that is responsible for the rel-atively weak signal-to-noise ratio in Scandinavia,which otherwise shows a strong change (Fig. 3). Forprecipitation, there are local maxima in the signal-to-noise ratio in both Southern Europe (with a negativesign as the trend is negative) and Northern Europe.The signal-to-noise ratio is generally lower for pre-cipitation than for temperature.
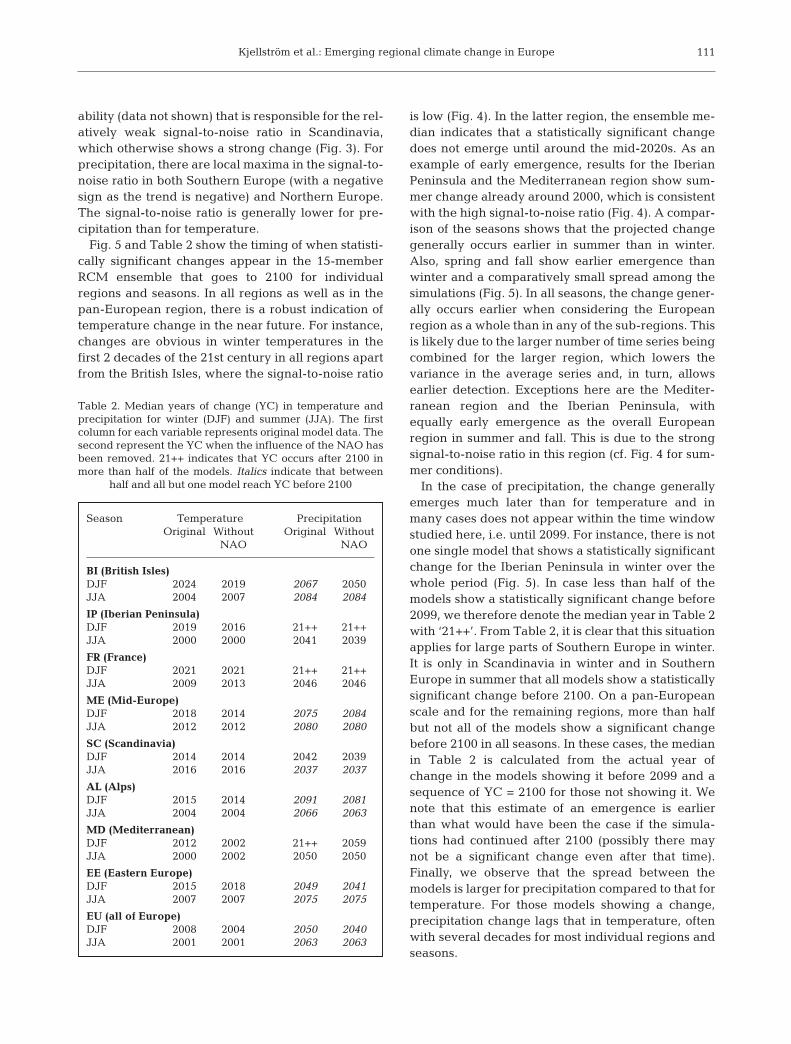
Fig. 5 and Table 2 show the timing of when statisti-cally significant changes appear in the 15-memberRCM ensemble that goes to 2100 for individualregions and seasons. In all regions as well as in thepan-European region, there is a robust indication oftemperature change in the near future. For instance,changes are obvious in winter temperatures in thefirst 2 decades of the 21st century in all regions apartfrom the British Isles, where the signal-to-noise ratio
is low (Fig. 4). In the latter region, the ensemble me -dian indicates that a statistically significant changedoes not emerge until around the mid-2020s. As anexample of early emergence, results for the IberianPeninsula and the Mediterranean region show sum-mer change already around 2000, which is consistentwith the high signal-to-noise ratio (Fig. 4). A compar-ison of the seasons shows that the projected changegenerally occurs earlier in summer than in winter.Also, spring and fall show earlier emergence thanwinter and a comparatively small spread among thesimulations (Fig. 5). In all seasons, the change gener-ally occurs earlier when considering the Europeanregion as a whole than in any of the sub-regions. Thisis likely due to the larger number of time series beingcombined for the larger region, which lowers thevariance in the average series and, in turn, allowsearlier detection. Exceptions here are the Mediter-ranean region and the Iberian Peninsula, withequally early emergence as the overall Europeanregion in summer and fall. This is due to the strongsignal-to-noise ratio in this region (cf. Fig. 4 for sum-mer conditions).
In the case of precipitation, the change generallyemerges much later than for temperature and inmany cases does not appear within the time windowstudied here, i.e. until 2099. For instance, there is notone single model that shows a statistically significantchange for the Iberian Peninsula in winter over thewhole period (Fig. 5). In case less than half of themodels show a statistically significant change before2099, we therefore denote the median year in Table 2with ‘21++’. From Table 2, it is clear that this situationapplies for large parts of Southern Europe in winter.It is only in Scandinavia in winter and in SouthernEurope in summer that all models show a statisticallysignificant change before 2100. On a pan-Europeanscale and for the remaining regions, more than halfbut not all of the models show a significant changebefore 2100 in all seasons. In these cases, the medianin Table 2 is calculated from the actual year ofchange in the models showing it before 2099 and asequence of YC = 2100 for those not showing it. Wenote that this estimate of an emergence is earlierthan what would have been the case if the simula-tions had continued after 2100 (possibly there maynot be a signi ficant change even after that time).Finally, we observe that the spread between themodels is larger for precipitation compared to that fortemperature. For those models showing a change,precipitation change lags that in temperature, oftenwith several decades for most individual re gions andseasons.
111
Season Temperature Precipitation Original Without Original Without NAO NAO
BI (British Isles)DJF 2024 2019 2067 2050JJA 2004 2007 2084 2084
IP (Iberian Peninsula)DJF 2019 2016 21++ 21++JJA 2000 2000 2041 2039
FR (France)DJF 2021 2021 21++ 21++JJA 2009 2013 2046 2046
ME (Mid-Europe)DJF 2018 2014 2075 2084JJA 2012 2012 2080 2080
SC (Scandinavia)DJF 2014 2014 2042 2039JJA 2016 2016 2037 2037
AL (Alps)DJF 2015 2014 2091 2081JJA 2004 2004 2066 2063
MD (Mediterranean)DJF 2012 2002 21++ 2059JJA 2000 2002 2050 2050
EE (Eastern Europe)DJF 2015 2018 2049 2041JJA 2007 2007 2075 2075
EU (all of Europe)DJF 2008 2004 2050 2040JJA 2001 2001 2063 2063
Table 2. Median years of change (YC) in temperature andprecipitation for winter (DJF) and summer (JJA). The firstcolumn for each variable represents original model data. Thesecond represent the YC when the influence of the NAO hasbeen removed. 21++ indicates that YC occurs after 2100 inmore than half of the models. Italics indicate that between
half and all but one model reach YC before 2100

Clim Res 56: 103–119, 2013112
4. INFLUENCE OF THE NAO
The NAO exerts major influence on the inter- seasonal and inter-annual temperature and precipita-tion variability in Western Europe (e.g. Hurrell 1995,Pinto & Raible 2012). Unforced NAO variations can
both add to and subtract from forced regional climatetrends. GCM results indicate that the NAO will gen-erally be more positive with the overall global warm-ing, but the magnitude of the changes is uncertain(Meehl et al. 2007). We remove the NAO in the statis-tical sense from the RCM data and see whether this
Fig. 6. (Continued on next page.) Temporal correlation between seasonal mean North Atlantic Oscillation index (NAOI) andtemperature for 1961−2050. This page: winter (DJF), next page: summer (JJA). The first panel in each set shows the correla-tion between observed temperatures (E-OBS) and the NAOI. In the other panels, the model NAOI is correlated with the
model temperature. Only correlations above a 95% significance level are shown

Kjellström et al.: Emerging regional climate change in Europe
affects the emergence of the change signals in tem-perature and precipitation. Figs. 6 & 7 present ordi-nary Pearson correlations between the NAOI andseasonal mean temperature and precipitation. Calcu-lations are done for the period 1961−2050. Areas oflow correlation (and significance) are masked out.The results are much as expected. Milder and wetterwintertime conditions in Northern and Western Eu-rope are linked to the positive phase of the NAO, as
are colder and drier conditions in the southwest andthe Mediterranean region. The connections are moremarked in winter when the influence of the large-scale circulation is more dominant than in summer. Insummer, there is an indication of more precipitationin the Scandinavian mountains and warmer condi-tions in northernmost Scandinavia in situations withhigh NAOI both in the E-OBS data and in many of theRCMs. There is also a negative correlation for tem-
113
Fig. 6. (continued)

Clim Res 56: 103–119, 2013
perature in parts of Western Europe, which is gener-ally more marked in the RCMs than in E-OBS.
The results when the influence of the NAO onthe temperature and precipitation series was re -moved for each region by regression, as ex plainedabove, are shown in Figs. 8 & 9. If there were noeffect of NAO, the respective change year would
not change, and the points would fall on the diago-nal. If the change year moves forward in time, thepoints end up above the diagonal. If the time ofchange moves earlier in time, the points will bebelow the diagonal.
Removing the influence of the NAO leads to earlieremergence of signals in the winter temperature for
114
Fig. 7. (Continued on next page.) Temporal correlation between seasonal mean NAOI and precipitation for 1961−2050. Other details as in Fig. 6, except here for precipitation

Kjellström et al.: Emerging regional climate change in Europe
some models and regions (Fig. 8, Table 2). This isconsistent with lowered variance due to removingthe influence of the NAO, as the signals are easier todetect against a background with less variance. Rel-atively large shifts of about a decade are seen for afew models in the British Isles and the Mediterraneanregion. These are both regions with a relatively highdegree of correlation between the temperature and
NAO index (Fig. 6). Detrending the NAOI does notgenerally affect the results (data not shown), whichcan be explained by the small time-trend in NAOhere. For summer temperature, the NAO influence issmall, and there are mostly minor changes (Fig. 8).
Also, for precipitation, there is an earlier emer-gence of signals when the NAO influence is removedin the models (Fig. 9). This is most pronounced in
115
Fig. 7. (continued)

Clim Res 56: 103–119, 2013
winter, while it is only seen for a few cases in sum-mer. Compared to temperature, we note that somemodels and regions now fall outside of the plottingranges in both raw model output and NAO correcteddata. Further, in some winter cases, a year of emer-gence lies within the 21st century only in the NAOcorrected data; these are also included in the figure(at YC = 2100 on the horizontal axis) to better empha-size the role of the NAO influence. Table 2 showsthat the median year of change emerges 1 to 2decades earlier in some of the regions for winter andsummer precipitation when NAO is accounted for,while in the other areas, there is no difference.
5. DISCUSSION
A clear temperature change signal emerges inmost of the RCMs around 2020. For precipitation, theresults are much more variable, which is at least par-tially explainable by the large natural variability ofprecipitation as well as the models’ different pat-terns, and magnitudes of the projected changes (cf.Figs. 3 & 4). In some parts of Europe, the projectedprecipitation changes are furthermore quite small,which is aligned with the larger-scale distribution ofincreases toward high latitudes and decreases in thesub-tropics (e.g. Christensen et al. 2007).
116
YC
NA
O c
orre
cted
YC
NA
O c
orre
cted
DJF
YC raw model output
JJA
Fig. 8. Year of significant change (YC) in period-means of temperature with (horizontal axis) and without (vertical axis) the effect of the NAO for winter (left) and summer (right). The dashed lines indicate a shift in time ± 10 yr
DJF
YC raw model output
JJA
YC
NA
O c
orre
cted
YC
NA
O c
orre
cted
Fig. 9. Year of significant change (YC) in period-means for precipitation with (horizontal axis) and without (vertical axis) effectof the NAO for winter (left) and summer (right). The data points are for those different models for which a ‘first year of change’was obtainable, i.e. models for which that year did not fall outside the data range in both raw model output and NAO correcteddata. In some winter cases, a YC during the 21st century was only obtained in the NAO corrected data, these are marked to the
right (at YC = 2100). The dashed lines indicate a shift in time ± 10 yr

Kjellström et al.: Emerging regional climate change in Europe 117
Our results generally agree with those of Diffen-baugh et al. (2011), who, based on projections with 1GCM and 1 RCM and for a baseline of 1970−1999,found that over much of the continental USA, re -gional temperature change signals appeared before2020, with some sub-regional variation. They alsocom pared their results to studies using CMIP3GCMs. Also based on CMIP3 GCMs, Giorgi & Bi(2009) searched for the ToE of sub-continental pre-cipitation change signals. For Europe, their analysisincluded the winter half-year in Northern Europeand both half-years in the Mediterranean. For theformer region, they found a signal prior to 2020,whereas for the latter, the signals came about in the2030s in most cases. Their results are not directlycomparable to ours because they use another base-line (1980−1999) and also because they include bothinter-model spread and internal model multi-decadalvariability in their estimate of the uncertainty againstwhich the signal is evaluated.
Hawkins & Sutton (2012) analysed the ToE of tem-perature change signals in CMIP3 GCMs and em -phasised the uncertainty related to the simulatedinternal variability. Their comparison was for half-years and with respect to 1986−2005. They found anearlier ToE for the boreal summer than the borealwinter for much of Europe. This is in broad agree-ment to the present results in our study (Table 2).Further, they found that the signals emerged earlierin Southern than in Northern Europe. This is broadlyconsistent with the results presented here, for whicha change in temperature generally emerges earlier inSouthern Europe compared to the Scandinavianregion (Fig. 5). For precipitation, however, this is notthe case as the emergence is among the earliest inthe Scandinavian region in both winter and summer.
The choice of the baseline period has of coursesome influence on the results (Ruokolainen & Räisä-nen 2007). In the studies mentioned above, some-what different periods have been used. A later refer-ence period reasonably pushes the clear signalsforward in time compared to an earlier one. We alsonote that our definition of the year of change taken asthe middle of the 30 yr interval is arbitrary, andanother definition, such as the end of the interval,would of course alter the actual year of change, withimplications for comparison to other studies. Differ-ences between the present results and those in theother studies are likely also related to the differencesin the number of GCM simulations and perhaps tothe higher degree of detail in RCMs. Nevertheless,the number of GCMs that underlie these RCM simu-lations, although several, is small. For temperature
with an earlier emergence, we therefore compare theresults based on 15 models presented above with thelarger 21-member ensemble consisting of all modelsin Table 1. This larger ensemble, including simula-tions based on 2 additional GCMs, differs onlyslightly from the 15-model ensemble (data notshown). Only in Scandinavia in winter and in EasternEurope in spring and summer do the median years ofemergence differ by >10 yr between the 2 ensem-bles. The similarity between the 2 sets of data indi-cates that the 15-member ensemble is a relativelygood representative of the larger 21-member ensem-ble, at least for temperature. In contrast, the ENSEM-BLES RCM projections only cover part of the uncer-tainty range (van der Linden & Mitchell 2009),implying that the uncertainty in our estimates proba-bly appears smaller than if a larger number of GCMshad been used. However, we also emphasize herethat model spread is not a sufficient measure of trueuncertainty (Räisänen 2007).
Cimate aspects other than seasonal temperatureand precipitation may have a different signal (change)to noise (internal variability) ratio. On a global scale,there are expectations of an early emergence of sig-nals in temperature extremes (Zwiers et al. 2011). Insome parts of Europe, depending on the season, thecold and warm extremes show larger projectedchanges than the corresponding seasonal means(Niku lin et al. 2011). At the same time, the inter- annual variability is high in Europe, and the emer-gence of a statistically significant change lags behindthat of lower latitudes (e.g. Ruo ko lainen & Räisänen2009). Nevertheless, if the question were posed not as‘when can we expect to see significant changes in theseasonal means’ but as ‘when can we expect to seesignificant climate changes’, additional indices andmetrics would clear ly need to be considered, depend-ing on the ap pli cation. Thus, our results should not beinterpreted as showing the earliest possible emer-gence of regional-scale climate change from the1961−1990 internal variability envelope. A differentapproach is to examine the probability that conditionswill change across specific periods. Räisänen &Alexandersson (2003), used CMIP2 (Meehl et al.2000) GCMs to make a probabilistic forecast for theSwedish climate in the first decade of the 21st century,and suggested a 95% possibility of warmer annualmeans and an 87% possibility of wetter conditionscompared to 1961−1990.
The assumption of which emission scenario to in -corporate is probably less crucial for the first half ofthe century (cf. Giorgi & Bi 2009), except for loweremission scenarios (Hawkins & Sutton 2012). A fur-
Clim Res 56: 103–119, 2013118
ther development of the study could be to considerRCM biases as diagnosed from model evaluation,and determine whether these biases could beinvariant in terms of changing climate (cf. Buser etal. 2009, Lorenz & Jacob 2010, Boberg & Chris-tensen 2012, van Haren et al. 2012). Another issuecould be aero sols’ regional-scale climate effects andtheir temporal evolution, given the expectations ofdecreasing aero sol or aerosol precursor emissions inEurope. RCMs that do not carry aerosol effectscould thus deviate from those that do when aerosolschange over time.
6. SUMMARY AND CONCLUSIONS
Regional temperature and precipitation time serieswere extracted from a number of RCM projectionsuntil the end of the 21st century. A means test wasapplied between sliding windows and the 1961−1990reference period for each model and both variablesfor a number of European sub-regions and the wholeof Europe. The first year when the temperature andprecipitation, respectively, changed significantly (atthe 99% level) was analysed.
The models’ NAO was correlated against the mod-els’ temperature and precipitation. The overall mod-elled correlation patterns resembled those observed.The effect of the removal of the NAO influence fromthe temperature and precipitation fields was ana-lysed to look for a possible masking effects of theNAO influence on the emergence of forced climatechange signals in regional temperature and precipi-tation. NAO variability has some significance for theresult. Removal of the NAO influence resulted in anearlier emergence of signals in winter temperaturefor some models and regions. This is also true for pre-cipitation and again most pronounced in winter.Detrending the NAOI did not generally affect theresults. Based on the results, it was concluded thatregional-scale climate change signal in seasonaltemperatures could be expected to emerge around2020 in much of Europe, including sub-regionalscales. The results also show that the models thatshow an early significant change in temperature aremore in line with the observations than the ensemblemean. Whether these ‘earliest’ GCM-RCM combina-tions have more realistic climate sensitivity than theothers or if this is a result of natural variabilityremains an open question. For precipitation, theresults are much more variable, and in some areas,robust signals do not emerge by 2100 in the consid-ered projections.
Acknowledgements. Part of this work was done in theIMPACT2C and ECLISE projects that receive funding fromthe European Union Seventh Framework Programme(FP7/2007−2013) under grant agreements 282746 and265240, respectively. Part of this work was done under theSwedish strategic research area ModElling the Regional andGlobal Earth system (MERGE). In addition, this studyreceived financial support from the Danish Agency for Sci-ence, Technology and Innovation through the Centre forRegional Change in the Earth System (CRES; www.cres-centre.dk) under contract no. DSF-EnMi 09-066868. TheENSEMBLES RCM data and E-OBS data used in this workwas funded by the EU FP6 Integrated Project ENSEMBLES(contract no. 505539), whose support is gratefully acknowl-edged. Further, we acknowledge the data providers in theECA&D project. The Climate Analysis Section at NCAR,Boulder, CO, is acknowledged for updating and providingdata on the NAO index. Finally, we are grateful for the con-structive comments on a previous version of the manuscriptmade by 3 anonymous reviewers.
LITERATURE CITED
Boberg F, Christensen JH (2012) Overestimation of Mediter-ranean summer temperature projections due to modeldeficiencies. Nature Clim Change 2: 433−436
Buser CM, Kunsch HR, Lüthi D, Wild M, Schär C (2009)Bayesian multi-model projection of climate: bias assump-tions and interannual variability. Clim Dyn 33: 849−868
Christensen JH, Christensen OB (2007) A summary of thePRUDENCE model projections of changes in Europeanclimate by the end of the century. Clim Change 81: 7−30
Christensen JH, Hewitson B, Busuioc A, Chen A and others(2007) Regional climate projections. In: Solomon S, QinD, Manning M, Chen Z and others (eds) Climate change2007: the physical science basis. Contribution of WorkingGroup I to the Fourth Assessment Report of the Inter -governmental Panel on Climate Change. CambridgeUniversity Press, Cambridge, p 847−940
Collins M, Booth BBB, Bhaskaran B, Harris GR, Murphy JM,Sexton DMH, Webb MJ (2011) Climate model errors,feedbacks and forcings: a comparison of perturbedphysics and multi-model ensembles. Clim Dyn 36: 1737−1766
Déqué M, Rowell DP, Lüthi D, Giorgi F and others (2007) Anintercomparison of regional climate simulations forEurope: assessing uncertainties in model projections.Clim Change 81(Vol 1, Suppl): 53−70
Déqué M, Somot S, Sanchez-Gomez E, Goodess CM, JacobD, Lenderink G, Christensen OB (2012) The spreadamongst ENSEMBLES regional scenarios: regional cli-mate models, driving general circulation models andinter annual variability. Clim Dyn 38: 951−964
Diffenbaugh NS, Ashfaq M, Scherer M (2011) Transientregional climate change: analysis of the summer climateresponse in a high-resolution, century-scale ensembleexperiment over the continental United States. J Geo-phys Res 116: D24111, doi:10.1029/2011JD016458
Ebisuzaki W (1997) A method to estimate the statistical sig-nificance of a correlation when the data are serially cor-related. J Clim 10: 2147−2153
ENSEMBLES (2012) Regional climate model data base fromthe ENSEMBLES project. Available at http: // ensemblesrt3 . dmi.dk/ (accessed 01 January 2012)

Kjellström et al.: Emerging regional climate change in Europe
Feser F, Rockel B, von Storch H, Winterfeldt J, Zahn M(2011) Regional climate models add value to globalmodel data: a review and selected examples. Bull AmMeteorol Soc 92: 1181−1192
Giorgi F, Bi X (2009) Time of emergence (TOE) of GHG-forced precipitation change hot-spots. Geophys Res Lett36: L06709, doi:10.1029/2009GL037593
Haugen JE, Iversen T (2008) Response in extremes of dailyprecipitation and wind from a downscaled multimodelensemble of anthropogenic global climate change sce-narios. Tellus 60A: 411−426
Hawkins E, Sutton R (2009) The potential to narrow uncer-tainty in regional climate predictions. Bull Am MeteorolSoc 90: 1095−1107
Hawkins E, Sutton R (2012) Time of emergence of climatesignals. Geophys Res Lett 39: L01702, doi:10.1029/2011GL050087
Haylock MR, Hofstra N, Klein Tank AMG, Klok EJ, JonesPD, New M (2008) A European daily high-resolutiongridded dataset of surface temperature and precipita-tion. J Geophys Res 113: D20119, doi:10.1029/2008JD010201
Hegerl G, Zwiers F (2011) Use of models in detection andattribution of climate change. WIREs Clim Change 2: 570−591
Hegerl GC, Zwiers FW, Braconnot P, Gillett NP and others(2007) Understanding and attributing climate change. In: Solomon S, Qin D, Manning M, Chen Z and others (eds)Climate change 2007: the physical science basis. Contri-bution of Working Group I to the Fourth Assessment Re -port of the Intergovernmental Panel on Climate Change.Cambridge University Press, Cambridge, p 663–746
Hurrell JW (1995) Decadal trends in the North AtlanticOscillation: regional temperatures and precipitation. Science 269: 676−679
Joshi M, Hawkins E, Sutton R, Lowe J, Frame D (2011) Projec-tions of when temperature change will exceed 2°C abovepre-industrial levels. Nature Clim Change 1: 407−412
Kendon E, Jones R, Kjellström E, Murphy J (2010) Using anddesigning GCM-RCM ensemble regional climate projec-tions. J Clim 23: 6485−6503
Kjellström E, Ruosteenoja K (2007) Present-day and futureprecipitation in the Baltic Sea region as simulated in asuite of regional climate models. Clim Change 81(Vol 1,Suppl): 281−291
Kjellström E, Nikulin G, Hansson U, Strandberg G, UllerstigA (2011) 21st century changes in the European climate: uncertainties derived from an ensemble of regional cli-mate model simulations. Tellus 63A: 24−40
Lorenz P, Jacob D (2010) Validation of temperature trends inthe ENSEMBLES regional climate model runs driven byERA40. Clim Res 44: 167−177
Mahlstein I, Portmann RW, Daniel JS, Solomon S, Knutti R(2012) Perceptible changes in regional precipitation in afuture climate. Geophys Res Lett 39: L05701, doi:10.1029/2011GL050738
Meehl GA, Boer GJ, Covey C, Latif M, Stouffer RJ (2000)The Coupled Model Intercomparison Project (CMIP).Bull Am Meteorol Soc 81: 313−318
Meehl GA, Stocker TF, Collins WD, Friedlingstein P and
others (2007) Global climate Projections. In: Solomon S,Qin D, Manning M, Chen Z and others (eds) Climatechange 2007: the physical science basis. Contribution ofWorking Group I to the Fourth Assessment Report of theIntergovernmental Panel on Climate Change. Cam-bridge University Press, Cambridge, p 747–846
Nakicenovic N, Swart R (eds) (2000) Special report on emis-sions scenarios. A Special Report of Working Group III ofthe Intergovernmental Panel on Climate Change. Cam-bridge University Press, Cambridge
NAO (2012) NAO index data provided by the Climate Ana lysis Section, NCAR, Boulder, USA, Hurrell (1995).Available at https: //climatedataguide.ucar.edu/ guidance/hurrell- north-atlantic-oscillation-nao-index-station-based (accessed 01 January 2012)
Nikulin G, Kjellström E, Hansson U, Jones C, Strandberg G,Ullerstig A (2011) Evaluation and future projections oftemperature, precipitation and wind extremes overEurope in an ensemble of regional climate simulations.Tellus 63A: 41−55
Pinto GJ, Raible CC (2012) Past and recent changes in theNorth Atlantic oscillation. WIREs Clim Change 3: 79−90
Räisänen J (2007) How reliable are climate models? Tellus59A: 2−29
Räisänen J, Alexandersson H (2003) A probabilistic view onrecent and near future climate change in Sweden. Tellus55A: 113−125
Rummukainen M (2010) State-of-the-art with regional cli-mate models. WIREs Clim Change 1: 82−96
Ruokolainen L, Räisänen J (2007) Probabilistic forecasts ofnear-term climate change: sensitivity to adjustment ofsimulated variability and choice of baseline period. Tel-lus 59A: 309−320
Ruokolainen L, Räisänen J (2009) How soon will climaterecords of the 20th century be broken according to cli-mate model simulations? Tellus 61A: 476−490
Sheffield J, Wood EF (2008) Projected changes in droughtoccurrence under future glocal warming from multi-model, multi-scenario, IPCC AR4 simluations. Clim Dyn31: 79−105
Stott PA, Gillett NP, Hegerl GC, Karoly DJ, Stone DA, ZhangX, Zwiers F (2010) Detection and attribution of climatechange: a regional perspective. WIREs Clim Change 1: 192−211
Thejll PA (2001) Decadal power in land air temperatures: Is itstatistically significant? J Geophys Res 106: 31693−31702
van der Linden P, Mitchell JFB (eds) (2009) ENSEMBLES: climate change and its impacts: summary of research andresults from the ENSEMBLES project. Met Office HadleyCentre, Exeter
van Haren R, van Oldenborgh GJ, Lenderink G, Collins M,Hazeleger W (2012) SST and circulation trend biasescause an underestimation of European precipitationtrends. Clim Dyn 40: 1−20
van Oldenborgh GJ, Drijfhout S, van Ulden A, Haarsma Rand others (2009) Western Europe is warming muchfaster than expected. Clim Past 5: 1−12
Zwiers FW, Zhang X, Feng Y (2011) Anthropogenic influ-ence on long return period daily temperature extremesat regional scales. J Clim 24: 881−892
119
Editorial responsibility: Mauricio Lima, Santiago, Chile
Submitted: August 1, 2012; Accepted: November 27, 2012Proofs received from author(s): February 26, 2013