Emerging Opportunities for Smallholder Tobacco Farmers 5 ... · Farm costs are defined as any cost...
13
Emerging Opportunities for Smallholder Tobacco Farmers 5 December 2018
Transcript of Emerging Opportunities for Smallholder Tobacco Farmers 5 ... · Farm costs are defined as any cost...

E m e r g i n g O p p o r t u n i t i e s fo r S m a l l h o l d e r To b a c c o Fa r m e r s
5 D e c e m b e r 2 0 1 8

Outline
I. Understand current patterns
II. Identify diversification opportunities
III. Work toward inclusive business models

What do we know about
tobacco farmers today?

The 5 percent of households engaged in tobacco farming share many challenges with other agricultural households. They also tend to be more diversified, connected, and exposed.
CURRENT PATTERNS || TOBACCO-FARMING HOUSEHOLDS
4
[confidential & proprietary – not for distribution]
60% 85% +
Probability of tobacco activity1
Note 1: 1 km x 1 km grids show the estimated probability of tobacco being farmed in the area. Areas with a probability of tobacco farming less than 60% are shown in gray. Water bodies are shown in blue. Source: Fraym
Dowa
Kasungu
Rumphi
Limited access to reliable marketsFew rural areas with tobacco activity have reliable access to agricultural markets.
Limited food security and diet diversityOnly 1 in 4 tobacco-farming households has a diverse diet, and 3 in 4 are food insecure.
Male decision-makersSignificantly more likely than other agricultural households to have a male household head and crop decision-maker.
Shared Challenges
Key Differences
More access to small assets and financial servicesHigher mobile phone, bicycle, and bank account ownership.
Greater exposure to market shocks40% affected by high input costs and 75% affected by low output prices, higher than other agricultural households.

- 50 100 150 200 250
Farm sales per hectare
Farm profit per hectare
Farm costs per hectare
MWK (thousands)
Non-tobacco households Tobacco households
0 5 10 15 20
Total
Agriculture
Livestock
Labor
Wage
Hours worked per worker per week
Non-tobacco households Tobacco households
Hours Worked¹ Costs, Sales, and Spending²
CURRENT PATTERNS || LABOR AND PRODUCTION
Tobacco households have more diversification through livestock and crop variety. Per hectare costs, sales, and profits are significantly higher than other households.
5
[confidential & proprietary – not for distribution]
Note 1: Data on labor comes from a seven day recall of the number of hours worked in the past week. Statistics above do not include individuals who reported working zero hours in the past seven days. Child labor is defined as any person, aged 5-17, who reported working some amount of time in the last seven days. Note 2: Data on farm sales and profits only include households that are engaged in agricultural activities and made sales. Cost data is only for households that had costs. Farm costs are defined as any cost associated with farming, and includes seeds, inputs, labor, and transportation.Source: Fraym
Tobacco household members typically work fewer hours per week but spend more time on farming and livestock activities.
Tobacco households produce similar amounts of crops, but have higher costs, sales, and profit per hectare.
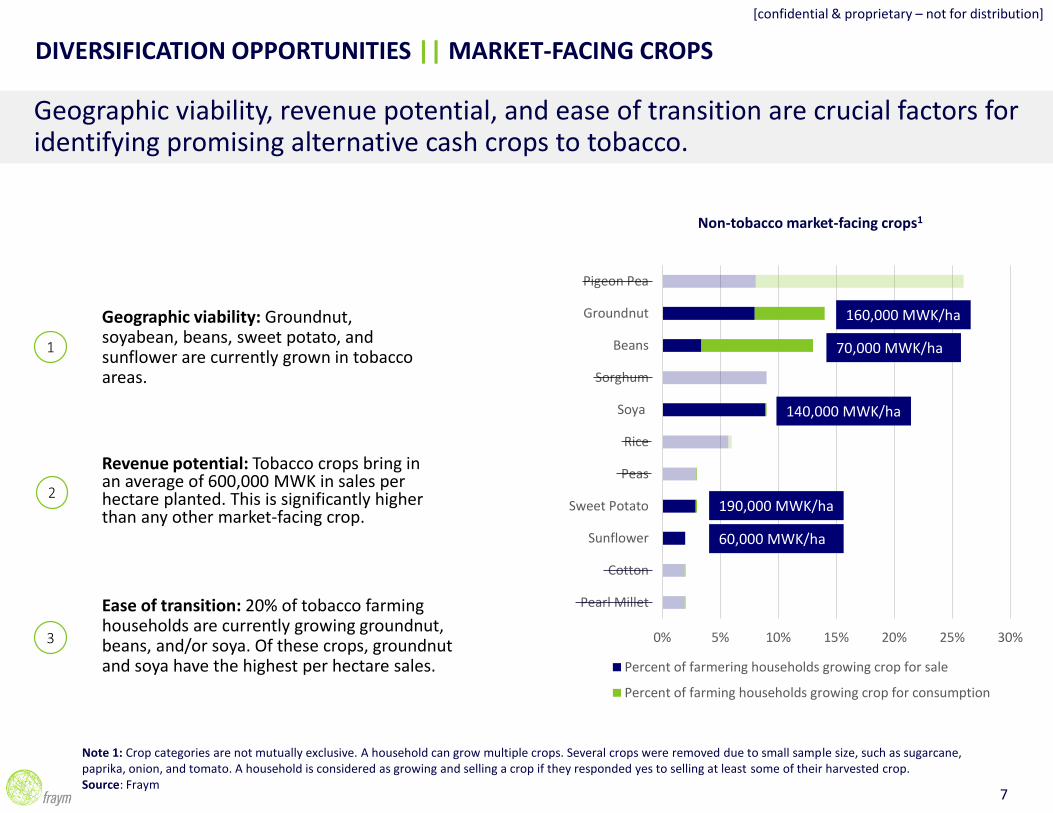
Where are there opportunities for diversification?
1
2
3
Geographic viability: Groundnut, soyabean, beans, sweet potato, and sunflower are currently grown in tobacco areas.
Revenue potential: Tobacco crops bring in an average of 600,000 MWK in sales per hectare planted. This is significantly higher than any other market-facing crop.
Ease of transition: 20% of tobacco farming households are currently growing groundnut, beans, and/or soya. Of these crops, groundnut and soya have the highest per hectare sales.
Non-tobacco market-facing crops1
DIVERSIFICATION OPPORTUNITIES || MARKET-FACING CROPS
Geographic viability, revenue potential, and ease of transition are crucial factors for identifying promising alternative cash crops to tobacco.
7
[confidential & proprietary – not for distribution]
Note 1: Crop categories are not mutually exclusive. A household can grow multiple crops. Several crops were removed due to small sample size, such as sugarcane, paprika, onion, and tomato. A household is considered as growing and selling a crop if they responded yes to selling at least some of their harvested crop.Source: Fraym
0% 5% 10% 15% 20% 25% 30%
Pearl Millet
Cotton
Sunflower
Sweet Potato
Peas
Rice
Soya
Sorghum
Beans
Groundnut
Pigeon Pea
Percent of farmering households growing crop for sale
Percent of farming households growing crop for consumption
70,000 MWK/ha
190,000 MWK/ha
60,000 MWK/ha
160,000 MWK/ha
140,000 MWK/ha

Soya and groundnut appear particularly well-suited for the central tobacco-growing area.
DIVERSIFICATION OPPORTUNITIES || CURRENT STATUS
8
[confidential & proprietary – not for distribution]
Source: Fraym8
0% 30% + 0% 25% +
Percent of agricultural households growingSoya Groundnut
Percent of tobacco-farming households growing soya:
Mchinji: 41%Kasungu: 12%
Dowa: 24%
Percent of tobacco-farming households growing groundnut:
Mchinji: 54%Kasungu: 33%
Dowa: 31%

How can we work toward inclusive
business models?
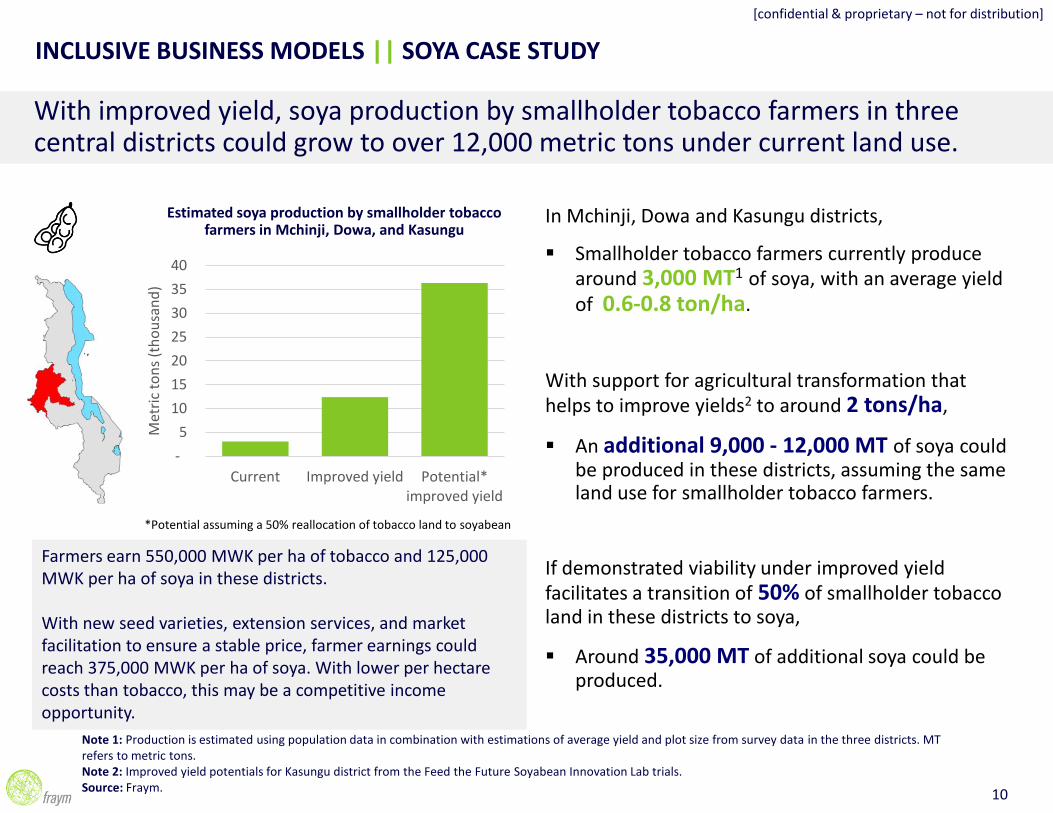
In Mchinji, Dowa and Kasungu districts,
▪ Smallholder tobacco farmers currently produce around 3,000 MT1 of soya, with an average yield of 0.6-0.8 ton/ha.
With support for agricultural transformation that helps to improve yields2 to around 2 tons/ha,
▪ An additional 9,000 - 12,000 MT of soya could be produced in these districts, assuming the same land use for smallholder tobacco farmers.
If demonstrated viability under improved yield facilitates a transition of 50% of smallholder tobacco land in these districts to soya,
▪ Around 35,000 MT of additional soya could be produced.
INCLUSIVE BUSINESS MODELS || SOYA CASE STUDY
With improved yield, soya production by smallholder tobacco farmers in three central districts could grow to over 12,000 metric tons under current land use.
10
[confidential & proprietary – not for distribution]
Note 1: Production is estimated using population data in combination with estimations of average yield and plot size from survey data in the three districts. MT refers to metric tons.Note 2: Improved yield potentials for Kasungu district from the Feed the Future Soyabean Innovation Lab trials.Source: Fraym.
Estimated soya production by smallholder tobacco farmers in Mchinji, Dowa, and Kasungu
Farmers earn 550,000 MWK per ha of tobacco and 125,000 MWK per ha of soya in these districts.
With new seed varieties, extension services, and market facilitation to ensure a stable price, farmer earnings could reach 375,000 MWK per ha of soya. With lower per hectare costs than tobacco, this may be a competitive income opportunity.
*Potential assuming a 50% reallocation of tobacco land to soyabean
-
5
10
15
20
25
30
35
40
Current Improved yield Potential*improved yield
Met
ric
ton
s (t
ho
usa
nd
)
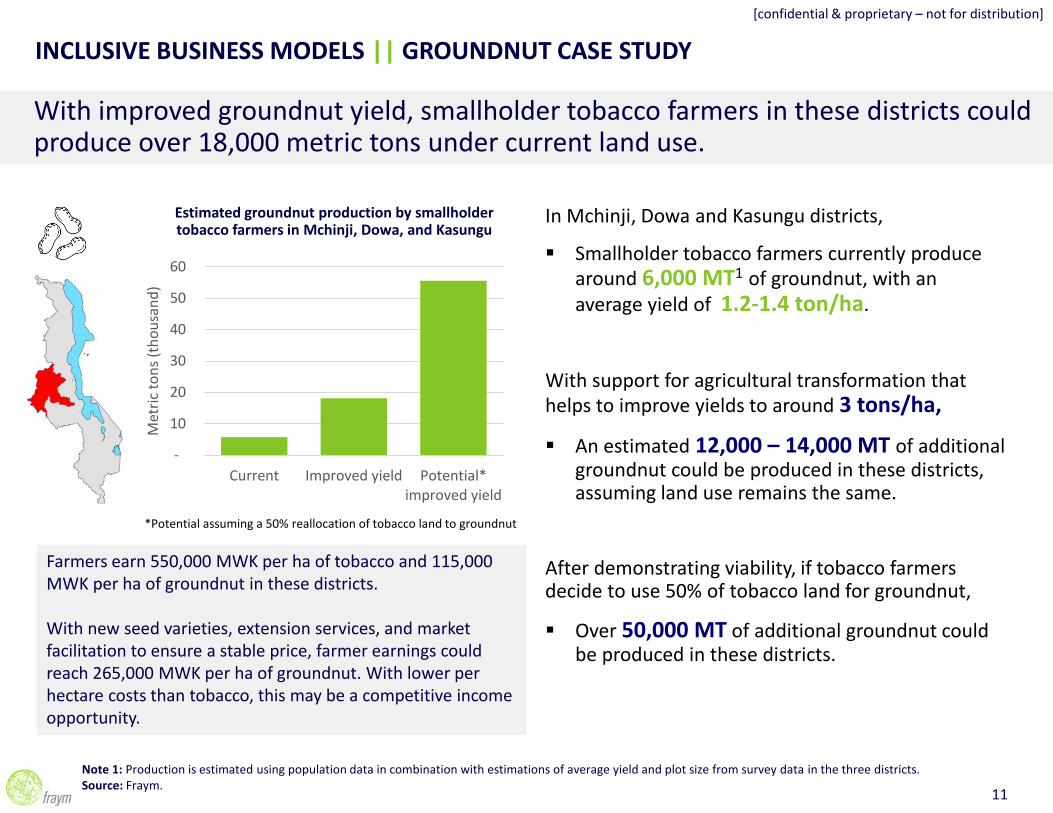
In Mchinji, Dowa and Kasungu districts,
▪ Smallholder tobacco farmers currently produce around 6,000 MT1 of groundnut, with an average yield of 1.2-1.4 ton/ha.
With support for agricultural transformation that helps to improve yields to around 3 tons/ha,
▪ An estimated 12,000 – 14,000 MT of additional groundnut could be produced in these districts, assuming land use remains the same.
After demonstrating viability, if tobacco farmers decide to use 50% of tobacco land for groundnut,
▪ Over 50,000 MT of additional groundnut could be produced in these districts.
INCLUSIVE BUSINESS MODELS || GROUNDNUT CASE STUDY
With improved groundnut yield, smallholder tobacco farmers in these districts could produce over 18,000 metric tons under current land use.
11
[confidential & proprietary – not for distribution]
Note 1: Production is estimated using population data in combination with estimations of average yield and plot size from survey data in the three districts.Source: Fraym.
Estimated groundnut production by smallholder tobacco farmers in Mchinji, Dowa, and Kasungu
Farmers earn 550,000 MWK per ha of tobacco and 115,000 MWK per ha of groundnut in these districts.
With new seed varieties, extension services, and market facilitation to ensure a stable price, farmer earnings could reach 265,000 MWK per ha of groundnut. With lower per hectare costs than tobacco, this may be a competitive income opportunity.
*Potential assuming a 50% reallocation of tobacco land to groundnut
-
10
20
30
40
50
60
Current Improved yield Potential*improved yield
Met
ric
ton
s (t
ho
usa
nd
)

To drive impact by identifying opportunities for innovative supply chains, Fraym predicted milk production across Uganda. Similar analysis of crop concentrations can provide key insight for alternative crop production in Malawi.
INCLUSIVE BUSINESS MODELS || MILK PRODUCTION IN UGANDA
12
[confidential & proprietary – not for distribution]
Dairy companiesPearlAmosLake SideGBK
Dairy companiesBrooksideJesa
Note: The greater Kampala region shows a high level of milk production as the methodology to estimate milk production is a function of population.Source: Fraym
Kampala
Kabale
Mbarara
Total predicted annual milk production* Uganda: 2.1 billion litersMbarara: 208 million liters* Note: Does not include large commercial milk production.
Predicted milk production (liters per day)
Note: Each grid represents a 10x10 km2 area, with non-zero predicted milk production.
0 – 2,000
2,000 – 5,000
5,000 – 10,000
10,000 – 20,000
20,000 – 50,000
50,000 +

i n fo @ f ray m . i o