EMERGENCY FOOD SECURITY ASSESSMENT Mindanao, …
58
World Food Programme Food Security Assessment – Mindanao, Philippines 2007 1 EMERGENCY FOOD SECURITY ASSESSMENT Mindanao, Philippines, October-November 2007 Team members: Yvonne Forsén, WFP Regional Bureau for Asia Sahib Haq, WFP Pakistan Balparitosh Dash, WFP India Michael Sheinkman, WFP Regional Bureau for Asia
Transcript of EMERGENCY FOOD SECURITY ASSESSMENT Mindanao, …

World Food Programme Food Security Assessment – Mindanao, Philippines 2007
1
EMERGENCY FOOD SECURITY
ASSESSMENT
Mindanao, Philippines, October-November 2007
Team members: Yvonne Forsén, WFP Regional Bureau for Asia Sahib Haq, WFP Pakistan Balparitosh Dash, WFP India Michael Sheinkman, WFP Regional Bureau for Asia

World Food Programme Food Security Assessment – Mindanao, Philippines 2007
2
Summary...........................................................................................................................3 1 Background ...................................................................................................................6
1.1 Economic Background.............................................................................................7 1.2 Health and Nutrition ................................................................................................8 1.3 Background of the Assessment................................................................................9 1.4 Objectives ................................................................................................................9 1.5 Methodology............................................................................................................9 1.6 Limitations .............................................................................................................10
2 Results ..........................................................................................................................10 2.1 Demographics of the Sample .................................................................................10
2.1.1 Dependency ratio ....................................................................................11 2.1.1. Ethnic groups .........................................................................................11
2.2 Housing ..................................................................................................................11 2.3 Assets .....................................................................................................................12
2.3.1. Household assets and productive assets.................................................12 2.3.2. Education ...............................................................................................14
2.4 Food Availability on Markets ................................................................................14 2.4.1 Market Characteristics and Networks.....................................................14 2.4.2 Commodity Flows...................................................................................15 2.4.3 Credit Availability and Access ...............................................................15
2.5 Food Access ...........................................................................................................17 2.5.1 Market Performance and Food Access ...................................................17 2.5.2 Income Sources/Livelihoods...................................................................19 2.5.3 Expenditures and Food Purchase ............................................................20 2.5.3.1 Minimum cost of healthy food basket .................................................20 2.5.4 Household Food Access..........................................................................21 2.5.5 Food Aid .................................................................................................23 2.5.6 Food Sources...........................................................................................24
2.6 Food Consumption, Utilization and Health Status ................................................24 2.6.1 Who Has Poor Food Consumption? .......................................................26 2.6.2 Health......................................................................................................26
2.7 Food Security .........................................................................................................27 2.7.1 Who is Food Insecure?............................................................................28 2.7.2 Households experiencing shocks ............................................................32 2.7.3 Coping Strategies ....................................................................................33
2.8 Risk to Lives and Livelihoods ...............................................................................34 2.8.1 Who is at Risk to Lives or Livelihood? ..................................................36
3. Chronic versus Transitory Food Insecurity ............................................................36 4. Shocks and opportunities in the coming year..........................................................37 5. Exit strategy................................................................................................................37 6. Recommendations ......................................................................................................38 Annex 1. Rapid Traders’ Survey Questionnaire........................................................39
Annex 1b Markets included in the Assessment ..............................................44 Annex 2. Household Questionnaire................................................................................45 Annex 3. Logistics plan.................................................................................................55 Annex 4. Scenarios ........................................................................................................56 Annex 5. Response options and capacities ..................................................................57

World Food Programme Food Security Assessment – Mindanao, Philippines 2007
3
Summary Food insecurity in Mindanao is primarily a problem of inadequate household access to food. Chronic neglect of the region has resulted in much higher levels of poverty than in other parts of the country. During the field data collection, the assessment team observed conditions of food insecurity and poverty among the population of Mindanao that were much worse than what they had expected. Analysis of the data reveals that a large proportion of the households surveyed had inadequate food consumption in the week prior to the assessment. Many households expend more than 65 percent of their total household expenditure on food commodities. Most purchase a large proportion of their food using credit which is only available at high interest rates. The majority rely on one unstable income source. A large proportion of households involved in agriculture are tenant farmers. The assessment covered 47 villages (barangays) and 558 households within those villages. Purposive sampling was used to select the villages, while the households within the villages were selected randomly. A market study was also part of the assessment covering different types of markets. In total 70 traders were interviewed at various levels. The Mindanao conflict goes back several decades and has crippled the region both socially and economically. A ceasefire was finally forged in July 2003 but an agreement has however until to date not been signed. Although there is ceasefire, persistent instability is part of daily life due to frequent clashes and constant threats in Mindanao, less so due to political differences than to clan clashes the so called Rido. The Mindanao conflict is a social conflict with a complex set of causes and specific dynamics due to intermingling historical, economical, political and social factors. One of the underlying causes is the competition for natural resources and loss of access to land. Injustice is another cause which manifests itself in social exclusion and marginalisation of the Muslim and Indigenous People (IP) from the mainstream social and economic life. The major sources of income in Mindanao are agriculture, fishing and forest- related products. Steel, cement and coconut oil are some of the important products of the region. Coconut, pineapple, rubber, sugarcane, rice, corn, banana and other fruits are the main agricultural produce. Mindanao has rich mineral resources such as gold, copper, iron, chromium, silver, zinc, clay gypsum, limestone and phosphate and hydroelectric power is provided by the Maria Cristina Falls. However, a third of the rural poor in the Philippines are found in Mindanao. The rural sector of Mindanao remains in a state of stagnation. The national incidence of poverty in 2000 was 40 percent, according to the National Statistics Office. This indicator was considerably higher in the regions of Mindanao with the highest percentage of families living in poverty in the Autonomous Region of Muslim Mindanao (ARMM) at 74 percent. A 2006 baseline nutrition assessment in the five conflict affected provinces where WFP is operational showed wasting is worse than the 2003 national average, while stunting and underweight are higher than the 2003 national average in three of the provinces. Results The findings indicate that structural issues have caused a chronic food insecurity situation in Mindanao. The results of the assessment show that 26 percent of the interviewed households are assessed as severely food insecure, 43 percent moderately food insecure and 31 percent of the households are food secure. The food consumption of more than a tenth of the households was assessed as poor, whilst the food consumption of another 28 percent of the households was assessed as borderline. The diet of households with poor food consumption is mainly based on rice, vegetables, and sugar. They don’t consume animal proteins, as fish, meat or eggs, nor dairy products, fruits and use hardly oil. The diet of households with borderline food consumption is fairly similar, but includes consumption of some fish and eggs, some fruits and every other day oil. As the assessment took place right after the rice harvest, it is assumed that some of the households with borderline food consumption are likely to fall into poor food consumption during the lean period (January-March). Access to food is one of the main causes of food insecurity in Mindanao. The majority of the households have poor or very poor access to food in terms of their expenditure on food. Some 61 percent of the assessed households spent more than 65 percent of their total expenditure on food. Severely food insecure households spent even more than 80 percent of their expenditure on food. Purchase is the most common food source. Only tubers and vegetables are more often acquired from own production than purchase.
World Food Programme Food Security Assessment – Mindanao, Philippines 2007
4
A significant proportion of food expenditure is on credit, which further shows the poor purchasing power of these households. On average some 30 percent of food was purchased on credit in the past month. This percentage might have been slightly higher than normal, as the month prior to the assessment coincided with Ramadan when families consume slightly better and more food. Nevertheless, the usage of credit is substantial in accessing food. The analysis of data on consumer price indices suggests that prices of most of the food products show a secular trend of increase in the provinces where the market assessment survey took place. Increased prices of food commodities have a negative effect on the access of food by poor households. The majority of the households rely on one, often unreliable, income source. Less than 50 percent of the households have two income sources. Households depending on farming as main income source are by far the largest group of surveyed households, representing about two-third of the households. Most of them are tenant farmers, who usually keep only 10-20 percent of their harvest while the rest has to be given to their land owner. Yields are relatively low due to poor agricultural practices and very limited access to irrigation. Farmers report that access to affordable fertilizers is a major constraint. Households with farming, daily labour or unskilled unemployment and petty trade as main income source have the largest share of severely food insecure households. Twenty-eight percent of households with farming and gardening as main income source are assessed as severely food insecure, and 23 percent of the households with daily or unskilled labour or petty trade fall in this category. The majority of the households experienced a shock in the past year that affected their food intake and/or their food access. About a third of these households adopted coping strategies posing a risk to life, including reduction of meal sizes (17%) and reduction of number of daily meals (17%). Almost half of these households adopted coping strategies posing a risk to their livelihoods, including borrowing money (61%) and purchasing food on credit (29%). Household food security status was assessed by analyzing household expenditure on food as a percentage of total expenditure and household food consumption in the week prior to the assessment. To determine if a household is at risk to lives or livelihoods, both the food security status of the household and the coping strategies the household resorted to in the past month were analyzed. For example, a moderately food insecure household could be determined to be at risk to livelihoods based on its food security status alone. If this household resorts to coping strategies posing a risk to lives, this moderately food insecure household could be determined to be at risk to lives. Based on the cross tabulation between food security status and coping strategies, it is estimated some 42 percent of the households are at risk to lives, 48 percent are at risk to livelihoods, whilst 10 percent are not at risk to either livelihood or lives. Those households who are at risk to lives should be assisted immediately through recommended interventions. Households whose livelihoods are at risk to livelihoods need assistance as well, but the type of assistance can be of a different kind. When interpreting the survey results, it should be stressed purposive sampling was used to select communities for the household survey. This means generalization of the results to other areas of Mindanao should be done with caution as the survey results are not representative for the whole area. WFP re-opened its country office in Philippines in March 2006 and begun an Emergency Operation (EMOP) in Mindanao in June the same year. The EMOP is terminating in March 2008. In order to prepare for a new project document for 2008 it was necessary to assess the food security situation at household level in the six conflict affected provinces of Mindanao where WFP is operational: Maguindanao; Lanao Del Norte; Lanao Del Sur; Sultan Kudarat; and Zamboanga. Recommendations in order of priority WFP food assistance to the conflict affected population of Mindanao should continue. Food For Education (FFE) activities should continue. They address two major problems: bringing more children to school and improving food access at household level at a constant and regular manner. There is anecdotal evidence that it contributes to a reduction of child labour. The rice take home ration is a substantial contribution to a households’ intake of staple food which they otherwise would have to be purchased at the market. Food for Work (FFW) and/or Voucher for Work activities should continue. During lean season FFW can reduce the reliance upon credit and create or rehabilitate community assets remote conflict affected areas. Including Community Health Workers as beneficiaries of Food For Work activities should be considered. Community Health Volunteers are in charge of some complementary activities to the MCH programme such as delivering preventive

World Food Programme Food Security Assessment – Mindanao, Philippines 2007
5
health messages to mothers. The workload for health staff has increased with WFP interventions. To ensure good results volunteer workers could be given an incentive. MCH programme should continue, but in stronger collaboration with UNICEF and UNFPA. Malnutrition remains a serious problem. Women and children less than 24 months old are particularly vulnerable to the consequences of food insecurity. Food for training should continue, as skills training will enable households to diversify their income sources. Currently the majority of households rely on one income, most often agriculture. Usually, these tenant farmers have to give 80-90 percent of their harvest to the land owner. Advocate for improved social services and infrastructure to remove constraints on food access. Advocate for an increased employment of teachers and nurses. There has been increased use of public facilities following WFP FFE and MCH interventions and this has highlighted the need for additional trained personnel. Advocate for micro credit schemes by other stakeholders to enable households to borrow money at affordable interest rates.

World Food Programme Food Security Assessment – Mindanao, Philippines 2007
6
1 Background The Philippines is divided into three major island groups:
1. Luzon, with an area of 141 thousand square kilometres; 2. Mindanao, with an area of 102 thousand square kilometres; and 3. Visayas, with an area of 57 thousand square kilometres
The island group of Mindanao has six administrative regions:
Zamboanga Peninsula (Region IX) Northern Mindanao (Region X) Davao Region (Region XI) SOCCSKSARGEN (Region XII) Caraga (Region XIII) Autonomous Region in Muslim Mindanao (ARMM)
These regions are further subdivided into 25 provinces, of which four are separate island groups: Balilan, Sulu, Tawi Tawi, and Camiguan. The historical root of the Mindanao conflict originates in the marginalization and exclusion of the Muslims and the Lumads (Indigenous People). Mindanao was not subjugated by colonial regimes and hence, the region and its people were not assimilated into mainstream Filipino Christian society. In modern times, the conflict between Muslims and Christians erupted as a result of the government’s policy of encouraging resettlement to Mindanao of Christians from the densely populated northern islands. The problem of displacement of Muslims and Lumads worsened when the Philippine land frontier closed in the 1960s. Calls for the creation of a separate Muslim state in Mindanao and other adjoining islands began to surface in the late 1960s. In the early 1970s, full scale war between the Moro National Liberation Front (MNLF) and the Philippine government erupted when then President Ferdinand Marcos ordered an assault on MNLF positions. In 1976, a ceasefire agreement was signed by the two parties, mediated by Libya. Under the accord, the MNLF dropped its demand for independence and focused on creation of an autonomous region for the Muslims. In 1988, the Organic Act for the Autonomous Region Muslim Mindanao” (ARMM) was passed during the administration of President Corazon Aquino. By that time, Christians had become the majority in most Mindanao provinces. As a result, only four provinces, where the Muslims were the majority, voted to become part of ARMM. The MNLF rejected the result of the process and armed conflict persisted, though at a low level of intensity. The Moro Islamic Liberation Front (MILF) emerged at that time, led by Ustad Hashim Salamat, a Muslim religious leader. While both MNLF and MILF called for the establishment of a separate state for the Muslims, the MILF called for establishment of an “Islamic state” in Mindanao. In 1996, the Government of the Philippines signed a peace agreement with the MNLF. This further highlighted the differences between the MNLF and the MILF. The inability of the government to fully comply with the provisions of the 1996 peace agreement and to alleviate the socio-economic conditions of the Muslims reduced the credibility of the MNLF. Dissatisfied members of the MNLF and young Muslims became more attracted to the MILF. By the late 1990s, the MILF had become the dominant Moro rebel group in Mindanao. To check its growing strength, a full-scale military offensive against MILF positions was ordered by President Joseph Estrada in 2000. The ensuing conflict resulted in the displacement of more than 900,000 civilians. In 2003, hostilities between the government and the MILF erupted again, displacing at least 400,000 people. A ceasefire was signed between the two parties in July 2003. In anticipation of a final peace agreement, the United Nations, the World Bank, and other donors organized a Joint Needs Assessment mission in 2004 to collect information to support reconstruction and development planning.1 A formal peace agreement has not yet been signed, but the cease-fire agreement of 2003 has successfully limited armed confrontation for more than four (4) years already. The last large scale armed confrontation was in Sulu during 2007. However, instability persists with frequent minor incidents and the constant threat of violence due to clashes between clans.
1 Joint Needs Assessment in the Conflict affected areas of Mndanao for reconstruction and development programme, UN2005

World Food Programme Food Security Assessment – Mindanao, Philippines 2007
7
RIDO is the local name for feuding or clan conflicts in Mindanao and refers to a state of recurring hostilities between families and kinship groups characterised by a series of retaliatory act of violence carried out to avenge a perceived affront injustice. Rido has wider implications for conflict in Mindanao because it interacts with the separatist conflict and other forms of armed violence. Many confrontations in the past involving insurgent groups and military were in fact triggered by a local Rido e.g. in 2004, 2005 and 2006 that sparked major armed confrontations. Such hostilities underscore the potential of local feuds and third party actors to frustrate the peace process between the government and the MILF. The Asia Foundation recently published a study of Rido which documented 1,266 cases occurring between 1930 and 2005 which resulted in the deaths of more than 5,500 people. Of these cases of clan conflict, 64 percent remain unsolved. The findings also show a steady increase in Rido conflicts in recent years. Fifty percent of all Rido incidents recorded through 2004, occurred in the five last years (2000-2004).2 The conflict in Mindanao is a social conflict with complex set of causes and specific dynamic due to intermingling historical, economical, political and social factors. One of the underlying causes is competition for natural resources, including access to land. Injustice is one cause which manifests itself in social exclusion and marginalisation of the Muslim and Indigenous people (IPs) from the mainstream social and economic life.3
1.1 Economic Background
The major sources of income in Mindanao are agriculture, fishing, and forest- related products. Coconut, pineapple, rubber, sugarcane, rice, corn, banana and other fruits are the main agricultural produce. Mindanao has rich mineral resources such as gold, copper, iron, chromium, silver, zinc, clay gypsum, limestone phosphate, and hydroelectric power is provided by the Maria Cristina Falls. Steel, cement and coconut oil are important industrial products of the region.
A third of the rural poor in the Philippines can be found in Mindanao, with its rural sector remaining in a state of stagnation. The national incidence of poverty was estimated at 40 percent in 2000, according to the National Statistics Office. Poverty incidence in the regions of Mindanao is considerably higher than the national average. At 74 percent the Autonomous Region of Muslim Mindanao (ARMM) has the highest incidence of poverty in the nation.
Mindanao has tremendous potential for economic development. It has agro-climatic and geographic advantages for agriculture and fisheries sector growth. Rural poverty has not been addressed due to: Low levels of public expenditures for critical infrastructure; Poor functioning of transport systems and rural markets; inadequate post-harvest facilities; limited reach of agricultural support services; difficulty in accessing necessary production inputs; and lack of integrated rural development planning and implementation. The pace of de-centralisation has remained slow and many Local Government Units (LGU) are yet to mature as effective providers of devolved agricultural support services, as stipulated in the LGC. Communities have not been effectively integrated into the LGU and DA decision-making processes for rural development priorities and investments.4
There are strong interrelationship between the conflict, the neglect of Mindanao, and the prevailing poverty. Although Mindanao’s contribution to the national treasury has been substantial, infrastructure and social, education, and health services in the Muslim and IP areas have been neglected. Small farmers have limited access to land, credit, technology, production facilities and rural infrastructure. Conflicts regarding development and exploitation of natural resources between government, private companies and local (IP) population are common.5
Results of the 2002 Annual Poverty Indicators Survey (APIS) showed that about 250,000 of the approximately 1,000,000 children and youth aged 6 to 24 years in ARMM were out of school. Among the children and youth who belonged to families in the bottom 40 percent income group in ARMM, 28 percent were out of school. This was much higher than the 18 percent of children of families belonging to the upper 60 percent income group.
The area is subject to heavy rain during the months of June to October and is drier from February to June, a period which is considered the lean season when not much agricultural activity is taking place, fishing in the swampy areas is reduced. During this period families depend on income from daily labour which frequently involves competing for
2 RIDO, Clan Feuding and Conflict Management in Mindanao, Wilfredo Magno Torres III, 2007 3 Conflict Analysis in two Provinces of Mindanao (Lanao Norte and Sultan Kudrat), Susanne Thiel and Olive Fillone June 2006. 4 World Bank, project appraisal doc. 03.07 5 Conflict Analysis in two provinces of Mindanao (Lanao Norte and Sultan Kudrat), Susanne Thiel and Olive Fillone June 2006

World Food Programme Food Security Assessment – Mindanao, Philippines 2007
8
available work. Daily wages vary between 70 to 80 pesos per day6, the minimum daily wage rate set by the government for this region in 2004 is approximately 150 pesos, twice what daily unskilled labourers actually receive. Children are frequently paid the same wage for their labour and this is a contributing factor to low rates of enrolment and attendance in primary school.
1.2 Health and Nutrition The 2003 national Demographic Health Survey found 27.6% underweight, 30.4% stunting and 5.5% wasting. In 2006, WFP and UNICEF commissioned the Food and Nutrition Research Institute (FNRI) to conduct a baseline nutrition assessment in the six provinces where WFP planned to implement EMOP ACAM. FNRI collected data from households in June and July 2006. Results of the survey are presented by province in the Table below. Maguindanao and Sultan Kudarat have a higher prevalence of all three indicators of malnutrition, while wasting is worse in all provinces except Lanao Del Sur. Unfortunately, the FNRI report does not present any analysis of the underlying causes of malnutrition. Nutritional indicators, FNRI Mindanao survey 2006 Classification / Nutrition Status
Lanao Del Norte*
Lanao Del Sur* Maguindanao Sultan
Kudarat North
Cotabato
Weight-for-Age (27.6%) Underweight 26.4 28.5 34.4 30.5 26.2 Normal 72.1 69.7 63.2 67.8 72.1 Overweight 1.6 1.8 2.4 1.7 1.6 Height-for-Age Stunting 28.1 37.3 36.4 34.3 21.9 Normal 71.0 61.2 62.2 63.6 76.0 Tall 0.9 1.5 1.5 2.2 2.1 Weight-for-Height Wasting 6.4 5.9 7.1 8.2 8.3 Normal 91.8 92.1 89.3 89.1 89.9 Overweight for Height 1.6 1.1 2.6 2.1 1.6
*Unweighted The FNRI survey found that 21.6 percent of pregnant women were nutritionally at risk of delivering low birth babies and more than 50 percent of the pregnant women were also anaemic (see Table XX). Exclusive breastfeeding is practiced on average for 2-3 months only. Complementary food is introduced is commonly introduced at 3-4 months of age and consists of soft boiled rice. Prevalence of Anaemia, FNRI Mindanao survey 2006 Population group Lanao Norte Lanao Sur Maguindanao Sultan
Kudarat North Cotabato
Children 49.5 43.4 45.0 39.4 38.4 Pregnant women 53.6 54.2 51.5 34.2 43.6 Lactating women 50.5 50.8 42.4 38.0 36.1
The FNRI survey found that Vitamin-A deficiency was experienced by 11 percent of pregnant and lactating mothers in the form of night blindness. This level of Vitamin-A deficiency is regarded a public health problem by the World Health Organization. The FNRI survey also found that the majority of households consume three (3) meals per day. Iodised salt was detected in over 90 percent of all households surveyed and therefore was not considered a problem requiring intervention. The Joint Needs Assessment found that food insecurity is a prevailing condition in many communities, with risks of malnutrition and childhood-related developmental delays. Access to potable water and proper sanitary facilities is severely limited, thus increasing the risks of disease and death. Many children have not been fully or even partially immunized and thus infectious diseases are prevalent and not quickly contained due to low immunization coverage.
6 Key informant interviews from this assessment
World Food Programme Food Security Assessment – Mindanao, Philippines 2007
9
itment.
The limited number of health facilities, health workers, medicines, and supplies; and major logistical challenges are severe hindrances in ensuring an improvement of the above.
1.3 Background of the Assessment WFP re-opened a country office in Philippines in March 2006 and begun an EMOP (Emergency Operation) in Mindanao in June the same year. The EMOP is terminating in March 2008 and thus is order to prepare for a new project document for 2008 an assessment was required to assess the food security situation at household level in the six conflict affected provinces of Mindanao where WFP is operational, Maguindanao, Lanao Del Norte, Lanao Del Sur, Sultan Kudarat, and Zamboanga. The objectives of the EMOP as per approved document are to; contribute to a peaceful resolution of the conflict in Mindanao by addressing the food security needs of vulnerable populations living in conflict-affected areas. More specifically, the EMOP seeks to: support the reconstruction of household and community assets. Improve the nutritional status of: pregnant and lactating women and children under-two years of age. Increase the net enrolment rate and attendance rate for boys and girls in grades 1 through 6. Support restoration of livelihoods. Support extension of treatment programmes for Tuberculosis (TB); Strengthen the Government and NGOs/Civil Society in the implementation of effective food assistance in conflict affect areas in Mindanao7. During the course of the EMOP, the objective related to TB support was dropped, in consultation with the government, due to inadequate regional government support and comm
1.4 Objectives The general objective of this assessment is to examine the overall food security situation in six provinces of Mindanao, in order to identify appropriate food assistance interventions for the continuation of WFP operations in Mindanao. This is the first Household Food Security Assessment carried out by WFP in the selected provinces and thus will also function as a type of baseline to which future assessments can be compared. Specific assessment objectives: • Review the overall food security in these provinces; • Review underlying causes of food insecurity; • Identify hazards and risks (vulnerabilities and capacities); and • Recommend appropriate response strategies, including food aid activities.
1.5 Methodology
The Emergency Food Security Assessment at Mindanao has three parts, i.e. household’s interview, key informant interviews and a market survey. All three parts were launched simultaneously in the six provinces assisted by WFP.
A purposive sample was taken for the household and key informant survey in the six provinces. A two-stage stratified sampling technique was used. In the first stage the area was divided in two strata: conflict and non-conflict affected areas. In the second stage each stratum was further divided into accessible and remote barangays and a separate sample was taken for each of the four strata. A total of 47 barangays (villages) were assessed with twelve households selected randomly in each barangay. In total 559 households were interviewed and 47 key informant discussions were held. The population represented by the purposive sample is 107,000 people.
Number of surveyed households by type of community Conflict affected community Non-conflict affected community
Remote Accessible Remote Accessible
177 128 139 115
7 EMOP 10489
World Food Programme Food Security Assessment – Mindanao, Philippines 2007
10
The household survey was conducted by four teams, each with four enumerators supervised by team leader. These teams were sent to different geographical area, see logistics plan in annex 3 after a two day training that included field testing of tools. The field work was started simultaneously from 24th October and ended on 2nd November 2007.
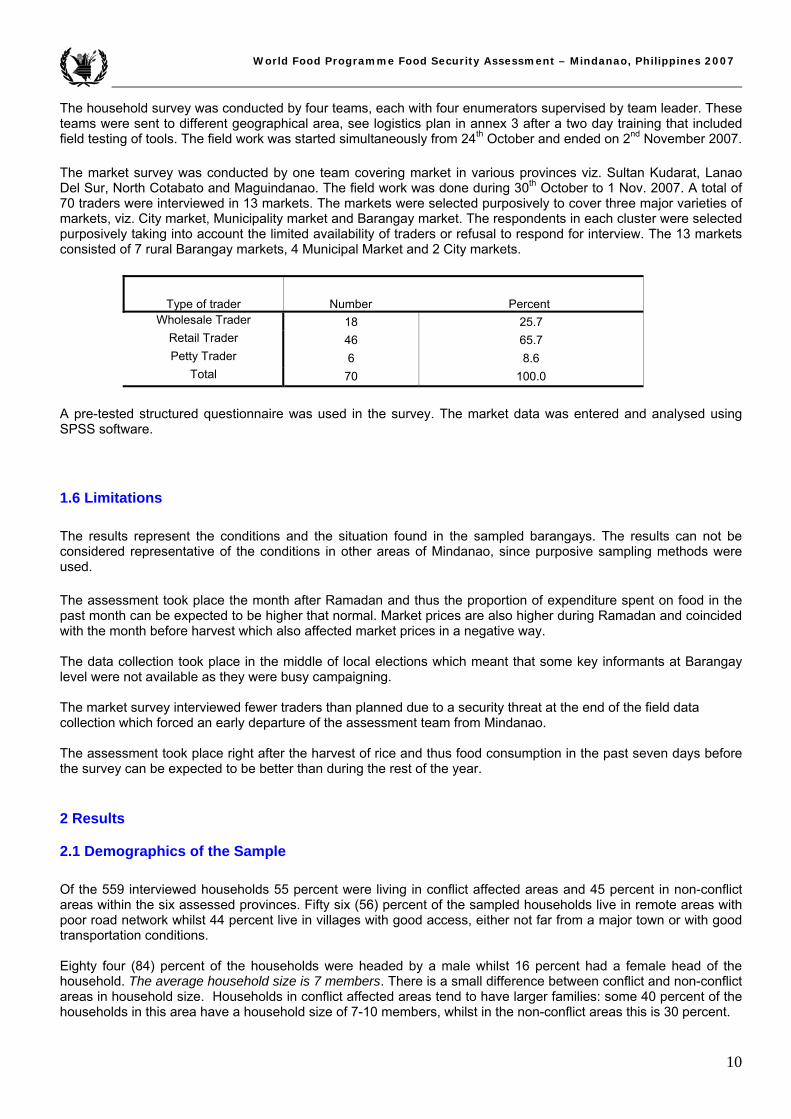
The market survey was conducted by one team covering market in various provinces viz. Sultan Kudarat, Lanao Del Sur, North Cotabato and Maguindanao. The field work was done during 30th October to 1 Nov. 2007. A total of 70 traders were interviewed in 13 markets. The markets were selected purposively to cover three major varieties of markets, viz. City market, Municipality market and Barangay market. The respondents in each cluster were selected purposively taking into account the limited availability of traders or refusal to respond for interview. The 13 markets consisted of 7 rural Barangay markets, 4 Municipal Market and 2 City markets.
Type of trader Number Percent Wholesale Trader 18 25.7
Retail Trader 46 65.7 Petty Trader 6 8.6
Total 70 100.0
A pre-tested structured questionnaire was used in the survey. The market data was entered and analysed using SPSS software.
1.6 Limitations The results represent the conditions and the situation found in the sampled barangays. The results can not be considered representative of the conditions in other areas of Mindanao, since purposive sampling methods were used. The assessment took place the month after Ramadan and thus the proportion of expenditure spent on food in the past month can be expected to be higher that normal. Market prices are also higher during Ramadan and coincided with the month before harvest which also affected market prices in a negative way. The data collection took place in the middle of local elections which meant that some key informants at Barangay level were not available as they were busy campaigning. The market survey interviewed fewer traders than planned due to a security threat at the end of the field data collection which forced an early departure of the assessment team from Mindanao. The assessment took place right after the harvest of rice and thus food consumption in the past seven days before the survey can be expected to be better than during the rest of the year. 2 Results
2.1 Demographics of the Sample Of the 559 interviewed households 55 percent were living in conflict affected areas and 45 percent in non-conflict areas within the six assessed provinces. Fifty six (56) percent of the sampled households live in remote areas with poor road network whilst 44 percent live in villages with good access, either not far from a major town or with good transportation conditions. Eighty four (84) percent of the households were headed by a male whilst 16 percent had a female head of the household. The average household size is 7 members. There is a small difference between conflict and non-conflict areas in household size. Households in conflict affected areas tend to have larger families: some 40 percent of the households in this area have a household size of 7-10 members, whilst in the non-conflict areas this is 30 percent.

World Food Programme Food Security Assessment – Mindanao, Philippines 2007
11
Sixty-four (64) percent of the households have been displaced due to conflict during certain periods in the past years. Ninety-three (93) percent of the households living in conflict areas have been displaced while 28 percent of those living in non-conflict areas have been displaced.
2.1.1 Dependency ratio Dependency ratio is the ratio of non-earning members of the household with the potential earning ones. The potential earning members are comprised of household members within the age group of 15-59, while the other household members are considered the non-earning household members. A high dependency ratio is likely to increase the vulnerability of a household in a crisis situation as it increases pressure on the household’s assets and income. For households with poor and unreliable income sources, a higher dependency ratio probably allows little or no savings, which makes them highly vulnerable to shocks. A dependency ratio above 200 means each earning household member must earn enough to feed about 3 or more family members. Especially for households with a low income level a high dependency ration can be critical for meeting household expenses, especially food. Dependency Ratio in conflict versus non-conflict affected villages 100 & below 100-150 151-200 Above 200 Conflict 57.7 33.3 10 16.7 Non-conflict 54.8 35.2 13.2 13.2
2.1.1. Ethnic groups The largest representation of ethnic groups in the sample is the Maranao with 40 percent, the Maguindanaon with 27 percent and the Iranun with 12 percent.
Ethnic Groups among Sampled Households.
Ethnic groups in sample
40%
5%7%
12%
5%
1%2%
27%
1%
MaranaoVisayanCebuanoIranunIlonggoIlocanoBlaanMaguindanaonOther
2.2 Housing The type of housing is often related to level of poverty, measured here by the type of floor and the type of toilet facility of a household. Amongst the overall sampled households the most common type of flooring is earth/sand and wood plank. As indicated in the graph below the poorest quality of housing is seen in remote conflict areas with a much higher percentage of households having earth/sand floor than households in the other village categories. The very same pattern is seen in the type of toilet facilities that a household has access to. Some 30 percent of the remote conflict affected households have no toilet at all More than 95 percent of all households use firewood/charcoal for cooking and there were no differences between the village categories.

World Food Programme Food Security Assessment – Mindanao, Philippines 2007
12
Source of lighting follows the same pattern as for the other housing indicators. The remote conflict affected households have much less access to electricity than the households in other village categories. They were also the only ones to report using candles or cooking fires as a source of light. .
household assets
0
50
100
150
200
250
radio
telev
ision
mobile
phon
e
refrig
erato
r
cd/dv
d
kareo
ke
car/je
ep
motorcy
cle/tri
cycle
bicyc
le
source of lighting
19%
46% 50%
77%18%
22% 15%
6%
48%
31% 30%16%
0%10%20%30%40%50%60%70%80%90%
100%
remote accessible remote accessible
Conflict area Non-conflict area
OtherFluorescent LightOil or Gas lampKeroseneElectricity
Populations living in remote areas are more likely to be using water sources that are unprotected.
Water sources of assessed households
28 22 1933
811 24
1518 35 39
16 29 8
15 19 14
5
121
0%
20%
40%
60%
80%
100%
remote accessible remote accessible
Conflict area Non-conflict areaDw elling (piped into house) Public tap Protected w ellUnprotected (open dug w ell) Developed spring Undeveloped springRiver/stream/pond/lake/dam other
2.3 Assets
2.3.1. Household assets and productive assets Less than 40 percent of the households have a radio, a major communication tool for government, civil societies etc. Less than 5 percent have any form of transportation equipment such as bicycle, motorbike etc. None of the 559 interviewed households have a tractor.

World Food Programme Food Security Assessment – Mindanao, Philippines 2007
13
Some 40 percent of households living in remote areas (both conflict and non-conflict) have some livestock. The percentage in accessible areas is lower where only 30 percent have some livestock.
Number of livetock owned by households
0
5
10
15
20
25
30
1 2 3 4 1 2 1 2 3 4 1 2 3 4 5 6 1 2 1 2
Cow s/Bullocks Buffalo Goats Chicken/Ducks Horses Pig
number of animals
perc
enta
ge o
f hou
seho
lds
The most common animal asset is poultry with an average ownership of 5 birds. Twenty-five (25) percent of the households have a bullock, presumably for agricultural use. Seventy-seven (77) percent of assessed households have access to land with a mean size of 1.8 hectares. However 60 percent of the households have access to one hectare or less as seen in the graph below. The most common way of acquiring the land is through share cropping (44 percent) some 42 percent have inherited the land whilst only 5 percent of the households have purchased land and 5 percent rent their plot.
Land size used by households with access to land
05
1015202530354045
less than 1Hectare
equal to 1Hectare
above 1 &<=5Hec
above 5 &<=10Hec
above 10and
<=15Hec
above15Hec
A large majority of the households (85 percent) depend on rainfall as their source of water for agriculture. Fifteen (15) percent reported having access to irrigation (canals, pump, river). There is no difference between households living in remote and accessible areas. The main crop produced by the households with land in assessed barangays is maize. Some 60 percent of the farming households report maize as the main crop and 20 percent report rice as the main crop. Coconut is the third main crop produced with some 12 percent of the households with land reporting it as their main crop. The remaining

World Food Programme Food Security Assessment – Mindanao, Philippines 2007
14
households produce cassava and other crops. There are only some very minor differences between the different village categories. A large majority of the households that grow maize store the harvested grain in bags. The same goes for households growing rice. Other methods of storage were neither mentioned by respondents nor observed by the assessment teams during the data collection. On the question what kind of tools households are using to work on their land a majority of the households (51 percent) reported using a plough pulled by horse or bullock. As many as 39 percent of the households are using only hand tools and 5 percent have access to a tractor. The same pattern is seen in all village categories. All the above indicators and results indicate a poorly developed agricultural system which further reduces the yields that the farmers can expect from their land.
2.3.2. Education During key informant interviews it was reported that very few adults in the assessed barangays are literate. Access to education is a well established tool out of poverty and an important asset. The graph below shows the differences in enrolment between the village categories. The remote conflict areas are far behind accessible non-conflict areas highlighting the need to focus on conflict areas. The national statistics indicate that the national level of functional literacy rate is 80 percent whilst for ARMM it is as low as 62 percent.
Percentage of school aged children enrolled in school
81
8890
93
7476788082848688909294
Remote Accessible Remote Accessible
Conflict non-conflict
perc
enta
ge
2.4 Food Availability and Markets
2.4.1 Market Characteristics and Networks Ten (10) out of thirteen (13) of the markets covered by the team were primary in nature with many retailers selling their products directly to consumers. In all the assessed markets more than 80 percent of the traders deal in retail trading and only about 19 percent deal in wholesale trading. The markets structure and infrastructure seems to be quite systematised in the localities visited by the team. However, major marketing activities are focused in and around the city and municipality town centres. The local Barangay level markets have very poor market infrastructure and involve mostly petty trading. This is also reflected in the frequencies of various markets in urban and rural settings. In the rural Barangays, the market frequencies are mostly weekly or bi-weekly whereas the municipal or city markets are operational every day. As a result, both the sellers and the buyers have to go to the urban markets for regular household purchase. Understandably, this results in an increase in price of food products to the extent of transportation and commission among middlemen. Majority of the traders who were interviewed indicated that farmers constitute less than 5% among all traders engaged in selling.

World Food Programme Food Security Assessment – Mindanao, Philippines 2007
15
Trading is the primary and in most cases, the only activity among majority of the traders who were interviewed in the survey. About 76 percent of the traders said that trading is their major activity. However, 37 percent of the traders also mentioned farming as their secondary activity - most of them own the land but have rented the same out or do remote farming.
2.4.2 Commodity Flows Major market trading places are in the urban areas, i.e. city and municipality markets catering to most of the consumers needs of the population in a province, including food requirements. As a result, most of the production of food in the rural areas has their destinations at the municipality and city markets. However, transport facilities being inadequate, the farmers refrain from selling their products in the market and they sell majority of their products to the middlemen. Further, in the absence of a locally available storage facility, the farmers lose bargaining power on price and sell their products in distress mostly at very low prices. However, due to inter-generational credit trap, they are compelled to continue with farming at subsistence or no profit level in sell proceeds. The trading of rice, which is the staple food of the people in Mindanao, needs special mention. Often, the farmers are attached to the local rice millers, who in turn have agents recruited at the farm level. The farmers strings attached to specific millers are mostly linked to input support iin cultivation as the farmers usually have very little capacity to meet their running capital cost. The interest rates on such credit support being extremely high (3-4% per month), it results in an inter-generational debt trap among the poor farmers. Furthermore, lack of adequate facilities for drying and storage of paddy or rice also contributes significantly distress sell by farmers with low farm gate prices – a direct loss to the farmer and gain to the middlemen, millers and traders. The market prices of commodities, especially cereals, are driven by market demand and supply equilibrium. The market prices are however not purely free from market imperfections. There are factors like forced price stabilisation through introduction of procurement and selling price by National Food Authority of Philippines. The norms of procurement set by NFA often leads to large scale sale of paddy crops to private sellers who in turn adopt hoarding as a mechanism to respond to supply induced price reduction. About 65 percent of the traders who were interviewed told that they could bring the food to market within a week to a month. Among those who said that they could bring food to the market, as high as 75% of the traders mentioned that they have the supply capability within a week. This indicates supply side strengths of the markets that were covered in the survey. As a result, one would not find much fluctuation in price of food products, especially rice, across various geographical locations. This is so, notwithstanding the increase or decline in the volume of trading. More than 75 percent of the traders mentioned their trading volume has remained constant or gone down during last one year. The major reason for this was indicated by the traders as good production and competition thereof resulting in reduced volume of individual sell of products by traders. However, about 3 percent of the traders covered in the survey mentioned that the poor law and order situation is one of the factors that had a negative bearing on the volume of food commodities traded.
2.4.3 Credit Availability and Access Buying on credit or borrowing money is commonly done not only during the lean season but the whole year around as different livelihood groups are facing income difficulties at different times of the year. Credit is usually given at an interest rates of 20 percent per month, which increases over time. Pawnshops are also commonly used and start at a 5 percent interest rate that also increases should the client not be able to purchase back the item on set time8. The household interviews show that a large majority of households have access to credit, only some 10 percent stated that they did not have access to any credit. The most common lender is relative or friend whilst a quarter of the households borrow money from a local lender. No one mentioned borrowing from the bank. The same pattern was found in all four barangay categories (conflict-remote, conflict-accessible, non-conflict- remote and non-conflict- accessible).
8 Key informant interviews,
World Food Programme Food Security Assessment – Mindanao, Philippines 2007
16
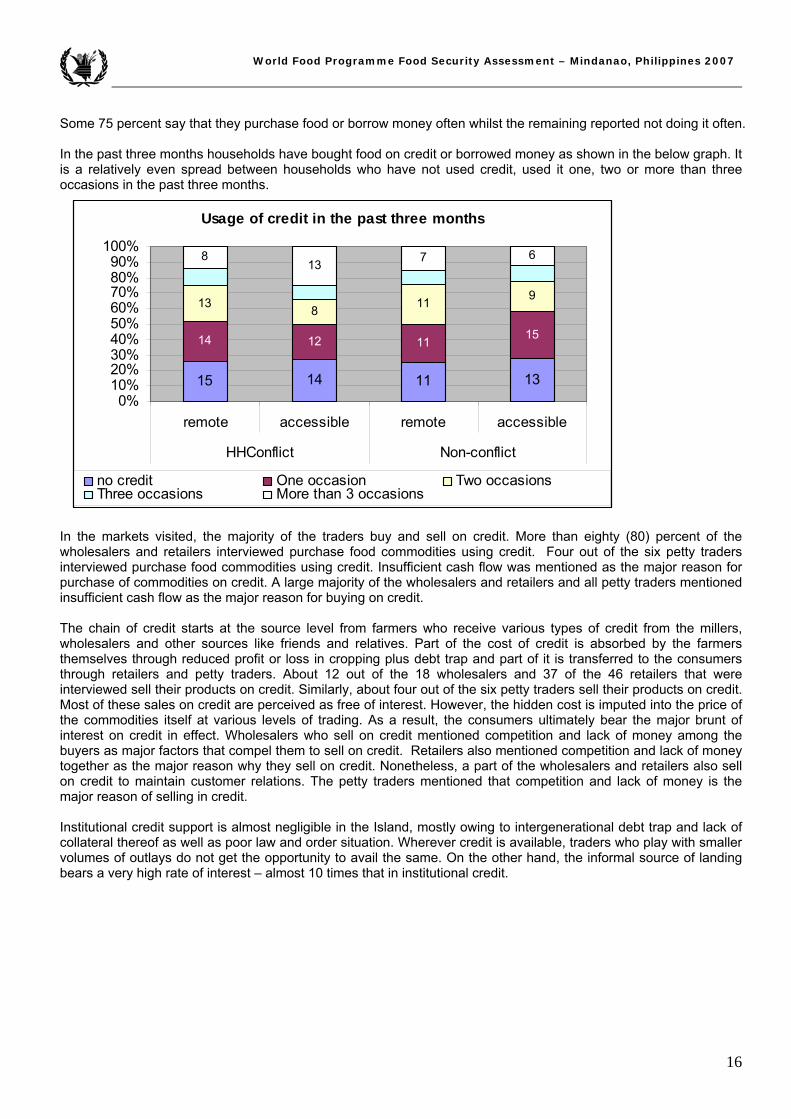
Some 75 percent say that they purchase food or borrow money often whilst the remaining reported not doing it often. In the past three months households have bought food on credit or borrowed money as shown in the below graph. It is a relatively even spread between households who have not used credit, used it one, two or more than three occasions in the past three months.
Usage of credit in the past three months
15 14 11 13
14 12 11 15
13 8 11 9
813 7 6
0%10%20%30%40%50%60%70%80%90%
100%
remote accessible remote accessible
HHConflict Non-conflict
no credit One occasion Two occasionsThree occasions More than 3 occasions
In the markets visited, the majority of the traders buy and sell on credit. More than eighty (80) percent of the wholesalers and retailers interviewed purchase food commodities using credit. Four out of the six petty traders interviewed purchase food commodities using credit. Insufficient cash flow was mentioned as the major reason for purchase of commodities on credit. A large majority of the wholesalers and retailers and all petty traders mentioned insufficient cash flow as the major reason for buying on credit. The chain of credit starts at the source level from farmers who receive various types of credit from the millers, wholesalers and other sources like friends and relatives. Part of the cost of credit is absorbed by the farmers themselves through reduced profit or loss in cropping plus debt trap and part of it is transferred to the consumers through retailers and petty traders. About 12 out of the 18 wholesalers and 37 of the 46 retailers that were interviewed sell their products on credit. Similarly, about four out of the six petty traders sell their products on credit. Most of these sales on credit are perceived as free of interest. However, the hidden cost is imputed into the price of the commodities itself at various levels of trading. As a result, the consumers ultimately bear the major brunt of interest on credit in effect. Wholesalers who sell on credit mentioned competition and lack of money among the buyers as major factors that compel them to sell on credit. Retailers also mentioned competition and lack of money together as the major reason why they sell on credit. Nonetheless, a part of the wholesalers and retailers also sell on credit to maintain customer relations. The petty traders mentioned that competition and lack of money is the major reason of selling in credit. Institutional credit support is almost negligible in the Island, mostly owing to intergenerational debt trap and lack of collateral thereof as well as poor law and order situation. Wherever credit is available, traders who play with smaller volumes of outlays do not get the opportunity to avail the same. On the other hand, the informal source of landing bears a very high rate of interest – almost 10 times that in institutional credit.
World Food Programme Food Security Assessment – Mindanao, Philippines 2007
17
2.5 Food Access
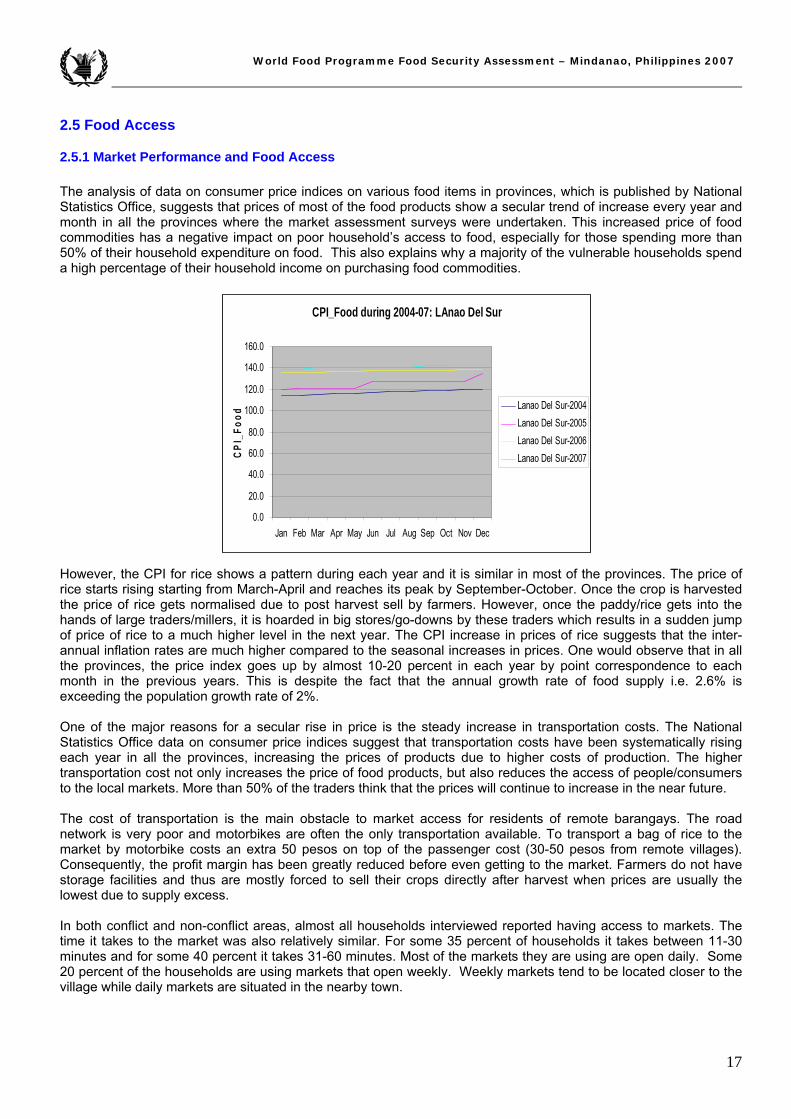
2.5.1 Market Performance and Food Access The analysis of data on consumer price indices on various food items in provinces, which is published by National Statistics Office, suggests that prices of most of the food products show a secular trend of increase every year and month in all the provinces where the market assessment surveys were undertaken. This increased price of food commodities has a negative impact on poor household’s access to food, especially for those spending more than 50% of their household expenditure on food. This also explains why a majority of the vulnerable households spend a high percentage of their household income on purchasing food commodities.
CPI_Food during 2004-07: LAnao Del Sur
0.0
20.0
40.0
60.0
80.0
100.0
120.0
140.0
160.0
Jan Feb Mar Apr May Jun Jul Aug Sep Oct Nov Dec
CP
I_Fo
od
Lanao Del Sur-2004Lanao Del Sur-2005Lanao Del Sur-2006Lanao Del Sur-2007
However, the CPI for rice shows a pattern during each year and it is similar in most of the provinces. The price of rice starts rising starting from March-April and reaches its peak by September-October. Once the crop is harvested the price of rice gets normalised due to post harvest sell by farmers. However, once the paddy/rice gets into the hands of large traders/millers, it is hoarded in big stores/go-downs by these traders which results in a sudden jump of price of rice to a much higher level in the next year. The CPI increase in prices of rice suggests that the inter-annual inflation rates are much higher compared to the seasonal increases in prices. One would observe that in all the provinces, the price index goes up by almost 10-20 percent in each year by point correspondence to each month in the previous years. This is despite the fact that the annual growth rate of food supply i.e. 2.6% is exceeding the population growth rate of 2%. One of the major reasons for a secular rise in price is the steady increase in transportation costs. The National Statistics Office data on consumer price indices suggest that transportation costs have been systematically rising each year in all the provinces, increasing the prices of products due to higher costs of production. The higher transportation cost not only increases the price of food products, but also reduces the access of people/consumers to the local markets. More than 50% of the traders think that the prices will continue to increase in the near future. The cost of transportation is the main obstacle to market access for residents of remote barangays. The road network is very poor and motorbikes are often the only transportation available. To transport a bag of rice to the market by motorbike costs an extra 50 pesos on top of the passenger cost (30-50 pesos from remote villages). Consequently, the profit margin has been greatly reduced before even getting to the market. Farmers do not have storage facilities and thus are mostly forced to sell their crops directly after harvest when prices are usually the lowest due to supply excess. In both conflict and non-conflict areas, almost all households interviewed reported having access to markets. The time it takes to the market was also relatively similar. For some 35 percent of households it takes between 11-30 minutes and for some 40 percent it takes 31-60 minutes. Most of the markets they are using are open daily. Some 20 percent of the households are using markets that open weekly. Weekly markets tend to be located closer to the village while daily markets are situated in the nearby town.

World Food Programme Food Security Assessment – Mindanao, Philippines 2007
18
Shift in Consumer Price Index in Transport and communication during 2004-07: Sultan Kudarat
020406080
100120140160180200
Jan Feb Mar Apr May Jun Jul Aug Sep Oct Nov Dec
Month
CPI
_Tra
nspo
rt
Sultan Kudarat 2004Sultan Kudarat 2005Sultan Kudarat 2006Sultan Kudarat 2007
Shift in Consumer Price Index of Transport and Communication during 2004-07: Maguindanao
0
50
100
150
200
250
Jan Feb Mar Apr May Jun Jul Aug Sep Oct Nov Dec
Month
CPI
_Tra
nspo
rt
Maguindanao-2004Maguindanao-2005Maguindanao-2006Maguindanao-2007
Shift in Consumer Price Index of Transport and Communication during 2004-07: Lanao Del Sur
100
105
110
115
120
125
130
135
140
Jan Feb Mar Apr May Jun Jul Aug Sep Oct Nov Dec
Month
CPI
_Tra
nspo
rt
Lanao Del Sur-2004Lanao Del Sur-2005Lanao Del Sur-2006Lanao Del Sur-2007
Shift in Consumer Price Index in Transport and communication during 2004-07: North Cotabato
0
50
100
150
200
Jan Feb Mar Apr May Jun Jul Aug Sep Oct Nov Dec
Month
CPI
_Tra
nspo
rt North Cotabato 2004North Cotabato 2005North Cotabato 2006North Cotabato 2007

World Food Programme Food Security Assessment – Mindanao, Philippines 2007
19
2.5.2 Income Sources/Livelihoods The most important income source by far is farming, 369 households reported that as their main source whilst 56 households reported daily labour and 32 households reported trade as the main income source. As seen in the table below less than 50 percent of all interviewed households have a second source of income and therefore the majority of households are very dependent on the main source. As previously reported the most common form of farming amongst the assessed communities is share-cropping or tenant farming where the farmers keep a very small amount of the produce and the large majority (80-90 percent) of the harvest goes to the land owner. Thus farming in Mindanao is not seen as a stable and reliable income that can sustain a family during a year. Only 6 percent of the households had three income sources in the past year which they altered between during different periods based on seasonal availability.
Income activities Main
activity second activity Third activity
farming 369 42 5 Livestock & poultry 2 21 Fishing 24 9 Forestry & Hunting 13 20 4 Petty trade 32 37 6 manufacturing 3 5 1 Skilled employment 17 4 1 unskilled employment 13 12 2 daily labour 56 61 7 Transport 6 8 3 mining 2 construction 2 3 remittances 12 13 2 other 6 2 total number of households 557 237 31
There are some minor differences in income sources between the village categories as seen in the graph below. The proportion of households dependent upon farming as their main income source tends to be larger in the remote conflict and non-conflict affected areas than in the accessible conflict and non-conflict affected areas. Fishing was not mentioned as an income source in the non-conflict areas. in the share of households depending on daily labour as main income source is fairly similar between the areas.
Livelihood Sources by type of area
77
5459
70
4
13
2
2
4
1
2
5 1
811
9
1 13 4
5
13
0
10
20
30
40
50
60
70
80
90
100
RemoteConflict
AccessibleConflict
AccessibleNon-conflict
RemoteNon-conflict
Remittances
Transport, storage & commun
Daily labourUnskilled salaried employed
Skilled_salaried employed
Trade
Forestry & HuntingFishing
Farming & gardening

World Food Programme Food Security Assessment – Mindanao, Philippines 2007
20
2.5.3 Expenditures and Food Purchase On average, households spend some 70 percent of overall expenditures on food. Collection of a school fee is the standard practice in elementary schools in Mindanao. Fees vary from school to school from 50 pesos to 350 pesos per year. Each family also has to pay a Teacher Parent Community Association Fee (TPCA) of another 100-190 pesos per year. The average cost for school materials per child is another 100 pesos. The graph below shows that education is the third largest non-food expenditure item after transportation and medical expenses. Education costs sum up to a large expenditure item for households, especially for those whose daily wage is 70 pesos. Teachers explain that no child is expelled should they not be able to pay the fees but many parents do not enrol their child in school because of the fees. Households Expenditure on Food and Non-food items (Monthly)
agri input1.1
non-alcohol0.5
tobacco1.9
HH operation3.0
clothing3.2
education3.2
hiring labour0.0
taxes0.1
Food67.2
toilet articles2.4
transport5.5
celebrations2.5
alcohol0.2
light and water1.6 cooking fuel
0.5
communicaton/mobile phone card
0.8
medical expenses5.2
furnishing expenses0.6
house maintenace0.5veterinary
0.1
2.5.3.1 Minimum cost of healthy food basket Calculations were made based on a household size of seven and the assumption that most food commodities are purchased from markets, except vegetables and tubers (cassava and sweet potato). The spreadsheet NutVal 2006 (University College of London, Centre for International Health and Development / UNHCR / WFP) was used to calculate the nutritional requirements for a young family of seven, with five children, one of whom is breastfeeding. The minimum cost of such a food basket in Mindanao during the time of the assessment is 2500 pesos per month. Forty (40) percent of the households interviewed do not spend 2500 pesos and would not be able to procure sufficient food to meet their requirements, unless the household had a larger than average own production. The interviewed households spend on average 3536 pesos/month on food.

World Food Programme Food Security Assessment – Mindanao, Philippines 2007
21
A significant amount of food is purchased using credit. Only 30 percent of overall expenditures are spent on non-food items. Credit is not commonly used for purchase of non-food items. As seen in the graph below a substantial proportion of food is purchased on credit in a month. Purchase on credit is more expensive than purchasing in cash and thus would not be chosen if households had enough money to purchase what they need.
48%
19%
31%
2%
05
101520253035404550
Expenditure onFood Cash
Expenditure onFood Credit
Expenditure onNon_Food Cash
Expenditure onNon_Food
Credit
Household Expenditure by type
2.5.4 Household Food Access Food access was calculated based on the proportion of expenditure spent on food. The cut off used to categories households are: Very poor: Over 75 percent of expenditures are spent on food Poor: 66-75 percent of expenditures are spent on food Average: 50- 65 percent of expenditures are spent on food Good: Less than 50 percent of expenditures are spent on food The results show that 61 percent of the assessed households have poor or very poor access and thus poor purchasing power this is further supported by the proportion of expenditure on credit that households have each month. Food access according to expenditure on food does not differ between male and female headed households.
Food access based on percent of total expenditure spent on food
37
24 23
16
05
10152025303540
Very Poor Poor Average Good
perc
enta
ge
Food access by gender of household head
72 12
106 17
99 24
167 26
0%10%20%30%40%50%60%70%80%90%
100%
Male Female
Very poorpoorAveragegood

World Food Programme Food Security Assessment – Mindanao, Philippines 2007
22
Households with daily labour, fishing and petty trade as main income source have the largest percentage of households with very poor and poor food access. Households with farming as main income source represent the largest main income group. About 37 percent of these households have very poor food access and another 22 percent has poor food access.
.
Food access by main income source
0% 20% 40% 60% 80% 100%
farming
Fishing
Forestry & Hunting
Petty trade
Skilled employment
unskilled employment
daily labour
Transport, storage
remittances
Very PoorPoorAverageGood
There is a small difference between the village categories in terms of food access with the conflict areas having most households with very poor access i.e. spending more than 75 percent of their expenditures on food
Food access by village category
41 4529 32
1925
27 25
1920
27 29
2110 17 14
0%
20%
40%
60%
80%
100%
Remote Accessible Remote Accessible
Conflict Non-conflict
GoodAveragePoorVery Poor

World Food Programme Food Security Assessment – Mindanao, Philippines 2007
23
2.5.5 Food Aid Sixty-one (61) percent of the sampled households reported having received food aid. However, very few mentioned it as a source of food in the past week. The results might have been different had the assessment taken place right after a distribution or if recall period were extended to a month. An evaluation by GTZ in June 2007, found that the effects of the Food For Education (FFE) support were most evident among the children, Due to regular access to and intake of food, the children became healthier and more energetic. Teachers also claimed that children were more punctual and active in school activities now than in the past. In Sultan Kudarat, attendance in school increased by 85%. Enrolment rates soared while cases of absenteeism and drop-out rates were considerably reduced especially among recipient-schools. In addition, with ample food, incidence of child labour decreased as many children then refrained from working in the farms or doing chores for other families for often, a pittance. The physical and social benefits from the food aid also eased the psychological burden among parents who in the past were often stressed from thinking where to get the next meal for their children. The evaluation also found healthier toddlers and mothers as the major gain of the project. Lactating mothers and pregnant women became more conscious of and obtained regular pre-natal care to maintain their own as well as their yet unborn babies’ health. With greater access to health services, including immunisation drives among children, the health situation in communities improved significantly9. WFP interventions during 2007 are presented in the table below showing that Food For Education an Food for Work has been the largest type of projects with 100.000 participants. The assessment has not evaluated the efficiency of the programmes. Program components of the WFP food assistance in Mindanao
2007 Plan (January - June)
*Participants are based 2007 Planned figures presented at 3rd EMOP-ACAM meeting
2007 Plan (July - December) *Participants are based on full-scale EMOP figures
Programme Component Beneficiaries Participants Beneficiaries Participants
FFE-Take Home Ration 300,000 50,000 1,020,000 170,000
FFE-On Site Feeding 11,000 11,000 11,000 11,000
Pre-school 5,000 5,000 5,000 5,000
MCH - Women 52,000 52,000 52,000 52,000
MCH - Child 35,000 35,000 35,000 35,000
Food-for-Work (FFW) 300,000 50,000 480,000 80,000
Food-for-Training (FFT) 90,000 15,000 30,000 5,000
FFE- On site feeding staff 852 142 852 142
IDP/Emergency 52,296 8,716 120,000 20,000
TB 22,200 3,700 22,200 3,700
Ex-combatants 24,000 4,000
Total MT 857,348 219,558 1,789,052 374,842(Source: World Food Program, November 2007)
9 Assessment report-GTZ June 2007, Implementation of the Emergency Operations Philippines- Assistance to Conflict Affected Mindanao (EMOP-ACAM) Project In Sultan Kudarat and Lanao del Norte

World Food Programme Food Security Assessment – Mindanao, Philippines 2007
24
2.5.6 Food Sources Purchase is the most common source for most of the food groups apart from tubers (cassava, sweet potatoes) and vegetables, which mainly come from own production. The items that are produced in the barangays are also received as gifts by some households. Thirteen (13) percent of households reported gift as the main source of tubers. Pulses, vegetables and fruits are also received as gifts.
Source Cereal Tuber Pulses Veg Fruit Protein Dairy Sugar Oil Purchase 84.2 22.6 56.3 32.7 56.7 83.9 87.2 88.6 88.3Own production 6.9 61.0 35.0 55.3 31.5 6.9 1.7 0.9 3.4Hunting/fishing 0.1 2.1 1.6 4.1 3.0 4.1 0.6 0.2 0.2Trade goods/services 0.1 0.2 0.4 0.0 0.0 0.0 0.0 0.0 0.2Borrowed 5.7 0.2 0.4 0.0 0.0 3.6 10.6 8.4 4.7Exchange labour for food 0.7 0.3 0.0 0.0 0.0 0.0 0.0 0.0 0.0Exchange items for food 0.2 0.5 0.0 0.0 0.0 0.0 0.0 0.0 0.0Received as gift 1.4 13.2 5.9 7.9 8.8 1.5 0.0 0.2 0.0food aid 0.7 0.0 0.4 0.0 0.0 0.0 0.0 1.3 2.8Other 0.0 0.0 0.0 0.0 0.0 0.0 0.0 0.4 0.4
2.6 Food Consumption, Utilization and Health Status Food consumption is calculated based on a seven day recall where food groups are weighed according to their nutritional density10. Based on empirical evidence in different regions, WFP has defined standard cut-off points for the calculated food consumption score to allow differentiation of households with poor and borderline food consumption. Households with a food consumption score less than 28 are considered to have “poor” food consumption as they do not eat staple and vegetables on a daily base. Households with a food consumption score between 28 and 42 are considered to have “borderline” food consumption. Household with a food consumption score greater than 42 are considered to have “acceptable” food consumption. Eleven (11) percent of the surveyed households had poor food consumption, 28 percent had borderline food consumption and 61 percent had good food consumption during the week prior to the assessment.
Food consumption groups in assessed households
11
28
61
0
10
20
30
40
50
60
70
Poor Borderline Acceptable
10 The food items are grouped into 8 food groups. The number of days in which a food item was consumed in the past week is summed for the food items in each of the 8 food groups. If the total sum of the number of days of the separate items in a food group is larger than 7 days, the sum is converted to 7. Thus, the maximum score in each food group is 7 days. The food score of each household is calculated as follows: Simple food score = 2 * staple + 3 * pulses + 1 * vegetables + 1* fruit + 4 * animal protein + 0.5 * sugar + 3 * dairy + 0.5 * oil

World Food Programme Food Security Assessment – Mindanao, Philippines 2007
25
The average food intake pattern in the week prior to the assessment is illustrated by table below. Rice is the most frequently consumed cereal. Rice, vegetables and sugar / sugar products are all consumed more than 4 times per week, on average.
Food items 0 - 1 times per week
consumed 2 - 3 times
4 - 5 times per week
6 - 7 times a week
Rice 6.5 Maize / Corn 0.6 Other cereals (Bread, biscuits) 2.3 Cassava 1.0 Sweet Potato (camote) 0.8 Other roots and tubers (potatoes, gabi) 0.7 Beans and Groundnuts 1.0 Vegetables 5.5 Fruits 1.5 Fish and Fish Paste 2.6 Meat (beef, pork, chicken) 0.3 Wild animals 0.0 Eggs 1.6 Milk and other Dairy 1.5 Sugar and sugar products 5.7 Vegetable Oil, coconut oils, fats 3.5
The diet of households with poor food consumption is based on rice, vegetables, and sugar, as is shown in the table below. These households don’t consume animal proteins, as fish, meat or eggs, nor dairy products and fruits. Oil is on average consumed once a week. The diet of households with borderline food consumption is fairly similar. The only difference is that these households consume fish and eggs once a week, some fruits and three times per week oil. Average consumption of a selection of food items by food consumption group
Average number of days consumed per week Food Consumption Group Rice Maize Other
cereals Cassava Sweet
potatoes Vegetables Fruits Fish Meat Eggs Milk Sugar Oil
Poor 6 1 1 0 1 5 0 0 0 0 0 5 1 Borderline 7 1 1 1 1 5 1 1 0 1 0 5 3 Acceptable 7 1 3 1 1 6 2 4 0 2 2 6 4

World Food Programme Food Security Assessment – Mindanao, Philippines 2007
26
2.6.1 Who Has Poor Food Consumption? The livelihood groups (based on main income source) with the largest proportion of households with poor food consumption are found amongst households who depend on trade and unskilled employment all though in total numbers the largest group of households can be found amongst farming families as some 60 percent of all households are dependent on farming.
0% 20% 40% 60% 80% 100%
% of households
Farming and gardening(N=369)
Fishing (N=24)
Forestry and hunting (N=13)
Petty trade (N=32)
Skilled employment (N=17)
Unskilled employment (N=13)
Daily labour (N=56)
Remittances (N=12)
Food consumption by main income source
Poor Borderline Acceptable
2.6.2 Health Information from the key informant indicate that diarrhoea, Upper Respiratory infections such as cough and fever and Tuberculoses are most common health problems in the communities at this time of the year. The underlying factors are unhygienic practises, poor water sources and poor living conditions as well as weather conditions. Households in most of the remotely located barangays face difficulties in accessing health care. A midwife visit the barangay regularly, a number of community health workers from the barangay give preventive health advice to the households but for curative care the population have to go to larger towns. Medication as well as transportation are expensive and thus traditional healers or so called quack doctors are commonly used for certain illnesses. Households in barangays situated close to main towns are not using traditional healers as much. During the time of data collection, the National Measles Vaccination Campaign was under way and witnessed by the team is a few barangays. Health personnel informed that some 75-80 percent of children between 9 months to 4 years were vaccinated, while the remaining children were not vaccinated due to fear of injections by mothers.

World Food Programme Food Security Assessment – Mindanao, Philippines 2007
27
Sixty-five percent of the households interviewed have a child less than five years of age. In sixty percent (60%) of these households, children under five were reported to have suffered from fever or cough in the two weeks prior to the assessment. Diarrhoea was reported in less than 20 percent of the households with children under five. Less than half of the children suffering an illness had been seen by a health professional.
Percentage of assessed children under 5 years of age with illness in past two weeks
01020304050607080
fever cough diarrhoea
2.7 Food Security The food security status of the households was assessed by evaluating the household food consumption in the week prior to the assessment in combination with its food access as determined by the household expenditure on food as a percentage of the total. Cross-tabulation was used to determine the number of food insecure households. Households with poor or borderline food consumption and very poor or poor food access were considered SEVERELY FOOD INSECURE (red colour). Households with acceptable food consumption and very poor or poor food access were considered MODERATELY FOOD INSECURE (yellow colour). Households with poor or borderline food consumption and average food access were also considered MODERATELY FOOD INSECURE (yellow colour). Households with acceptable food consumption and average or good food access or poor or borderline food consumption and good access were considered FOOD SECURE (green colour).
Household Food Security Status Number and percentage of households by food consumption and food access groups
Food Consumption Group Poor Borderline Acceptable Total
Very poor 21 (3.9%) 71 (13.3%) 102 (19.1%) 194 (36.3%)
Poor 8 (1.5%) 38 (7.1%) 88 (16.5%) 134 (25.1%)
Average 17 (3.2%) 24 (4.5%) 81 (15.2%) 122 (22.8%)
Food Access Group
Good 8 (1.5%) 16 (3%) 60 (11.2%) 84 (15.7%)
Total 54 (10.1%) 149 (27.9%) 331 (62%) 534 (100%) Red = severe food insecurity. Yellow = Moderate food insecurity. Green = Food Secure Twenty-six (26) percent of the households were considered SEVERELY FOOD INSECURE (red colour), Forty-three (43) percent were considered MODERATELY FOOD INSECURE (yellow colour). Thirty-one (31) percent were considered FOOD SECURE (green colour).

World Food Programme Food Security Assessment – Mindanao, Philippines 2007
28
Food consumption by food security status is shown in the graph below. A large majority of the severely food insecure households have borderline food consumption, while one-fifth of the severely food insecure have poor food consumption. The majority of the moderately food insecure households have acceptable food consumption. These households are considered moderately food insecure because of their very poor or poor food access.
Food consumption group by food security status
217 5
79
10 10
82 85
0%
20%
40%
60%
80%
100%
Severely foodinsecure
Moderately foodinsecure
Food Secure
% H
ouse
hold
s
Poor Borderline Acceptable
2.7.1 Who is Food Insecure? Based on the key informant interviews the most vulnerable households in the communities are households with no land to cultivate and thus dependent on daily labour with very low wages at 70-80 pesos per day (in comparison: a kilo of the cheapest type of rice costs 22 pesos). Widows and single parent households with limited possibilities to work are supported by neighbours and the barangay on a volunteer basis. They are believed to represent 10- 20 percent of the households in the communities. They depend on less reliable income sources such as firewood collection, rope making etc. There is no government programme supporting these households. Tenant farmers are not much better off as explained by the key informants as they only keep 10-20 percent of the harvest for themselves and give the rest to the landlord. The harvest is relatively low due to poor agricultural practices and lack of fertilisers. The fields of tenant farmers are often on marginalised land in swampy areas that are regularly flooded, which destroys the crops and further reduces the limited production. Post harvest losses are also a big problem experienced by farmers. The most vulnerable households cannot afford to send their children to school as they need to help with either younger siblings or earn an income themselves. Approximately 20-40 percent of children are not enrolled and attendance rates are very low according to the key informant interviews.

World Food Programme Food Security Assessment – Mindanao, Philippines 2007
29
Main income sources The household interviews show households with farming and gardening, daily labour or unskilled unemployment and petty trade as main income source have the largest share of severely food insecure households11. Twenty-eight percent of households with farming and gardening as main income source are assessed as severely food insecure, and 23 percent of the households with daily or unskilled labour or petty trade fall in this category. When considering the severely and moderately food insecure households together, more than 80 percent of the households with daily labour or unskilled employment as main income source are considered food insecure, while between 67 percent and 77 percent of the households practicing farming and gardening, petty trade and fishing are considered food insecure households. Households depending on farming and gardening as main income source are by far the largest group of surveyed households, representing about two-third of the households. The largest group of severely food insecure households is also dependent on farming and gardening as main income source, representing about three-quarter of the severely food insecure households. Households depending on daily or unskilled labour as main income source are the second largest group severely food insecure, representing 11 percent of the severely food insecure households.
Household food security status by main income source
28
18
23
12
23
20
39
59
55
41
60
41
33
23
23
47
17
39
0% 20% 40% 60% 80% 100%
Farming and gardening(N=357)
Fishing (N=22)
Petty trade (N=31)
Skilled employment (N=17)
Daily labour/unskilledemployment (N=65)
Other (N=41)
% households
Severely food insecure Moderately food insecure Food Secure
11 As unskilled employment only involves 13 households, this main income source has been combined with daily labour in this graph. Livestock and poultry raising, forestry and hunting, manufacturing, transport and communication, mining, construction and remittances have been combined with other activities for the same reason.

World Food Programme Food Security Assessment – Mindanao, Philippines 2007
30
Remote and accessible communities, conflict and non-conflict affected communities There are no large differences in the food security status of households between the four village area categories, as is shown in the graph above. Severely food insecure households are evenly spread across the categories. When comparing the food security status of remote and accessible communities, without differentiating between conflict and non-conflict affected communities, the survey results also don’t show large differences: 66 percent of the households in remote communities are severely or moderately food insecure, while 73 percent of the households in accessible communities are assessed as food insecure. The categorization of communities into non-conflict or conflict affected communities is not as clear cut as expected. Conflicts tend to affect neighbouring communities in an indirect way even though the actual fighting is elsewhere. Indeed, there is also no large difference in the food security status of households between conflict and non-conflict affected communities: 72 percent of the households in conflict affected areas are assessed as food insecure (severely or moderately), while 66 percent of the households in non-conflict affected area fall in this group.
Food security by village category
27 25 2130
4153
4337
3323
36 33
0%
10%
20%
30%
40%
50%
60%
70%
80%
90%
100%
RemoteConflict
Accessable RemoteNon-conflict
Accessable
Severely Food Insecure Moderately Food Insecure Food Secure
Household expenditure, use of credit and food sources Food insecure households have less to spend, spend a large share of their expenditure on food and are more dependent on credit to buy food. The percentage food expenditure was one of the two indicators to determine the food insecurity status of the households. On average 80 percent of expenditure of severely food insecure households was on food in the past month, while 50 percent of the expenditure of food secure households was on food. In absolute terms, severely food insecure households spent on average about 3900 pesos (both in cash and credit) on food and non-food items in the past month, moderately food insecure households spent about 5900 pesos and food secure households about 6500 pesos. A large part of the food expenditure of especially severely food insecure households is on credit. On average 40 percent of the food expenditure of severely food insecure households was on credit, while moderately food insecure households spent on average 26 percent of their food expenditure on credit and food secure households 22 percent. Also in absolute terms, food insecure households bought on average more food on credit than the food secure households. However, there is not a large difference between food insecure and food secure households in answering the question about the household often purchasing food on credit or borrowing money to purchase food: 77 percent of the food insecure households mentioned to do so, while 70 percent of the food secure households did. There is also no difference in receiving food aid: 63 percent of both food insecure and food secure households received food aid in the last 12 months.

World Food Programme Food Security Assessment – Mindanao, Philippines 2007
31
Purchase is the most important source of rice for by far the majority of both food insecure and food secure households. Food secure households mentioned slightly more often to consume rice from own production. 17 percent of the food secure households mentioned own production as main or second source, while only 2 percent of the severely food insecure mentioned this source. Wealth indicators Several indicators related to wealth indicate food insecure households are worse off in terms of wealth, though some other wealth related indicators hardly differentiate between the groups. Almost half of the severely food insecure households use oil or a gas lamp as source of electricity, while 28 percent of the moderately food insecure and 22 percent of the food secure households use this source. Almost 60 percent of the food secure households have electricity, while 36 percent of the severely food insecure have access to this source. Food insecure households have less often access to improved water sources12 (dwelling, public tap, developed spring, protected well, rainwater). 54 percent of the severely and moderately food insecure households have an improved water source, while 72 percent of the food secure households have access to an improved source. Floor material of the house, another indicator of wealth, hardly differs between food secure and food insecure households. Access to improved toilet facilities (own or shared flush toilet or close pit) is also fairly similar among food secure and food insecure households. Assets Possession of household assets is low in general. The surveyed households have on average no more than one asset. Food secure households seem to be a little better off than food insecure households. They have on average 1.6 assets of the 14 household assets covered in the survey, while food insecure households on average posses 0.5 asset. Half of the food secure households have a radio and 40 percent has a television, while 24 percent of the severely food insecure households have a radio and 9 percent have a television. In terms of productive assets, there is only some difference in possession of small livestock. Food insecure households reported less often to hold poultry than food secure: 51 percent of the severely food insecure and 58 percent of the moderately food insecure households hold poultry, while 72 percent of the food secure households have poultry. There is no large difference in number of small animals hold by the households with poultry. Possession of large livestock is fairly similar between food insecure and food secure households and is low in general. A larger share of food secure households reported to posses a buffalo, though still no more than 17 percent of the households in this group own on average one buffalo. There is no large difference in access to land between food insecure and food secure households: 77 percent of the food insecure households have access to land and 81 percent of the food secure households. There are also no large differences in average size of land of the households with access to land. Food secure households tend to have slightly more often a kitchen garden. 62 percent of the food secure households have a kitchen garden, while 49 percent of the severely food insecure households have one. School attendance As was mentioned in the key informant interviews, the most vulnerable households cannot afford to send their children to school. The survey results show a similar tendency: Children do not attend school in 11 percent of the severely food insecure households with school aged children, whereas this is the case in 5 percent of the moderately food insecure and 2 percent of the food secure households with school aged children. When interpreting the survey results and describing the characteristics of the food insecure households, it should be stressed purposive sampling was used to select communities for the household survey. This means generalization of the results to other areas of Mindanao should be done with caution. The survey results could indicate certain tendencies, but are not representative for the whole area.
12 The classification into improved and not improved water supplies as described in the Annex of the Global Water Supply and Sanitation Assessment 2000 Report was used as guidance to classify the water sources in this survey.

World Food Programme Food Security Assessment – Mindanao, Philippines 2007
32
2.7.2 Households experiencing shocks In the year prior to the assessment some 85 percent of the households were affected by a type of shock. 38 percent of all households faced an economic event, including reduction of income, high costs of agricultural inputs, lack of employment and loss of employment. Almost a third of all households were affected by a life-cycle event through illness/accident/death of a household member. More than a quarter of all households were affected by a natural event, such as unusually high levels of crop pests and diseases, droughts and floods. 13 percent of all households experienced a social event caused by theft, conflict or displacement. A fifth of all households were affected by other events, including unavailability of food, unusual high level of human disease, and other. The percentage of households facing a specific shock in the past 12 months is illustrated in the figure below. In the year prior to the assessment some 26 percent faced a problem with health. Nearly one in five households faced a reduction in income and 15 percent had problems with crop pests/disease.
Percentage of housholds facing shocks in the past 12 months
13
6
1
15
1
7
1
13
13
5
18
26
4
5
2
9
3
7
0 5 10 15 20 25 30
Affected by drought/irregular rains/hailstorms
Affected by f loods
Affected by landslides, erosion
Affected by unusually high level of crop pests & diseases
Affected by unusually high level of livestock diseases
Affected by lack of employment
Affected by unusually high level of human disease
Affected by unavailability of food
Affected by high costs of agricultural inputs
Affected by loss of employment for a household member
Affected by reduced income of a household member
Affected by serious illness or accident of household member
Affected by death of a w orking household member
Affected by death of other household member
Affected by theft of animals
Affected by conflict
Affected by displacement
Affected by other
There are no major differences between food secure and food insecure households in the reporting of different types of events. All groups are equally affected by natural events. Food secure households reported slightly more frequent report an economic event (42 percent). Severely food insecure households reported more frequent a life-cycle event: more than 40 percent of the severely food insecure households reported illness/accident/death of a household member. Moderately food insecure household reported more frequent a social event: a fifth of these households experienced a shock caused by theft, conflict or displacement.

World Food Programme Food Security Assessment – Mindanao, Philippines 2007
33
2.7.3 Coping Strategies Eighty (80) percent of households interviewed reported experiencing a shock in the past year that affected their food intake and/or their access to food. The coping strategies the households resorted to were judged based on their individual impact and contextual use in Mindanao. They were grouped into strategies posing a risk to lives, strategies posing a risk to livelihoods and strategies posing no risk to lives or livelihoods, as shown in the table below.
RISK TO LIVES RISK TO LIVELIHOODS NOT RISK TO LIVES OR LIVELIHOODS
Reduced the portions of the meals Purchased food on credit Rely on less preferred or less expensive food
Reduced number of meals per day Consumed seed stock held for next season Borrowed food or were helped by relatives
Skipped days without eating Reduced expenditures on health and education Sent children to live with relatives
Borrowed money Spent savings
Sold HH articles (utensils, blankets) or jewellery (including pawning) Sold HH poultry
Sold agricultural tools, seeds Killed goat/sheep for consumption
Sold building materials Migration of household member Sold HH furniture
Sold small animals goats, sheep
Sold big animals oxen, cow, bulls
Rented out land
Sold land
Worked for food only In response to the shock(s), seventy-seven (77) percent of these households adopted one or more coping strategies which pose a risk to lives and/or livelihoods. Thirty (30) percent adopted coping strategies which pose a risk to life, including: Reducing the portion size of meals (17 percent); Reducing number of meals per day (17 percent); or skipped eating for an entire day (3 percent). Another forty-seven (47) percent of households adopted coping strategies which pose a risk to livelihood, including: Borrowing money (61 percent); purchasing food on credit (29 percent); working for food only (6 percent); and reducing expenditures on health and education (5 percent). In the past month, seventy (70) percent of households interviewed reported have adopted one or more coping strategies which pose a risk to lives and/or livelihoods. Twenty-one (21) percent of households interviewed adopted coping strategies which pose a risk to life, including: Reducing the portion size of meals (13 percent); Reducing number of meals per day (9 percent); or skipped eating for an entire day (1 percent). Another forty-nine (49) percent of households adopted coping strategies which pose a risk to livelihood, including: Borrowing money (40 percent); purchasing food on credit (23 percent); working for food only (6 percent); and reducing expenditures on health and education (5 percent). Borrowing money or purchasing food on credit are considered threats to livelihood because of high interest rates charged by local money lenders and the lack of alternative employment opportunities that are compensated at the national minimum wage.

World Food Programme Food Security Assessment – Mindanao, Philippines 2007
34
The frequency with which each coping strategy has been used is shown in the following table. Strategies posing threat to lives are indicated with red color. Strategies, posing a threat to livelihoods are indicated with yellow color. Other strategies are indicated with green color. Coping Strategies used in the last one month Daily
3-6 days/wk
1-2 days/wk Never
No Response
Reduced the proportions of the meals 3 5 5 0 88Reduced number of meals per day 2 4 3 0 91Skipped days without eating 0 0 1 0 99 Borrowed money 2 13 24 5 56Purchased food on credit 2 11 10 0 77Worked for food only 4 0 2 0 94Reduced expenditures on health and education 1 3 1 0 95Consumed seed stock held for next season 1 2 1 0 96Sold HH articles (utensils, blankets) or jewelry 0 0 1 0 98Sold agricultural tools, seeds, 0 1 0 0 100Sold building materials 0 0 0 0 100Sold small animals goats, sheep 0 0 1 0 99Sold big animals oxen, cow, bulls 0 0 1 0 99Sold land 0 0 1 0 100Reduced expenditures on health and education 1 3 1 0 95 Borrowed food, helped by relatives 2 7 9 0 82Rely on less preferred, less expensive food 13 4 3 0 80Spent savings 1 2 2 1 93Some HH members migrated (> 6 months) 0 1 1 0 98Sent children to live with relatives 0 2 1 0 97Sold HH poultry 0 2 1 0 97
2.8 Risk to Lives and Livelihoods The household food security status is considered as one aspect in determining if a household is at risk to lives or livelihoods. Coping strategies used by the households are considered as a second aspect to assess if a household is at risk to lives or livelihoods. For example, a moderately food insecure household could be determined to be at risk to livelihoods based on its food security status alone. If this household resorts to coping strategies posing a risk to lives, this moderately food insecure household could be determined to be at risk to lives To assess if a household is at risk to lives or livelihoods, both the food security status of the household and the coping strategies the household resorted to in the past month were analyzed. The food security status as presented above was cross tabulated with the coping strategy categories assigned to the households based on the coping strategies used by the households in the past 30 days prior to the assessment. For each combination of food security status and coping strategies category it was assessed if the concerned households should be considered at risk to lives, at risk to livelihoods or not at risk, as is shown in the table in red, yellow and green respectively. Based on this cross tabulation it is estimated that: 42 percent of the households are at risk to lives; 48 percent are at risk to livelihoods; and 10 percent are not at risk to either livelihood or lives. Those households who are at risk to lives should be assisted immediately through recommended interventions.

World Food Programme Food Security Assessment – Mindanao, Philippines 2007
35
Households at risk to lives and livelihoods Number and % of households by household food security status and coping strategy category
Household food security status
Severely food insecure
Moderately food insecure
Food Secure Total
risk to lives 21 (3.9%) 56 (10.5%) 33 (6.2%) 110 (20.6%) risk to livelihood 84 (15.7%) 108 (20.2%) 79 (14.8%) 271 (50.7%)
Coping strategy category no risk strategy 33 (6.2%) 67 (12.5%) 53 (9.9%) 153 (28.7%)
Total 138 (25.8%) 231 (43.3%) 165 (30.9%) 534 (100.0%) Green= not at risk, yellow= risk to livelihoods, red= risk to lives Households at risk to lives and livelihoods by food security group are shown in the graph below. About 25 percent of the moderately food insecure households are assessed as at risk to lives because of the coping strategies they resorted to in the 30 days prior to the assessment, while about 20 percent of the food secure households are assessed at risk to lives and another half at risk to livelihoods based on their coping strategies.
Households at risk to lives or livelihoods by food security status
100
24 20
76
48
32
0
20
40
60
80
100
Severely foodinsecure (N=138)
Moderately foodinsecure (N=231)
Food secure(N=165)
Food security group
% o
f hou
seho
lds
At risk to lives At risk to livelihoods Not at risk

World Food Programme Food Security Assessment – Mindanao, Philippines 2007
36
2.8.1 Who is at Risk to Lives or Livelihood? Households at risk to lives and livelihoods are quite evenly distributed across the four village categories. There are no major differences between village categories, as is also shown in the graph below. A comparison between remote and accessible communities, without differentiating between conflict and not-conflict affected areas, does not show major differences either: 43 percent of the households in remote areas are at risk to lives and 47 percent at risk to livelihoods, while 42 percent and 49 percent of the households in accessible areas are at risk to lives and livelihoods respectively.
Households at risk to lives and livelihoods by village category
4842 37 41
38 51 58 46
147 5
13
0%
20%
40%
60%
80%
100%
Remote conflictaffected
Accessible conflictaffected
Remote non-conflictaffected
Accessible non-conflict affected
% o
f hou
seho
lds
At risk to lives At risk to livelihoods Not at risk
3. Chronic versus Transitory Food Insecurity The underlying factors to food insecurity in Mindanao are chronic structural problems caused by conflict, land issues and exploitation of the poorest households. Most development indicators lack behind in Mindanao due to decades of discrimination. The majority of the assessed households are tenant farmers who keep only 10-20 percent of their production. The main income source of the second largest group of households in the survey is daily labour or unskilled work, which usually pays half of the set minimum wage for that particular area and type of work. Due to very poor income levels and unreliable income sources households find themselves in debts that they cannot repay without further exploitation and further debts. For example, the survey results showed on average 40 percent of the food expenditure of severely food insecure households was on credit in the past month. The food consumption of the household provides a picture of the households’ food intake in the week prior to the assessment only. Eleven percent of the households had a poor food consumption score in the week prior to the assessment. Another 28 percent of households had a borderline food consumption score at the time of the assessment. These families will very likely fall into the poor food consumption category during the lean season and they could become transitory severely food insecure due to changes in the households’ food intake. However, as this assessment took place right after the harvest we can only assume that households’ food intake is worse during parts of the year. Likewise, households could easily become transitory food insecure due to changes in households’ food intake and household access to food when they are displaced from their homes. Over the past year 200.000 people were temporary displaced and, as a consequence, many households faced transitory food insecurity,

World Food Programme Food Security Assessment – Mindanao, Philippines 2007
37
4. Shocks and opportunities in the coming year The shocks households have faced in the past year will most likely persist in the coming year. More than a quarter of all households reported illness or accident of a household member in the past year. The reported period for such shocks was limited; the impact was probably felt at the time of illness in the form of income reduction but not long lasting. Apart from shocks that are household specific, there are shocks that affect large number of households and are difficult to recover from. The shocks that are persistent and recurrent are the core reasons for food insecurity in Mindanao. People didn’t mention to fear new shocks that would affect them in 2008, but rather the same problems as faced for years.
Expected event Recurrent/persistent or
occasional (shocks only)
Probability of occurrence 1 = lowest 5 = highest or ongoing
Expected time of occurrence
(months, ongoing, or any time)
Scale of severity or benefit
Shocks Reduction of household income/loss of employment Persistent
Ongoing Any time Medium severity
Poor yields, high post harvest losses Persistent Ongoing Ongoing Medium
severity Drought/ irregular rains Occasional 3 Any time High severity Loss of assets e.g. land due debt bondage Persistent Ongoing Any time High severity
increased fuel prices → increased overall costs in remote areas due to poor roads
Recurrent
4 Any time Medium
severity
Opportunities Improved harvest 3 High benefit Improved agricultural subsidies 3 Medium benefit
Peace dialog that will lead to peace agreement 2 Unknown High benefit
There are few opportunities with medium to low probability to happen. This year’s harvest has been a relatively good one and this may ease some of the pressure on the poorest households. It is hoped in some areas that the 2008 harvest will be good, whilst in others the fear for drought is more adamant than the possibility for improved harvest. The agricultural subsidies have been misused in the past. By tracking down on the usage it is seen as an opportunity that the subsidies finally may reach the people who need it. The peace dialog in itself is positive but the likelihood that it will lead to a peace agreement in the coming year is low. Various scenarios were built considering the peace process and a post-conflict setting of Mindanao (see Annex 4 for a summary). In the most likely scenario, the status quo is maintained. Given the structural pattern of the underlying causes of the food security situation in Mindanao and the fact that a peace agreement is the dominant factor to any development in Mindanao, no significant drop is expected in the number of households at risk to lives and at risk to livelihoods in the short term, 5. Exit strategy The WFP operation has a peace building objective. However, peace in itself will not address all the underlying causes to food insecurity as they are also related to limited income sources, high level of debts as well as poor agricultural practices as mention in the section on chronic versus transitory food security in combination with exploitation of tenant farmers. Thus for WFP to exit when a peace agreement is signed would not be feasible. It is recommended that WFP together with the Government agencies draw up a realistic time plan for handing over some of the programmes e.g. Food For Education programme as the government has a Food For School programme with allocated funds. The Department of Education (DepEd) website reports that Food For Schools programme is implemented in the poorest provinces in the country and provides 2.4 million elementary school

World Food Programme Food Security Assessment – Mindanao, Philippines 2007
38
pupils with rice take home rations. However, this programme is not fully implemented yet in Mindanao. DepEd and WFP thus need to become partners with an agreed implementation plan using the same strategy to facilitate a hand over of WFP run schools to the government in the future. WFP could provide technical assistance to enable DepEd to establish, monitor, and run Food For Education activities in selected schools if the government contributes the food commodities. DSWD is reported to be implementing Food For Work activities in Mindanao. However, it was not clear to the assessment team what is the size of their programmes are and what is the capacity for collaboration between WFP and DSWD. It is possible that WFP could play the same role in capacity building as with DepEd. For example, WFP could assist with implementation of Food For Work, if DSWD provided the food or vouchers. 6. Recommendations
Based on the problem analysis and the causes of food insecurity of the assessed households, different response options were considered staff in order to determine which ones are most feasible and practically possible in the special context of Mindanao. This process took place in collaboration with Country Office staff. A matrix in Annex 4 is a record of the results of that discussion, which led to the following recommendations.
Food For Education should continue. They address two major problems: bringing more children to school and improving food access at household level at a constant and regular manner. There is anecdotal evidence that it contributes to a reduction of child labour. The rice take home ration is a substantial contribution to a households’ intake of staple food which they otherwise would have to be purchased at the market.
Food for Work (FFW) and/or Voucher for Work activities should continue. During lean season FFW can reduce the reliance upon credit and create or rehabilitate community assets remote conflict affected areas. Including Community Health Workers as beneficiaries of Food For Work activities should be considered. Community Health Volunteers are in charge of some complementary activities to the MCH programme such as delivering preventive health messages to mothers. The workload for health staff has increased with WFP interventions. To ensure good results volunteer workers could be given an incentive.
MCH programme should continue, but in stronger collaboration with UNICEF and UNFPA. Malnutrition remains a serious problem. Women and children less than 24 months old are particularly vulnerable to the consequences of food insecurity.
Food for training should continue, as skills training will enable households to diversify their income sources. Currently the majority of households rely on one income, most often agriculture. Usually, these tenant farmers have to give 80-90 percent of their harvest to the land owner.
Advocate for improved social services and infrastructure. to remove constraints on food access.
Advocate for increased employment of teachers and nurses. There has been increased use of public facilities following WFP FFE and MCH interventions and this has highlighted the need for additional trained personnel..
Advocate for micro credit schemes by other stakeholders to enable households to borrow money at affordable interest rates.
< END >

World Food Programme Food Security Assessment – Mindanao, Philippines 2007
39
Annex 1. Rapid Traders’ Survey Questionnaire Mindanao Follow-up EFSA 2007 – Rapid Traders’ Survey
POSSIBLE SHORT INTRODUCTION FOR TRADERS
“We are conducting a survey on the food security and nutrition conditions in Six provinces of Mindanao. The survey also entails assessment of cereal markets. I would like to ask you some questions about markets and food aid, which will take about one hour. Your name will not be recorded and any information that you provide will be confidential and will not be disclosed to other people. Your participation is voluntary and you can choose not to answer any or all of the questions if you wish; however we hope you will participate since your views are important. Do you have any questions? May I begin now?”
Trader type: Wholesale Trader-1, Retailer Trader-2, Petty Trader-3 Commodity type: Dry Food-1, Fresh Food-2 Market type: City Market-1, Municipal Market-2, Rural/Barangay Market-3
I Questionnaire number II Trader type III Commodity type IV Market Type V Name of Market VI Name of Province VII Enumerator’s Code IX Date of interview
A. GENERAL CHARACTERISTIC OF THE MARKET 1. What are the main food commodities
traded in this market?
01= Rice–NFA (local) 02= Rice–NFA (Import) 03= Rice-Commercial (local) 04= Rice-Commercial (Import) 05= Maize 06= Beans 07= Cassava/Sweet Potato 08= Veg - Cabbage 09= Veg - Carrot 10= Veg - Bell pepper 11= Veg - Tomato 12= Veg - Onion/Garlic
13= Veg - Potato 14= Veg - Eggplant 15= Veg - Bitter Gourd 16= Veg - Others
17= Fruit - Mango 18= Fruit - Banana 19= Fruit - Papaya 20= Fruit - Pineapple 21= Fruit - Others
22= Meat 23= Chicken 24= Fish
25= Seafood 26= Egg 27= Veg. oil 28= Salt 29= Sugar 30= Milk 31= Coffee 32= Wheat flour 33= CSB 34= Livestock 35= Other food items, specify: _____________
[ ] [ ] [ ] [ ] [ ] [ ]
2. What type of food commodity market is this?
01= Primary (producers sell to traders, wholesalers or retailers) 02= Secondary (wholesalers sell to traders/retailers) 03= Consumer market (retailers sell to final consumers)
[ ]
3. What is the frequency of this market?
01= Daily 02= Weekly 03= Bi-weekly 04= Periodic (specify) ________________
[ ]
4. What is the main/dominant type of traders in this market?
01= Farmer 02= Retailer (sells to consumers) 03= Wholesaler 04= Middleman (Commission agent / Firm agent) 05= Other: ___________________
[ ]
[ ] 5. What is the approximate number of this dominant type of traders in this market?
Wholesale Retail [ ]
6. What is the typical catchment area of
this type of traders in this market? 01 = Local (within the barangay/vicinity only) 02 = Municipality (within Municipality)
[ ]

World Food Programme Food Security Assessment – Mindanao, Philippines 2007
40
03 = Locality (City and neighborhood) 04 = Province (Within Maguindano and North Cotabato) 05 = Island (within Mindanao Island) 06 = National (within the country) 07 = International (formal and informal exports and imports)
B. SELLING AND PURCHASING PRICE 7. What are the main food
commodities are you trading?
01= Rice–NFA (local) 02= Rice–NFA (Import) 03= Rice-Commercial (local) 04= Rice-Commercial (Import) 05= Maize 06= Beans 07= Cassava/Sweet Potato 08= Veg - Cabbage 09= Veg - Carrot 10= Veg - Bell pepper 11= Veg - Tomato 12= Veg - Onion/Garlic
13= Veg - Potato 14= Veg - Eggplant 15= Veg - Bitter Gourd 16= Veg - Others
17= Fruit - Mango 18= Fruit - Banana 19= Fruit - Papaya 20= Fruit - Pineapple 21= Fruit - Others
22= Meat 23= Chicken 24= Fish
25= Seafood 26= Egg 27= Veg. oil 28= Salt 29= Sugar 30= Milk 31= Coffee 32= Wheat flour 33= CSB 34= Livestock 35= Other food items, specify: _____________
[ ] [ ] [ ] [ ] [ ] [ ]
8. Is trading your main activity? 01=Yes 00=No
[ ]
9. Do you have any other activities?
01= Food crops farming (rice, maize, etc) 02= Tree crops farming (coffee, etc) 03= Transportation 04= Permanent employee (govt./private) 05= Skilled labour (carpenter, handicraft, etc)
06= Domestic labour 07= Casual/daily labour 08= No 09= Other, specify___________________
[ ]
10. What is the approximate volume sold in terms of bags for each specific food commodity? (if possible rank the main three items by order of importance). Has the volume of these food commodities you are selling changed over the last 12 months? Why? (please fill up in the table below)
10.1 Food Commodity (coding: see question 1 or 7)
10.2 Unit of measurement Coding: Annex-A
10.3 What is your daily traded volume? (average of one week)
10.4 Has your daily traded volume changed over the past 12 months? Coding: 01=Up 02=Down 03=Same
10.5 Main reason for annual change Coding: 01=Security 02=Production/new harvest 03-harvest failure 04=Imports/exports 05=Policies 06=Food aid distribution 07=Price increased/decreased 08=Competition 09=Others, specify:________
11. What are the current buying and selling prices of your main three food items?
Food
Commodity
BUYING (For producer/seller, pls ask the unit cost of
production)
SELLING
World Food Programme Food Security Assessment – Mindanao, Philippines 2007
41
(Coding as in question 1 or 7).
Unit of measure
(See Annex A)
Current Price (PHP) 2007 (Week avg.)
Highest Price (PHP) during last
12 months Price Month/Y
Unit of measure
(See Annex A)
Current Price (PHP) 2007 (Week avg.)
Highest Price (PHP) during last
12 months Price Month/Y
12. From whom do you buy/to whom do you sell your main three food commodities? Food commodity Coding: (see Q.1 or Q7)
[ ]
Buying from Coding [ ] [ ]
01= National Food Authority 02= Farmer/Resident 03= Traders 04= Import-export 05= Strategic Reserves 06= Food Aid Agencies 07= Beneficiaries of Food Aid Agencies 08= Middlemen/Agents 09= Own produce
Selling to Coding [ ] [ ] 01= National Food Authority 02= Farmer/Consumers 03= Traders 04= Import-export 05= Strategic Reserves 06= Food Aid Agencies 07= Beneficiaries of Food Aid Agencies 08= Middlemen/Agents
Code Freq. [ ] [ ]
[ ] [ ]
13. Transport facility used for transferring commodity (major two) between source purchase and market where sold. (in a month)
Transport Coding: 01=Own transport 02=Private Transport 03=Public transport [ ] [ ]
14. How many weeks do you usually keep your food between purchase and sale Commodity Code
- Food 1 - Food 2 - Food 3
Volume
[ ] [ ] [ ]
Day/Week/Mo
[ ] [ ] [ ]
15. Do you sell in credit? If no, go to Q.19
01=Yes 00=No
[ ]
Credit [ ] % 16. If yes, what share of your total sales is in credit? (in %) Cash [ ] %
17. Has the share of your total sales in credit changed during the last 12 months?
01= Increased 02= Decreased 03= No change
[ ]
18. What makes you decide to sell in credit? 01= low demand from customers 02= high selling prices 03= de-stocking 04= competition 05= lack of money 06= Other, specify __________
[ ]
19. Do you buy in credit? If no, go to Q.23
01=Yes 00=No
[ ]
[ ] % 20. If yes, what share of your total purchase is in credit? (%)
Credit cash [ ] %

World Food Programme Food Security Assessment – Mindanao, Philippines 2007
42
21. Has the share of your total purchase in credit changed during the last 12 months?
01= Increased 02= Decreased 03= No change
[ ]
22. What makes you decide to buy in credit? 01= insufficient cash flow 02= high purchase prices 03= stocking 04=lack of money 04= Other, specify _______________
[ ]
COSTS & CONSTRAINT / SHOCKS & STRATEGIES 23. What are the main costs you incur per unit of the main three food commodities traded in this market
23.1 Food Commodity
23.2 Unit (Annex A)
23.3 Volume
23.3 Distance (km)
23.4 Transport (PHP)
23.5 Storage (monthly) (PHP)
23.6 Loading/ Unloading (PHP)
23.7 Taxes (PHP)
23.8 Freq/ month
24. What is your storage capacity?
Coding: Use the Code in Annex A. Fill 66, if the trader doesn’t have a storage
|__||__||__|in
|__||__| (unit)
25. What are the three most important constraints that you incur in trade? Indicate ranking in the box
01 = Drought/Flood 02 =Cereal quality 03 = Poor storage conditions 04 =Irregular foreign supplies 05 = Lack of access to credit 06 = Poor road conditions 07 =Lack of transport facilities (trucks) 08 =High wholesale prices 09 = Low retail prices 10 =Insecurity 11 =Fall in demand 12 =Taxes and dues 13 =Food Aid distribution 14 =Informal/Cross-border trade 15 = Overstocking/big inventory 15 =Others, specify_________________
[ ] [ ] [ ]
26. Has security situation improved or worsened over the last 12 months
01= Improved 02= Worsened 03= Same
[ ]
27. Do you have the capacity to bring more commodities on this market?
01= Yes, within a week 02= Yes in less than two weeks 03= Yes, between 2 weeks and 1 month 04= Yes, after 1 month. 05= No
[ ]

World Food Programme Food Security Assessment – Mindanao, Philippines 2007
43
28. If No, why? (Indicate ranking in the box)
01= Insufficient availability of commodity 02 = Insufficient quality of commodity 03 = Insufficient storage facilities 04 = Poor road and transport conditions 05= Food aid distribution 06= Low demand and purchasing power
07= High taxes and dues 08= Low retail prices 09 = High transport cost 10= Insecurity 11= Lack of money 12= Others, specify_______________
[ ] [ ] [ ]
29. How do you cope or compensate for shocks that affect negatively your business? (Indicate ranking in the box)
01= Increase prices 02 = Lower profit margins 03 = Reduce purchases 04 = Close business 05= Increase credit to customers
06= Increase indebtedness from suppliers 07= No change 08= Increase sales 09= Others, specify______________
[ ]
[ ]
[ ]
30. How do you think food prices will evolve in the next 6 months?
Commodity-1 [ ] Commodity-2 [ ] Commodity-3 [ ]
01= increase 02= decrease 03= no change 04= do not know
01=Better security 02= Worsen security 03=Production/new harvest 03-harvest failure 04=Imports 05=Policies 06=Food aid distribution 07=Others, specify:________
[ ] [ ] [ ] [ ] [ ] [ ]
FOOD AID PERCEPTION 31. Have you ever heard of/Do you know about food aid?
(If the answer is no, don’t ask any further question) 01=Yes 02=No
[ ]
32. Do you know about any food aid provided by any agency? (If answer is “No”, proceed directly to Q36)
01=Yes 02=No
[ ]
33. Did some food aid recently ended up in this market? If the answer is no/do not know, go to Q.36
01=Yes 02=No 03=Do not know
[ ]
34. Please indicate an estimate of the quantity sold on the market (in number of bags of 50 KG)? [ ]
35. What are the three main impacts of the sale of food aid on the market, according to you? (general)
01= less people come to buy 02= Prices of main food commodities decrease 03= Fewer traders come 04= No change 05= Increased food availability to purchase 06= Increased demand for non-food items 07= Stability of prices 08 = Other, specify:________________
[ ] [ ] [ ]
36. Please, can you list three main impacts of food aid on your trading activity? (impact to the trader)
01= Less sales 02= Lower profit margins 03= Less purchases 04= No change 05= More sales 06= More purchases 07 =Other, specify: ________________
[ ] [ ] [ ]
THANK YOU FOR YOUR PARTICIPATION

World Food Programme Food Security Assessment – Mindanao, Philippines 2007
44
ANNEXURE – 1 A
Commodity Code Rice/ Maize/ Beans/Salt/Sugar/ Wheat flour/ CSB/Fruits/Vegetables/Meat/Fish/ Chicken/ Coffee
01=1 kg pack 02= 5 kg pack 03= 10 kg pack 04= 15 kg pack 05= 20 kg pack 06= 25 kg pack 07= 50 kg pack
Cassava/Fruits/ Vegetables
08= Small heap 09= Medium heap 10= Large heap 11= Small bunch 12= Medium bunch 13= Large bunch
V.Oil/milk
14= 1 Ltr. Cont. 15= 2 Ltr. Cont. 16= 5 Ltr. Cont. 17=10 Ltr. Cont. 18=20 Ltr. Cont 19=25 Ltr. Cont. 20=30 Ltr. Cont.
Eggs
21= Dozen (12) 22= Tray (36)
Livestock 23=No. of heads Others 24=Others; Specify Annex 1b Markets included in the Assessment
Trader type
Name of Market Wholesale
Trader Retail Trader
Petty Trader Total
Baguer Pigcawayan 1 2 0 3Bagumbayan Market 2 0 2 4Bagumbayan, Barangai Public Market 0 4 0 4Balabagan Market 0 1 0 1Barangay Tuka 0 2 0 2Dalican Market 5 1 1 7Esparanza, Public Market 0 5 0 5Isulan,Public Market 1 9 1 11Kidapawan Public Market 0 6 0 6Malabang Public Market 3 1 0 4Midsayap Public Market 2 7 0 9Presbitero Pigcawayan 2 2 1 5Tacurong, City Market 2 6 1 9Total 18 46 6 70

World Food Programme Food Security Assessment – Mindanao, Philippines 2007
45
Annex 2. Household Questionnaire
0.1 -
Interviewer ID |__||__|__|
0.2 -
Date: |__|__| / |__|__| / 2007 Day Month
0.3 -
Community Code|__|__|__| 1= conflict 2=non-conflict |__| 1= remote 2= accessible |__|
0.4 -
Household code |__|__|__|
0.5 Gender of household head |__| female |__| male
0.6 Age of household head |__|__|
SECTION A1 – DEMOGRAPHICS: Read - “I would now like to ask you a few questions on the composition of your household” 1.1 - What is the number of persons living in your household? ______
1.1.b Does your household have any children under 15 years of age? |__|__| or adults|__|__| >60? |__|__| or disabled |__|__| or chronically ill |__|__| (write the number)
1.2 – does your family belong to any ethnic group? Yes|__| No |__| Circle the one that is relevant below. 1. Maranao 2. Visayan 3. Cebuano 4. Boholano 5. Iranun 6. Ilonggo 7. Ilocano 8. Blaan 9. Maguindanaon 10. Tausug 11. Teduray 12. Arumanon 13. Manobo 14. Other _______________ 1.3. Have you ever been displaced due to the conflict in Mindanao? 1= Yes 2= No 1.4 If YES, how long ago is it? __________ (indicate the year) 1.5. Is this your new location (municipality) or original one: New_______________ Original___________________ (If new then name the original one).
SECTION A2 – HOUSING AND FACILITIES
2.1-
What is the major material of the floor? Observe and record. Do not ask question! Circle one
1 Earth / Sand 6 Ceramic tiles 2 Wood Plank 7 Cement 3 Palm / Bamboo 8 Marble 4 Parquet or polished wood 9 Other, specify
5 Vinyl or asphalt strips __________________
1 Flush toilet (own toilet) 2 Flush toilet (shared toilet) 3 Close pit 4 Open pit 5 Drop/overhang 6 No toilet/field/bush
2.2 -
What is the main type of toilet facility your household uses? Do not read answers. Circle one.
7 Other

World Food Programme Food Security Assessment – Mindanao, Philippines 2007
46
2.3
What is the main source of lighting for this
house?
Do not read answers. Circle one.
1 Electricity 2 Kerosene 3 Oil or Gas Lamp 4 Candles 5 Fluorescent Lights 6 Other, specify
____________________ 1 Cylinder Gas 2 Electricity 3 Wood/charcoal 4 Kerosene
2.4 -
What is your main source of cooking fuel? Do not read answers. Circle one.
5 Other, specify _________________
2.5 -
What is the main source of drinking water for your household? Circle one
1 Dwelling (piped into the house) 8 River/stream/pond/l
ake/dam
2 Yard/Plot 9 Bottled water/refilling
3 Public tap 10 Station
4 Protected well 11 Rainwater
5 Unprotected (Open dug well)
12
Tanker truck/Peddler
6 Developed spring 13 Other, specify
7 Undeveloped spring __________________
2.6 - How far is the main source of water from your household? Record time back and forth to access source Write 888 if water on premises ,Write 999 if don’t know
____________minutes
SECTION A3 – HOUSEHOLD ASSETS, PRODUCTIVE ASSETS AND ACCESS TO CREDIT
1 Radio/Radio cassette 8 Component/
Karaoke
2 Television 9 Personal computer
3 Landline Telephone
10 Tractor
4 Cellular phone
11
Motorized banca/Boat
5 Washing machine
12 Car/jeep/van
6 Refrigerator/ freezer
13
Motorcycle/ Tricycle
3.1 -
Does your household own any of the following assets? Circle all that apply
7 Cd/Vcd/Dvd player
14
Bicycle/ Pedicab
1 YES – relatives / friends 2 YES – charities / NGOs 3 YES – local lender

World Food Programme Food Security Assessment – Mindanao, Philippines 2007
47
4 YES – bank 5 YES – Co-operatives 6 No access to credit
3.3 Do you often purchase food on credit or borrow money to purchase food? 1 YES 2 NO 3.4
3.3b If yes, in the last 3 months how often did you use credit or borrow money to purchase food? Circle one
1 = On one occasion 2 = On two occasions 3 = On three occasions 4 = On more than three occasions
3.4 Do you have access to a market? 1. = YES 2. = NO 3.5 3.4b How far is it to the nearest functional market? ___________________ minutes
3.4c How often is it open? 1= daily 2= 2-5 days/week 3= weekly
3.5a Does your household own any farm-animals? 1 YES 2 NO section 4
3.5b
If yes, then how many of each of the following animals do you own? (Please circle the animals applicable and note the number beside it)
1. Cows / Bullocks :
_________ 2. Buffaloes : _________ 3. Goats : _________ 4. Sheep : _________ 5. Chickens/Ducks/gees
_________ 6. Pigeons: _________ 7. Horses : _________ 8. Pig _________ 9. Other: _________
Section A4 – Agriculture 4.1a: Do you have access to agricultural land? 1 = YES 2 = NO 4.5a How big is the size of the land? |__|__|hectare 4.1b: How did you or members of your household acquire this land? (Circle one) 1 = Inherited 2 = Rent 3 = Share-cropping 4 = Bought from private person 5= Community Land 6= Opened new land 7 = Other (specify)_________ 4.1c: What is the main source of water for your land? (Circle one) 1 = rain fed 2 = irrigated–Canals/dam 3 = irrigated–Pump 4 = irrigated–river 5 = other (specify)_________ 4.2: With respect to field crop farming, what is the main crop you cultivate on your land? (Circle one) 1 = rice 2 = maize 3 = beans 4 = Cassava 5 = potatoes 6 = vegetables 7 = fruits 8 = Tobacco 9 = Coconut 10 = Pumpkin/squash 11 = other (specify)_________ 4.3: What do you use to work your land? (Circle one)
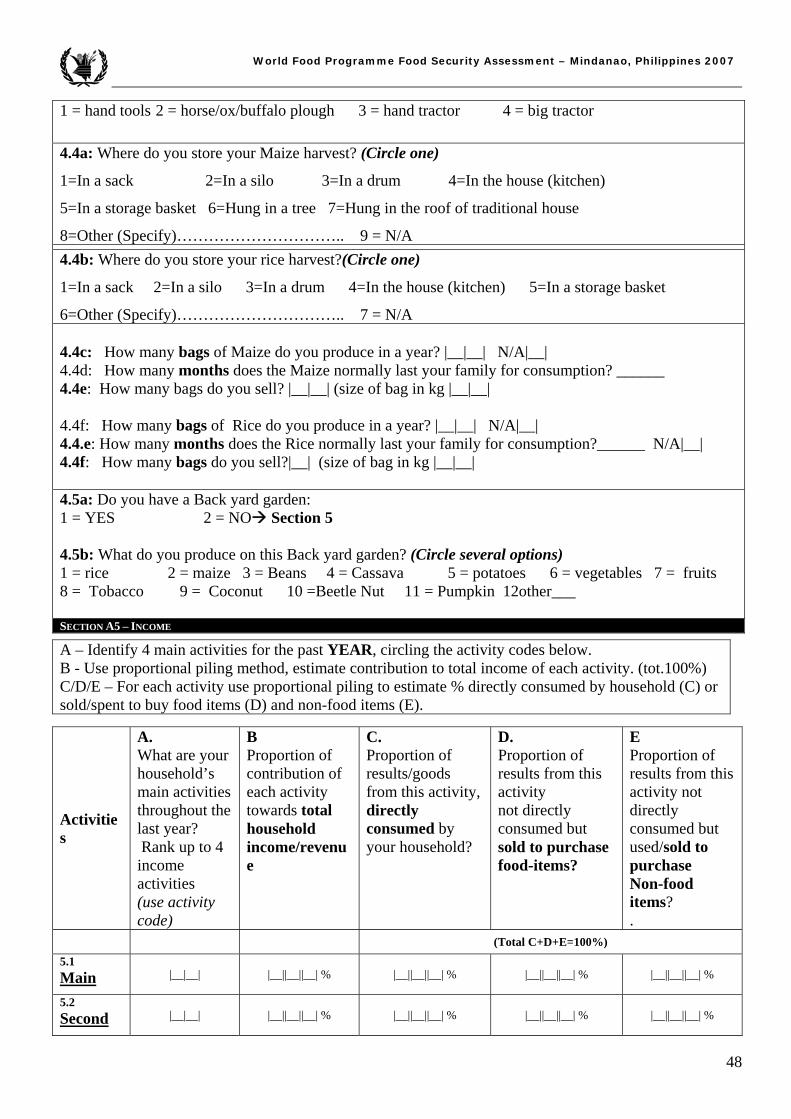
World Food Programme Food Security Assessment – Mindanao, Philippines 2007
48
1 = hand tools 2 = horse/ox/buffalo plough 3 = hand tractor 4 = big tractor
4.4a: Where do you store your Maize harvest? (Circle one)
1=In a sack 2=In a silo 3=In a drum 4=In the house (kitchen)
5=In a storage basket 6=Hung in a tree 7=Hung in the roof of traditional house
8=Other (Specify)………………………….. 9 = N/A
4.4b: Where do you store your rice harvest?(Circle one)
1=In a sack 2=In a silo 3=In a drum 4=In the house (kitchen) 5=In a storage basket
6=Other (Specify)………………………….. 7 = N/A 4.4c: How many bags of Maize do you produce in a year? |__|__| N/A|__| 4.4d: How many months does the Maize normally last your family for consumption? ______ 4.4e: How many bags do you sell? |__|__| (size of bag in kg |__|__| 4.4f: How many bags of Rice do you produce in a year? |__|__| N/A|__| 4.4.e: How many months does the Rice normally last your family for consumption?______ N/A|__| 4.4f: How many bags do you sell?|__| (size of bag in kg |__|__| 4.5a: Do you have a Back yard garden: 1 = YES 2 = NO Section 5 4.5b: What do you produce on this Back yard garden? (Circle several options) 1 = rice 2 = maize 3 = Beans 4 = Cassava 5 = potatoes 6 = vegetables 7 = fruits 8 = Tobacco 9 = Coconut 10 =Beetle Nut 11 = Pumpkin 12other___ SECTION A5 – INCOME
A – Identify 4 main activities for the past YEAR, circling the activity codes below. B - Use proportional piling method, estimate contribution to total income of each activity. (tot.100%) C/D/E – For each activity use proportional piling to estimate % directly consumed by household (C) or sold/spent to buy food items (D) and non-food items (E).
Activities
A. What are your household’s main activities throughout the last year? Rank up to 4 income activities (use activity code)
B Proportion of contribution of each activity towards total household income/revenue
C. Proportion of results/goods from this activity, directly consumed by your household?
D. Proportion of results from this activity not directly consumed but sold to purchase food-items?
E Proportion of results from this activity not directly consumed but used/sold to purchase Non-food items? .
(Total C+D+E=100%) 5.1 Main |__|__| |__||__||__| % |__||__||__| % |__||__||__| % |__||__||__| %
5.2 Second |__|__| |__||__||__| % |__||__||__| % |__||__||__| % |__||__||__| %

World Food Programme Food Security Assessment – Mindanao, Philippines 2007
49
5.3 Third |__|__| |__||__||__| % |__||__||__| % |__||__||__| % |__||__||__| %
5.4 Fourth |__|__| |__||__||__| % |__||__||__| % |__||__||__| % |__||__||__| %
Total (B)|1|0|0| %
Income sources codes 1 =Products from Crop farming and gardening 2 = Livestock and poultry raising (such as raising of carabaos, cattle, hogs, horses, chicken, ducks, etc. and the production of fresh milk, eggs, etc.) 3 = Fishing (such as capture fishing gathering fry, shells, seaweeds, etc. ; and culturing fish, oyster, mussel, etc.) 4 = Forestry and hunting (such as tree planting (ipil-ipil), firewood gathering, small-scale logging excluding concessionaires), charcoal making, gathering forestry products (cogon, nipa, rattan, bamboo , resin, gum, etc.) or hunting wild animals/birds) 5 = Wholesale and retail trade (including market vending, sidewalk vending and peddling, small shop)
6 = Manufacturing/handicraft (such as mat weaving, tailoring, dressmaking) 7 = Skilled salaried employment (such as medical, teaching ,bank, government 8. Unskilled salaried employment (assistant, hair dresser,massage, hotel staff, housemaid, laundry etc) 9. Daily labourer (agriculture, construction etc) 10 = Transportation, storage and communication services (such as operation of jeepneys or taxis, storage and warehousing activities, messenger services, etc.) 11. = Mining and quarrying (such as mineral extraction like salt making, gold mining, gravel, sand and stone quarrying, etc.) 12 = Construction (or repair of a house, building or any structure)
13. Remittances, pension, Gov. allowances (peace council member) 14. Activities not elsewhere classified
SECTION A6 – EXPENDITURE
Read In the Past MONTH, how much money have you spent on each of the following items or service? If goods have been exchanged please give a value in dollar from local market list.
a. - Spent on previous month 1 = Yes 2 = No
(if no, go to next item)
b. – Estimated Expenditure in Cash during the last month
(Peso.) write 0 if no expenditure.
c. – Estimated expenditure in Credit during the last month
(peso) write 0 if no expenditure.
6.1 - Rice
|__| |__|__|__|__| peso |__|__|__|__| peso
6.2 Maize |__| |__|__|__|__| |__|__|__|__|
6.3 Wheat and other cereals/products (bread, biscuits, noodles) |__|
|__|__|__|__| |__|__|__|__|
6.4 -
Roots and tubers (such as cassava, potatoes, sweet potatoes (camote), gabi) |__|
|__|__|__|__| |__|__|__|__|
6.5 Pulses (beans, lentils, groundnuts) |__| |__|__|__|__| |__|__|__|__| 6.6 - Fruits
|__| |__|__|__|__| |__|__|__|__|
6.7 Vegetables |__| |__|__|__|__| |__|__|__|__| 6.8 - Milk products
|__| |__|__|__|__| |__|__|__|__|

World Food Programme Food Security Assessment – Mindanao, Philippines 2007
50
6.9 eggs |__| |__|__|__|__| |__|__|__|__|
6.10 Meat and meat products (chicken, beef, pork, other meat) |__|
|__|__|__|__| |__|__|__|__|
6.11 Fish and marine products |__| |__|__|__|__| |__|__|__|__| 6.12 Coffee, cocoa and tea |__| |__|__|__|__| |__|__|__|__| 6.13 Sugar/salt |__| |__|__|__|__| |__|__|__|__| 6.14 Butter/ cooking oil. margarine |__| |__|__|__|__| |__|__|__|__| 6.15 Non-alcoholic beverages |__| |__|__|__|__| |__|__|__|__| 6.16 Tobacco/beetle nut |__|__|__|__| |__|__|__|__| 6.17 Alcoholic beverages |__| |__|__|__|__| |__|__|__|__|
6.18 Household operation (laundry soap / matches / brooms / batteries etc.) |__|
|__|__|__|__| |__|__|__|__|
6.19 Toilet articles (soap, shampoo etc.) |__| |__|__|__|__||__| peso |__|__|__|__||__| peso 6.20 Transportation |__| |__|__|__|__||__| |__|__|__|__||__| 6.21 Cooking Fuel, |__| |__|__|__|__||__| |__|__|__|__||__| 6.22 Light and water |__| |__|__|__|__||__| |__|__|__|__||__| 6.23 Communication/mobile phone card |__| |__|__|__|__||__| |__|__|__|__||__| 6.24 Was this past month different in terms of expenditure than other months in the year? 1=YES 2= No 6.25 If yes, did you spend 1=more, 2=much more 3=less 4= much less 6.26 WHY was it different ? ____________________ In the Past 6 MONTHS (semester), how much money have you spent to acquire each of the following items or service? Use the following table, write 0 if no expenditure.
Peso Peso
6.27 Clothing, shoes and other wear |__|__|__|__|,|__|__| 6.32 Veterinary
expenses |__|__|__|__|,|__|__|
6.28 Education (school fees/uniforms/supplies) |__|__|__|__|,|__|__| 6.33 House maintenance
and repair |__|__|__|__|,|__|__|
6.29 Medical care |__|__|__|__|,|__|__| 6.34Celebrations, social events, funerals, weddings
|__|__|__|__|,|__|__|
6.30
Furnishing and household equipment (such as household utensils, accessories, household linen, mosquito nets)
|__|__|__|__|,|__|__| 6.35 Fines / Taxes |__|__|__|__|,|__|__|
6.31 Equipment, tools, seeds |__|__|__|__|,|__|__| 6.36 Hiring labour |__|__|__|__|,|__|__|

World Food Programme Food Security Assessment – Mindanao, Philippines 2007
51
SECTION A7 – FOOD SOURCES AND CONSUMPTION
Could you please tell me how many days in the past week your household has eaten the following foods and what the last 7 days)
Food Item # of days eaten
Food Source (write all)
last 7 days Main 7.1a- Rice |__| |__|__|
7.1b- Maize / Corn |__| |__|__|
7.1c Other cereals (bread, biscuits etc.) |__| |__|__|
7.1d- Cassava |__| |__|__|
7.1e- Sweet potatoes (camote) |__| |__|__|
7.1f- Other roots and tubers (potatoes, gabi) |__| |__|__|
7.1g- Beans, groundnuts |__| |__|__|
7.1h- Vegetables |__| |__|__|
7.1i- Fruits |__| |__|__|
7.1j- Fish, fish paste |__| |__|__|
7.1k- Meat (beef, pork, chicken) |__| |__|__|
7.1l- Wild animals |__| |__|__|
7.1m- Eggs |__| |__|__|
7.1n- Milk and other dairy |__| |__|__|
7.1o- Sugar and sugar products |__| |__|__|
7.1p- Vegetable oil, coconut oil, fats |__| |__|__|
7.2a - Has any member of your household received food aid in the last 6 months?
7.2b - If yes, please specify the type of program and the number of beneficiary in your household? circle all that apply and specify number of beneficiaries in the last column
7.3a- Has any member of your household received any other type of external assistance beside food aid in the last 6 months?
7.3b-
What type of assistance? Circle all that apply

World Food Programme Food Security Assessment – Mindanao, Philippines 2007
52
2 Education (fees, books, uniforms) 3 Medical services 4 Construction material, building 5 Agricultural assistance (tools /
seeds)
6 Other, specify________________ SECTION A8 – SHOCKS AND FOOD SECURITY
8.1a - Rea: Has your household suffered from any problems or shocks in the last 12 months?
1 yes 2 No section 9
8.1b Read: What were the main problems or shocks your household faced in the last 12 months? Do not read the options! Once all shocks have been identified ask respondent to rank the most important ones and write them down in column 8.2. A. = Drought/irregular rains / Hailstorms J. =Loss of employment for a household
member B. =Floods K. =Reduced income of a household
member C. =Landslides, erosion L. =Serious illness or accident of household
member D. =Unusually high level of crop pests & disease M. =Death of a working household member E. =Unusually high level of livestock diseases N. =Death of other household member F. =Lack of employment O. =Theft of Money/valuables G. =Unusually high level of human disease P. =Theft of Animals H. =Unavailability of food Q. =Conflict I. =High costs of agric. inputs (seed, fertilizer, etc.) R. =displacement
S. = other, specify ________________________
For the four main shocks above, please complete the following table using the codes below. Please be consistent in the ranking. Complete one line at the time. 8.2a Rank & Cause (copy code from above the four main causes)
First __________
Second __________
Third __________
Fourth __________
8.2b- Did [cause] create a decrease or loss for your household of:
1 = Income & in-kind receipts 2 = Assets (e.g. livestock, cash savings) 3 = Both income and assets 4 = No change
(Write number)
|__| |__| |__| |__|
8.2c- Did [cause] create a decrease in your household’s ability to produce or purchase enough food to eat for a period of time (not including the annual ‘lean season’)?
1 = Yes 2 = No 3 = Don’t know
|__| |__| |__| |__|
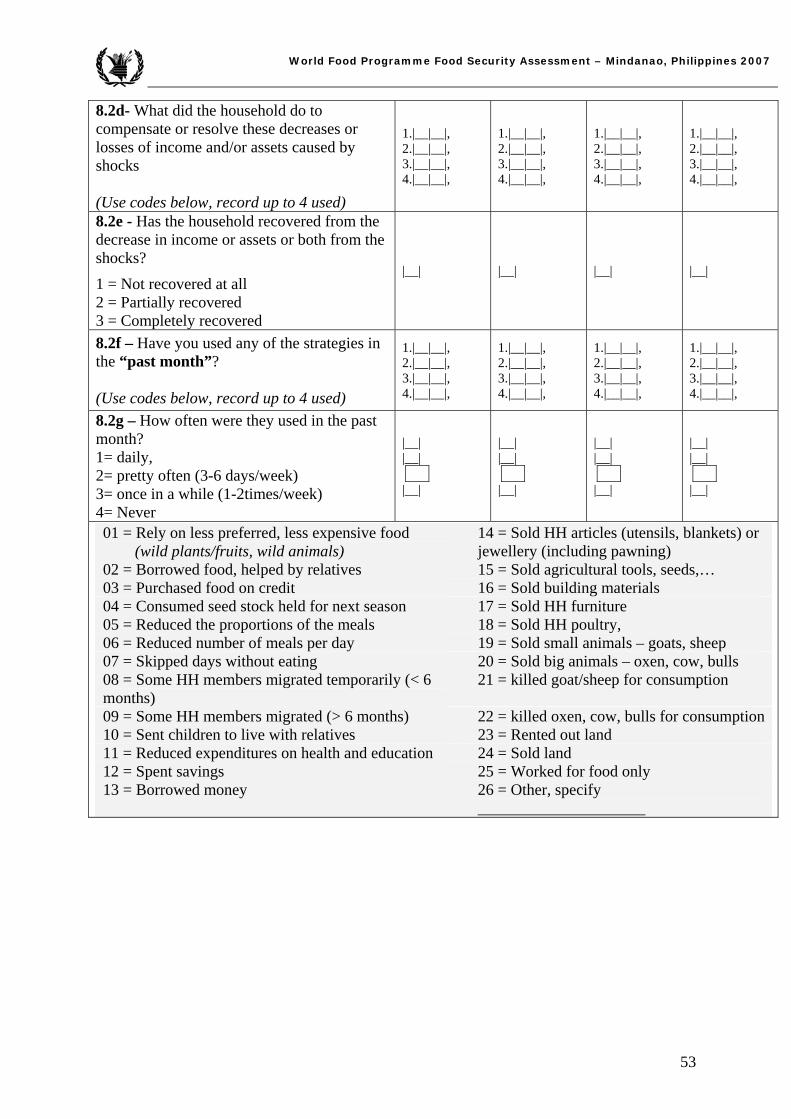
World Food Programme Food Security Assessment – Mindanao, Philippines 2007
53
8.2d- What did the household do to compensate or resolve these decreases or losses of income and/or assets caused by shocks (Use codes below, record up to 4 used)
1.|__|__|, 2.|__|__|, 3.|__|__|, 4.|__|__|,
1.|__|__|, 2.|__|__|, 3.|__|__|, 4.|__|__|,
1.|__|__|, 2.|__|__|, 3.|__|__|, 4.|__|__|,
1.|__|__|, 2.|__|__|, 3.|__|__|, 4.|__|__|,
8.2e - Has the household recovered from the decrease in income or assets or both from the shocks?
1 = Not recovered at all 2 = Partially recovered 3 = Completely recovered
|__| |__| |__| |__|
8.2f – Have you used any of the strategies in the “past month”? (Use codes below, record up to 4 used)
1.|__|__|, 2.|__|__|, 3.|__|__|, 4.|__|__|,
1.|__|__|, 2.|__|__|, 3.|__|__|, 4.|__|__|,
1.|__|__|, 2.|__|__|, 3.|__|__|, 4.|__|__|,
1.|__|__|, 2.|__|__|, 3.|__|__|, 4.|__|__|,
8.2g – How often were they used in the past month? 1= daily, 2= pretty often (3-6 days/week) 3= once in a while (1-2times/week) 4= Never
|__| |__|
|__|
|__| |__|
|__|
|__| |__|
|__|
|__| |__|
|__|
01 = Rely on less preferred, less expensive food (wild plants/fruits, wild animals)
14 = Sold HH articles (utensils, blankets) or jewellery (including pawning)
02 = Borrowed food, helped by relatives 15 = Sold agricultural tools, seeds,… 03 = Purchased food on credit 16 = Sold building materials 04 = Consumed seed stock held for next season 17 = Sold HH furniture 05 = Reduced the proportions of the meals 18 = Sold HH poultry, 06 = Reduced number of meals per day 19 = Sold small animals – goats, sheep 07 = Skipped days without eating 20 = Sold big animals – oxen, cow, bulls 08 = Some HH members migrated temporarily (< 6 months)
21 = killed goat/sheep for consumption
09 = Some HH members migrated (> 6 months) 22 = killed oxen, cow, bulls for consumption10 = Sent children to live with relatives 23 = Rented out land 11 = Reduced expenditures on health and education 24 = Sold land 12 = Spent savings 25 = Worked for food only 13 = Borrowed money 26 = Other, specify
_____________________

World Food Programme Food Security Assessment – Mindanao, Philippines 2007
54
SECTION B9 – CHILD HEALTH
9.1 Are there any children less than 5 years old in this household?
1 Yes Read: how many? |__| (write number)
2 No
9.2 Has [NAME] been ill with a fever at any time in the past 2 weeks?
1 Yes
2 No
3 Don’t know
1 Yes
2 No
3 Don’t know
1 Yes
2 No
3 Don’t know
9.3 Has [NAME] been ill with a cough at any time in the past 2 weeks?
1 Yes
2 No
3 Don’t know
1 Yes
2 No
3 Don’t know
1 Yes
2 No
3 Don’t know
9.4 Has [NAME] been ill with diarrhea at any time in the past 2 weeks? (Diarrhea: perceived as 3 or more loose stools per day or one large watery stool or blood in stool)
1 Yes
2 No
3 Don’t know
1 Yes
2 No
3 Don’t know
1 Yes
2 No
3 Don’t know
9.5 If yes, Was [NAME] seen by a health personnel during this illness?
1 Yes
2 No
3 Don’t know
1 Yes
2 No
3 Don’t know
1 Yes
2 No
3 Don’t know
SECTION B10 – EDUCATION 10.1 Do you have a school aged child (6-12 years old)? 1= YES 2= NO How many? |__||__| 10.2 If YES, is the child/ren attending school? 1= YES 2= NO How many? |__||__| 10.3 If NO, what is the main reason for child/ren not attending school? a) No functioning school available b) cannot afford it c) do not believe in sending child to school d) child is sick e) other (specify) ______________________ Circle the answer
THANK YOU FOR YOUR TIME AND PARTICIPATION!!!

55
Annex 3. Logistics plan Day Team 1 = Mike
(Sultan Kudarat and MagindaTeam 2= Yvonne (Cotabatoprovince and Magindano)
Team 3 = Sahib Lana del Norte
Team 4= Baicon Lana del sur
Friday Matanog municipality barangay Bugansan Norte and Langkong
Datu odin Sinsuat municipality barangay Kinebaka and Tanwil
Baloi municipality Barangay Adapun-Ali,
Kapatagan municipality Barangay Kapatagan Proper and Pi
Saturday Matanog municipality barangay Bnorte and Bugasan Sur
Pikit municipality barangay Nabundas and Dalengaoen
Munai municipality barangay Leninding and Balintad
Kapatagan municipality Barangay Upper Igabay and Inudara
Sunday Magsaysay municipality baranDurianon and Baguiguicon
Kapatagan municipality Barangay Daguan and Bakikis
Tuesday Esperanza municipaliy barangay and Paitan (Villamor)
Midsayap municipality barangaNabalawag and Kadingilan
Salvador municipality barangaBulacon and Inasagan
Post election party
Wednesday Lambayong municipality barangayPimbalayan and Lagao
Pikit municipality barangay Bualan and Pamalian
Salvador municipality barangaKilala and Padianan
Piagapo municipality barangay Ilian Poblacion and Radapan
Thursday Lutayan municipality barangay Tananzang and Tamnag
Magpet municipality barangay Temporan and Bagumbayan
Munai municipality barangay Panggao and Poblacion
Piagapo municipality barangay OdaRadapan Proper
Friday Colombio municipality barangay Polomok and El Bebe
Matalam municipality barangayCentral Malamote and Salvacio
Baloi municipality Barangay Bangco
Piagapo municipality barangay Ilian Bobo
Saturday END END END END
Team 1 Team 2 Team 3 Team 4 Team 5 Team 6 Market Data Encoders Mishael Argonza Yvonne Forsen Sahib Haq Baicon Macaraya Bal Dash Sandra Abubacar Aileen Astudillo - 101 Fahima Abdulaziz - 201 Jaslin Masbud - 301 Apasrah Bani - 401 Aveen Acuna- Raihana Datu Haron Bai Sittie Aisa Drus Ali - Jeanny Abao Abdujalil Magad - 302 Jaydan Batumpar - 402 Marivic Ortega Noralisa Freires Zhurbohida Balading - 10 Mishra Zumbaga - 203 Esnaida Saripada - 303 Carimah Campong - 403 Ammerrah Ma Melvin Briones - 104 Bonnie Singayao - 204 Susan Batutay - 304 Sakinur Ganda - 404

56
Annex 4: Scenarios Scenario* Assumptions Impacts 1. Most optimistic: Peace agreement signed with speedy donor support for post-conflict rehabilitation and recovery projects. A fast economic recovery with significant impact on poverty reduction and food insecurity is however unlikely in the short term. (less likely, score: 1.5)
o Signed peace agreement o Continued improvement of the
security situation characterized by minor violence between clans
o Allocation of funds for poverty reduction projects
o Slow start up of recovery projects and slow trickle down effect to the remote villages.
o Reduced number of IDPs and thus increased number of returnees
o Overall number of income poor remains due to slow employment creation and livelihood support
o Increased humanitarian assistance for recovery due to better funding
2. Status Quo: No economic recovery with insignificant impact on poverty reduction (most likely, score; 4.5)
o No peace agreement signed in 2008
o Tense political scene to remain throughout the forecast period of 2007-08 fuelled by clan clashes.
o No funds for recovery and only small scale projects e.g minor road rehabilitation in few locations only
o Overall number of income poor increases as with current trends in the Philippines.
o No change in living conditions of poor households which makes up for the large majority of the effected population.
3 Pessimistic: Significant deterioration of the socio-economic situation. (unlikely, score: 1.5)
o Full scale conflict with deterioration of the security situation
o Further reduction in public investment in non-productive sectors
o Economic downturn due to further damage of infrastructure (roads and transports), disruption of imports and markets,
o Increased IDP numbers o Increased poverty rate o Increased need for humanitarian
assistance.
* A score of 1-5 has been used to evaluate the likelihood for a particular scenario.

57
Annex 5 Response options and capacities
Activity Strengths Weakness Remarks/Discussion Increases Purchasing Power - ability to buy other needs
Possible expenditure on non-food items
No transportation cost to WFP, better physical access Increases transportation cost to beneficiary Infrastructure/asset development, more improved access
Diversifies food consumption as households decide themselves what food item to buy
Cash for Work
Lesser expenditure on food in total expenditure
Even though theoretically this option is possible, as there is no problem with food availability at the markets, it was felt by the discussion group it is not a feasible response option in Mindanao due to factors such as security of staff. As availability to banks is limited amongst the target groups, cash would have to be delivered by hand. There is also a potential risk for corruption when cash is involved. The country office should consider further exploring possibilities through piloting activities with the government.
Creation of infrastructure/assets i.e. farming, community gardens for household income generation Food composition/ration is less than daily wage
Self targeting of poorest households with no other income source
FFW concept is relatively new; needs to be adapted further for more efficient outcome
Improved accessibility to food at household level Women participation in FFW needs to be qualified so as not to deprive them of their time from household chores and attention to family
Improved gender balance towards women participation
Need of complementary inputs that may be difficult to obtain
Provides better physical accessibility to income-generating activities
FFW: Relative acceptability of rice (needs more water to cook; needs to be washed many times to remove smell)
Voucher For Work: Possible lower quality of food (due to some traders' malpractice
Voucher for Work: No transportation cost to WFP, better physical access, no pipeline breaks
FFW: Logistical constraints in delivering small tonnages.
Food For Work and/or Voucher For Work
Voucher for Work: Increased transportation cost to beneficiary
Food for work addresses a major factor to food insecurity, access to food due to very limited income sources especially during the lean season. Food for work is a recommended programme. It should continue especially for households in need of food assistance that do not have school going children. It was felt by the discussion group that more efforts are needed to explain to communities what FFW can be used for. Vouchers are used by the government's Department of Social Welfare and Development (DSWD), the national executive partner to WFP, in their Food For Work projects. It is recommended that WFP explores the possibility to, where possible, use the same system as DSWD though NFA (National Food Authority) food outlets. This would also save costs for WFP on transportation and storage handling, as well as support the local small markets.
Increases enrolment Increased access to food at households level through take home rations
Increased burden on teachers (Distribution and reporting) as well as larger classes
Hunger mitigation More pupils, no facilities, no additional teachers
Food for Education Increases/d attendance storage problem at school level
Highly effective programme in bringing children to school who otherwise would be used as labour by poor households. The take home ration of 12.5kg/child/month is proved to be successful in increasing the access to food in households to the extent that it is worth more to send the child to school than keep them at home for work.

58
Better concentration in classroom/improves class participation (stomach no longer empty) Transportation difficulties to remote schools Influences/improves quality of education (improves teachers performance) Improves community involvement Take home ration is an economic transfer covering the income that the child could bring to the family of working instead.
Imroproved community relationships (peace building among parents/residents from different barangays)
The group discussed the fact that currently WFP is implementing both take home and onsite feeding in the same schools for the same pupils. Whilst the assessment was not an evaluation of different programmes usefulness it was felt by the discussion group that the CO might be able to monitor the impact of one programme properly if not spread thinly on many type of interventions. The two approaches are useful for different objectives and meet different needs.
Creates skills, faciitates community empowerment Very few opportunities for skills training that results in diversified income sources
Strengthen livelihood capacity and income opportunity Lack of follow-up project
Strengthen network/linkage Lack of implementing patners Addresses access to food Facilitates venue for community to come together (peace building)
ood for Training opportunity for women empowerment
The Assessment team felt that there was a need for expansion of food for training, especially when skills training is related to opportunities for employment and when it is combined with adult literacy. The lack of fairly compensated employment opportunities is one of the structural issues faciing the population of Mindanao. Functional literacy levels in ARMM is 62% whilst in the country as a whole it is 84%.
Improved nutritional status of PLW and children 6-24 months who are the most vulnerable groups in the society to malnutrition but also the consequences of food insecurity.
Relative acceptability of CSB in terms of taste; less sugar rations
Improved accessibility to food In terms of targeting, food also reaches non-target beneficiaries
Reduced anemia incidence
MCH programme
Food also reaches non-target beneficiaries i.e. immediate family members
Due to high levels of malnutrition it is felt that the MCH programme has an important role to play by bringing PLW to the health centres but mainly by providing nutritious weaning foods to the households where otherwise the traditional weaning food is soft boiled rice. It is however acknowledged that an exit strategy may be difficult to agree upon with the government who at this point in time do not have a programme that WFP’s MCH programme could be handed over to.
Brings more donors and complementary inputs Bureaucracy hampers implementation pace
Mobilize communities into self-help activities with little injection of assistance Takes time to see results Advocacy for
improved social services and infrastructure
Low awareness on self-initiation; tendency of people to rely on government for any development
Needed not only for improved infrastructure but also in making the local governement allocate more teachers posts as well as health personnel to cater for increased demand of these services that WFPs programme have created.