Emergency admissions for Ambulatory Care Sensitive ... · Ambulatory Care Sensitive Conditions –...
14
Emergency admissions for Ambulatory Care Sensitive Conditions – characteristics and trends at national level March 2014 Provisional - Not for wider circulation
Transcript of Emergency admissions for Ambulatory Care Sensitive ... · Ambulatory Care Sensitive Conditions –...
Emergency admissions for
Ambulatory Care Sensitive Conditions
– characteristics and trends at
national level
March 2014
Provisional -
Not for wider
circulation

Contents
Understanding how emergency admissions for ambulatory care sensitive conditions (ACSCs) vary at national level may raise questions to be investigated locally and identify areas for improvement.
This slide pack provides some analysis of the latest published data for the rate of hospital emergency admissions for these conditions as measured by the NHS Outcomes Framework indicators 2.3i (on long-term ACSCs) and 3a (on acute ACSCs).
This document includes:
• A short definition of ambulatory care sensitive conditions
• Analysis of the rate of admissions for ACSCs from 2003/04 to 2012/13 at:
• National level
• and for the following breakdowns at national level:
• Gender
• Age
• Conditions

Introduction
• Ambulatory care sensitive conditions (ACSCs) are conditions where effective community care and case management can help prevent the need for hospital admission. Even if the ACSC episode itself is managed well, an emergency admission for an ACSC is often a sign of the poor overall quality of primary and community care.
• The NHS outcomes Framework (NHSOF) includes two indicators that measure the age-sex standardised rate of emergency admissions per 100,000 population for people of all ages:
• Unplanned hospitalisation for chronic ambulatory care sensitive conditions (all ages) – NHSOF 2.3.i
• This indicator indicates how successfully the NHS manages long-term (LTCs) or chronic conditions (such as asthma, diabetes, epilepsy, hypertensive disease, dementia and heart failure) where optimum management can be achieved in the community.
• Emergency admissions for acute conditions that should not usually require hospital admission – NHSOF 3a
• This indicator looks at conditions that should usually be managed without the patient having to be admitted to hospital such as ear-, nose- and throat infections, kidney- and urinary tract infections as well as acute heart disease.
• This slide pack presents key findings from the latest published data for emergency admissions for ACSCs – they cover the period from 2002/03 to 2012/13 and were published on the February 2013 by the Health and Social Care Information Centre (https://indicators.ic.nhs.uk/webview/ )
[For further detail on the definitions, please go to: https://indicators.ic.nhs.uk/webview/ (on the left column: NHS Outcomes Framework > Domain 2 > Improvement Areas > Reducing time spent in hospital by people with long-term conditions; NHS Outcomes Framework > Domain 3 > Overarching indicators > 3a Emergency admissions for acute conditions that should not usually require hospital admission)]
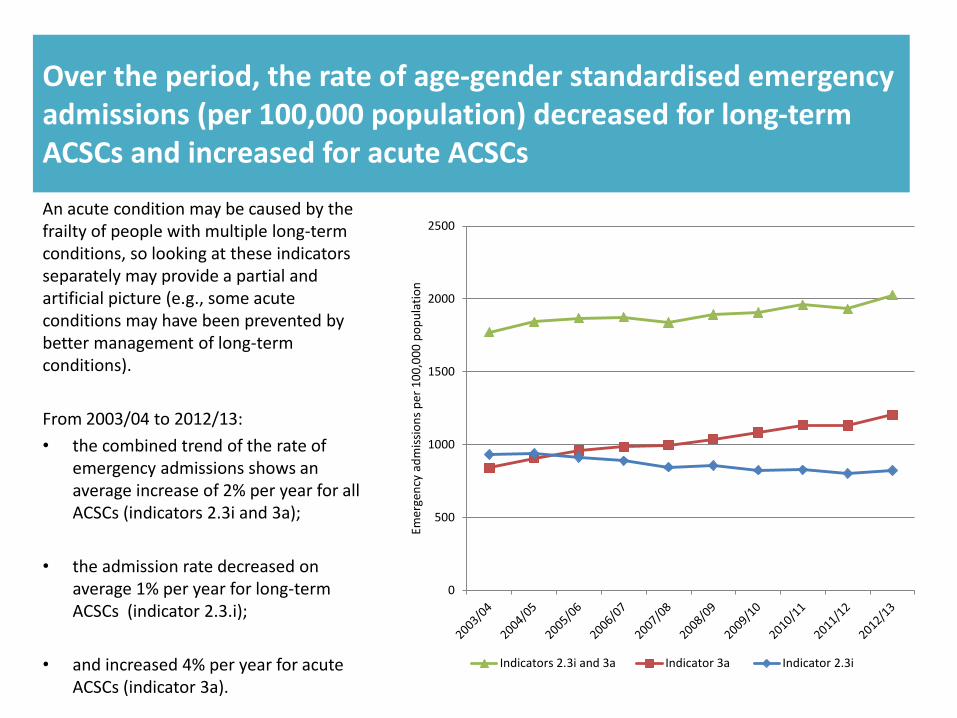
Over the period, the rate of age-gender standardised emergency admissions (per 100,000 population) decreased for long-term ACSCs and increased for acute ACSCs
An acute condition may be caused by the frailty of people with multiple long-term conditions, so looking at these indicators separately may provide a partial and artificial picture (e.g., some acute conditions may have been prevented by better management of long-term conditions).
From 2003/04 to 2012/13:
• the combined trend of the rate of emergency admissions shows an average increase of 2% per year for all ACSCs (indicators 2.3i and 3a);
• the admission rate decreased on average 1% per year for long-term ACSCs (indicator 2.3.i);
• and increased 4% per year for acute ACSCs (indicator 3a).
0
500
1000
1500
2000
2500
Emer
gen
cy a
dm
issi
on
s p
er 1
00
,00
0 p
op
ula
tio
n
Indicators 2.3i and 3a Indicator 3a Indicator 2.3i

The rate of admissions decreased for female and male patients for long-term ACSCs
For long-term ACSCs:
• Wide difference in rates for male and female patients in 2003/04 with around 880 admissions per 100,000 populations for female patients compared to around 1,000 admissions for male patients.
• The gap disappears over time with hardly any difference noticeable between rates across genders in 2012/13.
600
700
800
900
1000
1100
Emer
gen
cy a
dm
issi
on
s p
er 1
00
,00
0 p
op
ula
tio
n
Male
Female
0

The rate of admissions increased for female and male patients for acute ACSCs
For acute ACSCs:
• The gap between male and female patients has widened significantly from 2003/04 to 2012/13 with admission rates for both genders below 850 per 100,000 population in 2003/04 compared to rates of 1,136 and 1,270 respectively for males and females in 2012/13.
600
700
800
900
1000
1100
1200
1300
Emer
gen
cy a
dm
issi
on
s p
er 1
00
,00
0 p
op
ula
tio
n
Female
Male
0

The rate of admissions for both long-term and acute ACSCs increased more for female patients than for male patients
Comparing the rate of emergency admissions for male and female patients for both long-term and acute ACSCs:
• The rate of admissions for female patients increased on average 2% per year from 2003/04 to 2012/13.
• This is the double of the average increase for male patients over the period – 1%.
1000
1200
1400
1600
1800
2000
2200
Emer
gen
cy a
dm
issi
on
s p
er 1
00
,00
0 p
op
ula
tio
n
Female
Male
0
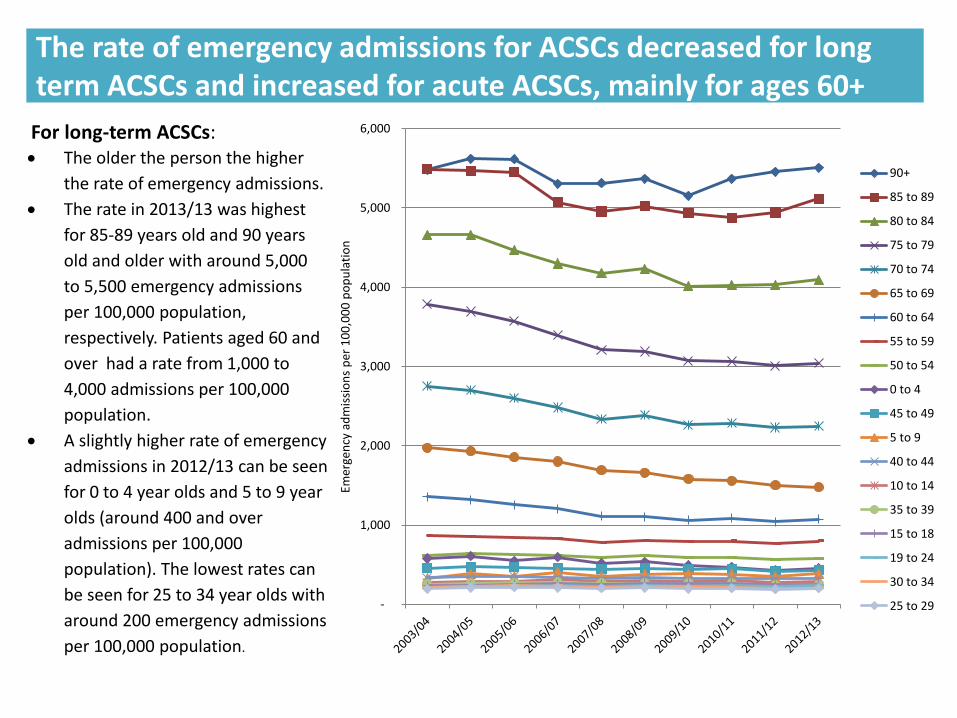
The rate of emergency admissions for ACSCs decreased for long term ACSCs and increased for acute ACSCs, mainly for ages 60+
For long-term ACSCs: The older the person the higher
the rate of emergency admissions.
The rate in 2013/13 was highest
for 85-89 years old and 90 years
old and older with around 5,000
to 5,500 emergency admissions
per 100,000 population,
respectively. Patients aged 60 and
over had a rate from 1,000 to
4,000 admissions per 100,000
population.
A slightly higher rate of emergency
admissions in 2012/13 can be seen
for 0 to 4 year olds and 5 to 9 year
olds (around 400 and over
admissions per 100,000
population). The lowest rates can
be seen for 25 to 34 year olds with
around 200 emergency admissions
per 100,000 population.
-
1,000
2,000
3,000
4,000
5,000
6,000
Emer
gen
cy a
dm
issi
on
s p
er 1
00
,00
0 p
op
ula
tio
n
90+
85 to 89
80 to 84
75 to 79
70 to 74
65 to 69
60 to 64
55 to 59
50 to 54
0 to 4
45 to 49
5 to 9
40 to 44
10 to 14
35 to 39
15 to 18
19 to 24
30 to 34
25 to 29

The rate of emergency admissions for ACSCs decreased for long term ACSCs and increased for acute ACSCs, mainly for ages 60+
For acute ACSCs: While emergency admissions
for age groups 10 to 49 are
relatively low (around 400-600
admissions per 100,000
population) in 2012/13 , the
rate increases with age over
the period 2003/04 to 2012/13
with the highest rates for the
oldest age groups with almost
10,000 admissions per 100,000
population for the group aged
90 and over and almost 7,000
for the group aged 85-89.
The third highest rate can be
seen for the youngest age
group of 0 to 4 year olds with
almost 4,000 admissions per
100,000 population.
-
1,000
2,000
3,000
4,000
5,000
6,000
7,000
8,000
9,000
10,000
Emer
gen
cy a
dm
issi
on
s p
er 1
00
,00
0 p
op
ula
tio
n
90+
85 to 89
0 to 4
80 to 84
75 to 79
70 to 74
65 to 69
60 to 64
5 to 9
55 to 59
19 to 24
50 to 54
25 to 29
45 to 49
15 to 18
30 to 34
40 to 44
35 to 39
10 to 14
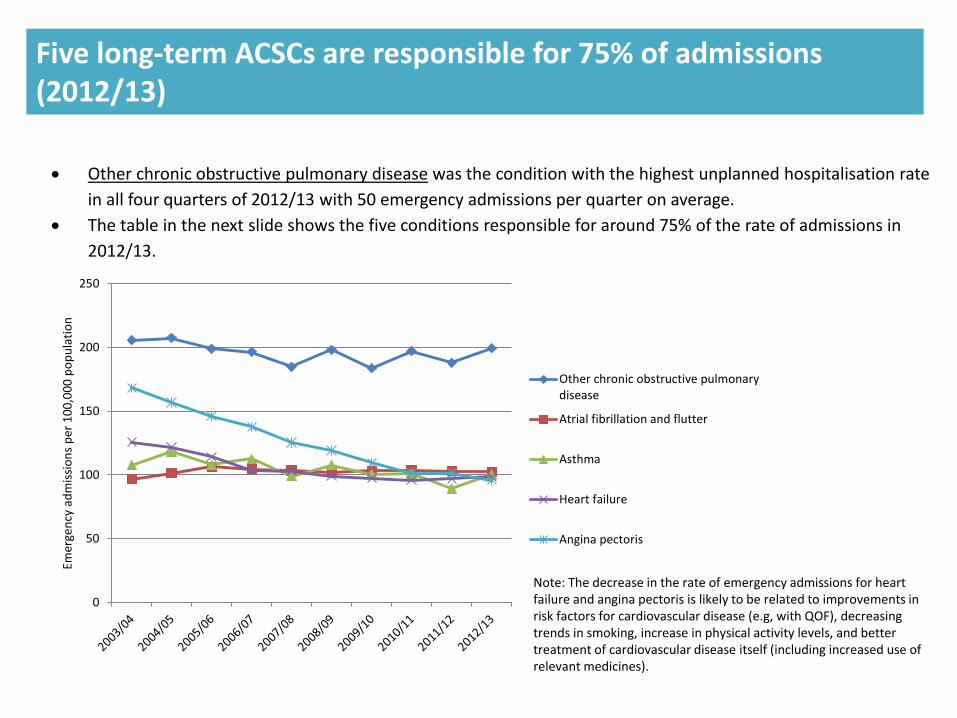
Five long-term ACSCs are responsible for 75% of admissions (2012/13)
Note: The decrease in the rate of emergency admissions for heart failure and angina pectoris is likely to be related to improvements in risk factors for cardiovascular disease (e.g, with QOF), decreasing trends in smoking, increase in physical activity levels, and better treatment of cardiovascular disease itself (including increased use of relevant medicines).
Other chronic obstructive pulmonary disease was the condition with the highest unplanned hospitalisation rate
in all four quarters of 2012/13 with 50 emergency admissions per quarter on average.
The table in the next slide shows the five conditions responsible for around 75% of the rate of admissions in
2012/13.
0
50
100
150
200
250
Emer
gen
cy a
dm
issi
on
s p
er 1
00
,00
0 p
op
ula
tio
n
Other chronic obstructive pulmonarydisease
Atrial fibrillation and flutter
Asthma
Heart failure
Angina pectoris

Five long-term ACSCs are responsible for 75% of admissions (2012/13)
Condition % emergency admissions in
2012/13 Annual average change
2003/04 to 2012/13
Other chronic obstructive pulmonary disease, site not specified
24% No change
Atrial fibrillation and flutter 12% Increase 1%
Asthma 12% Decrease 1%
Heart failure 12% Decrease 3%
Angina pectoris 12% Decrease 6%

Seven acute ACSCs are responsible for 75% of admissions (2012/13)
Urinary tract infection (site not specified) was the condition with the highest emergency admissions rate in
2012/13 with 67 admissions per 100,000 population per quarter on average.
It is followed by lobar pneumonia with 46 admissions per quarter on average.
The table in the next slide shows the seven conditions responsible for 75% of the rate of admissions in 2012/13.
Note: Gastroenteritis cases were coded under ‘digestive’ conditions until 2010/11 and started to be coded under ‘infections’ from 2011/12. This change is highly likely to account for the huge increase in these admissions from 2011/12 to 2012/13.
0
50
100
150
200
250
300
Emer
gen
cy a
dm
issi
on
s p
er 1
00
,00
0 p
op
ula
tio
n
Urinary tract infection, site not specified
Lobar pneumonia, unspecified
Diarrhoea and gastroenteritis ofpresumed infectious origin
Cellulitis
Acute upper respiratory infectionsmultiple and unsp sites
Convulsions, not elsewhere classified
Viral and other specified intestinalinfections

Acute ACSCs responsible for 75% of admissions (2012/13)
*Gastroenteritis cases were coded under ‘digestive’ conditions until 2010/11 and started to be coded under ‘infections’ from 2011/12. This change is highly likely to account for the huge increase in these admissions over the period. ** The rate of admissions decrease s on average 6% per year in the conditions coded as ‘Diarrhoea and gastroenteritis of presumed infectious origin’ from 2003/04 to 2011/12, when the coding changes described above took place.
Condition % emergency admissions in 2012/13
Annual average change 2003/04 to 2012/13
Annual average change 2003/04 to 2011/12
Urinary tract infection, site not specified
22% Increase 7% Increase 7%
Lobar pneumonia, unspecified 15% Increase 10% Increase 10%
Diarrhoea and gastroenteritis of presumed infectious origin
11% Increase 30%* Decrease 6%**
Cellulitis 8% Increase 1% Increase 2%
Acute upper respiratory infections multiple and unspecified sites
7% Decrease 1% Decrease 2%
Convulsions, not elsewhere classified
6% No change No change
Viral and other specified intestinal infections
6% Increase 5% Increase 4%

In sum, the key findings on the rate of emergency admissions for ACSCs from 2003/04 to 2012/13 are:
• The average increase of 2% per year for all ACSCs is made up of a decrease in the admission rate for long-term ACSCs, particularly for older people, and an increase in the admissions rate for acute ACSCs.
• The decrease in the admission rate for long-term ACSCs indicates better management of these conditions.
• Clinical advice suggests that the increase in the admissions rate for acute ACSCs, particularly for older people, seems to indicate that an acute condition may be caused by the frailty of people with multiple LTCs and that looking at these indicators separately may provide a partial and artificial picture.
• There is a small number of conditions driving up most of these admissions :
• Five long-term ACSCs – ‘other chronic obstructive pulmonary disease’ , atrial fibrillation and flutter, asthma, heart failure and angina pectoris.
• Seven acute ACSCs – urinary tract infection (site not specified) , lobar pneumonia (unspecified), diarrhoea and gastroenteritis of presumed infectious origin (which increase has been driven by coding changes in these conditions), cellulitis, acute upper respiratory infections (multiple and unspecified sites), convulsions (not elsewhere classified) and viral and other specified intestinal infections.
Other reports of interest:
• Blunt, I. (October 2013). Focus on preventable admissions – Trends in emergency admissions for ambulatory care sensitive conditions, 2001 to 2013. The Health Foundation and the Nuffield Trust. (Accessed: http://www.health.org.uk/publications/focus-on-preventable-admissions/)
• Tian, I., Dixon, A. & Gao, H. (April 2012). Data Briefing – Emergency hospital admissions for ambulatory care-sensitive conditions: identifying the potential for reductions. The King’s Fund. (Accessed: http://www.kingsfund.org.uk/publications/data-briefing-emergency-hospital-admissions-ambulatory-care-sensitive-conditions)