
EMEA VIDEO BENCHMARKS 2016 - IAB Ireland · In the UK, digital video ad spend reached the billion...
17
www.videologygroup.com | Private & Confidential London | Paris | Madrid EMEA VIDEO BENCHMARKS 2016
Transcript of EMEA VIDEO BENCHMARKS 2016 - IAB Ireland · In the UK, digital video ad spend reached the billion...

www.videologygroup.com | Private & ConfidentialLondon | Paris | Madrid
EMEA VIDEO BENCHMARKS2016

www.videologygroup.com | Private & ConfidentialLondon | Paris | Madrid
2016 In Review 3
About Videology 4
Methodology 4
Market Insights 5
� Finland � France � Ireland � Netherlands � Norway � Spain � Sweden � Turkey � UK
Summary 17
Glossary 18
CONTENTS

www.videologygroup.com | Private & ConfidentialLondon | Paris | Madrid
2016 IN REVIEW
The proliferation of screens and devices, as well as the accessibility of (video) content anytime, anywhere are undeniable developments. Brands and advertisers worldwide are investing an increasing amount of their media budgets into digital channels and leveraging video’s ability to influence audiences with compelling storytelling through sight, sound and motion. As the competition for consumer eyeballs becomes fiercer, effectively navigating the ever-changing media landscape becomes imperative for a brand’s success. For this reason, each year Videology takes a deep dive into the trends and developments within leading EMEA markets.
Our 2016 EMEA Benchmarks Report provides brands and agencies with key insights into the complex world of converging TV and digital video. Whilst broadcast TV continued to command the lion’s share of media spend in all European markets, digital video investments were at an all-time high. In the UK, digital video ad spend reached the billion pound mark (£1.08 billion, as estimated by eMarketer). In Ireland, digital video rose by a staggering 85 percent in Q1 2016 vs. Q1 2015, whilst in Turkey it grew by 51 percent compared to 2015. As budgets increase, so does the importance of defining a successful marketing strategy that effectively and efficiently reaches and influences a brand’s desired audience across all screens.
Videology believe that in order to deliver better advertising, brands and agencies need to view the entirety of the video ecosystem through a single lens: Total TV. Linear broadcast TV will remain the centre of gravity for the foreseeable future, across nearly all audiences. That viewing diversifies out from this centre as devices, distribution and consumption are enabled by emerging technologies that support video. The most effective video advertising strategies will be those that have a unified and holistic approach to the video ecosystem, as opposed to those that only activate via silo-solutions, and only solve for one part of the equation.
Researcher IHS estimates that by 2020 online video advertising spend in EMEA will amount to €3.8 billion. Given the sizable investment, it is imperative that advertisers and agencies are armed with the insight and technology to successfully allocate, optimise and execute audiovisual (AV) budgets, thus maximising return on investment for advertisers.
JANA EISENSTEIN, MD EMEA

www.videologygroup.com | Private & ConfidentialLondon | Paris | Madrid
Videology (videologygroup.com) is a leading software provider for converged TV and video advertising. We believe in a world where all media, irrespective of format or buy-type, will be addressable in some shape or form. A world where every ad-placement will be dynamically decisioned and allocated in real-time, powered by the application of deep customer analytics and optimised for better outcomes for both media owner and advertiser. The growing trend of hyper-fragmentation of audiences across platforms and devices requires an open technology platform with proven ability to scale across markets to simplify an increasingly complex world of television. By simplifying big data, we empower marketers and media companies to make smarter advertising decisions to fully harness the value of their audience across screens. Our math and science-based technology enables our customers to manage, measure and optimise digital video and TV advertising to achieve the best results in the converging media landscape.
Videology, Inc., is a privately-held, venture-backed company, whose investors include Catalyst Investors, Comcast Ventures, NEA, Pinnacle Ventures, and Valhalla Partners. Videology is headquartered in New York, NY with key offices in Baltimore, Austin, Toronto, London, Paris, Madrid, Singapore, Sydney, Tokyo and sales teams across North America..
ABOUT VIDEOLOGY
METHODOLOGY
Videology ad decisions billions of impressions each day across major broadcasters and premium publishers, private marketplaces, ad exchanges and networks. By analysing the plethora of data generated through our unique position within the ecosystem, we are able to aggregate and share performance insights. These include performance by device type, ad length, viewability and common targeting strategies.

MARKET INSIGHTS

www.videologygroup.com | Private & ConfidentialLondon | Paris | Madrid
Digital ad spend in Finland reached €346 million, just over a quarter of the €1.27 billion total media ad spend in 2016 (eMarketer). By 2020, digital ad spend is estimated to reach €432 million, accounting for a third of total media spend.
Whilst live TV consumption still dominates screen time, digital streaming platforms are increasingly becoming an integral part of viewers’ overall video consumption. According to AudienceProject, 82 percent of Finnish internet users in 2016 were digital video viewers. Digital video viewing happens across multiple screens – for 82 percent of the audience PCs were the preferred choice, compared to 58 percent who chose mobile phones and 43 percent who selected tablets. Device proliferation increased, as did the sophistication with which marketers execute their media campaigns. 62 percent of all video campaigns within the Videology platform in Finland ran on VPAID integrations, vs. 9 percent in 2015. This benefits marketers with enhanced creative and measurement.
FINLAND MARKET INSIGHTS 2016
DEVICE SPLIT BY IMPRESSIONS
TOP 5 AD INDUSTRY SECTORS
PERFORMANCE BY AD LENGTH
38%
62%VPAID
VAST
84.3%78.6%2.45%80.6%73.7%0.93%
1.30%Average CTR
74.9%Average VTR
81.5%Average VCR
VIEW THROUGH RATE WAS THE #1 CAMPAIGN KPI IN 2016
30’’
10’’
20’’0.99%
1.62%
74.6%
82.5%
87.5%
66.6%
76.2%82.7%
VPAID VS. VAST
2016 VIDEOLOGY AVERAGES
TV VIEWING HABITS OF INTERNET USERS IN FINLAND
Source: TNS, *Consumer Barometer*, Aug 1, 2016. Multiple sources of TV viewing possible
24.1%75.9%
MOBILEPC
MOST COMMON TARGETING TYPES
#1 DEMOGRAPHIC
#2 GEOGRAPHIC
#3 BEHAVIOURAL
% OF RESPONDENTS
89%REGULAR TV ON A TV SET
32%DIGITAL CONTENT STREAMED ON ANOTHER DEVICE
22%DIGITAL CONTENT STREAMED ON A TV SET
38%RECORDED PROGRAMS ON A TV SET
13%CATCH-UP SERVICE OR ON-DEMAND SERVICE ON A TV SET
7%OTHER
CTR VTR VCR CTR VTR VCR
OPTIMISED TOWARDS CTR
HEALTH & FITNESS
RETAIL
STYLE & FASHION
AUTOMOTIVE
FMCG
1.19%
1.80%
1.03%
0.82%
1.46%
77.9%
71.5%
74.1%
81.3%
71.3%
84.1%
78.6%
81.7%
86.1%
78.2%
CTR VTR VCR
OPTIMISED TOWARDS VIDEO AD COMPLETION
*Insufficient campaign data at this copy length, with CTR as the primary campaign objective.
CTR VTR VCR
*
AGGREGATE CAMPAIGN PERFORMANCE
www.videologygroup.com | Private & ConfidentialLondon | Paris | Madrid
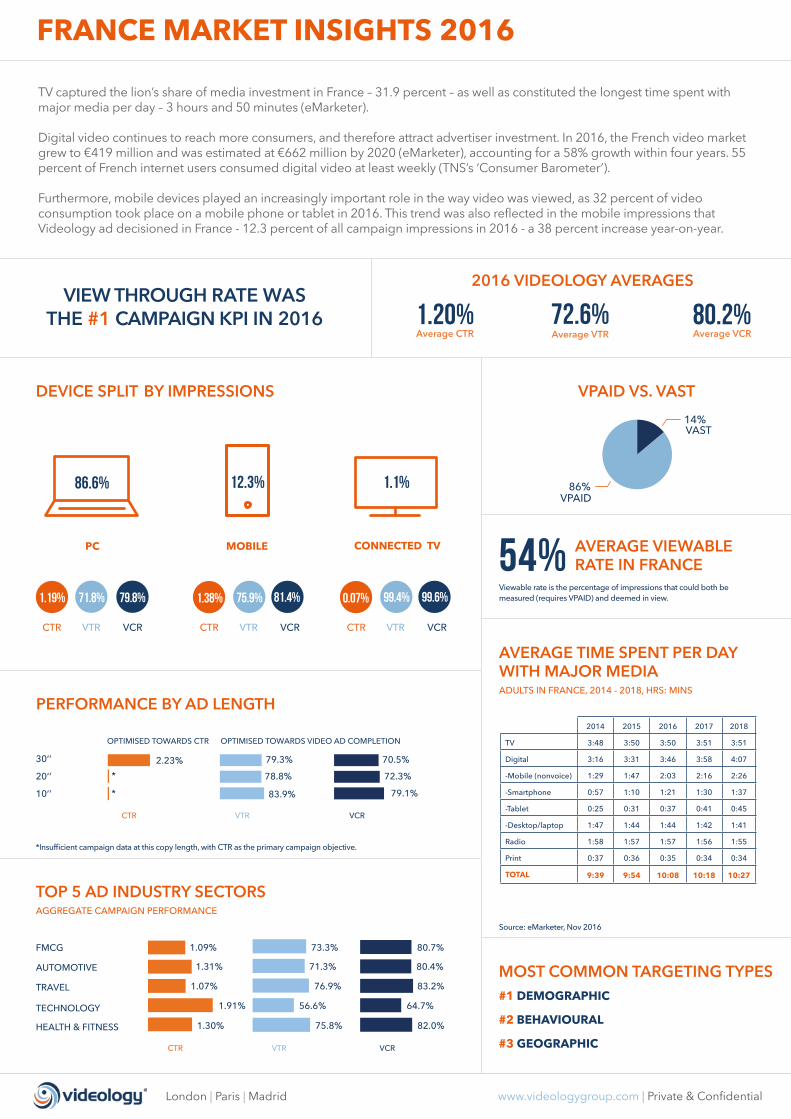
72.6%Average VTR
TV captured the lion’s share of media investment in France – 31.9 percent – as well as constituted the longest time spent with major media per day – 3 hours and 50 minutes (eMarketer).
Digital video continues to reach more consumers, and therefore attract advertiser investment. In 2016, the French video market grew to €419 million and was estimated at €662 million by 2020 (eMarketer), accounting for a 58% growth within four years. 55 percent of French internet users consumed digital video at least weekly (TNS’s ‘Consumer Barometer’).
Furthermore, mobile devices played an increasingly important role in the way video was viewed, as 32 percent of video consumption took place on a mobile phone or tablet in 2016. This trend was also reflected in the mobile impressions that Videology ad decisioned in France - 12.3 percent of all campaign impressions in 2016 - a 38 percent increase year-on-year.
FRANCE MARKET INSIGHTS 2016
DEVICE SPLIT BY IMPRESSIONS
TOP 5 AD INDUSTRY SECTORS
PERFORMANCE BY AD LENGTH
AVERAGE TIME SPENT PER DAY WITH MAJOR MEDIA
14%
86%VPAID
VAST
81.4% 99.6%79.8% 75.9% 99.4%71.8% 1.38% 0.07%1.19%
1.20%Average CTR
80.2%Average VCR
VIEW THROUGH RATE WAS THE #1 CAMPAIGN KPI IN 2016
30’’
20’’
10’’
2.23% 79.3% 70.5%
78.8% 72.3%
83.9% 79.1%
VPAID VS. VAST
54% AVERAGE VIEWABLE RATE IN FRANCE
Viewable rate is the percentage of impressions that could both be measured (requires VPAID) and deemed in view.
Source: eMarketer, Nov 2016
2016 VIDEOLOGY AVERAGES
12.3%86.6%
MOBILEPC
1.1%
CONNECTED TV
ADULTS IN FRANCE, 2014 - 2018, HRS: MINS
2014 2015 2016 2017 2018
TV 3:48 3:50 3:50 3:51 3:51
Digital 3:16 3:31 3:46 3:58 4:07
-Mobile (nonvoice) 1:29 1:47 2:03 2:16 2:26
-Smartphone 0:57 1:10 1:21 1:30 1:37
-Tablet 0:25 0:31 0:37 0:41 0:45
-Desktop/laptop 1:47 1:44 1:44 1:42 1:41
Radio 1:58 1:57 1:57 1:56 1:55
Print 0:37 0:36 0:35 0:34 0:34
TOTAL 9:39 9:54 10:08 10:18 10:27
MOST COMMON TARGETING TYPES#1 DEMOGRAPHIC
#2 BEHAVIOURAL
#3 GEOGRAPHIC
CTR VTR VCR CTR VTR VCR CTR VTR VCR
CTR VTR VCR
FMCG
TRAVEL
TECHNOLOGY
HEALTH & FITNESS
AUTOMOTIVE
1.09%
1.31%
1.07%
1.91%
1.30%
73.3%
71.3%
76.9%
56.6%
75.8%
80.7%
80.4%
83.2%
64.7%
82.0%
CTR VTR VCR
OPTIMISED TOWARDS CTR OPTIMISED TOWARDS VIDEO AD COMPLETION
*Insufficient campaign data at this copy length, with CTR as the primary campaign objective.
*
*
AGGREGATE CAMPAIGN PERFORMANCE

www.videologygroup.com | Private & ConfidentialLondon | Paris | Madrid
Digital video advertising in Ireland rose by a staggering 85 percent in H1 2016 compared to H1 2015 (H2 numbers haven’tbeen released prior to the publication of Videology’s EMEA Benchmarks, though we expect this trend to be consistent for theentirety of 2016). This is even stronger growth than what the IAB/PwC reported in 2015 vs. 2014 (70 percent growth from€14.4 million in 2014 to €24.5 million in 2015). Digital video investment in H1 2016 alone was €20 million, reflective of bothincreased media consumption and advertiser confidence.
PwC further predicts that digital video ad spend in Ireland will see a 16.5 percent growth per year during the period 2016 to2020. This is attributed to digital video’s ability to both build brands and deliver difficult to reach light-TV audiences.24 percent of adults visit a brand’s website after seeing a video ad, whilst 20 percent search online for that brand. Moreover,59 percent of 15 to 24 year olds in Ireland watch more VOD than TV (IAB Ireland Report ‘The Power of VOD’).
IRELAND MARKET INSIGHTS 2016
66%
34%VPAID
VAST
0.92%Average CTR
85.4%Average VCR
81.0%Average VTR
REACH WAS THE #1 CAMPAIGN KPI IN 2016
VPAID VS. VAST
70% AVERAGE VIEWABLE RATE IN IRELAND
Viewable rate is the percentage of impressions that could both be measured (requires VPAID) and deemed in view.
2016 VIDEOLOGY AVERAGES
85.0%85.9% 81.1%80.9% 0.97% 98.5%97.3%0.24%0.85%
53.5% 0.3%46.2%
CONNECTED TVMOBILEPC
30’’
10’’
20’’
1.77%
*
*
86.7%
90.1%
92.3%
82.5%
86.8%
89.4%
METHODS USED TO WATCH TV
Source: Millward Brown AdReaction Video 2016
LIVE TV ON-DEMAND TV COMPUTER TABLET PHONE
30% 19%13%25% 13%
AMONGST ADULTS IN IRELAND
MOST COMMON TARGETING TYPES
#1 DEMOGRAPHIC
#2 BEHAVIOURAL
#3 GEOGRAPHIC
CTR VTR VCR CTR VTR VCR CTR VTR VCR
CTR VTR VCR
FMCG
TECHNOLOGY
HEALTH & FITNESS
AUTOMOTIVE
RETAIL
0.97%
0.84%
0.94%
0.84%
1.03%
81.1%
83.6%
77.6%
81.1%
76.1%
85.4%
87.6%
83.1%
85.5%
81.1%
CTR VTR VCR
TOP 5 AD INDUSTRY SECTORS
PERFORMANCE BY AD LENGTH
DEVICE SPLIT BY IMPRESSIONS
OPTIMISED TOWARDS CTR OPTIMISED TOWARDS VIDEO AD COMPLETION
*Insufficient campaign data at this copy length, with CTR as the primary campaign objective.
AGGREGATE CAMPAIGN PERFORMANCE

www.videologygroup.com | Private & ConfidentialLondon | Paris | Madrid
85.7%Average VTR
Linear TV investment in the Netherlands commanded €983 million in 2016 (IAB Netherlands), as 94 percent of Dutch adults continued to watch TV live, on a TV set (TNS). Digital streaming platforms, however, are increasingly growing in importance, when it comes to Dutch viewers’ overall media consumption. A quarter of internet users in the Netherlands streamed digital content on devices other than the TV set (TNS). 54 percent of all video campaigns within the Videology platform in the Netherlands ran on a VPAID integration in 2016, compared to 36 percent in 2015. This reflects marketers’ efforts to enhance the interactivity and measurement capabilities of their campaigns.
The financial sector accounted for the largest share of digital ad spend in the Netherlands, capturing 13.4 percent of total digital investment (Deloitte / IAB Netherlands). The financial sector was also the leading vertical in terms of impression volume within the Videology platform in the Netherlands.
NETHERLANDS MARKET INSIGHTS 2016
46%
54%VPAID
VAST
49.5%90.4% 41.2%87.2% 0.61%1.35%
1.33%Average CTR
89.1%Average VCR
VIEW THROUGH RATE WAS THE #1 CAMPAIGN KPI IN 2016
VPAID VS. VAST
67% AVERAGE VIEWABLE RATE IN THE NETHERLANDS
Viewable rate is the percentage of impressions that could both be measured (requires VPAID) and deemed in view.
2016 VIDEOLOGY AVERAGES
30’’
20’’
10’’
1.08% 91.9% 89.6%
* 89.9% 87.0%
* 89.8% 85.1%
3.3%96.7%
MOBILEPC
TV VIEWING HABITS OF INTERNET USERS IN THE NETHERLANDS
Source: TNS, *Consumer Barometer*, Aug 1, 2016. Multiple sources of TV viewing possible
% OF RESPONDENTS
94%LINEAR TV ON A TV SET
25%DIGITAL CONTENT STREAMED ON ANOTHER DEVICE
19%DIGITAL CONTENT STREAMED ON A TV SET
44%RECORDED PROGRAMS ON A TV SET
36%CATCH-UP SERVICE OR ON-DEMAND SERVICE ON A TV SET
6%OTHER
MOST COMMON TARGETING TYPES
#1 DEMOGRAPHIC
#2 BEHAVIOURAL
TOP 5 AD INDUSTRY SECTORS
PERFORMANCE BY AD LENGTH
DEVICE SPLIT BY IMPRESSIONS
CTR VTR VCR CTR VTR VCR
CTR VTR VCR
FINANCE
FMCG
AUTOMOTIVE
TECHNOLOGY
HOME & GARDEN
1.16%
1.21%
1.66%
1.12%
1.12%
81.8%
86.8%
85.1%
88.1%
91.8%
86.1%
90.1%
89.1%
90.5%
93.9%
CTR VTR VCR
OPTIMISED TOWARDS CTR OPTIMISED TOWARDS VIDEO AD COMPLETION
*Insufficient campaign data at this copy length, with CTR as the primary campaign objective.
AGGREGATE CAMPAIGN PERFORMANCE

www.videologygroup.com | Private & ConfidentialLondon | Paris | Madrid
71.9%Average VTR
NORWAY MARKET INSIGHTS 2016
40%
60%VPAID
VAST
1.07%Average CTR
78.7%Average VCR
VIEW THROUGH RATE WAS THE #1 CAMPAIGN KPI IN 2016
VPAID VS. VAST
58% AVERAGE VIEWABLE RATE IN NORWAY
Viewable rate is the percentage of impressions that could both be measured (requires VPAID) and deemed in view.
2016 VIDEOLOGY AVERAGES
77.4%79.0% 71.0%72.1% 1.11%1.06%
MOBILEPC
17.4%82.6%
In 2016, the investment in digital media in Norway was up year-on-year by 17 percent amounting to €850 million.The market ranked fourth globally both in terms of total media ad spend per person and digital ad spend per internet userdown from third position in 2015 (eMarketer). The market ranked fourth globally both in terms of total media ad spend per person and digital ad spend per internet user down from third position in 2015, swapping positions with the UK (eMarketer). Live TV still received the lion’s share of consumers’ screen time, amounting to 184 minutes per day in 2016. Live, on a TV setwas also the way 86 percent of all Norwegians viewed TV content (TNS). Digital video viewing continued to be on the rise.Data from AudienceProject suggests that 91 percent of internet users polled watched some type of video across multipledevices, and the percentage was even higher amongst young adults – 98 percent. This observation is also mirrored in theway Videology’s clients in Norway ran their video campaigns in 2016. 17.4 percent of all campaign impressions weredelivered on a mobile device in 2016, vs. 11.8 percent in 2015.
30’’
20’’
10’’
1.11%
84.1%
68.9%
1.05% 77.0% 69.8%
1.04%
76.1%
77.6%
TV VIEWING HABITS OF INTERNET USERS IN NORWAY
Source: TNS, *Consumer Barometer*, Aug 1, 2016. Multiple sources of TV viewing possible
% OF RESPONDENTS
86%LINEAR TV ON A TV SET
37%DIGITAL CONTENT STREAMED ON ANOTHER DEVICE
27%DIGITAL CONTENT STREAMED ON A TV SET
43%RECORDED PROGRAMS ON A TV SET
36%CATCH-UP SERVICE OR ON-DEMAND SERVICE ON A TV SET
8%OTHER
MOST COMMON TARGETING TYPES
#1 DEMOGRAPHIC
#2 BEHAVIOURAL
#3 GEOGRAPHIC
TOP 5 AD INDUSTRY SECTORS
DEVICE SPLIT BY IMPRESSIONS
PERFORMANCE BY AD LENGTH
CTR VTR VCR CTR VTR VCR
CTR VTR VCR
RETAIL
HEALTH & FITNESS
TRAVEL
SPORTS
FMCG1.07%
0.80%
1.43%
1.05%
1.73%
72.2%
77.1%
66.5%
72.9%
80.2%
80.0%
82.2%
73.6%
80.9%
84.5%
CTR VTR VCR
OPTIMISED TOWARDS CTR OPTIMISED TOWARDS VIDEO AD COMPLETION
AGGREGATE CAMPAIGN PERFORMANCE

www.videologygroup.com | Private & ConfidentialLondon | Paris | Madrid
Investment in TV advertising in Spain reached €1.9 billion in 2016, making up 39.8 percent of total media spend (eMarketer). TV still dominated the country’s advertising landscape, to a greater degree than in the UK or France.
The second largest portion of Spain’s advertising market could be attributed to digital, which in 2016 reached €1.23 billion. By 2020, the investment in the Spanish digital market is expected to grow even further and be worth €1.5 billion. Digital video gained strong traction in the market. eMarketer predicts that by 2020 digital video revenues will reach €211 million, across all devices, up from €146 million in 2016.
Within the Videology platform, 13.1 percent of all campaign impressions in Spain were delivered on mobile devices in 2016, up from 3 percent in 2015, as advertisers and agencies look to reach their target audience across the devices which consumers are using to view video content.
SPAIN MARKET INSIGHTS 2016
TOP 5 AD INDUSTRY SECTORS
52%
48%VPAID
VAST
86.9%
PC
VIEW THROUGH RATE WAS THE #1 CAMPAIGN KPI IN 2016
VPAID VS. VAST
64% AVERAGE VIEWABLE RATE IN SPAIN
Viewable rate is the percentage of impressions that could both be measured (requires VPAID) and deemed in view.
2016 VIDEOLOGY AVERAGES
SPANISH DIGITAL VIDEO VIEWERS
Source: eMarketer, Dec 2016
MILLIONS
22.1m23.1m
24.0m 24.8m25.5m
2016 2017 2018 2019 2020
65.3%Average VTR
76.9%68.4%
13.1%
MOBILE
68.3%59.4%3.65%1.82%
1.82%Average CTR
75.9%Average VCR
30’’
10’’
20’’
2.78%
2.30%
2.34%
72.3%
76.3%
85.1%
62.7%
67.6%
79.4%
MOST COMMON TARGETING TYPES
#1 DEMOGRAPHIC
#2 BEHAVIOURAL
#3 GEOGRAPHIC
DEVICE SPLIT BY IMPRESSIONS
PERFORMANCE BY AD LENGTH
CTR VTR VCR CTR VTR VCR
CTR VTR VCR
FMCG
RETAIL
TECHNOLOGY
HEALTH & FITNESS
AUTOMOTIVE
1.73%
2.16%
2.69%
2.93%
3.02%
67.7%
63.5%
73.3%
69.4%
58.7%
76.4%
72.5%
80.1%
77.0%
69.8%
CTR VTR VCR
OPTIMISED TOWARDS CTR OPTIMISED TOWARDS VIDEO AD COMPLETION
AGGREGATE CAMPAIGN PERFORMANCE

www.videologygroup.com | Private & ConfidentialLondon | Paris | Madrid
SWEDEN MARKET INSIGHTS 2016
TOP 5 AD INDUSTRY SECTORS
0.86%Average CTR
85.6%Average VCR
80.1%Average VTR
VIEW THROUGH RATE WAS THE #1 CAMPAIGN KPI IN 2016
45%
55%VPAID
VAST
VPAID VS. VAST
2016 VIDEOLOGY AVERAGES
77.4%88.5% 69.7%83.8% 1.12%0.77%
26.0%74.0%
MOBILEPC
2016 was the year that internet usage achieved a stronger penetration amongst Swedish adults than traditional TV.82.8 percent of 16 to 80 year olds in Sweden went online daily compared to 77.2 percent who watched TV daily (TNS Sifo).Nevertheless, TV continued to be the medium which commanded the largest share of consumers’ time – 148 minutes a dayon average vs. 133 minutes spent online.
Digital video viewing in Sweden has become commonplace, as 90 percent of internet users are said to watch digital videoon multiple devices monthly (AudienceProject). The percentage was even higher for younger audiences – 97 percent ofthose aged 15 to 25. Video streaming is another alternative to traditional TV viewing that is gaining traction. TNS Sifo foundthat 60 percent of 15 to 45 year olds streamed video on a weekly basis in Sweden. This device proliferation will onlycontinue to rise, highlighting the need to manage cross-screen viewing holistically in order best control reach andfrequency.
30’’
20’’
10’’
1.38% 78.9% 73.0%
0.84% 86.3% 80.9%
0.58% 89.1% 84.1%
TV VIEWING HABITS OF INTERNET USERS IN SWEDEN
Source: TNS, *Consumer Barometer*, Aug 1, 2016. Multiple sources of TV viewing possible
% OF RESPONDENTS
89%LINEAR TV ON A TV SET
44%
DIGITAL CONTENT STREAMED ON ANOTHER DEVICE
34%DIGITAL CONTENT STREAMED ON A TV SET
19%RECORDED PROGRAMS ON A TV SET
25%CATCH-UP SERVICE OR ON-DEMAND SERVICE ON A TV SET
7%OTHER
MOST COMMON TARGETING TYPES
#1 DEMOGRAPHIC
#2 BEHAVIOURAL
CTR VTR VCR CTR VTR VCR
CTR VTR VCR
RETAIL
FINANCE
FMCG
TECHNOLOGY
HEALTH & FITNESS
0.82%
0.85%
0.82%
0.84%
1.05%
78.6%
82.2%
78.7%
84.2%
76.7%
84.6%
87.1%
84.5%
88.4%
82.9%
CTR VTR VCR
DEVICE SPLIT BY IMPRESSIONS
PERFORMANCE BY AD LENGTH
OPTIMISED TOWARDS CTR OPTIMISED TOWARDS VIDEO AD COMPLETION
AGGREGATE CAMPAIGN PERFORMANCE
www.videologygroup.com | Private & ConfidentialLondon | Paris | Madrid
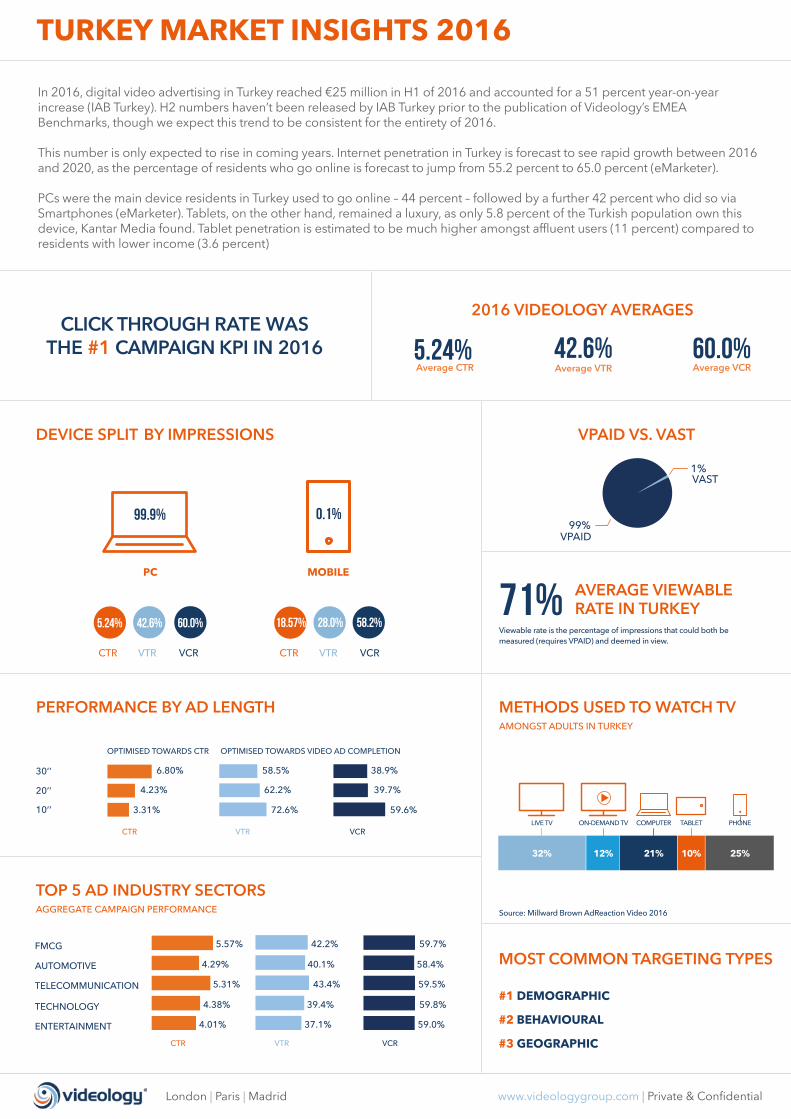
42.6%Average VTR
TURKEY MARKET INSIGHTS 2016
TOP 5 AD INDUSTRY SECTORS
5.24%Average CTR
60.0%Average VCR
CLICK THROUGH RATE WAS THE #1 CAMPAIGN KPI IN 2016
1%
99%VPAID
VAST
VPAID VS. VAST
71% AVERAGE VIEWABLE RATE IN TURKEY
Viewable rate is the percentage of impressions that could both be measured (requires VPAID) and deemed in view.
2016 VIDEOLOGY AVERAGES
In 2016, digital video advertising in Turkey reached €25 million in H1 of 2016 and accounted for a 51 percent year-on-year increase (IAB Turkey). H2 numbers haven’t been released by IAB Turkey prior to the publication of Videology’s EMEA Benchmarks, though we expect this trend to be consistent for the entirety of 2016.
This number is only expected to rise in coming years. Internet penetration in Turkey is forecast to see rapid growth between 2016 and 2020, as the percentage of residents who go online is forecast to jump from 55.2 percent to 65.0 percent (eMarketer).
PCs were the main device residents in Turkey used to go online – 44 percent – followed by a further 42 percent who did so via Smartphones (eMarketer). Tablets, on the other hand, remained a luxury, as only 5.8 percent of the Turkish population own this device, Kantar Media found. Tablet penetration is estimated to be much higher amongst affluent users (11 percent) compared to residents with lower income (3.6 percent)
30’’
20’’
10’’
6.80% 58.5% 38.9%
4.23% 62.2% 39.7%
3.31% 72.6% 59.6%
58.2%60.0% 28.0%42.6% 18.57%5.24%
MOBILEPC
0.1%99.9%
Source: Millward Brown AdReaction Video 2016
LIVE TV ON-DEMAND TV COMPUTER TABLET PHONE
32% 25%21%12% 10%
METHODS USED TO WATCH TVAMONGST ADULTS IN TURKEY
MOST COMMON TARGETING TYPES
#1 DEMOGRAPHIC
#2 BEHAVIOURAL
#3 GEOGRAPHIC
DEVICE SPLIT BY IMPRESSIONS
PERFORMANCE BY AD LENGTH
CTR VTR VCR CTR VTR VCR
CTR VTR VCR
FMCG
TELECOMMUNICATION
TECHNOLOGY
ENTERTAINMENT
AUTOMOTIVE
5.57%
4.29%
5.31%
4.38%
4.01%
42.2%
40.1%
43.4%
39.4%
37.1%
59.7%
58.4%
59.5%
59.8%
59.0%
CTR VTR VCR
OPTIMISED TOWARDS CTR OPTIMISED TOWARDS VIDEO AD COMPLETION
AGGREGATE CAMPAIGN PERFORMANCE

www.videologygroup.com | Private & ConfidentialLondon | Paris | Madrid
Consumers in the UK continue to embrace digital media, spending an average of 4 hours and 45 minutes a day with digital content in 2016 (eMarketer).
Digital video budgets were at an all-time high, equating to £1.08 billion in 2016. This amount is expected to double by 2020, reaching £2.03 billion, as advertisers and agencies embrace video’s ability to effectively and efficiently reach and influence audiences (eMarketer).
A notable change in how brands in the UK delivered their digital video campaigns was the increase in impressions that ran on connected TVs. In 2016, 6.6 percent of campaign impressions were delivered to this device, more than doubling year-on-year. This is reflective of the strong consumer uptake of over-the-top content and viewing via connected TVs.
UK MARKET INSIGHTS 2016
TOP 5 AD INDUSTRY SECTORS
UK DIGITAL VIDEO AD SPEND2015 - 2020
51% AVERAGE VIEWABLE RATE IN THE UK
55%
45%VPAID
VAST
85.5%84.5% 81.8%79.4% 0.98% 97.7%97.2%0.01%0.44%
22.5% 6.6%70.9%
CONNECTED TVMOBILEPC
0.54%Average CTR
81.2%Average VTR
85.7%Average VCR
VIEW THROUGH RATE WAS THE #1 CAMPAIGN KPI IN 2016
VPAID VS. VAST
Viewable rate is the percentage of impressions that could both be measured (requires VPAID) and deemed in view.
2016 VIDEOLOGY AVERAGES
8.3%
11.3%12.3%
13.2%14.3%
15.5%
£711
£1,085£1,304
£1,522£1,766
£2,034
2015 2016 2017 2018 2019 2020
Source: eMarketer, Sep 2016
MILLIONS OF £ AND % OF TOTAL
30’’
10’’
20’’
0.82%
0.80%
0.99%
87%.2
91.0%
93.6%
87.9%
82.8%
91.3%
MOST COMMON TARGETING TYPES
#1 DEMOGRAPHIC
#2 BEHAVIOURAL
#3 GEOGRAPHIC
DEVICE SPLIT BY IMPRESSIONS
PERFORMANCE BY AD LENGTH
CTR VTR VCR CTR VTR VCR CTR VTR VCR
CTR VTR VCR
0.54%
0.58%
0.50%
0.48%
0.62%
85.1%
82.5%
79.4%
81.2%
78.6%
89.1%
87.0%
84.6%
86.0%
84.0%
RETAIL
AUTOMOTIVE
FINANCE
ENTERTAINMENT
FMCG
CTR VTR VCR
OPTIMISED TOWARDS CTR OPTIMISED TOWARDS VIDEO AD COMPLETION
AGGREGATE CAMPAIGN PERFORMANCE

www.videologygroup.com | Private & ConfidentialLondon | Paris | Madrid
� Digital video experienced unprecedented year-on-year growth, especially in markets such as Ireland and Turkey, where video investments increased by 85 percent and 51 percent respectively.
� View through rate was the leading objective in the majority of European markets, as advertisers strove to maximise the time consumers spent with their creative.
� Demographic targeting within digital video was the most popular targeting type across all European countries, indicative of advertisers’ TV-like approach to audience targeting on VOD. However, advertisers and agencies also increasingly took advantage of smarter targeting opportunities, leveraging behavioural and geographical targeting to reach audiences throughout the purchase funnel.
� Videology observed a stark difference in device split across markets, ranging from 53 percent of impressions on mobile in Ireland to 0.1 percent in Turkey. This is reflective of advertiser demand, widespread 4G infrastructure and access to content.
� The split between VAST vs. VPAID integrations differed widely across markets, from 34 percent VPAID in Ireland to 99 percent in Turkey, as marketers looked to introduce rich interactive video ad experiences and enhanced measurement.
� Connected TV commanded up to 6.6 percent of the total campaign impressions in advanced markets such as the UK, a large growth compared to 2.8 percent in 2015. This trend is only expected to increase going forward, as CTV and OTT inventory availability increases.
www.videologygroup.com | Private & ConfidentialLondon | Paris | Madrid
SUMMARY

www.videologygroup.com | Private & ConfidentialLondon | Paris | Madrid
AD IMPRESSION A metric depicting the number of times an ad is served.
BEHAVIOURAL TARGETINGA form of online marketing that uses advertising technology to target web users based on their previous behaviour. Advertising creative and content can be tailored to be of more relevance to a particular user by capturing their previous decision making behaviour.
CLICK-THROUGH RATE (CTR)Percent of video impressions that have received a click. Includes only eligible impressions, as some formats are not clickable (e.g. Connected TV).
GEO-TARGETINGThe method of determining the geolocation of a website visitor and delivering different content to that visitor based on his or her location, such as country, region/state, city, zip code or IP address.
REACHNumber of unique users that video impressions were served to.
VIDEO ON DEMAND (VOD)Systems which allow users to select and watch/ listen to video or audio content such as movies and TV shows when they choose to, rather than having to watch at a specific broadcast time, which was the prevalent approach with over-the-air broadcasting during much of the 20th century. IPTV technology is often used to bring video on demand to televisions and personal computers.
VIDEO COMPLETION RATE (VCR)Average percent of creative viewed (including partial views) for video impressions.
VIEW-THROUGH RATE (VTR)Percent of video impressions where the viewer watched 100% of the creative.
VIEWABLE RATEThe percentage of ads delivered that delivered the opportunity to be seen by a user.
VIDEO AD SERVING TEMPLATE (VAST)A universal XML schema for serving ads to digital video players, and describes expected video player behavior when executing VAST- formatted ad responses.
VIDEO PLAYER-AD API DEFINITION(VPAID)Standardises the communication between video players and in-stream video advertising. VPAID enables a rich interactive in-stream ad experience, as well as enhanced campaign measurement and reporting.
www.videologygroup.com | Private & ConfidentialLondon | Paris | Madrid
GLOSSARY

www.videologygroup.com | Private & ConfidentialLondon | Paris | Madrid
Videology (videologygroup.com) is a leading software provider for converged TV and video advertising. By simplifying big data, we empower marketers and media companies to make smarter advertising decisions to fully harness the value of their audience across screens. Our math and science-based technology enables our customers to manage, measure and optimize digital video and TV advertising to achieve the best results in the converging media landscape.
Videology, Inc., is a privately-held, venture-backed company, whose investors include Catalyst Investors, Comcast Ventures, NEA, Pinnacle Ventures, and Valhalla Partners. Videology is headquartered in New York, NY, with key offices in Baltimore, Austin, Toronto, London, Paris, Madrid, Singapore, Sydney, Tokyo and sales teams across North America.
VIDEOLOGY EUROPE LOCATIONS
UKNoah’s Yard10 York WayLondon, N1 9AA
PARIS27 Avenue de l’Opéra, 75001Paris, France
MADRID Paseo de la Castellana 40. 8th floor, 28046 Madrid, Spain