Embee Project
74
A Project Report On “CUSTOMER SATISFACTION/AWARENESS OF CLIENTS OF EMBEE SOFTWARE PVT. LTD” Prepared for Prepared by Saransh Sharma PGDM Marketing Roll No-IB1109240 Balaji Institute of International Business, Pune 1
-
Upload
saransh-sharma -
Category
Documents
-
view
26 -
download
3
Transcript of Embee Project

A Project Report On
“CUSTOMER SATISFACTION/AWARENESS OF CLIENTS OF EMBEE SOFTWARE PVT. LTD”
Prepared for
Prepared by
Saransh Sharma
PGDM Marketing
Roll No-IB1109240
Balaji Institute of International Business, Pune 2011-13
1

INDEX
CONTENTS PAGE NO
CERTIFICATE OF THE GUIDE I
ACKNOWLEDGEMENT III
EXECUTIVE SUMMARY IV
CHAPTER 1o INTRODUCTION,DETAILS OF THE ORGANISATION 3
o PURPOSE OF STUDY WITH OBJECTIVES 12
CHAPTER 2o LITERATURE REVIEW 14
CHAPTER 3o THE RESEARCH METHODOLOGY
INTRODUCTION 22 RESEARCH METHODOLOGY ADOPTED 25
Interpretation of the analysis
CHAPTER 4o AN ANALYSIS OF THE FIELD SURVEY 27
o CONCLUSIONS 29
CHAPTER 5o SUMMARY
FINDING OF THE STUDY 31
CHAPTER 6o APPENDIX 52
o BIBLIOGRAPHY 60
2

ACKNOWLEDGEMENT
I consider it a privilege to express a few words of gratitude and respect to all who guided and inspired me in successful completion of this project. I acknowledge my profound indebtness
and extend my deep sense of gratitude to my guides Mr. Saurabh Sharma (Branch Sales Manager , Pune Region) and Mr. Lakish Nand (Sr. B.D.E) for sharing their knowledge and
experience and providing valuable guidance, profound advice and encouragement that has led to successful completion of this project. I pay sincere thanks to Mr. Gulu Balani (V.P - HR &
Shared Services) for giving me an opportunity and providing me the necessary facilities to carry out the project work in their esteemed organization. I am greatly indebted to team
members for their support and constant encouragement and support throughout the project. Lastly I would like to thank Prof. Col. A. Balasubramanian, Dean, BIIB and Dr. Satish M
Inamdar, Director, BIIB, for their technical and moral support required for realization of this project.
Saransh Sharma
3

EXECUTIVE SUMMARY
This project was carried out at EMBEE SOFTWARE PVT. LTD., a growing IT SYSTEM INTEGRATOR. The project deals with the feedback of the customers on EMBEE SOFT. (Pune) , their satisfaction level with the company, the opinion of the customers on what they look forward to while going for an IT solution provider the services they expect from it and the overall experience with EMBEE SOFT.. The Primary objective of the project was – To carry out the satisfaction & awareness level of the clients. The Secondary Objective was
I. To calculate the satisfaction scores of the consumersII. To find out the different segments of people and their buying behaviour
III. To find the consumer awareness about the company
In order to carry out this survey visits were made to existing clients knowing there needs and knowing how happy they are with embee.
A cluster analysis has been made in order to know which companies are focussing on which factors. As a result two clusters were formed:
Cluster 2 focussing on
Product quality
Technical support
Cluster 2 focussing on
Responsiveness
Professionalism
4

CHAPTER 1
INTRODUCTION,DETAILS OF THE ORGANISTION
PURPOSE OF STUDY WITH OBJECTIVES
INDUSTRY PROFILE
First is a set of facts of Indian IT Services industry specific and a view of the Global IT Services industry.
5

6

Some interesting nuggets to kick off the thinking, head to google and search for IT Services, the top 3 resuls are first TCS, second Infosys and third IBM. Interesting eh! Also just to highlight the potential of the industry "The total addressable market for global offshoring is approximately $300 billion, of which $110 billion will be offshored by 2010, according to the NASSCOM-McKinsey report." The industry employed about 1 million staff and provided indirect employment to 2.5 million people in the fiscal year to March 31 2005, according to data released by NASSCOM. Gartner also estimates that India currently holds 80 to 90% of the offshoring market.Dean Davison, VP of strategic outsourcing for Nautilus Advisors excepts India's market share to shirnk by 20% by 2010.
Currently in the Indian IT Services Industry the tier 1 players have the lions share of the business, the tier 2 companies and the offshore centers come in second and finally the ever increasing list to the already existing set of emerging industries who have about 15% of the market share, What needs to
7

be seen is how are things going to pan out? Consolidation seems imminent in the industry. Consolidation/Acquisitions are likely to be done for two purpose's, first people /talent/raw material and two moving up the value chain or completing the offering. Ofcourse we are probably going to see a few acquistions particualrly outside thecountry by the emerging and mid sized players for purposes of customer access/acquisition.
Notes:Tier 1 Player – 45 % – 4 (Revenues greater than USD 1 billion)Tier 2 Player – 25% – 10 (Revenues USD 100 million-USD 1 billion)Offshore Ops – 15% – 30 (Revenues USD 10 million-USD 500 million)Emerging – 15% – >3000 (Revenues less than USD 100 million (IT) Revenues less than)Other Facts:
The total direct employment in the Indian IT-ITES sector is estimated to have grown by over a million, from 284,000 in FY 1999-2000 to a projected 1,287,000 in the current fiscal (2005-06),
8

helped create an additional 3 million job opportunities through indirect and induced employment.
The leading publicly- listed players have reported a top line year-on-year growth of nearly 34 per cent, over the first half of the current fiscal.
Indian IT services exports (excluding revenues earned from the export of ITES-BPO, engineering and R&D services, software product development and hardware) are estimated to have grown from USD 7.3 billion in FY 2003-04 to USD 10 billion in FY 2004-05, and are projected to reach USD 13.2 billion by the end of the current fiscal (FY 2005-06).
Revenues earned from project-based services accounted for 56 per cent of Indian IT services exports in FY 2004-05. While Indian firms are gradually increasing their share of revenues earned from annuity-based multi-year outsourcing contracts, with steady growth in demand for CADM and application support and customer preferences for the use of offshore service providers still being higher for discrete services than for end-to-end engagements – revenues from project-oriented engagements continue to contribute a larger share.
Functional IT outsourcing services (including application management, IS outsourcing/infrastructure, network and desktop management services) sourced from India grew by nearly 28 per cent in FY 2004-05. While application management services remain the mainstay of this segment, increasing traction in remote infrastructure management services is helping Indian companies increase their share of revenue earned from IS outsourcing engagements.
IT support and training services exports from India grew from USD 640 million in FY 2003-04 to USD 1.1 billion by FY 2004-05 an annual growth of 71 per cent.
9

INTRODUCTION, DETAILS OF THE ORGANISATION
MISSION“A leading technology driven business solutions provider that meets client’s business
objectives”, Embee seeks to leverage its technical expertise, commitment and discipline, backed by our principle’s trust and support and existing clientele’s continuous
confidence and dependability, to be a preferred IT solutions advisor. “
Embee Software Pvt. Ltd. is one of the leading end-to-end IT solution providers in the country. Incorporated in 1991, ESPL has evolved from a value added partner for software products into one of the trusted system integrators (SI) with an ISO 9001:2008 certification in India and is presently a Rs. 2 billion organization. With its corporate office in Kolkata, Embee has 6 branches across the country and around 250 employees who are working together to make Embee one of the largest SI’s in the country. Recently, Embee was accorded the status of a Microsoft LAR (Large Account Reseller) strengthening the organization’s position as an SI countrywide.
Over the years our strengthening relationships with our leading global partners such as Microsoft, HP, SAP, CISCO, VMware etc amongst others has enabled Embee to gain access to a wide range of the latest technologies. We offer advisory services to large and small enterprises to help them to arrive at the right mix of technologies and suggest the optimal way of deploying and managing them. Moreover, with our experience of 23 years in the IT industry and immense proficiency in solutions, we are able to understand the core requirements of our clients and offer unique solutions to fulfill their needs and deliver them to our customers - right from end-user devices to Tier 1 Data centers, right from designing of an application architecture to very complex workflow solutions.
In our quest to be integrated and customer focused Embee has structured itself into groups: –
10

Technology solutions group, specializing in Data Center designing and implementation, Infrastructure for SAP and Oracle landscape including high end servers, storage, complex backup solutions, enterprise networking and security, integrating systems in executive boardrooms, command briefing rooms, briefing theaters, and auditoriums to end user requirements such as desktops and laptops.
Data centre solutions High-end Server solutions Turnkey IT infrastructure solutions End user workplace solutions Audio visual integration solutions Storage solutions Back-up solutions IT support services
Technology services group focuses on delivering professional serviceson managing and optimizing both IT Infrastructures as well as for applications and business productivity. Covers wide range of services on technologies such as virtualization, collaboration, Document management, ERP implementations, Workflow solutions, Business Intelligence solutions, remote infrastructure management etc.…
ERP Solutions Enterprise networking Staff Augmentation through people practic
Software solutions and licensing group helps customers in deciding on the purchases software licensing based on their needs, helps customers in legal compliances for licenses, helps customer by giving the right mix of licenses to chooses from a wide variety of licensing models. Educate customers on different licensing models such as select agreement or enterprise agreement and benefits that the customers get out of it.
Microsoft Licensing Implementation and Support Services Core Infrastructure Optimization Application Productivity Optimization Software Licensing Solutions from
Adobe, Symantec, Citrix, Oracle, Red Hat
11

LOCATIONS
Some of our competitors
Softcell Wipro. Software one Sk international Shro systems Inorbit Sujata computers
12
New Delhi
Kolkata
Bhubaneswar
JamshedpurPune
Mumbai
Ahmedabad
Chandigarh
Hyderabad
BengaluruChennai
Kochi
Current
ProposedBy FY12

PURPOSE OF STUDY WITH OBJECTIVES13

The purpose of the study is to analyse the satisfaction level of clients on the basis of four factors i.e
Resposiveness Proffesionalism Prduct Quality Technical Support
Objective of the study being:
Customer Satisfaction level To know the awareness level of clients regarding services offered by the company To know which types of companies are more focussed on which factor
14

CHAPTER 2
LITERATURE REVIEW
15

LITERATURE REVIEW
Role o[f Market Research “Market research is defined as the systematic and objective search for and analysis of information relevant to the identification and solution of any problem in field of marketing”. According to American Marketing Association (AMA) Marketing research is defined as “the systematic gathering, recording and analyzing of data about problems relating to the marketing of goods and services”.
The Market Research Process Marketing research often follow a generalized pattern which can be broken down and studied sequentially.
Defining the problem Careful attention to problem definition allows the researcher to set the proper research objectives, which in turn facilitate relevant and economic data, collection.
16

Statement of the research objectives Research objectives may be stated in qualitative or quantitative terms and expressed as research question statement or hypothesis.
Planning a research design A market design is a master plan specifying the procedure for collecting and analysing the needed information. It represents a framework for the research action. The objectives of the study discussed in the previous step are included in research design to ensure that data collected is relevant to the objectives.
Sampling Sampling involves procedures that use a small number of items or parts of population to make conclusion regarding the whole population.
Collecting the data Data can be of two types either primary or secondary ,separate tools are used to collect data, these tools can be classified into two broad categories ,the observation method and the survey methods, surveys can be personal ,by mail, telephonic and by diary. Data analysing & processing Analyses represent the application of logic to the understanding of the data collected about the subject, it may be determination of consistent patterns & summarizing of appropriate details.
Formulating conclusion, preparing and presenting the report The final stage in the research process is that of interpreting the information and drawing conclusions for use in managerial decisions.
CONCEPT OF CLUSTER ANALYSIS
Cluster analysis is a major technique for classifying a ‘mountain’ of information intomanageable meaningful piles. It is a data reduction tool that creates subgroups that aremore manageable than individual datum. Like factor analysis, it examines the full complement
17

of inter-relationships between variables. Both cluster analysis and discriminant analysis are concerned with classifi cation. However, the latter requires prior knowledge of membership of each cluster in order to classify new cases. In cluster analysis there is no prior knowledge about which elements belong to which clusters. The grouping or clusters are defi ned through an analysis of the data. Subsequent multi-variate analyses can be performed on the clusters as groups.
WHY CLUSTER ANALYSIS
Clustering occurs in almost every aspect of daily life. A factory’s Health and SafetyCommittee may be regarded as a cluster of people. Supermarkets display items of similar nature, such as types of meat or vegetables in the same or nearby locations. Biologists haveto organize the different species of animals before a meaningful description of the differencesbetween animals is possible. In medicine, the clustering of symptoms and diseasesleads to taxonomies of illnesses. In the fi eld of business, clusters of consumer segments areoften sought for successful marketing strategies.Cluster analysis (CA) is an exploratory data analysis tool for organizing observed data (e.g. people, things, events, brands, companies) into meaningful taxonomies, groups, or clusters, based on combinations of IV’s, which maximizes the similarity of cases within each cluster while maximizing the dissimilarity between groups that are initially unknown.In this sense, CA creates new groupings without any preconceived notion of what clustersmay arise, whereas discriminant analysis classifi es people and items intoalready known groups. CA provides no explanation as to why the clusters exist nor is anyinterpretation made. Each cluster thus describes, in terms of the data collected, the class towhich its members belong. Items in each cluster are similar in some ways to each other anddissimilar to those in other clusters.
18

CLUSTERING PROCEDURES
Hierarchical Cluster Analysis This procedure attempts to identify relatively homogeneous groups of cases (or variables) based on selected characteristics, using an algorithm that starts with each case (or variable) in a separate cluster and combines clusters until only one is left. You can analyze raw variables or you can choose from a variety of standardizing transformations. Distance or similarity measures are generated by the Proximities procedure. Statistics are displayed at each stage to help you select the best solution. Statistics include agglomeration schedule, distance (or similarity) matrix, and cluster membership for a single solution or a range of solutions. Plots include dendrograms and icicle plots.
Agglomeration schedule. Displays the cases or clusters combined at each stage, the distances between the cases or clusters being combined, and the last cluster level at which a case (or variable) joined the cluster.
Proximity matrix. Gives the distances or similarities between items. Cluster Membership. Displays the cluster to which each case is assigned at one or
more stages in the combination of clusters. Available options are single solution and range of solutions.
Dendrograms can be used to assess the cohesiveness of the clusters formed and can provide information about the appropriate number of clusters to keep.
Icicle plots display information about how cases are combined into clusters at each iteration of the analysis. (User can specify a range of clusters to be displayed) Orientation allows you to select a vertical or horizontal plot.
Data. The variables can be quantitative, binary, or count data. Scaling of variables is an important issue--differences in scaling may affect your cluster solution(s). If your variables have large differences in scaling (for example, one variable is measured in dollars and the other is measured in years), you should consider standardizing them (this can be done automatically by the Hierarchical Cluster Analysis procedure).
Case Order. If tied distances or similarities exist in the input data or occur among updated clusters during joining, the resulting cluster solution may depend on the order of cases in the file. You may want to obtain several different solutions with cases sorted in different random orders to verify the stability of a given solution.
Assumptions. The distance or similarity measures used should be appropriate for the data analyzed. Also, you should include all relevant variables in your analysis.
19

Omission of influential variables can result in a misleading solution. Because hierarchical cluster analysis is an exploratory method, results should be treated as tentative until they are confirmed with an independent sample.
Measures for Interval DataThe following dissimilarity measures are available for interval data:
Euclidean distance. The square root of the sum of the squared differences between values for the items. This is the default for interval data.The squared Euclidean measure should be used when the CENTROID, MEDIAN, or WARD cluster method is requested.
Squared Euclidean distance. The sum of the squared differences between the values for the items.
Pearson correlation. The product-moment correlation between two vectors of values.
Cosine. The cosine of the angle between two vectors of values. Chebychev. The maximum absolute difference between the values for the items. Block. The sum of the absolute differences between the values of the item. Also
known as Manhattan distance. Minkowski. The pth root of the sum of the absolute differences to the pth power
between the values for the items. Customized. The rth root of the sum of the absolute differences to the pth power
between the values for the items.
Transform ValuesThe following alternatives are available for transforming values:
Z scores. Values are standardized to z scores, with a mean of 0 and a standard deviation of 1.
Range -1 to 1. Each value for the item being standardized is divided by the range of the values.
Range 0 to 1. The procedure subtracts the minimum value from each item being standardized and then divides by the range.
Maximum magnitude of 1. The procedure divides each value for the item being standardized by the maximum of the values.
Mean of 1. The procedure divides each value for the item being standardized by the mean of the values.
Standard deviation of 1. The procedure divides each value for the variable or case being standardized by the standard deviation of the values.
20

Additionally, you can choose how standardization is done. Alternatives are By variable or By case.
K-Means Cluster Analysis This procedure attempts to identify relatively homogeneous groups of cases based on selected characteristics, using an algorithm that can handle large numbers of cases. However, the algorithm requires you to specify the number of clusters. You can specify initial cluster centers if you know this information. You can select one of two methods for classifying cases, either updating cluster centers iteratively or classifying only. You can save cluster membership, distance information, and final cluster centers. Optionally, you can specify a variable whose values are used to label casewise output. You can also request analysis of variance F statistics. While these statistics are opportunistic (the procedure tries to form groups that do differ), the relative size of the statistics provides information about each variable's contribution to the separation of the groups.
Statistics. Complete solution: initial cluster centers, ANOVA table. Each case: cluster information, distance from cluster center.
Assumptions. Distances are computed using simple Euclidean distance. If you want to use another distance or similarity measure, use the Hierarchical Cluster Analysis procedure. Scaling of variables is an important consideration--if your variables are measured on different scales (for example, one variable is expressed in dollars and another is expressed in years), your results may be misleading. In such cases, you should consider standardizing your variables before you perform the k-means cluster analysis (this can be done in the Descriptives procedure). The procedure assumes that you have selected the appropriate number of clusters and that you have included all relevant variables. If you have chosen an inappropriate number of clusters or omitted important variables, your results may be misleading.
Case and Initial Cluster Center Order. The default algorithm for choosing initial cluster centers is not invariant to case ordering. The Use running means option on the Iterate dialog box makes the resulting solution potentially dependent upon case order regardless of how initial cluster centers are chosen. If you are using either of these methods, you may want to obtain several different solutions with cases sorted in different random orders to verify the stability of a given solution. Specifying initial cluster centers and not using the Use running means option will avoid issues related to case order. However, ordering of the initial cluster centers may affect the solution, if
21

there are tied distances from cases to cluster centers. Comparing results from analyses with different permutations of the initial center values may be used to assess the stability of a given solution.
CHAPTER 322

THE RESEARCH METHODOLOGY
23

THE RESEARCH METHODOLOGY
A research design is a blue print prepared depending upon the different blueprints available for the collection, measurement and analysis of data. A research design calls for developing the most efficient plan of gathering the needed information. The design of research study is based on the purpose of study. A research design is the specification of methods and procedures for acquiring the information needed .It is overall operational pattern or framework of the project that stipulates what information is to be collected from which source by what procedures. 4.1 TYPES OF RESEARCH
Exploratory Research Descriptive Research
Exploratory study is generally based on secondary data ,it does not have formal and rigid design, as the researcher may have to change his focus or direction depending on availability of new ideas and relationship among variables.
Exploratory study generally uses a qualitative research design and following are the sources of data for it
Secondary data Focus Group Depth interview Projective techniques Observations
Descriptive study is used as direct bases for marketing decisions, they follow a rigid research design. Descriptive study uses quantitative research design. However the concerned research study was more or less exploratory but it has some part of descriptive study as well as it was desired to have some quantitative analysis as well to draw perceptual map of different retail brands, so in order to arrive at quantified results. These questions and relevant points were to be raised
What the study is about and why it is being made? What techniques of gathering data will be adopted? How much material will be needed? Where can be the required data can be found? Processing and analysing of the data.
24

Report the findings.
As descriptive information was needed, we required a quantitative research design, the choices for data collection were to be analyzed on different parameters before deciding on the final method of Data Collection, the available alternatives were
Observation Experimentation Surveys
As the study was more exploratory then descriptive, the requirement of primary data was low but still in order to arrive at accurate results a small survey was conducted to look into the insight of the customers, the next task was decide upon the nature of the sample chosen and size of the sample, again we had option to go for “Probability Sampling” which includes
Sample Random Sampling. Systematic Sampling Stratified Sampling Cluster and area Sampling Sequential sampling Multi Stage Sampling
On the other hand we had the option of “Non Probability Sampling” which includes Convenience Sampling Quota Sampling Judgment Sampling Panel Sampling
The sampling design most suitable to us was stratified sampling under this the selection of the sample is random and stratified into groups of 6-10 clients as per account managers assigned to it.The population under study was homogenous it had no effect on what sample was chosen so questionnaires were sent to the respondents through email as well as were direct response from respondents were also sought. The structured research design was made, in order to seek qualitative data. However the source of data were mainly
Visiting Client’s company Interactions with customers
25

RESEARCH METHODOLOGY ADOPTED
As discussed above the project had both the elements of exploratory as well as the descriptive part but in order to be precise
Sampling Unit : Existing Clients 26

Sample size : The Sample size is 41.
Sampling Method : Survey is conducted among EMBEE clients of Pune region.
Geographic Area Covered : Pune, Maharaashtra
Research Instrument : Structured questionnaire.
SOURCES OF DATA
Primary Source : Structured Questionnaire, Interviews
Secondary Sources : Interactions with customers
CHAPTER 4
27

AN ANALYSIS OF THE FIELD SURVEY
CONCLUSIONS
28

AN ANALYSIS OF THE FIELD SURVEY
From the field survey it has been observed that:
Most of the clients are satisfied and happy with the after sales service being offered by embee also happy with the softwares and hardwares they are using.It has also been found that major no of companies are unaware of the services offered by embee they are confined with what they are using, regarding alliances most of the companies are aware of most of the alliances very few knew about “PGP”.
Moreover many companies are willingly ready to recommend to others except few and many of them do require principal engagement.
Those who are unhappy are so on the grounds of:
I. Delay in delieveryII. Communication gap i.e
client respective a/c manager technical teamwhich is long as per them.
III. At times pricing being highIV. Alternate no. should be given if unable to reach the concerned person.V. Improve managing skills
VI. Improve technical teamVII. Weak Response
VIII. Unavailability of variety of softwares.
Positive things been told for embee:
I. Prompt ResponseII. Good customer Relationship Management
III. Understands Needs WellIV. Good in support & services
29

V. Technical expertise being goodVI. Proffesionalism
VII. Cooperative
CONCLUSIONS
30

As it has been observed that customers are dissatisfied on the grounds of non-availaibility of softwares due to which they switch between IT solution providers. Moreover as in the case of few account managers response and proffessinalism ibeing an issue so that has to be taken care for retaining the customer for longer period of time.
Account managers who has got a good hold of their clients must continue with the same performance as unavailability of variety of software problem may help to overcome if such a strong bonding is made.
Embee has done a lot and is doing very well in the IT sector but few things which it has to keep in mind is support and service should not be hampered and a quick feedback must be reached to its clients for any querry been made from their side.
CHAPTER 5
31

SUMMARY
32

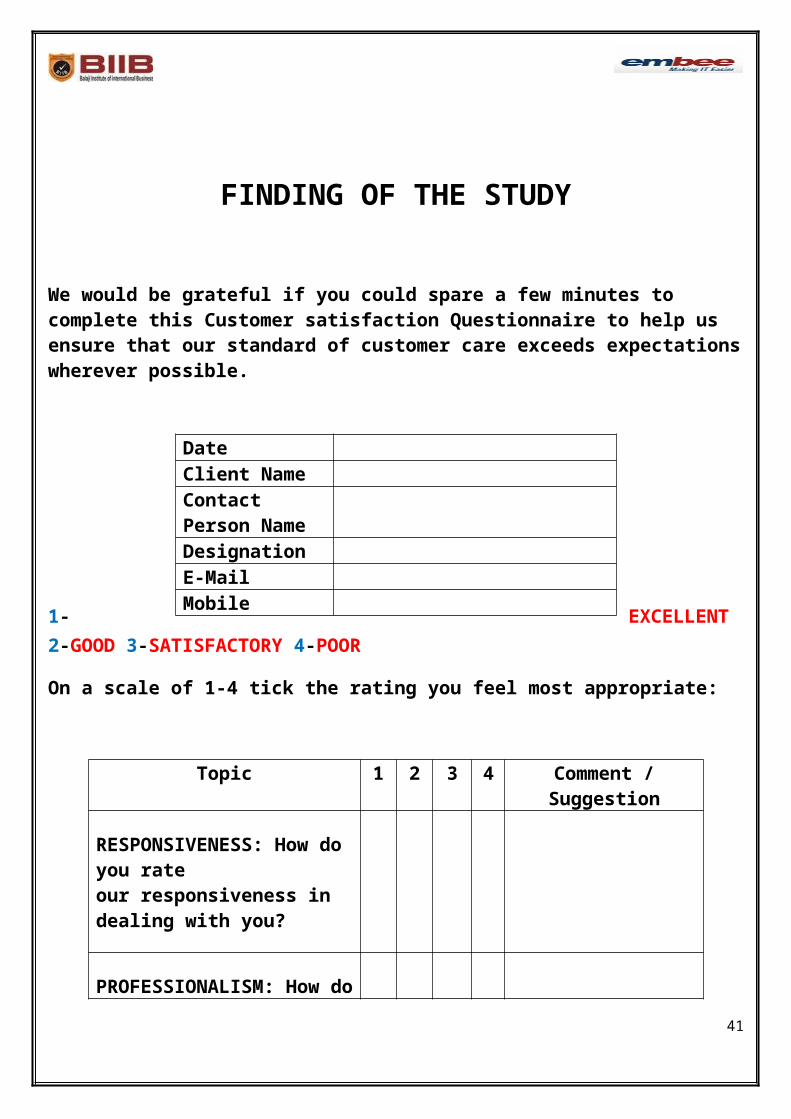
FINDING OF THE STUDY
We would be grateful if you could spare a few minutes to complete this Customer satisfaction Questionnaire to help us ensure that our standard of customer care exceeds expectations wherever possible.
1- EXCELLENT 2-GOOD 3-SATISFACTORY 4-POOR
On a scale of 1-4 tick the rating you feel most appropriate:
Topic 1 2 3 4 Comment / Suggestion
RESPONSIVENESS: How do you rateour responsiveness in dealing with you?
PROFESSIONALISM: How do you rateour professionalism in dealing with you?
TECHNICAL SUPPORT: If you received
33
DateClient NameContact Person NameDesignationE-MailMobile

any technical support, how do you ratethe technical competence of ourengineers and their response time?
PRODUCT QUALITY: How do you rateour products and services and did theymeet your needs and expectationsregarding quality and performance?
How would you Rate embee?
How thoroughly do you believe weunderstand your business and are able toadd value to you?
What do you like about Embee as a IT solution provider andhow we add value to yourbusiness?
What do you dislike about Embee?
What are the majorFactors influencing your decision while finalising the IT solution provider?(Tick those which you consider)
Size of business /location
Tech. certification of individual
Market reference
34

Cert. of particular solution. Of company
rates
Others:
What could you buy from us but choose tobuy from a different supplier? What are thefactors influencing your decision?
What would we need to do to satisfy yourrequirements even more?
Do you measure our performance internally?
Yes No
What all Solution offerings by Embee are you aware of?
Solution Details Y N Remark & Adoption plan
Domain Setup & Migration
Enterprise Mail, Messaging & Collaboration
Server Consolidation & 35

Virtualisation
Enterprise IT Security
Application Development
Enterprise Portal & DocumentManagement
Unified Communication Solutions
Data Centre Setup & consolidation
Business continuity & availability
Business Intelligence
Cloud Infrastructure solutions & Offerings
Desktop & Application Virtualisation
ERP & CRM Solutions
What all Embee Alliances are you aware of?
Alliance Details Y N
Microsoft – Large Account ResellerADOBE – PLATINUM PARTNER
36

SYMANTEC – GOLD PARTNER
MCAFEE – SMB PARTNER
SONICWALL- MEDALLION PARTNER
FORTINET – PARTNER
ARRAY NETWORKS – PREMIUM PARTNER
EMC – CERTIFIED AFILLIATE PARTNER
TRENDMICRO – AFFINITY PLUS PARTNER
CA ARCSERVE – REGISTERED SILVER PARTNER
PGP- GOLD PARTNER
VMWARE – ENTERPRISE PARTNER
ORACLE - PARTNER
SAP – B1 PARTNERS
DRUVA – PREMIUM PARTNER
CISCO – PREMIER
37

CERTIFIED PARTNER, SILVER PARTNER.
CITRIX – SILVER SOLUTION ADVISOR
EMERSON – NETWORK SOLUTIONSPARTNERManage Engine - Partner
IT Roadmap for the Year 12-13 : _________________________________________________________________________________ ____________________________________________________________________________________________________________________________________________________________________________________________________________________________________________________________________________________________________________________________________
In the next 3-5 years how do you expect your business to change? How will we have to respond for you to remain a customer and grow our business together and what do we need to do to support you in this process?_______________________________________________________________________________________________________________________________________________________________________________________________________________________________________________________________________________________________________________________________________________________________________________________________________________________________________________________________________________________________________________________________________________________________________________________
38

Reference if Any : ___________________________________________________________________________________________________________________________________________________________________________________________________________________________________________________
Would you recommend embee to others? Yes No Would you be prepared to provide a testimonial for use in our marketing? Yes No
Client Signature: ................................ Date: ...........................................
From the above questionnaire it has been found that there are two clusters Cluster 1 favoring Technical Support and Product quality where as Cluster 2 favoring Responsiveness and Professionalism.
Cluster MembershipCase Number company_name
Cluster
Distance
1 Neilsoft 2 1.4672 Talentica 2 1.0363 UL Electrodevices Pvt. Ltd. 2 1.0364 Naik Navare Developers 2 1.4135 AND Data 2 1.3296 The Alcheimist Ark 2 1.0367 Ubisoft 2 1.4138 Exfo Electro Optical Engg. 1 1.007
39

9 Horiba India 1 .90210 Opus Software Solutions 1 1.46511 Netcheck India 1 .82512 Zilla Parishad 2 1.10813 CINS 1 1.44214 TATA INTERNATIONAL DLT PVT. LTD. 1 .58915 HSBC Software development pvt.ltd 2 2.88216 Lombardini India Pvt Ltd 1 .82517 CNC Servicing and Solutions Pvt Ltd 2 1.41318 Upside learning Solutions Pvt Ltd 1 1.16019 Searce 2 1.03620 Avaya India Pvt Ltd 2 2.28621 Esbee Industrial Combines 2 1.41322 Bodhi Global 1 1.44223 Sterlite 2 1.46724 Rushabh Investments Pvt Ltd 2 1.03625 RATILAL BHAGWANDAS
CONSTRUCTION COMPANY2 1.467
26 Johnson Controls India (P) Ltd 2 2.36927 UB Engineering pvt.ltd 1 .58928 Sona Alloys 1 .58929 Vulcan Exports 2 1.03630 Amphenol Interconnect 2 1.20831 John Deere 2 1.41332 Sai Prasad Foods 1 1.24433 Kuka Automation 2 .38834 Crest Pre Media Pvt. Ltd 1 1.95335 Radhey Machinery Ltd. 2 1.27036 Patni 2 1.10837 Hyundai Construction 2 1.10838 Uniken 1 1.10239 Whirlpool of india 2 1.10840 Enzigma Software 2 .38841 Tibco Software 1 .589
40
Final Cluster CentersCluster
1 2responsiveness
1.67 1.69
proffesionalism
1.39 1.77
technical_support
2.40 .96
product_quality
2.27 .96
It has also been found that the clients gave the greater importance to: Product quality it is this regarding which they are the most concerned of. This result has been made on the basis of frequency.
imp_of_responsnss
ValidFrequenc
yPercen
tValid
PercentCumulative Percent
great importance
12 29.3 29.3 29.3
important 20 48.8 48.8 78.0not much important
9 22.0 22.0 100.0
Total 41 100.0 100.0
41

imp_of_professnlsm
ValidFrequenc
yPercen
tValid
PercentCumulative Percent
great importance
17 41.5 41.5 41.5
important 16 39.0 39.0 80.5not much important
8 19.5 19.5 100.0
Total 41 100.0 100.0
imp_of_techcl_spprt
ValidFrequenc
yPercen
tValid
PercentCumulative Percent
great importance
17 41.5 41.5 41.5
important 18 43.9 43.9 85.4not much important
5 12.2 12.2 97.6
not important 1 2.4 2.4 100.0Total 41 100.0 100.0
42

imp_of_prdt_qlty
ValidFrequenc
yPercen
tValid
PercentCumulative Percent
great importance
20 48.8 48.8 48.8
important 18 43.9 43.9 92.7not much important
3 7.3 7.3 100.0
Total 41 100.0 100.0
When it came to overall rating embee 63.4% said good 26.8% excellent and 9.8% satisfactory
rate_embee
ValidFrequenc
yPercen
tValid
PercentCumulative Percent
excellent 11 26.8 26.8 26.8good 26 63.4 63.4 90.2satisfactory
4 9.8 9.8 100.0
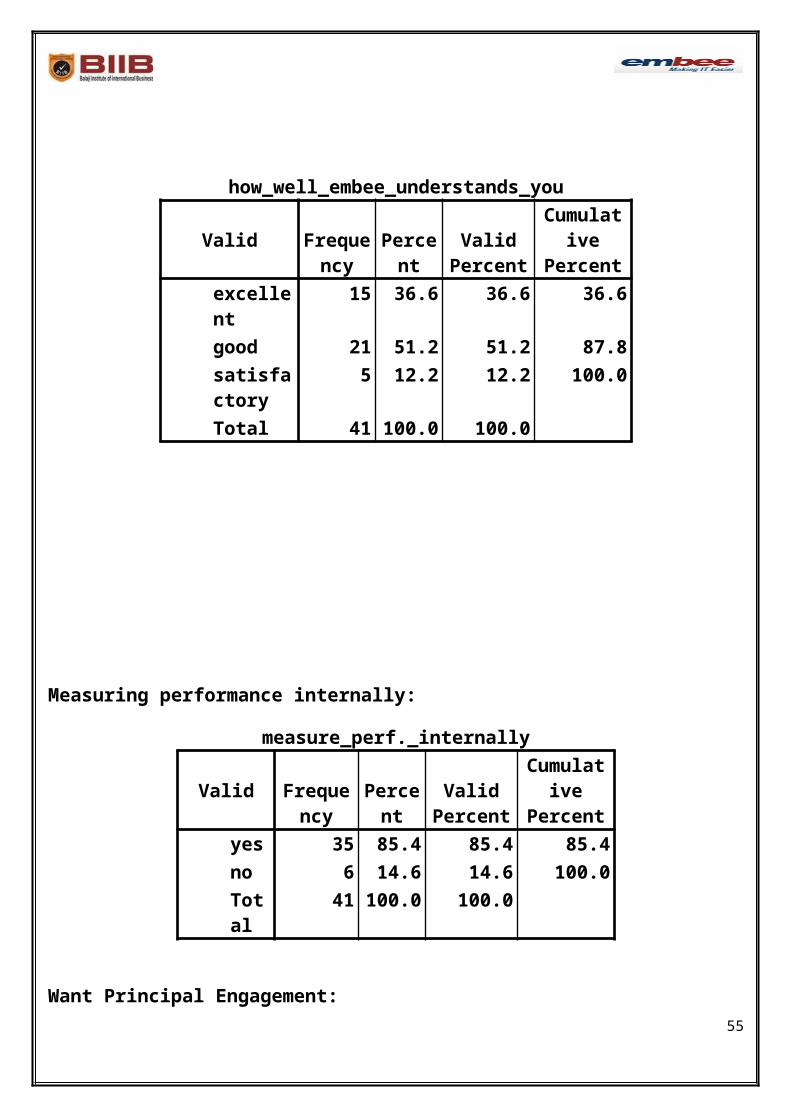
Total 41 100.0 100.0When it came to how well embee understands your business it hs been found:
43

how_well_embee_understands_you
ValidFrequen
cyPercen
tValid
PercentCumulative Percent
excellent 15 36.6 36.6 36.6good 21 51.2 51.2 87.8satisfactory
5 12.2 12.2 100.0
Total 41 100.0 100.0
Measuring performance internally:
measure_perf._internally
ValidFrequenc
yPercen
tValid
PercentCumulative Percent
yes 35 85.4 85.4 85.4no 6 14.6 14.6 100.0Total
41 100.0 100.0
Want Principal Engagement:
want_principal_engagement
ValidFrequen
cyPercen
tValid
PercentCumulative Percent
yes 31 75.6 75.6 75.6no 10 24.4 24.4 100.0Total
41 100.0 100.0
44

Recommend Embee to others: 97% said yes
recommend_embee
ValidFrequen
cyPercen
tValid
PercentCumulative Percent
yes 40 97.6 97.6 97.6no 1 2.4 2.4 100.0Total
41 100.0 100.0
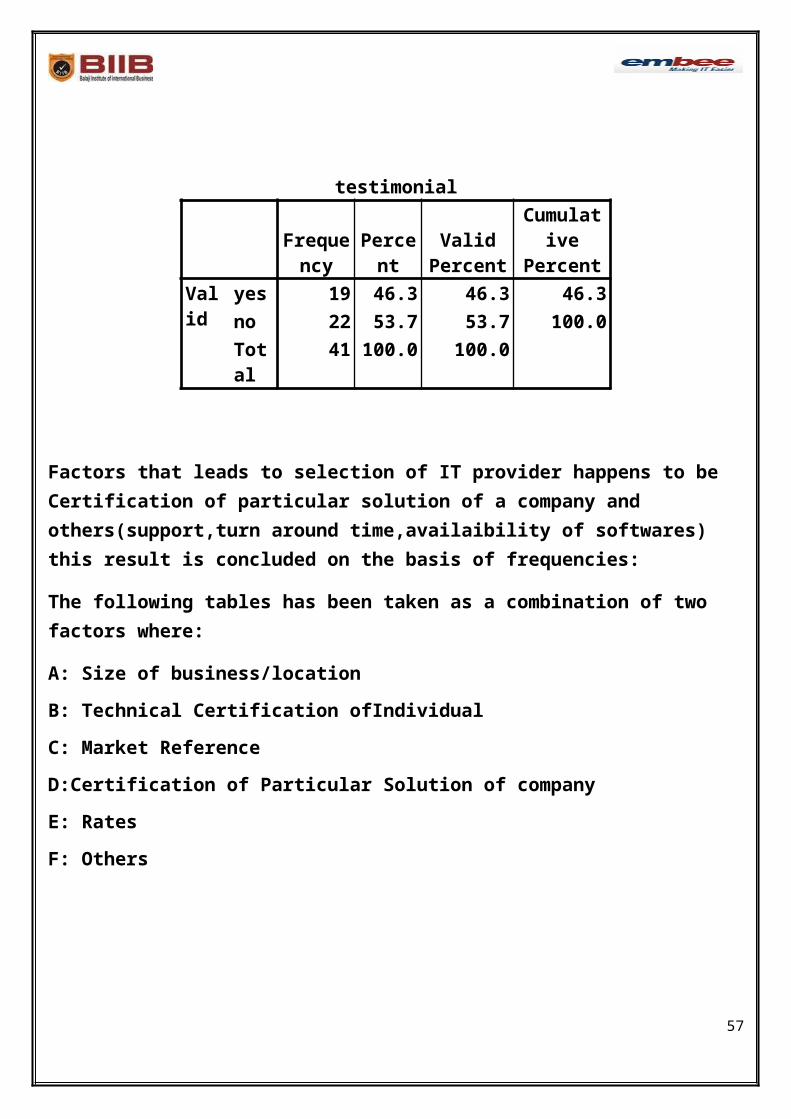
Willing to provide Testimonial: 46.3% said yes
testimonialFrequen
cyPercen
tValid
PercentCumulative Percent
Valid
yes 19 46.3 46.3 46.3no 22 53.7 53.7 100.0Total
41 100.0 100.0
Factors that leads to selection of IT provider happens to be Certification of particular solution of a company and others(support,turn around time,availaibility of softwares) this result is concluded on the basis of frequencies:
The following tables has been taken as a combination of two factors where:
A: Size of business/location
B: Technical Certification ofIndividual
C: Market Reference
45

D:Certification of Particular Solution of company
E: Rates
F: Others
recode_a_b
Frequency Percent Valid Percent
Cumulative
Percent
Valid yes 12 29.3 29.3 29.3
no 29 70.7 70.7 100.0
Total 41 100.0 100.0
recode_a_c
Frequency Percent Valid Percent
Cumulative
Percent
Valid yes 16 39.0 39.0 39.0
no 25 61.0 61.0 100.0
Total 41 100.0 100.0
recode_a_d
Frequency Percent Valid Percent
Cumulative
Percent
Valid yes 11 26.8 26.8 26.8
no 30 73.2 73.2 100.0
Total 41 100.0 100.0
recode_a_e
Frequency Percent Valid Percent
Cumulative
Percent
Valid yes 17 41.5 41.5 41.5
no 24 58.5 58.5 100.0
Total 41 100.0 100.0
46

recode_a_f
Frequency Percent Valid Percent
Cumulative
Percent
Valid yes 15 36.6 36.6 36.6
no 26 63.4 63.4 100.0
Total 41 100.0 100.0
recode_b_c
Frequency Percent Valid Percent
Cumulative
Percent
Valid yes 16 39.0 39.0 39.0
no 25 61.0 61.0 100.0
Total 41 100.0 100.0
recode_b_d
Frequency Percent Valid Percent
Cumulative
Percent
Valid yes 18 43.9 43.9 43.9
no 23 56.1 56.1 100.0
Total 41 100.0 100.0
recode_b_e
Frequency Percent Valid Percent
Cumulative
Percent
Valid yes 22 53.7 53.7 53.7
no 19 46.3 46.3 100.0
Total 41 100.0 100.0
47

recode_b_f
Frequency Percent Valid Percent
Cumulative
Percent
Valid yes 15 36.6 36.6 36.6
no 26 63.4 63.4 100.0
Total 41 100.0 100.0
recode_c_d
Frequency Percent Valid Percent
Cumulative
Percent
Valid yes 16 39.0 39.0 39.0
no 25 61.0 61.0 100.0
Total 41 100.0 100.0
recode_c_e
Frequency Percent Valid Percent
Cumulative
Percent
Valid yes 21 51.2 51.2 51.2
no 20 48.8 48.8 100.0
Total 41 100.0 100.0
recode_c_f
Frequency Percent Valid Percent
Cumulative
Percent
Valid yes 14 34.1 34.1 34.1
no 27 65.9 65.9 100.0
Total 41 100.0 100.0
48

recode_d_e
Frequency Percent Valid Percent
Cumulative
Percent
Valid yes 18 43.9 43.9 43.9
no 23 56.1 56.1 100.0
Total 41 100.0 100.0
recode_d_f
Frequency Percent Valid Percent
Cumulative
Percent
Valid yes 13 31.7 31.7 31.7
no 28 68.3 68.3 100.0
Total 41 100.0 100.0
recode_e_f
Frequency Percent Valid Percent
Cumulative
Percent
Valid yes 23 56.1 56.1 56.1
no 18 43.9 43.9 100.0
Total 41 100.0 100.0
The factor most responsible for switching between IT solution provider is: Pricing
The following tables shows the percentage of each factor involved
factors_influencing_switch_pricing
ValidFrequenc
yPercen
tValid
PercentCumulative Percent
prime factor 39 95.1 95.1 95.1not a prime factor 2 4.9 4.9 100.0Total 41 100.0 100.0
49

factors_influencing_switch_authenticity
ValidFrequenc
yPercen
tValid
PercentCumulative Percent
prime factor 23 56.1 56.1 56.1not a prime factor 18 43.9 43.9 100.0Total 41 100.0 100.0
factors_influencing_switch_reference
ValidFrequenc
yPercen
tValid
PercentCumulative Percent
prime factor 20 48.8 48.8 48.8not a prime factor 21 51.2 51.2 100.0Total 41 100.0 100.0
factors_influencing_switch_mkt_share
ValidFrequenc
yPercen
tValid
PercentCumulative Percent
prime factor 26 63.4 63.4 63.4not a prime factor 15 36.6 36.6 100.0Total 41 100.0 100.0
50

factors_influencing_switch_others
ValidFrequenc
yPercen
tValid
PercentCumulative Percent
prime factor 15 36.6 36.6 36.6not a prime factor 26 63.4 63.4 100.0Total 41 100.0 100.0
51

CHAPTER 6
APPENDIX
BIBLIOGRAPHY
52

APPENDIX
We would be grateful if you could spare a few minutes to complete this Customer satisfaction Questionnaire to help us ensure that our standard of customer care exceeds expectations wherever possible.
On a scale of 1-4 tick the rating you feel most appropriate:
1-EXCELLENT 2-GOOD 3-SATISFACTORY 4-POOR
Topic 1 2 3 4 Comment / Suggestion
RESPONSIVENESS: How do you rateour responsiveness in dealing with you?
PROFESSIONALISM: How do you rateour professionalism in dealing with you?
TECHNICAL SUPPORT: If you receivedany technical support, how do you ratethe technical competence of our
53
DateClient NameContact Person NameDesignationE-MailMobile

engineers and their response time?
PRODUCT QUALITY: How do you rateour products and services and did theymeet your needs and expectationsregarding quality and performance?
How would you Rate embee?
How thoroughly do you believe weunderstand your business and are able toadd value to you?
What do you like about Embee as a IT solution provider andhow we add value to yourbusiness?
What do you dislike about Embee?
What are the majorFactors influencing your decision while finalising the IT solution provider?(Tick those which you consider)
Size of business /location
Tech. certification of individual
Market reference
Cert. of particular
rates
54
solution. Of company
Others:
What could you buy from us but choose tobuy from a different supplier? What are thefactors influencing your decision?
What would we need to do to satisfy yourrequirements even more?
Do you measure our performance internally?
Yes No
What all Solution offerings by Embee are you aware of?
Solution Details Y N Remark & Adoption plan
Domain Setup & Migration
Enterprise Mail, Messaging &
55

Collaboration
Server Consolidation & Virtualisation
Enterprise IT Security
Application Development
Enterprise Portal & DocumentManagement
Unified Communication Solutions
Data Centre Setup & consolidation
Business continuity & availability
Business Intelligence
Cloud Infrastructure solutions & Offerings
Desktop & Application Virtualisation
ERP & CRM Solutions
What all Embee Alliances are you aware of?
Alliance Details Y N
Microsoft – Large Account 56
ResellerADOBE – PLATINUM PARTNER
SYMANTEC – GOLD PARTNER
MCAFEE – SMB PARTNER
SONICWALL- MEDALLION PARTNER
FORTINET – PARTNER
ARRAY NETWORKS – PREMIUM PARTNER
EMC – CERTIFIED AFILLIATE PARTNER
TRENDMICRO – AFFINITY PLUS PARTNER
CA ARCSERVE – REGISTERED SILVER PARTNER
PGP- GOLD PARTNER
VMWARE – ENTERPRISE PARTNER
ORACLE - PARTNER
SAP – B1 PARTNERS
DRUVA – PREMIUM
57

PARTNER
CISCO – PREMIER CERTIFIED PARTNER, SILVER PARTNER.
CITRIX – SILVER SOLUTION ADVISOR
EMERSON – NETWORK SOLUTIONSPARTNERManage Engine - Partner
IT Roadmap for the Year 12-13 : _________________________________________________________________________________ ____________________________________________________________________________________________________________________________________________________________________________________________________________________________________________________________________________________________________________________________________
58

In the next 3-5 years how do you expect your business to change? How will we have to respond for you to remain a customer and grow our business together and what do we need to do to support you in this process?_______________________________________________________________________________________________________________________________________________________________________________________________________________________________________________________________________________________________________________________________________________________________________________________________________________________________________________________________________________________________________________________________________________________________________________________
Reference if Any : ___________________________________________________________________________________________________________________________________________________________________________________________________________________________________________________
Would you recommend embee to others? Yes No Would you be prepared to provide a testimonial for use in our marketing? Yes No
Client Signature: ................................ Date: ...........................................
59

BIBLIOGRAPHY
Kothari, C.R., Research Methodology, New Delhi, New Age International (P) Ltd. Publishers,2008
Malhotra, N.K, Marketing Research, New Delhi, Pearson Prentice Hall,2010
Project Report writing, Pune, Sri Balaji Society,2010
60