Embedding Data Visualization In OEM and Saas Apps
20
Embedding Data Visualization in Your Apps Boney Pandya Marketing Manager Greg Harris Systems Engineer Follow us @Jinfonet
-
Upload
mia-yuan-cao -
Category
Technology
-
view
72 -
download
2
Transcript of Embedding Data Visualization In OEM and Saas Apps

Embedding Data Visualization in Your Apps
Boney PandyaMarketing Manager
Greg HarrisSystems Engineer
Follow us @Jinfonet

2
High Performance and ScalableIntelligent push-down technologyIn-memory cubesServer Clustering
Self-ServiceSo easy anyone can useInteractive charts, controls, widgets
FlexibleAny data source: from RDB to Big Data and CloudDeliver anywhere: from PC to mobileCustomizable and embeddable
Advanced, Embedded Data Visualization Platform:
JReport Highlights

Simplify the Complexity of Reporting
and Visualization
Our Mission
3

4
Ease of Embedding
Complex Systems
Simplistic Solutions
Embeddable Power
Legacy Tools
Perf
orm
an
ce a
nd
Featu
res
Traditional BI
Open Source
JReport
Market Positioning

Latest Release: JReport 12
5
• Visual Analysis
– Drag and drop visualization
– HTML5 based
– Powered by in-memory cubes
• JDashboard enhancements
• JReport Mobile enhancements
• Cloud and Big Data support
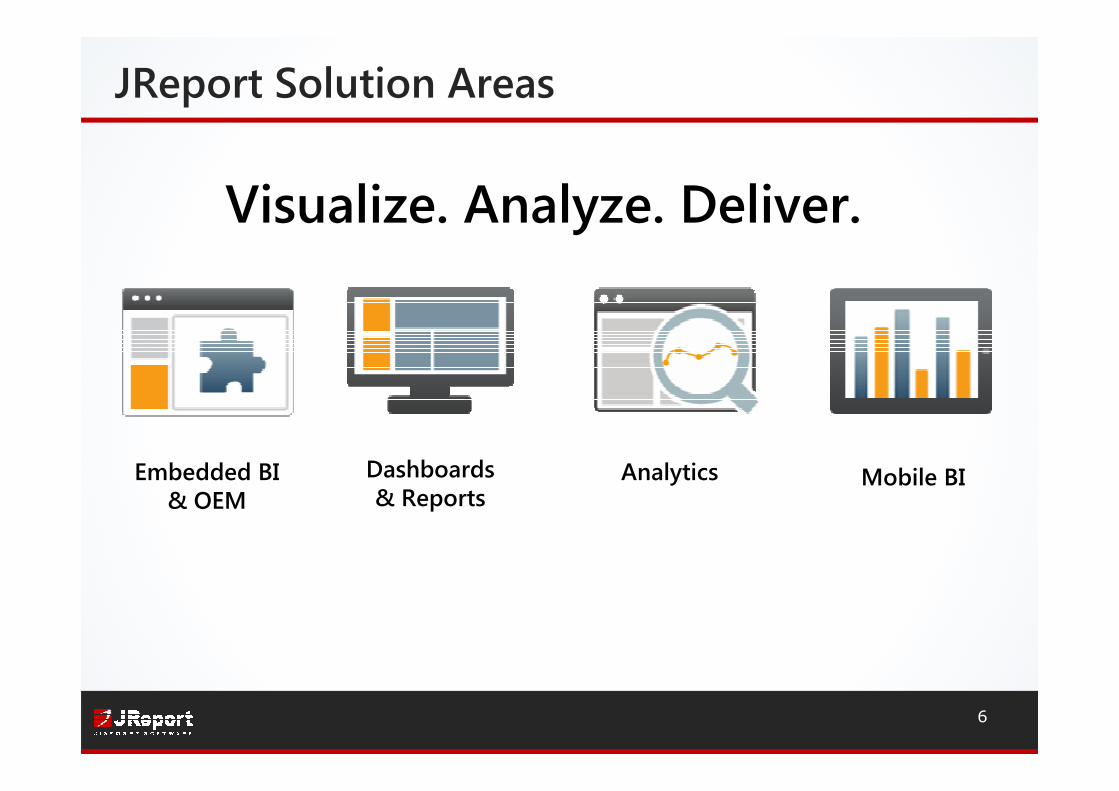
JReport Solution Areas
Embedded BI& OEM
Dashboards& Reports
Analytics Mobile BI
Visualize. Analyze. Deliver.
6

7
OEMCustomers that embed JReport into their productsTypically hosted “on-premise”
Software as a Service (SaaS)Typically hosted in the cloudBrowser-based access for internal or external usersVariety of licensing models for subscribers
JReport works with all deployment types.
OEM and SaaS

ACME
Financials
Company News
BI Platform
– Security, administrative features
– Customizable look and feel
Metadata Management
– Organize/publish/search of:
dimensions, hierarchies, measures,
formula, components, reports into catalogs
Development Tools
– IDE to build components, reports,
dashboards
– API for application embedding
8
Embedded Solution

Ad Hoc Reporting
• Flexible data sources
• Sort, filter, link to reports,drill into details, expand/collapse groups
• Themes, profiles, print layouts
• Security and Governance
• 1-click data interaction
Ad Hoc Analysis
• Visual Analysis
• Quickly change data views
• Powered by in-memory cubes
9
Self Service

10
• Big Data – large, complex sets of data
– Genomics data, traffic data, social media data
• NoSQL databases – non-relational, distributed, open-source and horizontally scalable
– MapReduce – parallel processing using Master-Worker nodes
– MongoDB
– Apache Hive
• How do you make any sense of this? � Visualization
Big Data and Visualization

11
• Visualization turns massive amounts of unstructured data into something you can understand
– Interactive reports, dashboards, visual analysis, mobile
• But… traditional relational data visualization and analytics simply are not sufficient for all Big Data cases.
Data Visualization

− Easily drag/drop from library
− Reuse reports, components, analytics
− 3rd party widgets e.g. Google Maps
− Sort, filter, drill, pivot, slice-n-dice, parameters, export
− Synchronized refresh
− HTML5
12
JDashboard: Interactive Visualization

13
Drill on ChartLink Report Customize Parameters
Conditional Formatting On-Screen Filters Interaction among components
Interactive Data Exploration

Choose from a Wide Variety of Chart Types & Styles
14
Advanced Visualization

Motion Charts
Scrollable Charts
Real-time Charts
15
Live Charts

Sophisticated Reporting
− Page/Web reports, wide array of styles, pixel-perfect capable, reusable components, parameters
Scalable Delivery
− High volume on-demand and scheduled reports
Anytime, Anywhere
− Access reports and dashboards on Web and mobile devices
− Deliver in any format: Web, PDF, Excel, email, fax, FTP, …
− Retain real chart data in Excel
16
Web Delivery

Visualization, Anywhere
− Browser and native iOS implementation
− Support mobile device gestures
− Scrollable component navigation
− Convertible chart types
− Rich interactions: filter, sort, drill, pivot
− Free from the Apple App Store
17
JReport Mobile

Demo: What You’ll See
18
1. Build in-memory cube
2. Embedded Capabilities
3. Ad Hoc Reporting
4. JDashboard
5. Visual Analysis

GovernmentISV/OEMHealthcare / Healthcare Insurance
TelecomConsumer /
ManufacturingFinancial Services
Global Customer Base
19

20
• Look for our follow-up email
� Exclusive JReport 12 Trial
� Free Proof of Concept
� Whitepaper: Top 10 Ways to Visualize Data
• Daily Live Demos
Every weekday at 2 PM EDT
• For more info, visit: www.jinfonet.comE-mail: [email protected], [email protected]
Phone: (240) 477-1000
@Jinfonet
Next Steps