Embedded Sensors to Monitor Production of …elib.suub.uni-bremen.de/edocs/00105908-1.pdf ·...
120
Cumulative Dissertation Maryam Kahali Moghaddam Embedded Sensors to Monitor Production of Composites: From Infusion to Curing of Resin BREMEN UNIVERSITY INSTITUTE FOR MICROSENSORS, -ACTUATORS AND – SYSTEMS MARCH 2017
Transcript of Embedded Sensors to Monitor Production of …elib.suub.uni-bremen.de/edocs/00105908-1.pdf ·...

Cumulative Dissertation
Maryam Kahali Moghaddam
Embedded Sensors to Monitor Production of
Composites: From Infusion to Curing of Resin
BREMEN UNIVERSITY
INSTITUTE FOR MICROSENSORS, -ACTUATORS AND –SYSTEMS MARCH 2017

Embedded Sensors to Monitor Production of
Composites: From Infusion to Curing of Resin
A cumulative dissertation submitted to the department of physics and electrical engineering
and the committee of graduate studies from the University of Bremen as partial fulfilment of
the requirements for the degree of
Doctor- Engineer (Dr.-Ing.)
Maryam Kahali Moghaddam
from Iran
First advisor: Prof. Dr.-Ing. Walter Lang
Second advisor: Prof. Dr.-Ing. Axel Gräser
Submitted on: 14.03.2017
Day of defence: 17.05.2017


v
This thesis is dedicated to my unique
and awesome husband Ahmed.


vii
Acknowledgement
I would like to express my gratitude to my supervisor, Prof. Walter Lang for giving me a chance
to do a PhD at IMSAS. This has been the opportunity to learn micro-technology and its
implementation to benefit the science and society. I thank him for his helpful support and for
all the experiences I have got during my research work.
Special thanks go to Mariugenia Salas and Andreas Schander for countless hours of technical
discussions and supports, without them I would not be able to finish the project.
I would like to thank Alexandra Chaloupka for technical support for characterizing the sensors.
Thanks to Michael Koerdt for providing resins and fibres as well as some characterization of
plasticized resin.
My sincere thanks also go to Christian Brauner for his comments on my dissertation, which has
elaborated the value of the presented work and for his support during the time he worked in
FIBRE Bremen.
I also would like to thank Dmitriy Boll, Martina Hübner, Daniel Gräbner, Gerrit Dumstorff,
Mahmuda Akhtar, Ursula Ziebarth, Jan Hellmann, Ralf Höper and all the technicians of IMSAS
for their support during my research.
Finally and most importantly, I would like to thank my family and my husband Ahmed for
supporting and encouraging me. I am not sure whether I could be able to express my deepest
thanks to Ahmed for his patience, interest, backup and helps. Thanks for being patient all the
weekends that I spent my time in my office. Thanks for being supportive emotionally when
nothing worked in my project as theoretically expected.
Maryam Kahali Moghaddam, 9th March 2017, Bremen.


ix
Table of Contents
1 Introduction ...................................................................................................................... 21
1.1. What are fibre composites? ....................................................................................... 23
1.2. What are fibres? ......................................................................................................... 24
1.3. What are different resins? .......................................................................................... 25
1.4. Thermoset resins .................................................................................................... 26
1.4.1. Polyester resin .................................................................................................... 27
1.4.2. Vinyl ester resins ................................................................................................ 28
1.4.3. Epoxy resins ....................................................................................................... 28
1.4.4. Other resin used in composites ........................................................................... 29
1.5. Cure Kinetic ............................................................................................................... 30
1.6. Thermoplastics........................................................................................................... 31
1.7. What are different fibre composite manufacturing methods? ................................... 31
1.7.1. Hand lay-up ........................................................................................................ 31
1.7.2. Resin Infusion (RI) ............................................................................................. 32
1.7.3. Prepregs .............................................................................................................. 32
1.7.4. Resin Transfer Molding (RTM) ......................................................................... 33
1.7.5. Vacuum Assisted Resin Transfer Molding (VARTM) ...................................... 34
1.7.6. Pultrusion ........................................................................................................... 34
1.7.7. Autoclave ........................................................................................................... 35
1.7.8. Resin Film Infusion (RFI) .................................................................................. 36
1.8. Which are models used commonly for modeling the resin flow? ............................. 37
1.9. Darcy’s law ................................................................................................................ 38
1.10. What are the common methods to monitor the curing of resin? ............................ 40
1.10.1. Differential Scanning Calorimetry (DSC) ...................................................... 41
1.10.2. Dielectric Analysis (DEA).............................................................................. 41

Table of Contents
x
1.11. Testing and inspection of composite product ........................................................ 44
2 Resin front detection ........................................................................................................ 49
2.1. Ultrasound ................................................................................................................. 49
2.2. Camera ....................................................................................................................... 50
2.3. Thermocouples .......................................................................................................... 51
2.4. Optical fibre ............................................................................................................... 52
2.5. Pressure sensor .......................................................................................................... 53
2.6. Capacitive pressure sensor ......................................................................................... 53
2.7. Specification of piezoresistive pressure sensors ........................................................ 58
2.8. Embedding piezoresistive pressure sensors in FRP .................................................. 61
2.9. Interconnection techniques ........................................................................................ 63
2.10. Wire bonding on pyralux ....................................................................................... 65
2.11. Wire bonding on Kapton ........................................................................................ 66
2.12 Re-flow flip chipping using gold stud bumps .............................................................. 68
2.13 Thermo-sonic flip chipping .......................................................................................... 70
2.14 Interlaminar shear test on CFRP with embedded piezoresistive pressure sensors 72
3 Monitoring of resin cure ................................................................................................... 77
3.1. Interdigital planar capacitive sensors ........................................................................ 77
3.2. Design of microscale interdigital planar capacitive sensor ....................................... 78
3.3. Analytical model........................................................................................................ 78
3.4. Choosing suitable material for sensor substrate ........................................................ 81
3.5. Choosing suitable sensor metallization ..................................................................... 83
3.6. Designing sensor structure ......................................................................................... 83
3.7. Cavities ...................................................................................................................... 84
3.8. Fabrication of microscale interdigital sensor ............................................................. 85
3.9. Sheet resistance of tantalum ...................................................................................... 86
3.10. Stress measurement ................................................................................................ 87

Table of Contents
xi
3.11. Anodic oxidation .................................................................................................... 88
3.12. Mechanical shear test ............................................................................................. 88
3.13. Temperature effect on measurement ...................................................................... 90
3.14. A/d Ratio and Csub .................................................................................................. 90
3.14. Comparison between microscale and Netzsch interdigital sensors .......................... 91
4 IDS on plasticized RTM6 ................................................................................................. 95
4.1. Plasticizing RTM6 by camphor (C10H16O) ............................................................... 96
4.1.1. Sylgard 184 ........................................................................................................ 97
4.1.2. Release agent ...................................................................................................... 98
4.1.3. Variation of mixing temperature ........................................................................ 98
4.1.4. Pre-solving of camphor in different solutions .................................................... 99
4.1.5. Sedimentation ..................................................................................................... 99
4.2. Plasticizing RTM6 by Dibutyl Sebacate ................................................................. 100
4.2.1. Sylgard 184 ...................................................................................................... 101
4.2.2. Release agent .................................................................................................... 101
4.2.3. Conformask 2500 or E 8020 ............................................................................ 102
4.3. Plasticizing RTM6 by Binder EPR 05311 ............................................................... 102
4.4. Mechanical test ........................................................................................................ 103
4.5. Glass transition temperature of plasticized RTM6 ...................................................... 105
4.6. Screen printing interdigital structure ....................................................................... 105
4.7. Measurement in glass fibre ...................................................................................... 106
4.8. Measurement in carbon fibre ................................................................................... 107
5 Conclusion and outlook .................................................................................................. 109
References .............................................................................................................................. 111
List of Figures ........................................................................................................................ 115
Appendix A ............................................................................................................................ 119

xiii
Zusammenfassung
Die Notwendigkeit der Verwendung von leichtem und hochfestem faserverstärktem Kunststoff in verschiedenen industriellen und wissenschaftlichen Anwendungen wurde in den letzten Jahrzehnten erhöht/nahm zu. Das ideale Produkt bietet gegenüber herkömmlich verwendeten Metallen hervorragende mechanische und chemische Eigenschaften mit einem deutlich geringeren Gewicht. Zunächst werden die faserverstärkten Kunststoffe durch Versuchs- und Fehleriterationen hergestellt. Dies führt zu einem sehr teuren Produkt, das nicht für Massenproduktion reproduzierbar ist und keine garantierte Qualität hat. Von daher müssen versuchsbasierte durch wissensbasierte Ansätze ersetz werden. Der Einsatz von Sensoren für die in-situ Fertigungsüberwachung führt zu zuverlässigen und reproduzierbaren hochwertigen Verbundwerkstoffen und optimiert den Zeit- und Kostenaufwand des Prozesses.
Eines der üblichen Herstellungsverfahren für faserverstärkte Kunststoffe ist die Harzinfusion in Trockengewebe. Das Harz imprägniert das Fasergewebe durch die Existenz eines Druckgradienten in der Fasermatte, der durch eine Vakuumpumpe oder durch Harzinjektion bei hohem Druck erzeugt wird. Die Imprägnierung des trockenen Textils ist das Ergebnis einer Druckänderung zwischen dem Harzeinlass und dem Entlüftungspunkt in der Form. Daher stellt die wichtigste Messung zur Erfassung der Harzfront und der Änderungen des hydrostatischen Harzdrucks die Messung direkt innerhalb des Laminats dar. In dieser Studie werden mit Drucksensoren Echtzeit-Informationen über die Harzfront im Laminat und die Änderungen des hydrostatischen Drucks während der Infusion gemessen. Verschiedene Drucksensoren und Verbindungstechniken wurden untersucht, um die Größe des Erfassungselements in dem Verbundstoff zu minimieren.
Nach vollständiger Imprägnierung der Fasern mit dem Harz muss der Aushärtegrad des Harzes gemessen werden. Mikroskalige, interdigitale kapazitive Sensoren mit einem perforierten Substrat aus Polyimid werden in dieser Arbeit entworfen und hergestellt. Die Dicke des Sensors beträgt etwa 5 μm. Das Polyimid ist bis 450°C thermisch stabil. Deshalb kann der Sensor auch für Hochtemperaturhärtungsprozesse verwendet werden. Die interdigitalen planaren kapazitiven Sensoren werden auf einem Polyimidsubstrat hergestellt. Der interdigitale kapazitive Sensor in dieser Arbeit hat ein Volumen von etwa 0,1 mm3. Diese kleine Größe ermöglicht es dem Sensor, innerhalb des Verbundmaterials für die structural health monitoring während der Lebensdauer des Verbundstoffs zu verbleiben. Die Metallisierung des Sensors ist mit etwa 40 nm Metalloxid isoliert, das durch die Metallisierung selbst aufgebaut ist. Diese Isolationsschichten ermöglichen die Messung in elektrisch leitenden Kohlenstofffasern.
Idealerweise sollten die Sensoren für die Online-Prozessüberwachung von Verbundwerkstoffen aus den Fasern oder dem Harz hergestellt werden. Dadurch wird der Wundeffekt im Wirtsmaterial eliminiert. Zu diesem Zweck wird ein Hochleistungsharz für die Luft- und Raumfahrtanwendung vom Typ RTM6 mit verschiedenen Weichmachern vermischt. Daraus kann ein dünnes und flexibles Substrat erzeugt werden. Eine interdigitale Kammstruktur wird auf das neu entwickelte Substrat aufgedruckt. die Aushärtung von RTM6-Harz in Glas- und Kohlenstofffasern kann mit Der flächige interdigitale Sensor auf flexiblem RTM6 messen werden.
Sensoren für die Online-Prozessüberwachung sind für die Industrie 4.0 wichtig, um autonome Faserverbundwerkstoffe in einer sogenannten "Smart Factory" herzustellen. Sowohl Drucksensoren als auch interdigitale kapazitive Sensoren, die in dieser Arbeit verwendet werden, können für die Online-Prozessüberwachung eingesetzt werden. Sie bieten einen wissensbasierten Ansatz für qualitativ hochwertige und kostengünstige Produkte.


xv
Abstract
The need for using light-weight and high-strength fibre reinforced polymer in different applications has increased in the past few decades. The ideal product offers excellent mechanical and chemical properties with much lower weight compared to traditionally used metals. Initially, the fibre-reinforced polymers are being produced by trial and error iterations. This causes a very expensive product, with random quality and lack of reproducibility. There is a need to replace trial and error experiments with knowledge-based approaches. Using sensors for in-situ production to monitor the results in a reliable and repeatable way gives a high-quality composite product and optimizes the time and cost of the process.
One of the common manufacturing processes of fibre-reinforced polymer composite is resin infusion in dry fabrics. The resin impregnates the fibrous textile through the existence of a pressure gradient in the fibrous mat, which is generated by a vacuum pump or by a resin injection at high pressure. The impregnation of the dry textile is a result of the pressure gradient between resin inlet and venting point in the mold. Therefore, the most relevant measurement to detect the resin front and the changes of resin hydrostatic pressure is measuring the pressure directly inside the laminate. In this study, pressure sensors provide real-time information about the resin front in laminate and the changes of resin hydrostatic pressure during the infusion. Different pressure sensors and interconnection techniques were examined to minimize the size of the sensing element in the composite.
After complete impregnation of the fibres, the curing degree of the resin has to be measured. Microscale interdigital capacitive sensors with a perforated substrate of polyimide are designed and fabricated. The sensors are fabricated on polyimide substrate with a thickness of about 5 μm. The polyimide is thermally stable up to 450°C. Therefore, the sensor can be used for a variety of processes even with high-temperature curing requirements. They have a volume of around 0.1 mm3. The miniaturized dimensions of the sensor enables it to remain in the composite product with the negligible diminishing of mechanical properties. The metallization of the sensor is insulated with metal oxide built up from the metallization itself. This insulation layer enables measurement in electrically conductive carbon fibres. The sensors will remain inside the composite material for structural health monitoring during the life-time of composite.
Ideally, the sensors for online process monitoring of composites should be made of the identical fibres or resin in that composite. This will eliminate the wound effect in the host material. To obtain sensorial material, a high-performance resin for aerospace application, type RTM6, is mixed with different plasticizers. The cured mixture of the resin is thin and flexible. An interdigital comb structure is screen-printed on the newly developed substrate. The curing degree of the RTM6 resin in glass and carbon fibres is measured by screen-printed planar interdigital sensor on flexible RTM6.
Having sensors for online process monitoring is important for industry 4.0 to autonomously produce fibre reinforced composites in a so-called “smart factory”. Both, pressure sensors and interdigital capacitive sensors in this thesis can be used for online process monitoring. They will provide a knowledge-based approach for high-quality and low-cost products.


xvii
Abbreviations
ABS Acrylonitrile Butadiene Styrene ACA Anisotropic Conductive Adhesive ASIC Application-specific integrated circuit ASTM American Society for Testing Materials BMI Bismaleimide CFRP Carbon Fibre Reinforced Polymer CT Computed tomography DEA Dielectric Analysis DMA DynamicMechanical Analysis DRIE Deep Reactive Ion Etching DSC Differential Scanning Calorimetry FBG Fibre Bragg Gratings FEM Finite Element Method FIBRE Faser Institut Bremen ev. FRP Fibre Reinforced Polymer GFRP Glass Fibre Reinforced Polymer IC Integrated Circuit IDS InterDigital Sensor IMSAS Institute for MicroSensors, -Actuators and –Systems ISO International Standard Organization KoH Potassium Hydroxide MEMS Microelectromechanical Systems NDE Non-Destructive-Testing PC Poly Carbonate PCB Printed Circuit Board PEEK polyether ether ketone PEKK polyether-ketone-ketone PMMA Poly Methyl Methacrylate PPS polyphenylene sulfide PS Poly Styrene PVC Polyvinyl chloride RFI Resin Film Infusion RI Resin Infusion RTM Resin Transfer Molding SEM Scanning Electron Microscopy SHM Structural Health Monitoring SNR Signal-To-Noise-Ratio TMA ThermoMechanical Analysis VARI Vacuum Assisted Resin Infusion VARTM Vacuum Assisted Resin Transfer Molding VCC Input supply voltage


xix
Nomenclature
Symbol Description Units piezoresistive coefficient - sheet resistance with Ω/square Volume m3 ∗ effective carrier mass in the crystalline lattice kg Fibre volume content - the permittivity of free space 8.854 × 10⁻¹² F/m " Loss factor F/m Relative permittivity of media - Relative permittivity - Strain - Charge mobility m2/V.s Ion viscosity Ω cm Specific resistivity Ω.m ∅ Porosity - ∇ Pressure gradient Pa.s
A Cross section area m2
C Capacity F C0 Capacitance in vacuum F d Distance between two plates m E electric field V/m f Frequency Hz g Gravity acceleration m/s2
I Current A K Permeability of the media m2 k Integral modulus - K(k) Complete elliptical integral of the first kind - L,l Length m M Molar mass g/mol n Reflective index - P Pressure N/m2
Q Flow rate discharge m3
q Charge per unit of charge carrier C R Resistivity Ω RM Molar refractivity cm3 mol-1
t Time s Tg The glass transition temperature Celsius V Voltage V Z impedance Ω η Metallization ratio m σ electrical conductivity S/m φ Phase shift Radian
Temperature Celsius Resin velocity m/s Phase lag Radian Fluid viscosity Pa.s
Fluid density Kg/m3
Angular frequency Radian/s

20
Chapter 1: Introduction
21
1
Introduction Composite materials are used widely in army, aerospace, bridges, wind energy, highways,
medical industries and even housing over last three decades. They offer many advantages like
durability, high stiffness to weight ratio, light-weight, the flexibility of design, thermal stability
and corrosion resistance. Besides these advantages, the main drawback is relatively high
manufacturing costs. To reduce the waste and manufacturing costs, the production needs to be
optimized. In a conventional way, the optimization has been done by trial and error methods,
which are mostly a random process. Nowadays, using sensors offers a knowledge-based
optimization. In a fully automated composite manufacturing, the real-time information from the
inner state of composite laminate is available and the process is controlled to enhance the
quality of the final part.
One of the common methods to manufacture fibre reinforced polymer composites is Vacuum
Assisted Resin Infusion (VARI). This technique offers many benefits such as high fibre to resin
ratio, high strength and stiffness, low shrinkage and high-quality surface smoothness. VARI is
common in the production of sports equipment, boats, and wind turbine blades. All the
experiments in this thesis are run based on VARI technique.
In VARI processes, there are two important phases of impregnation of fibres with resin and
curing of the resin. In this thesis, two types of sensors are used to optimized each of these two
phases. The first objective of this thesis is to find a proper type of the pressure sensor that can
work in a vacuum and liquid resin, conductive and non-conductive fibres and mainly in VARI
processes. The size of the embedded sensor has to be minimized; even though the pressure
sensors will be used in the laboratory level to validate some simulation results. Especially, the
measured pressures can be compared with the most common law of impregnation of a
permeable medium, Darcy’s law. The agreement of the measured pressure with Darcy’s law in
porous media validates the measurement.
Chapter 1: Introduction
22
When the laminate is completely impregnated with the resin, the resin has to be cured and then
the composite part is ready. Without measuring the degree of resin cure, many cases of resin
under-curing will happen and the durability of the composite part will not be achievable. To
ensure the complete curing of the resin, a planar interdigital capacitive sensor for Dielectric
Analysis (DEA) are the most common used sensors. The second objective of this thesis is to
design and fabricate microscale Interdigital Sensors (IDS). The sensors should be able to in-
situ measure the resin cure in fibre reinforced composite. Embedded sensor in composite
behaves as a wound. To minimize the so-called wound effect, the sensor is miniaturized in all
dimensions and the substrate of the sensor is perforated. Therefore, resin bridges the sensor
substrate and the sensor is reinforced in the laminate. Since the thickness of the sensor is
comparable to the diameter of filaments in glass or carbon fabrics, the sensor can remain in the
composite without destructing its mechanical properties. After curing of the resin, the sensor
can be used for Structural Health Monitoring (SHM) to measure the water uptake in resin.
To achieve the material-material integration and eliminate the wound effect, the thin and
flexible substrate from the RTM6 resin is produced by mixing the RTM6 with a plasticizer.
This work is structured as following: chapter 1 introduces fibre compounds, different types of
resin and various Fibre Reinforced Polymer (FRP) composite production methods. Moreover,
Darcy’s law of flowing a fluid in a porous media is explained in this chapter. Last not least, the
theory of dielectric analysis (DEA), which is the most common method for monitoring of
dynamic changes in polymer resin in explained in chapter 1.
In chapter 2, an overview is given about different methods to monitor the resin flow and resin
front in dry fabric during resin infusion. Briefly, the most common sensors for resin flow
detection are introduced. Capacitive and piezoresistive pressure sensors are investigated in this
thesis, which the specification and the result of using each of these sensors are discussed. The
piezoresistive pressure sensors are wire bonded and flip-chip soldered on different Printed
Circuit Boards (PCB). The pros and minus of these methods are discussed in this chapter.
Chapter 3 will focus on design and fabrication of planar interdigital capacitive sensor. It
contains the discussion about the material selection for the sensor substrate and metallization.
It will show the novelty of the newly developed sensor compared to the commercial sensor and
to the 1st generation of that type of sensor made in Institute for Micro Sensors,-Actuators and
Systems (IMSAS). In accordance to DIN2563, some mechanical tests are done on the
embedded sensors in CFRP to detect the foreign body effect imposed by the embedded sensor
in the composite.

Chapter 1: Introduction
23
In chapter 4, a newly generated material as a substrate for the interdigital sensor is introduced.
The interdigital planar capacitive sensors are screen printed on this newly developed substrate.
The curing measurement of Resin Transfer Molding (type RTM6) is done in glass and carbon
fibre reinforced polymer using a screen-printed sensor on the flexible RTM6 substrate. Chapter
5 contains conclusion and some suggested future works.
1.1. What are fibre composites?
Fibre composite materials subsist of two (or more) different compounds that have better
mechanical, thermal, chemical properties than each of those single materials. In industrial
manufacturing processes, the term composite stands for a combination of fibres with high
tensile strength and resin (matrix) to reinforce the fibres. Since fibres have higher tensile
strength, they carry the loads and the matrix keeps fibres in place, transfers the load to the fibres
and protect the fibres from the environment. There are a variety of fibres and resin
combinations. Fibres are available in different length, made out of different materials and
therefore can have different alignments. The composite is much stronger in the fibres direction,
which should be considered by designers for optimization of reinforcement along the fibre
direction [1]. Likewise, a variety of resin matrices is available in the form of thermosets and
thermoplastics.
The final properties of composite rely on fibre volume and not the matrix, nevertheless, it is
necessary to have a matrix for keeping fibres in desired shape and place. Matrix is adding only
weight to the final product, and it has inadequate tensile strength compared to fibres. Thus,
adding minimum sufficient resin to wet the fibre is a big challenge in industrial composite
manufacturing.
Two important terms that have to be defined are fibre volume content vF and porosity ∅. The
fibre volume content is the volume of the reinforced fibres in a composite part and porosity is
the empty part [2]. This is written by equation 1 + ∅ = 1 . (1)
Minimization of voids and porosity has been a key problem in the past three decades. A study
[2] shows each 1% increase in voids volume results in properties degradation of up to 10%.
There is a concentration stress around voids and usually, initiation of cracks are at the void
sites. The existence of voids reduced the required energy to fail composite parts. Voids in the
cured resin are generally the entrapped air due to leakage or non-degassed mixed resin.
Chapter 1: Introduction
24
Shrinkages in the resin generate also some voids as well as volatile generation during resin cure.
One of the other reason of having voids could be entrapped air inside or between tows [2].
When the resin viscosity is too low, the vacuum pump can take out the more air bubble. But
there will be some air bubbles always left in the tows [2].
Degassing of the resin after mixing the components and prior to infusion is usually done in
industries. The resin container is placed in a vacuum to remove the air bubbles entrapped in
that by mixing or stirring.
1.2. What are fibres?
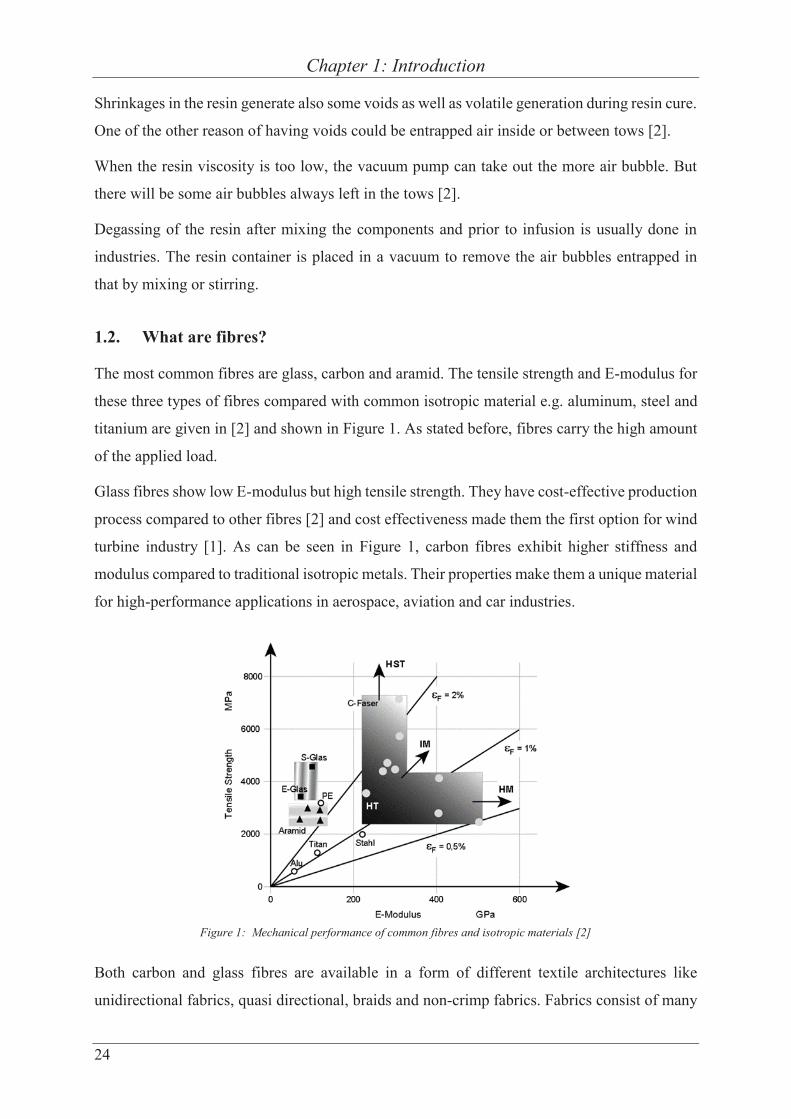
The most common fibres are glass, carbon and aramid. The tensile strength and E-modulus for
these three types of fibres compared with common isotropic material e.g. aluminum, steel and
titanium are given in [2] and shown in Figure 1. As stated before, fibres carry the high amount
of the applied load.
Glass fibres show low E-modulus but high tensile strength. They have cost-effective production
process compared to other fibres [2] and cost effectiveness made them the first option for wind
turbine industry [1]. As can be seen in Figure 1, carbon fibres exhibit higher stiffness and
modulus compared to traditional isotropic metals. Their properties make them a unique material
for high-performance applications in aerospace, aviation and car industries.
Figure 1: Mechanical performance of common fibres and isotropic materials [2]
Both carbon and glass fibres are available in a form of different textile architectures like
unidirectional fabrics, quasi directional, braids and non-crimp fabrics. Fabrics consist of many

Chapter 1: Introduction
25
tows, next to another and bundle together forming a textile form of regular thickness. Each tow
generally contains a few thousand untwisted fibres, each with the diameter of 3 - 20μm. The
thickness of final composite parts is directly related to the number of fabrics, so-called plies, in
the laminate.
The tows are stitched or woven in several different orientations such as unidirectional or 0°, ±
45° and 90° regarding the weft or wrap direction as it is shown in Figure 2.
Figure 2: Schematic of relevant axis to the fabric roll
1.3. What are different resins?
Beside fibres, resin or matrix plays also an important role on composite properties. They protect
the composite surface against fire, humidity, high temperature and even damage [2]. Voids
always exist in a matrix, which initiates cracks and stress concentration zone in the composite
[3].
The term of resin used in fibre reinforced composites referred to polymer substance. A common
property of all polymers is a long chain-like molecule consists of repeating many simple
molecules called monomer.
The most common resins in composite manufacturing are categorized as thermosets and
thermoplastics. Thermosets including epoxies, vinyl ester and polyesters are the most common
used in infusion processes due to their naturally low viscosity before curing [2]. The low
viscosity of thermosets eases the infusion process.
The thermosets are materials with an irreversible curing process. They form a three-dimensional
polymeric cross-linked network, which cannot be reshaped once the resin cure is finished. In
the thermoplastics, single monomers are connected to form a long linear molecule after curing
with a weak chemical bond. Despite thermosets, thermoplastics can be processed and reshaped
repeatedly. The attributes of these two resin categories are explained in sections 1.4 and 1.5.

Chapter 1: Introduction
26
1.4. Thermoset resins
Thermoset or thermosetting resins are formed by blending resin and hardener or catalyst, which
show an irreversible chemical reaction. During the chemical changes, the physical state of
thermoset changes from the liquid (part I in Figure 3) to a rubbery substance (part II in Figure
3) and afterward to a solid substance (part III in Figure 3). The gel-point (point A in Figure 3)
is the beginning of the resin’s rubbery state and the vitrification point (point B in Figure 3 is
the end of that. These transitions together are called curing. These different morphological
states can be seen in Figure 3. After curing, the thermosets are hard and the polymeric molecule
is cross-linked three-dimensionally. Some thermosets like phenolic group release some organic
volatiles, which is dangerous for environments. Other groups like polyesters are volatile free
during cure.
After thermosets cured, they do not turn to soften or liquid by elevating the temperature.
Although, their mechanical properties will drastically change above a certain temperature,
called glass transition temperature (Tg). Tg has a wide variety of ranges according to the specific
resin, curing temperature and even the mixing ratio of the resin and hardener or catalyst.
Heating the cured thermosets above their Tg results in changing the polymer chain from
crystalline to more flexible and amorphous polymer which has a significant low stiffness. Shear
strength, color stability and water resistance is also deteriorated by heating a thermoset above
its Tg [4].
Figure 3. Curing process of polymeric resin [5]

Chapter 1: Introduction
27
1.4.1. Polyester resin
The most widely used thermoset resins are polyesters. Polyester resins show very low water
uptake, which makes them an excellent choice for marine industry. On the other hand,
polyesters cannot withstand high-temperature; therefore, they are not a good option for
aerospace applications [2]. Most of the polyesters resin are a solution of polyester in a usual
styrene monomer, which is viscous. Having more than 50% styrene in the resin will reduce the
viscosity and without applying pressure this resin can be used for molding. Another role of
styrene is to help the resin cross-linkage and creation of big polyester molecule chain. Usually,
the polyester resins have a short pot life and gelation of resin will happen on their own over a
long period of time. Generally, a catalyst or an accelerator is added shortly before the molding
to initiate and speed up the polymerization. The catalyst will not take part in the polymerization
reaction and will only activate the process.
The molecular chain of the polyester resin is shown in Figure 4(a). The styrene helps cross-
linkage of the resin and creation of a big polyester molecule as shown in Figure 4(b). ‘B’
indicates the reactive part of the resin which can be connected via ‘S’ styrene to the other
monomer [4].
(a)
(b)
(c)
Figure 4. Schematically represented (a) chemical structure of polyester (Isophthalic polyester) (b) uncured and (c) cured polyester resin

Chapter 1: Introduction
28
1.4.2. Vinyl ester resins
The molecular structure of vinyl ester resins is similar to polyesters group but different in the
reactive part. The reactive part of vinyl ester is positioned at the end of the molecule chains.
Due to joining molecules only at both ends of their chain to one another, the vinyl ester is
tougher than polyester. Actually, the ester group uptakes water. This means that vinyl ester
resins are more resistant to uptake humidity than polyesters [4]. Typically, a vinyl ester
molecule has a structure as shown in Figure 5.
(a)
(b)
(c)
Figure 5. (a) A typical vinyl ester molecule. The ∗ is the reactive site of a molecule. (b) schematic of an uncured vinylester
(c) schematic of cured venilester
1.4.3. Epoxy resins
An epoxy resin is made out of mixing different bisphenol-A based epoxy and some amines.
This combination will be cross-linked and stiff when the resin is cured. Both combination ratio
of epoxy/amine and process temperature affect the curing reaction speed. These two factors
must be engineered in a way that all the fibres in a stack are impregnated properly with the resin
before cure initiation.
Epoxies can be formulated to be cured at both room and elevated temperature. The resins with
the curing process at high-temperature show better thermal properties than room-temperature
cured resin [4].
Epoxy resins turn to be the most functional resins showing the best mechanical properties and
lowest environmental degradation. They are the first option for aircraft compared with

Chapter 1: Introduction
29
polyesters and vinyl esters, even though they are overpriced and dangerous for the environment.
Polyesters and vinyl ester resins have also inherently low viscosity before cure and are more
environmentally friendly and cheaper than epoxy groups. All these three types are commonly
used in wind turbine blade production [1].
The term epoxy stands for a chemical group having oxygen atom as shown in Figure 6.
(a)
(b)
(c)
Figure 6. (a) Simple epoxy structure (Ethylene Oxide) (b) chemical structure of a typical epoxy (Diglycidyl ether of
bisphenol-A), (c) schematic of 3D cured epoxy resin
Mainly epoxies have amber or brown color and they are easily cured at a different temperature
from 5-180°C based on various type of curing agents. The curing agent is usually a hardener
rather than a catalyst. Generally, the hardener is an amine. There are usually two epoxy sites,
which are connected to an amine from both sides. This will create a 3D chain as shown in Figure
6(c). They demonstrate high mechanical properties and small shrinkage during cure. Similar to
vinyl esters, epoxies have a long molecular chain with reactive sites on both sides of the chain.
However, the reactive site is made by the epoxy group itself and not by ester group. The ester
part in vinyl esters uptakes water; thus, epoxies are water resistance better than resins with ester
groups [4].
1.4.4. Other resin used in composites
Mainly, polyesters (5 - 7 Euro/Kg), vinyl esters (~ 42 Euro/Kg) and epoxies (RTM6 ~ 250
Euro/Kg) are used in composite production. However, there are other resins with their special

Chapter 1: Introduction
30
properties that are hired in unique applications. Here shortly some of those resins are named
and described.
A high-temperature stable and the fire-resist phenolic resin are used in specific applications.
Their curing process includes a lot of degassing, which appear as numerous unwanted voids
and non-smooth surfaces. They are brittle with minor mechanical properties. Nevertheless, they
are rather cheap with 2.5 - 5 Euro/Kg.
Another fire-resistant resin is silicone, which is a synthetic resin with silicone backbone instead
of organic carbon backbone. This resin is mainly used in missile application. It needs a high
curing temperature and costs about 20 Euro/Kg.
Cyanate ester used in aerospace and showed high-temperature stability up to 400°C. This resin
has high dielectric properties compared with glass fabrics. It is relatively expensive for about
100 - 120 Euro/Kg.
Looking for other high-temperature stable resin, Bismaleimide (BMI) could be an option. The
resin withstands 230°C wet and 250°C dry. For a specific application like engines or high-speed
war aircraft this resin is a good option. It costs about 70 Euro/Kg.
Speaking about high thermal stable resin, polyimide is also an option with 250°C wet and 300°C
dry temperature resistant. It is also used for missile and engines for aerospace applications. It
is an expensive resin, with more than 95 Euro/Kg. Due to a high level of toxicity, special
handling is required.
A high toughness resin, which usually blended to other resins is polyurethanes. Having a
harmful curing agent (isocyanates) restricts its application; however, it is cheap with 3 - 12
Euro/Kg [4].
1.5. Cure Kinetic
The cure reactions in thermoset resins can be divided to step and chain polymerization. Epoxies
and phenolic resins have step polymerization and vinyl esters and unsaturated polyesters have
chain polymerization. In the step polymerization, the length of polymer chain increases due to
the connection of monomers to each other and ultimately short chains will be linked to the
longer chain in a so-called condensation reaction. In the chain polymerization, the polymer
chain grows due to the addition of monomers to the ends of the chain. Both the step and the
chain polymerization results in a cross-linked polymeric network, which is rigid and stable [6].

Chapter 1: Introduction
31
1.6. Thermoplastics
Besides thermosets, thermoplastics are the second main type of resins, which have long
entangled polymeric chains instead of 3D cross-linked polymeric chains of thermosets. A great
advantage of thermoplastics is lower toxicity level. Due to their lower glass transition
temperature than decomposition temperature, thermoplastics offer better recycling procedure
compared with thermosets [2]. They have inherently a very high viscosity before curing and
require a very high energy for curing.
Like metals, thermoplastics are softened by heating and ultimately melting and hardening again
when they cooled down. These changes of physical state of solid and molten substance can be
repeated as often as required without any effect on the polymer properties. Typical
thermoplastics are polyamide, polypropylene and Acrylonitrile Butadiene Styrene (ABS) for
low-tech applications and polyphenylene sulfide (PPS), polyether ether ketone (PEEK) and
polyether-ketone-ketone (PEKK) for high-tech applications. In this study, only thermosets are
investigated for both infusion study and cure monitoring of resin.
1.7. What are different fibre composite manufacturing methods?
There has been numerous of creative methods for wetting fibres with resin, which started at the
very first level with pouring the resin on the fabrics. Applying some pressure on the resin and
fabrics resulted in a better wetting and higher vF. To enhance repeatability of composite
production, the amount of resin has to be controlled. In the following sections, different
processes and the most common manufacturing methods are introduced.
1.7.1. Hand lay-up
The fabrics are placed in or on a 1-sided mold and the resin is sprayed, brushed or distributed
using a roller. To get rid of the extra amount of resin, a sponge is used and afterward the next
fabric is placed. Only 1 smooth surface at the mold side is achievable. There is no control on
the thickness of product and fibre volume content. Steep edged mold and hollow structures
make the wetting procedure difficult. During resin cure, some hazardous volatile organic
compounds like styrene are freed to the environment. This application is restricted over past
two decades regarding the increase of environmental concerns. The lowest control on
production makes this method unfavorable for many applications; nevertheless, this is the
cheapest method [4]. Figure 7 shows simplified hand lay-up production process.

Chapter 1: Introduction
32
Figure 7: A simplified hand lay-up production process
1.7.2. Resin Infusion (RI)
In resin infusion process, the low viscosity resin infiltrates thoroughly the dry fabrics by either
positive or negative pressure. After impregnation of fabrics with the resin, the resin matrix has
to be cured. The cost-to-properties ratio is low, which makes this method favorable upon
prepregs and RTM. Compared with hand lay-up there is no release of volatile organic gasses,
which makes this method an environmentally safe option. Moreover, there is more control on
vF compared to hand lay-up. The main advantage of RI is geometrical flexibility. The main
challenge of RI process is wetting all the plies properly with the minimum amount of resin prior
to curing [4]. Figure 8 illustrates resin infusion process in dry textile assisted by a vacuum
pump.
Figure 8: Resin infusion process in dry textile assisted by a vacuum pump
1.7.3. Prepregs
Autoclaved prepregs material show the highest properties and repeatability among all other
methods. In fact, they are the first and most common choice for aerospace. Prepregs are pre-
impregnated fabrics with the required amount of resin. To keep the resin on the fabric, a very
high viscosity resin is used. Since the fibres are impregnated with resin, prepregs must be stored
in the freezer. If the resin in prepregs is epoxy, the laminates are cured in a vacuum bag and
there will be no release of organic volatile. The process of prepregs is very expensive compared

Chapter 1: Introduction
33
to hand lay-up and RI. Usually, there are many air pockets between each two layers. This adds
additional heating in vacuum to get rid of imposed porosity in the final product. Despite the
difficulty in handling and costly process, still, the high-quality result makes them a favorite
option [4]. Figure 9 shows prepreg composite production in a mold tool.
Figure 9: Prepreg composite production in a mold tool
1.7.4. Resin Transfer Molding (RTM)
Resin Transfer Molding (RTM) is a common manufacturing process in which the fabrics are
placed on the bottom part of a mold. Figure 10 demonstrates RTM fibre reinforced composite
production in a closed mold. The upper part of mold will enclose the mold. The heated resin is
driven to the mold with high pressure from one side and fills all the cavities and porosity
between plies.
Figure 10: RTM fibre reinforced composite production in a closed mold
Chapter 1: Introduction
34
Another side of the mold has some embedded holes to let the trapped air between plies go out.
After curing of the resin, two parts of mold will be detached and the finished part is taken out.
Since the resin is driven with high pressure, there is a possibility to use resins with higher
viscosity before curing and the process is relatively fast. The set-up and tooling define the
limitation of pressure, which could be in the range of 8 – 120 bar [4].
1.7.5. Vacuum Assisted Resin Transfer Molding (VARTM)
To facilitate the impregnation of fibres with resin, a vacuum is applied to one side of the mold.
Evacuation of the trapped air and resin excess will speed up the infusion in RI processes. The
mold can be closed (upper/bottom part) or open (only one part). The open mold will reduce the
tooling cost. Using VARTM to wet out fabrics in a complex shaped mold needs a precise
engineering to find out the optimum position of infusion points and vacuum ports [4].
The resin is driven by the aid of vacuum. Therefore, the reliability of the vacuum pressure is
important. The preform is filled up with the resin from one side and evacuated by vacuum from
the other side.
Usually, a distribution film with high permeability is placed on top of the preform to speed up
the infusion. There is a quadratic relationship between time and length of flow front in Darcy’s
law (section 1.9) in a porous medium. Increasing of the swept length by resin reduces
significantly the speed of resin infiltration. The process of using distribution film called vacuum
assisted resin infusion (VARI) and patented by Seeman composites resin infusion process. In
this thesis, all the experiments is done using VARI technique. The setup for VARI composite
production is easy since the laminate requires a one-sided rigid tooling. Mostly, the production
of the wind turbine blades, boat industry, and in some cases even in aerospace use VARI
technique. The easy setup makes the VARI technique a suitable method for laboratory trials.
Any type of resin can be chosen for VARTM process. Although, polyester and vinyl ester cause
a problem by releasing organic volatile during curing, which will go to the vacuum pump and
will be released around the pump.
1.7.6. Pultrusion
Fibres are pulled out from the reel and go through the resin bath. Then, they continue their way
through a heating part, which completes the impregnation of fibres and curing of the resin. They
get the shape of desired final part when the fibres are still wet. The cured part will be cut to the

Chapter 1: Introduction
35
desired length. Although the pultrusion is a continuous process, having a final part with a
constant cross section is a big challenge. Generally, fibre tears apart very often and the process
has to be stopped in many steps, which make the process non-continuous. Any types of resin
and fibres can be selected for pultrusion. Figure 11 shows simplified pultrosion fibre reinforced
composite production.
The pultrusion process can be very fast which makes it economical and low cost. If the resin
impregnation area is enclosed, there will not be any volatile emission. The amount of resin in
fibres is controlled. Unfortunately having non-constant cross section is the main disadvantage
of this method. Moreover, keeping a heated chamber for a long time at constant temperature
for curing of the resin is costly [4].
Figure 11: A simplified pultrosion fibre reinforced composite production
1.7.7. Autoclave
In VARTM, the preform is airtight sealed in a vacuum bag and evacuated by a vacuum pump.
The inner pressure of the airtight bag is a few mbar, which depends on the functionality of the
vacuum pump. Thus, the laminate is under the atmospheric pressure (~1bar) and this causes a
compaction.
An autoclave is a chamber, in which the evacuated preform is placed and a positive pressure of
6 - 8bar can be applied inside the chamber. The process temperature can vary from 80 - 400°C
depending on the resin type. Any types of fibre and resin can be used in an autoclave processing.
Due to a high amount of applied pressure on the laminate, a very high fibre volume content can
be achieved in the final product. The high-quality products provide a possibility of automated
manufacturing and complex shape part are easy to produce. Mainly the aircraft parts, wind
turbine blades and parts for the race cars are produced using an autoclave. Figure 12 shows an
autoclave for VARTM composite production.

Chapter 1: Introduction
36
However, the very high pressure and temperature limit the choices of material for mold to
withstand the curing condition. Concerning the cost, the process is more expensive compared
with VARTM [4].
Figure 12: Scheme of an autoclave for VARTM composite production
1.7.8. Resin Film Infusion (RFI)
As described in 1.7.3, the main challenge of using prepregs are trapped air pockets between two
neighboring layers. Especially in a thick laminate (thicker than 3 mm), it is hard to get rid of
trapped air. Traditionally some warming up in a vacuum after laying down any layer is required,
which elongates the process time and increase the cost. There are a number of prepregs products
that the resin film is available between textile layers [4]. The film is placed between each two
fabrics. Therefore, by evacuation, all of the air can be taken out of the laminate. Then the
preform will be heated up to soften and ultimately melt the resin for impregnation of fibres.
The films are available for almost all epoxy resins and any fibres can be used in RFI process.
A very high fibre volume content can be achieved and since the air evacuation is done up to a
satisfactory level the void content is minimized. The production speeds up and the process is
very robust and repeatable. Although, the material is more expensive than the usual prepregs.

Chapter 1: Introduction
37
Tooling has to withstand higher temperature, which needs some concerns regarding mold made
out of PVC at elevated temperature [4].
Usually, in a resin infusion processes, there are two analogue pressure gauges at the vacuum
port and infusion source. There is a need to know the pressure variation during resin infusion,
specifically at the crucial regions determined by simulation. This can be done by measuring the
pressure at different points inside the laminate and during impregnation of fibrous mat with the
liquid resin. The measurement can be used for verification of the simulation results.
1.8. Which are models used commonly for modeling the resin flow?
In general, resin behavior in the fibrous mat is modeled as Newtonian fluids, which have
constant viscosity and density. For such a Newtonian fluid the Navier-Stokes formula of
equation 2 is applicable
= −∇ + ∇ + ≅ −∇ + ∇ . (2)
stands for resin density, is the velocity of resin, t is time, P is the pressure, μ is the viscosity
and g is the acceleration due to gravity.
If the vertical height of the laminate is significantly small compared to other laminate’s
dimensions, the effect of gravity on the resin flow is negligible. In a thin laminate, the vertical
flow of the resin through the thickness can be neglected. [7] Neglecting the effect of gravity on
the resin flow will simplify the application of Darcy’s law in porous media such as fibrous
composite. In this thesis, all the experiments have been done in the laboratories and all the
laminate were thin enough to neglect the factor of gravity in equation 2.
The flow rate in RTM processes is adequately slow. Therefore, the Navier-Stokes formula can
be simplified by removing non-linear momentum effects of the material derivative [8]. The
simplified Navier-Stokes formula is written by equation 3 0 = −∇ + ∇ . (3)
Yet, the application of simplified equation for an analytical solution is limited. To enhance the
application of simplified Navier-Stokes equation, the fluxes of the resin at the boundary of the
mold and velocity of that has to be precisely defined [1]. In fact, the flow of the resin in
anisotropic fibre mat is very complex, which makes the elevation of Navier-Stokes equation
prohibitively harsh. Thus, either the geometry of the preform and mold has to be extremely
Chapter 1: Introduction
38
simplified which is not a case in real applications or an alternative equation for modeling of
resin flow in porous mat has to be used. Generally, the alternative equation for modeling of
fluid flow in porous media is suggested by Darcy, which will be described in the next section.
1.9. Darcy’s law
The fibrous mat that forms a laminate is a porous media. In a resin infusion system, Darcy’s
law is the most widely used equation for modeling the resin flow inside the laminate. The
French physicist Darcy in the 19th century described the law when he was studying the flow of
water in already saturated porous sand volume [9]. This law is a further simplification of Eq 3.
The Darcy’s law states that division of total flow rate discharge (Q, m3) by the cross-sectional
area swept by fluid (A, m2) through the porous media is proportionally related to the pressure
gradient (∆ , N/m2) across the length of media (∆ , m) and a constant value comes from the
permeability of the media (K, m2) divided by fluid viscosity (μ, Pa.s). The permeability of the
media is different from other definition of permeability in the electrical engineering field and
is defined for the first time by Darcy for his new model in equation 4
= − ∆∆ . (4)
The Darcy’s law conveys a linear uniform pressure drop along the length of media, which is
given in equation 5
= − μ ∇ . (5)
Where represents the flux or discharge per unit area (m/s), K is the permeability 3D tensor, μ
is the resin viscosity, and ∇p is the fluid pressure gradient (Pa/m) which here is resin pressure
gradient. The value of flux is different from the velocity that fluid travels through the
laminate. The fluid velocity is relevant to fluid flux u by the porosity. The fluid velocity is
given by equation 6
= ∅ . (6)
Where ∅ is the porosity, which is the total media volume through fibrous mat that the resin can
pass.

Chapter 1: Introduction
39
The Darcy’s law was stated for steady state and time-independent flow through a fully saturated
porous medium. The moving front of the resin by the time inside the laminate complicates the
modeling. A quasi-steady state assumption, which is the substitution of the permanent flow in
an already saturated laminate part behind the resin flow, lets us using the continuity equation.
Since the resin is infused in a liquid state, it can be considered as a non-compressive fluid.
Therefore, the continuity equation is valid for that, which states ∇. u = 0 . (7)
Substitution of equation 5 in 7 results in
∇. μ ∇ = 0 . (8)
When the infusion starts, the fibrous laminate starts getting impregnated by resin. Before it gets
completely saturated by the resin, it is partially filled with resin and the rest of laminate is dry.
The viscosity of the resin is significantly higher than the air viscosity. The pressure variation
between the fully saturated part (higher pressure) and at the resin front, which is just swept by
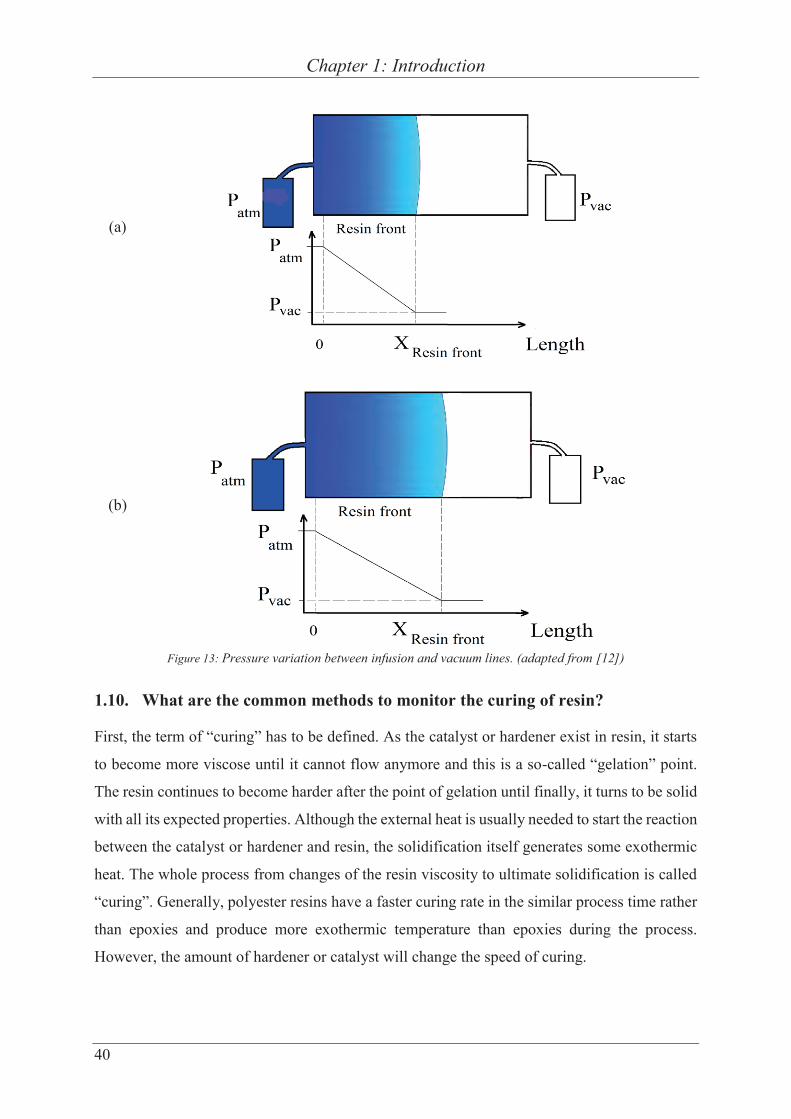
the resin (lower pressure) comes from this viscosity difference. Figure 13 shows the pressure
variation from the infusion line to the vacuum line schematically. Figure 13(a) shows the front
of resin and the pressure gradient between the atmospheric and vacuum pressure is shadowed.
Figure 13(b) shows the same process after elapsing a longer period of time. The length of the
resin front is increased. The pressure at the boundary of the front is at vacuum level, depending
on the functionality of the vacuum pump.
It is more than a century that Darcy’s law is a standard in the field of flow theory in porous
media. Since 35 years ago, this law has been adapted for modeling of polymer resin in fibrous
mat [10]. Using Darcy’s law for polymer resin with low Reynold’s number and non-
compressive Newtonian fluid helps modeling and optimization of the RI processes [11].
Numerous authors have used the adapted Darcy’s law by analytical modeling and comparison
of modeling with experimental data [12-16]. However, the analytical model has to be validated
by experiment. Therefore, in this thesis, the pressure gradient in laminate during VARI process
is measured to validate the analytical solution found by RTM-Worx from Polyworx. [12]
Chapter 1: Introduction
40
(a)
(b)
Figure 13: Pressure variation between infusion and vacuum lines. (adapted from [12])
1.10. What are the common methods to monitor the curing of resin?
First, the term of “curing” has to be defined. As the catalyst or hardener exist in resin, it starts
to become more viscose until it cannot flow anymore and this is a so-called “gelation” point.
The resin continues to become harder after the point of gelation until finally, it turns to be solid
with all its expected properties. Although the external heat is usually needed to start the reaction
between the catalyst or hardener and resin, the solidification itself generates some exothermic
heat. The whole process from changes of the resin viscosity to ultimate solidification is called
“curing”. Generally, polyester resins have a faster curing rate in the similar process time rather
than epoxies and produce more exothermic temperature than epoxies during the process.
However, the amount of hardener or catalyst will change the speed of curing.

Chapter 1: Introduction
41
1.10.1. Differential Scanning Calorimetry (DSC)
The most important method for thermal analysis and characterization of the polymers is
Differential Scanning Calorimetry (DSC). DSC is in accordance with ISO 11357 and based on
that any changes of energy during thermal treatment of liquid or solid material can be studied
and analyzed. DSC measures the heat flow variations of material under test and compares it to
the reference empty aluminum pan. The material under test is heated up at a controlled rate
from room temperature or below that to a temperature above Tg. The DSC can be run by cooling
the material under test from high temperature (above Tg) to the room temperature or even below
that as well.
Using DSC different information about resin can be obtained such as melting point, exothermic
of cure. Melting point determination clarifies the absorption of energy by the resin when it
melts. The cure exothermic shows the required energy to initiate the curing reaction of the resin.
The most relevant aspects regarding polymers that can be studied by DSC are:
- Thermo-physical properties like specific heat transfer during thermal treatment
- Identification and characterization of product, such as identifying the cross-linking
temperature, cross-linking enthalpies and glass transition temperature
- Advanced material analysis comprises decomposition effect
- The degree of cure by running test twice on the same specimen to measure the changes
of energy in that. If in the second round the measured Tg was much higher than the first
run, the sample was under-cured.
- Thermo-kinetics for process optimization
1.10.2. Dielectric Analysis (DEA)
Another important method to characterize the polymeric resins is DEA. A fringing field
interdigital sensor has the same operating principle as many conventional parallel-plate or
cylindrical dielectric cell sensor. In all these three designs, the electric field penetrates the
material under test. The measured capacitance and conductance between two conductors
depend on the dielectric properties of the material under test and the electrode’s geometry [13].
Dielectric Analysis (DEA) is a method to monitor the changes of viscosity and curing state of
the thermoset resins (room or high temperature curable), paints, and adhesives by measuring
the changes of their dielectric properties. DEA is in accordance with ASTM E 2038 or
ASTM E 2039.

Chapter 1: Introduction
42
The fundamental principle of DEA is based on impedance spectroscopy. A sinusoidal voltage
is applied, which called excitation voltage. The charges inside the sample, for example, epoxy
resin, are forced to move. The positive charges are moved towards the negative pole while the
negative pole absorbs the positive charges. This charge movement results in a sinusoidal current
with a phase shift compared with the excitation voltage. The charges are mainly catalyst to
speed up the curing or impurities. Charges are moved and dipoles are being aligned in the
applied electrical field. Figure 14 shows the arrangement of charges in absence and existence
of excitation voltage.
(a) (b) Figure 14: Arrangement of charges (a) in absence of external electric field (b) with applying excitation voltage
The magnitudes of amplitude (dB) and phase difference of the response current are correlated
to the ion and dipole mobility is plotted in Figure 15. This is the basis of dielectric analysis. In
a thermoset epoxy resin, by initiation of the cross-linking the viscosity of the material under
test increases. This increase of viscosity decreases the mobility of the charges and alignment of
the dipoles. Consequently, the amplitude difference (in dB) and the phase shift will increase.
The response current decreases by reduction of ion mobility.
Figure 15: The difference in amplitude and phase between the excitation voltage and measured current
The difference in amplitude is related to dielectric permittivity , which represents the number
of dipoles in resin, or the measure of the alignment. The dielectric loss factor " is correlated to

Chapter 1: Introduction
43
the phase shift between the excitation voltage and response current. It shows how much energy
is lost to align the dipoles and move the charges in material. Moreover, " is proportional to the
material conductivity, , which is the reciprocal value of the ion viscosity. Understanding of
the ion viscosity is very important in study of the resin cure. It reflects the dynamic state of the
resin and the progress of the resin cure directly = , (9) = − " . (10)
has a phase lag, δ, which is dissipation factor compared with the applied voltage
tan = " = tan(90° − ). (11) φ is the phase shift between excitation voltage and response current. is the relative
permittivity, which is dielectric constant of the material under test. The imaginary part " is the
loss factor which is total loss of energy due to alignment of dipoles and moving charges and
ions. is the square root of −1.
Ion conductivity can be driven in correlation with loss factor and angular frequency as given in
equation 12
= " , (12)
= 1 . (13)
= 8.854 * 10-12F/m is the permittivity of free space and is the ion viscosity in Ω cm.
DEA analysis provides information about ion viscosity, cure monitoring, aging, and flow
behavior; and therefore it helps optimization of the processes.
The ion viscosity of the resin shows the curing state and network formation. Dielectric Analysis
(DEA) is the most common way to track the state of resin in real-time during composite
manufacturing in both industrial and laboratory level. The resin is a liquid that loses its viscosity
dramatically when the temperature increases. After reaching the point of minimum viscosity,
the so-called gelation (rubbery) state starts in which the cross-linkage forms in the polymer.
The viscosity increases during the gelation state. Finally, the resin transforms to solid state in
which the viscosity stays constant. At this state, the dipole polarization and ion migration even
at the existence of external electric field stops. DEA is in agreement with the thermo-analytical

Chapter 1: Introduction
44
standard method of ASTM 2038. In this thesis, DEA method is used for real-time cure
monitoring of a thermoset resin (Epikote RIM- 035C, and 037 hardener) in glass and RTM6
resin in carbon FRP manufacturing.
1.11. Testing and inspection of composite product
The final fibre reinforced composite has to be inspected to assure the desired properties.
However, embedding sensors can improve the quality of the final product, still adding
numerous sensors will weaken the composite. Therefore, a few sensors in critical parts can be
the optimum solution. No matter if there is any sensor in composite for production monitoring
or not, the quality check has to be done after production of composites. There are different
quality assurance methods that are briefly introduced in this section.
Visual checkup
There are some defects that can be easily observed by looking at the final composite parts such
as porosity, resin excess, tooling marks, delamination, misplaced fabrics and dimension
mismatches [4].
Ultrasonic
The test is performed with a specific range of sound that is not hearable by a human (>20,000
Hz). The sound wave is sent to the part by a transmitter and received by another unit (through
thickness detection) or by the same transmitter unit (pulse-echo technique). Wide ranges of
defects such as porosity, delamination, and resin surplus area can be detected by ultrasonic
waves. 3D information about the defect location can be obtained. However, a level of skills is
required for accuracy of operation [4].
Tap Testing
Tap testing is a very cheap and common method to detect defects, porosity and delamination in
composite products. Usually, the composite is tapped with a coin and the difference in the noise
volume and pitch is a sign of defect. This technique is fast, cheap and easy, nevertheless, the
judgment of operator about the sound is important. The degree of cure affects also the sound of
tapping, but no certain guess about curing degree can be obtained by this method [4].
Computed tomography (CT)
An x-ray is passed via a transmitter through the composite from one side and detected by a
receiver from the other side behind the part. This method is also known as CT scanning. At the

Chapter 1: Introduction
45
end, a 3D image can be built showing any different types of damage or defects in the composite
parts. The image is accurate about the size and location of the defect and of a high resolution.
This method is very expensive, slow and health hazardous.
Thermography
In this method, the specimen is heated and an infrared camera visualizes the thermal
conductivity of material under test. If there is defect or delamination, the response will be
different from the reference known value. This method can be implemented in a large part and
it is quick. The required equipment is expensive and the detection of delamination or defects
with large diameter compared with its thickness are challenging to be detected [4].
Shearography
In this method, a specimen is deformed by an applied force and the displacement of the
specimen is measured using laser interferometry. The reference displacement is known, and
deviation from the reference could be a sign of damage. The acquired information is very
precise but the equipment is expensive and only the displacement difference can be detected
and not the type and location of damage [4].
Radiography
Seemingly to CT scanning, an x-ray is used to detect defects in this method. Here, the x-ray
will scan different surfaces through the whole thickness of the part. A receiver on the other side
collects the x-ray. Different materials absorb different ratio of x-ray, therefore porosity and
delamination can be detected. Some health precaution should be considered about the x-ray and
the equipment is expensive. The method is simple and quick with a good resolution [4].
Lamb wave testing
Lamb waves are able to propagate through solid materials. A transducer sends a wave from one
side and another transducer will collect the wave from the other side. The changes of amplitude
are correlated to the damage in the composite. Transducers need to be stuck to the part under
the test. The method is applicable for the large part quickly, nevertheless, some defects remain
undetected and if the material is uncured, the wave won’t propagate through that [4].
Electrical testing
The volume and surface resistivity of the composite product can be tested in accordance to
ASTM D257. Preferably a 4-inch disk is placed between two electrodes. A voltage is applied
Chapter 1: Introduction
46
for 1 min and the current is measured. The surface or volume resistivity is calculated based on
the voltage and current values.
The second possible electrical test is the dielectric strength test in agreement with ASTM D149,
IEC 60243. In this test, the electrical strength of the composite material is measured as an
insulator. A higher dielectric strength is a degree of a better insulator. A voltage is applied to
find out the dielectric breakdown of the composite. The breakdown voltage dividing by the
thickness of the specimen will provide the dielectric strength.
Water absorption
Absorption of water by composite material causes aging. The water absorption rate can be
measured in accordance to ASTM C272 in different methods such as 24 h immersion in water
or using a climate chamber for elevated temperature and humidity and maximum percentage
weight gaining. The specimen are dried in an oven and cool down in a desiccator. Then, the
weight of the specimen is measured. The specimen is soaked in deionized water for a different
period of time and the weight is measured at a different time to find out the percent of weight
increase in the specimen.
Thermal analysis
To determine whether the material fails due to thermal stress and for sake of design purposes
the coefficient of linear thermal expansion is measured in accordance with ASTM E 831,
ASTM D 969 and ISO 113569. The height of the specimen is measured at room temperature.
The specimen is heated at the certain rate and using a ThermoMecanical Analyzer (TMA) the
elongation of the specimen is measured.
Another thermal test is Thermogravimetric Analysis (TGA), which is used for determination of
exotherms and endotherms behavior of the material under test, weight loss during heating or
cooling. The test usually is done on polymers, composite, food, rubber and many other
materials. The material under test is heated till it reacts to the heat or its physical state is
changed. TGA simultaneously records the mass changes and the applied temperature. This
measurement is in agreement with ASTM E1131, ISO 11358.
The viscous modulus, elastic modulus and damping coefficient of material is specified by
Dynamic Mechanical Analysis (DMA) in accordance with ASTM D4065, D5279, D4440. The
specimen is clamped between two fixtures. One of them is stationary and the other fixture is
movable. The fixtures holding the specimen are located in an oven. The temperature, frequency
of the movement and the amplitude is set. This method can be used to measure the glass

Chapter 1: Introduction
47
transition temperature (Tg) of the specimen. However, the measured Tg with DMA is marginally
different from the Tg measured by Differential Scanning Calorimetry (DSC).
One of the precise thermal analysis to characterize polymers, elastomers and plastics is DSC.
The specific heat capacity (ASTM E1269-05), glass transition, crystallization, heat capacity,
thermal stability and decomposition temperature can be determined by this method.

49
2 Resin front detection
In this thesis, all the experiments are done by VARI method. In a fully automated composite
manufacturing using Vacuum Assisted Resin Transfer Molding (VARTM) or Vacuum Assisted
Resin Infusion (VARI), the flow front of the resin during infusion is compared to the simulation
results. There are usually a number of inlets and outlets and the infusion process is controlled
over all of the in/outlets. To have the real-time knowledge about the resin front in the laminate
different methods are used. There are some non-embedded and embedded sensing methods to
observe the resin front. The most common methods are explained in this section.
Since in VARI processes, the resin is driven in the fibrous laminate due to the pressure
difference between the infusion source and the ventilation; therefore, one of the most relevant
parameters to monitor the resin front is to measure the hydrostatic pressure of the resin through
the laminate during the infusion process. In this thesis, different types of the pressure sensors
are used in glass and carbon fibre composite to monitor the resin front the pressure gradient in
various infusion processes. The piezoresistive pressure sensors are successfully wire bonded
and flip-chipped on the PCB to measure the changes of pressure in the composite. These sensors
have an operating temperature of -40 to 150°C, and operating pressure of 0 to 1.3bar with the
burst pressure of about 20bars.
2.1. Ultrasound
The Ultrasonic wave with the frequency of 20KHz to 100MHz propagates through the laminate
and displaces the particles around their equilibrium. The orientation of the fibre vibration to the

Chapter 2: Resin front detection
50
direction of wave propagation defines the different types of ultrasonic waves; shear,
longitudinal, lamb wave or Rayleigh.
The ultrasound sender and receiver stay outside of the laminate. There are two different
ultrasound reflection methods, which are commonly used in RTM productions; the direct
reflection and the direct transmission techniques. These methods are shown in Figure 16. In the
direct reflection, only one ultrasonic sensor is used. This sensor sends and receives the acoustic
signal. The recorded data are reflections of the sent signal at the boundary surface of two
different materials, for example, steel (mold material) and fabrics (laminate material). The
direct transmission compromises of one transmitter and one receiver. This method is widely
used to investigate resin flow in RTM process [14] [15] [16]. The ultrasonic sensor produces
an acoustic signal by means of a signal generator. The second sensor detects this signal, which
is already the receiver. The received signal will be transformed into digital form to be stored
and displayed to the user. Both sent and received signals have the sound velocity (determined
by transmission time) and the amplitude of the wave signal are useful to detect the resin flow
during infusion and monitoring the resin cure afterward.
They are applicable on both conductive (carbon) and non-conductive (glass) fibres. The major
disadvantages of this method are the affection of the fibre volume content on the detected
acoustic signals, tooling costs and localized sensing. [17]
Figure 16: Ultrasonic transmitter (red) and receiver (green). The transmitter and receiver are arranged in a) transmission b)
reflection mode.
2.2. Camera
Using a camera to detect the resin front in the mold belongs to the category of the non-embedded
sensing since the camera stays outside of the laminate. A camera is the most common
visualization way to detect the flow front of the resin in the transparent mold (Figure 17). If the
mold is closed double sided the camera cannot be used. Moreover, the resin flow only on the
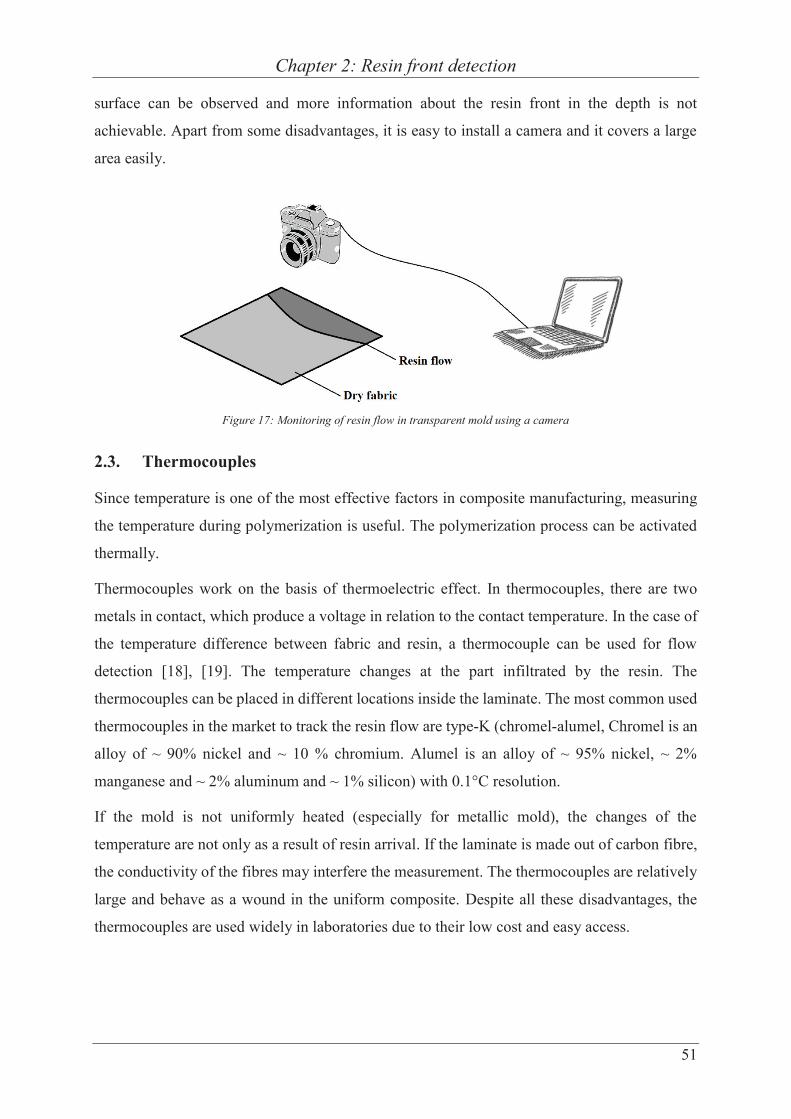
Chapter 2: Resin front detection
51
surface can be observed and more information about the resin front in the depth is not
achievable. Apart from some disadvantages, it is easy to install a camera and it covers a large
area easily.
Figure 17: Monitoring of resin flow in transparent mold using a camera
2.3. Thermocouples
Since temperature is one of the most effective factors in composite manufacturing, measuring
the temperature during polymerization is useful. The polymerization process can be activated
thermally.
Thermocouples work on the basis of thermoelectric effect. In thermocouples, there are two
metals in contact, which produce a voltage in relation to the contact temperature. In the case of
the temperature difference between fabric and resin, a thermocouple can be used for flow
detection [18], [19]. The temperature changes at the part infiltrated by the resin. The
thermocouples can be placed in different locations inside the laminate. The most common used
thermocouples in the market to track the resin flow are type-K (chromel-alumel, Chromel is an
alloy of ~ 90% nickel and ~ 10 % chromium. Alumel is an alloy of ~ 95% nickel, ~ 2%
manganese and ~ 2% aluminum and ~ 1% silicon) with 0.1°C resolution.
If the mold is not uniformly heated (especially for metallic mold), the changes of the
temperature are not only as a result of resin arrival. If the laminate is made out of carbon fibre,
the conductivity of the fibres may interfere the measurement. The thermocouples are relatively
large and behave as a wound in the uniform composite. Despite all these disadvantages, the
thermocouples are used widely in laboratories due to their low cost and easy access.

Chapter 2: Resin front detection
52
2.4. Optical fibre
A fibre optical cable is embedded in laminate and the measured refractive index will change
when the resin flows [18] [20] [21] [22]. Based on Frensel law, between two media with the
reflective indices of n1 and n2, the reflection coefficient of R is calculated by
= ( −+ ) . (14)
The reflective index will change when the density of the medium changes. The relation between
density of the liquid medium and refractive index is driven by Lorentz- Lorentz law − 1+ 2 = . (15)
is the molar refractivity, is the molar mass, is the density of the liquid medium and n
is the reflection coefficient.
The reflected intensity at the tip of the optical fibre is changed by the changes of external
medium reflection. The arrival of the resin and curing of that will change the reflection index
of the external medium, which can be detected by the optical fibre (Figure 18).
The optical fibres have a small outer diameter of 100-200μm. They are very brittle and difficult
to handle and the required tools for measurement are relatively expensive.
(a) (b) Figure 18: (a) The Evanescent and (b)Frensel optical fibre refractometers. The incident light (blue) is reflected
(red) from axial interface in Evanescent and from cross-sectional interface in Frensel refractometers

Chapter 2: Resin front detection
53
2.5. Pressure sensor
The fibre reinforced composite laminates are produced by applying positive pressure for
injection of the resin or negative pressure by vacuum in infusion process like VARI. The dry
fibres are evacuated in an airtight vacuum bag. At this point, the inner pressure of the laminate
is a few mbar. When the inlet of the resin to the vacuum bag gets open, the resin infuses into
the dry fibres and infiltrates the fabrics. When the resin flows, the pressure of infiltrated point
increases gradually. The resin reservoir in an infusion process stays outside of the sealed
vacuum bag and in atmospheric pressure, which is around 1000mbar. Since the pressure varies
by resin arrival in the evacuated fibres, one of the most relevant measurements to detect the
arrival of the resin can be done by means of pressure sensors. Using pressure sensors, both resin
front and hydrostatic pressure of the resin can be measured during the infusion process. The
measured pressure can be used to build an analytical model based on Darcy’s law. In this thesis,
both capacitive and piezoresistive pressure sensors are examined. Here, a short introduction
will be given about each sensor and operating principle of them.
2.6. Capacitive pressure sensor
The capacitive pressure sensors, which are used in this thesis are made by Protron Micro
technique (www.protron-mikrotechnik.de). These capacitive pressure sensors are ultra-small
with the dimension of W x L x H = 0.6 x 1.2 x 0.5mm3 as can be seen in Figure 19. It is made
out of 16 poly-silicon membrane on top of non-conductive fused silica and bottom electrodes.
The sensor works in both barometric pressure (0.3 – 1.3bar) and in touch-down mode for high-
pressure measurement (2 - 8bar). The barometric pressure is around 1000mbar, which is the
atmospheric pressure. Each capacitive pressure sensor has an upper and lower plate. The lower
plate is covered with an insulator layer. In over range pressure, the sensor goes to the so-called
touch-down mode, which means that the upper plate will touch the bottom insulator. Figure 19
shows the wire bonded sensor which is gel-sealed in a ceramic package with the dimension of
2.2 x 3.0mm2.
Figure 19: Capacitive pressure sensor in ceramic housing made by PROTRON Micro technique

Chapter 2: Resin front detection
54
The fabrication steps of the sensor are explained in [23]. An oscillator circuit is designed to
read the changes of capacitance, which is correlated with the pressure changes in the
surrounding environment of the sensor element. The scheme of the circuit is given in Figure
20. In this circuit diagram, the variable capacity is the capacitance of the pressure sensor. When
the capacity of the sensor changes, the capacity C1 in the circuit will change, which results to
change in the output frequency of the NE555. NE555 is a commonly used Integrated Circuit
(IC) in different applications as a timer, oscillator and pulse generation. Here, NE555 works as
an oscillator and the supply voltage, VCC = 5V.
NE555 in astable mode produces continuous rectangular pulses with specific frequencies, this
is calculated by equation 16 = ( ). . ( ) . (16)
Figure 20: An oscillating circuit to detect the changes of sensor capacity
In the circuit diagram of Figure 20, C= C1+C3. C3 is paralleled to C1 to increase the total amount
of C in the equation 16 and consequently reduce the frequency; otherwise, the range of
frequency according to the range of sensor’s capacity (from 5.3 – 6.4pF) was around 250MHz.
Three pressure sensors are embedded in the glass fibre. Figure 21 shows a photograph of the
sensor, a simple scheme of sensors location on the middle plane of 4 layers glass fibres. The
sensors S1, S2 and S3 placed on (x,y) of (4,4), (8,8) and (12,12)cm.

Chapter 2: Resin front detection
55
(a)
(b)
(c)
Figure 21: (a) The capacitive pressure sensor on the PCB having an oscillating circuit (b) location of pressure sensors in
glass fibre composite and (b) scheme of the whole stack during infusion
Afterward, the second half of fabrics were laid on the top and preform is air tightened by 2
vacuum bags and evacuated by a vacuum pump. Main steps of measured changes in sensors
capacitance are listed here:
- When the second half of the glass fabrics are placed in the laminate form, the sensors
showed an increase of the pressure. In fact, the ceramic housing protects the sensors
from the bottom and sides but not from the top. Thus, fabrics are located directly on the
sensor elements. This change is a result of fibres weight and the change of medium
dielectric properties; the medium above the sensor is changed from air to the glass
fibres.
The vacuum bags have sealed the laminate and the air is evacuated. At this step, the
upper half of the fibres is compressed down and deformed the sensor’s membrane.
Instead of measuring a vacuum pressure inside the laminate, the measured signal shows
an increase of pressure. This pressure rise comes from leading the sensor to the touch-
down mode. Deformation of the sensor membranes as a result of fabrics’ compaction is
a reason of reading increase of pressure at the vacuum level.

Chapter 2: Resin front detection
56
- In the next step, resin inlet to the laminate is opened. When the resin infiltrated the
sensors, an increase of pressure is observed, which is mainly due to change of medium
dielectric properties from dry glass fibres to the resin and fibres.
- When the resin is completely cured, there is a slight reduction in the measured pressure.
Generally, the measurement in different phases is affected by the parasitic capacitance
of the medium dielectric properties, rather than changes in hydrostatic pressure of the
resin.
A four-channel digital oscilloscope was used to track the changes of frequency in embedded
sensors.
By having a real-time frequency and equation 16, the magnitude of sensor capacity can be
calculated. Then, using the calibration graph of Figure 22, the corresponding pressure to this
capacitance can be found. Figure 23 (a) – (c) show the changes in pressure vs time during this
measurement.
Figure 22: Calibration graph for capacitive pressure sensor of PROTRON
0
0.2
0.4
0.6
0.8
1
1.2
1.4
1.6
5.3 5.8 6.3 6.8 7.3 7.8 8.3 8.8
Pres
sure
(bar
)
Capacitance (pF)

Chapter 2: Resin front detection
57
(a)
(b)
(c)
Figure 23: (a) Measured pressure by S1, (b) Measured pressure by S2 and (c) Measured pressure by S3
This type of pressure sensor is suitable for measuring the barometric pressure when sensor
operates in the air and surrounding media does not change. The trial demonstrates that the
sensor is highly sensitive to the changes of medium dielectric properties as it is expected from
any capacitor. Moreover, after the evacuation of the laminate, the fabrics are compacted, which
led the sensor to the touchdown mode. Thus, this type of the pressure sensor is not suitable to
be embedded in conductive or non-conductive fibre laminate for resin flow monitoring. Since,

Chapter 2: Resin front detection
58
both the resin flow and resin pressure are in a matter of interest to be monitored during VARI
process, another type of pressure sensor is chosen, the so-called piezoresistive pressure sensor.
2.7. Specification of piezoresistive pressure sensors
First, the term piezoresistive needs to be explained. If a wire with 1m length is stretched by a
factor of 1% there will be two changes in the wire resistance. It will increase 1% higher since
the length is elongated by 1%. Due to an increase of the length, the cross section of the wire is
decreased, which results in an increase of resistance as well. This effect is called piezoresistive
effect. For a wire of length l, cross section A and specific resistivity , the resistance of the
wire R is calculated by equation 17
= = . (17)
V is the volume which is calculated by equation 18 = . (18)
The changes in resistance are driven by equations 19 and 20
= + + = 2 − + , (19)
= 2 − + . (20)
and are a change of the resistance due to the change in geometrical shape and is the
intrinsic effect which comes from the changes of material parameter ( ) due to strain. can
be neglected since the change in volume due to deformation is negligible ( ≃ 0). For
practical application the piezoresistive coefficient has to be measured for each specific material.
There are four resistors on the membrane of a piezoresistive pressure sensor. When the
membrane deforms by surrounding fluid or applied pressure, there is an applied strain which
changes the gauge factor , piezoresistive coefficient. This piezoresistive coefficient is related
to the changes in length and the resistance
= , (21)

Chapter 2: Resin front detection
59
= = = 2 + . (22)
There are not any intrinsic effects in metals and therefore the change of resistivity regarding
strain is zero ( = 0). This means the gauge factoe for metals is = 2. This is while in
semiconductor material like silicon, the strain will change the and there is an intrinsic effect
in the material due to the applied strain.
The piezoresistive effect is used by engineers to design pressure sensors and measure the
applied pressure on the sensor membrane. The piezoresistive pressure sensors are cheap, small
and simple to use in a variety of applications. The mechanical deformation of the sensor
membrane and the induced stress on the thin membrane is correlated to the applied pressure.
The electrical resistance of the piezoresistors will change proportional to the applied pressure,
which can be converted to the changes of the output voltage of the Wheatstone bridge. The
resistance of a piezoresistor will change when the strain changes and it is also in correlation
with the movement of the charge carrier. This is driven by equation 23
μ = ∗ . (23)
μ is the charge mobility, q is the charge per unit of charge carrier, is the free time between
collision of carriers and ∗ is the effective carrier mass in the crystalline lattice [24].
An example for bulk micromachining is piezoresistive pressure sensors. 3D structures are
produced by etching into the silicon substrate by means of Potassium Hydroxide (KOH) or
Deep Reactive Ion Etching (DRIE). Etching the silicon substrate through its thickness will
result in a thin membrane, which deflects when the imposes force of a fluid on that changes.
When the silicon membrane is deflected, both geometry and the specific resistivity will change.
The level of energy in band structure will change due to mechanical deformation. Therefore,
electrons move between the valance and conduction bands and consequently the conductivity
will change.
There are four doped areas on the silicon membrane. In the case of the P-doping, Klongitudinal is
around 121 and Ktransversal is about -112. Boron is a P-type dopant for silicon since it diffuses at
an easily controllable rate. Phosphorus (group V, electron donors, n-type doping), arsenic
(group V, electron donors, n-type doping) and occasionally gallium (group III, electron
acceptors, p-type doping) are also used to dope the silicon. For bulk doping of silicon, usually,

Chapter 2: Resin front detection
60
phosphorus is used, while arsenic is selected for junction doping. There are two different
configurations of the current and strain. If the current and strain are parallel, the configuration
is called longitudinal and if perpendicular it is called transversal. The arrangement of
piezoresistors is shown in Figure 24.
Figure 24: Scheme of a piezo-resistive pressure sensor showing its different parts.
Each resistor on the piezoresistive pressure sensor membrane is a p-doped area of the silicon in
an n-doped membrane. To maximize the deflection by applied force, the membrane is thinned
down to approximately 20μm. 2 resistors are longitudinal and the other two are transversely
aligned to the membrane deformation. After doping the resistors, the interconnection between
resistors and pads will be deposited and structured. The material of interconnect is usually
aluminum. Then the silicon part will be etched by KOH or DRIE and at the last step, the silicon
part will be bonded on the Pyrex part.
The piezoresistive pressure sensors consist of 4 resistors that two series resistors are in parallel
with the other two series resistors. This arrangement of the resistors is a so-called Wheatstone
bridge. One side of the bridge is connected to the voltage source that excites the bridge and
another side is grounded. The scheme of such a bridge is shown in Figure 25. When the applied
force on the membrane area changes, 2 resistors on the Wheatstone bridge will increase while
the other two will decrease. Therefore, the balance of the bridge will be lost and the output
voltage of the bridge will change. By calibrating the sensor in different pressure condition, the
relevant voltage to each pressure can be found.
According to Kirchhoff’s law in a closed loop circuit, the sum of all voltages is equal to zero
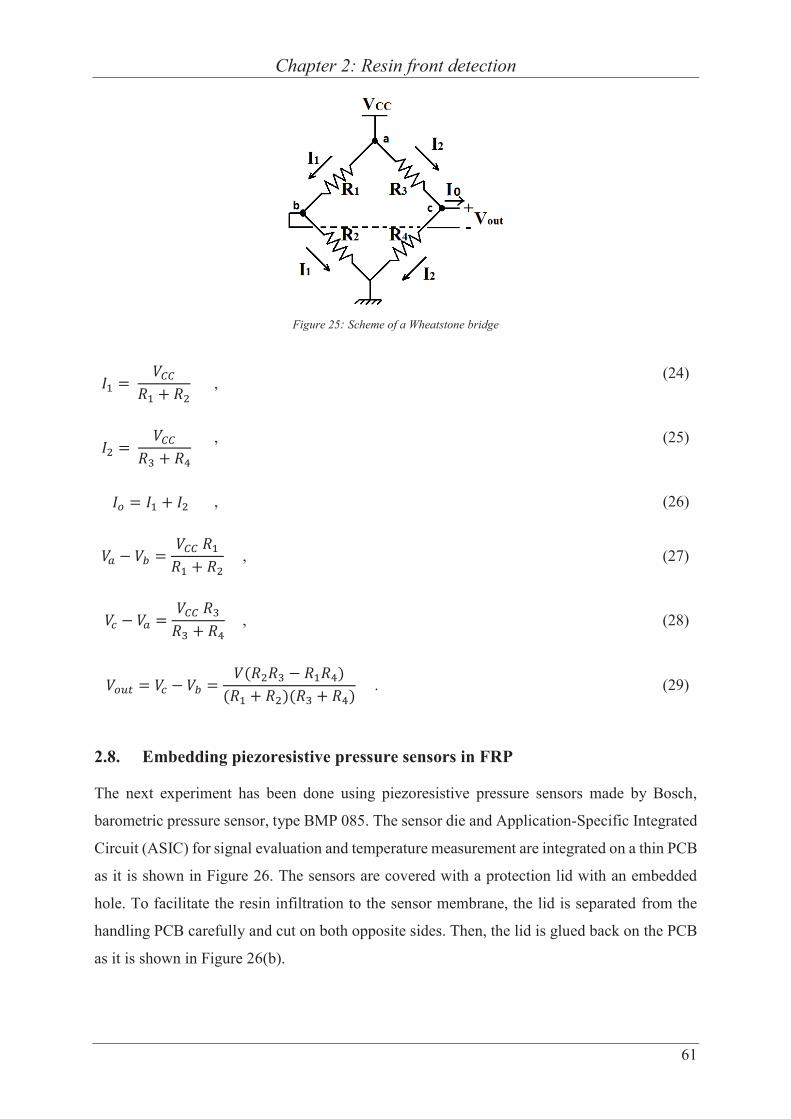
Chapter 2: Resin front detection
61
Figure 25: Scheme of a Wheatstone bridge
= + , (24)
= + , (25)
= + , (26)
− = + , (27)
− = + , (28)
= − = ( − )( + )( + ) . (29)
2.8. Embedding piezoresistive pressure sensors in FRP
The next experiment has been done using piezoresistive pressure sensors made by Bosch,
barometric pressure sensor, type BMP 085. The sensor die and Application-Specific Integrated
Circuit (ASIC) for signal evaluation and temperature measurement are integrated on a thin PCB
as it is shown in Figure 26. The sensors are covered with a protection lid with an embedded
hole. To facilitate the resin infiltration to the sensor membrane, the lid is separated from the
handling PCB carefully and cut on both opposite sides. Then, the lid is glued back on the PCB
as it is shown in Figure 26(b).

Chapter 2: Resin front detection
62
(a)
(b)
(c)
(a) with the protection lid (b) the protection lid is removed and cut on both opposite sides and glued back to the PCB. This way, the resin can flow over the sensor’s membrane. (c) Barometric pressure sensor BMP085 made by BOSCH (the smallest scale is 1mm). The protection lid is removed from the PCB.
Figure 26: BMP085 barometric pressure sensor
Three pressure sensors are embedded in glass fibre and the EPIKOTE RIM 035C resin is
infused. The sensors tracked the vacuum and pressure increment due to the arrival of the resin
inside laminate. When the resin reaches the sensor, the measured pressure increases from the
vacuum level. After closing the resin inlet, the pressure reduced at each sensor points, which is
shown in Figure 27. This measurement shows that the piezoresistive pressure sensors have the
potential to measure in the vacuum and in the liquid resin. This means that the sensors can be
used inside FRP composite in VARI processes to monitor the changes of pressure inside the
laminate.
Figure 27: Monitoring of the resin flow and resin pressure in glass fibre laminate using Bosch barometric pressure sensor
BMP 085.

Chapter 2: Resin front detection
63
Two main disadvantages of Bosch pressure sensor are its operating temperature range of 0–
85°C and the necessity of having a protection lid. The protection lid can be removed, cut and
glued back on the top, but during separation of the lid 40% of the thin PCBs are broken and the
sensor could not be used anymore. Since this is one of the regular product of the Bosch, a try
to get the different product without a lid or only a bare die was not successful. Therefore, all
the other embedding has been done using the pressure sensor die made by the First Sensor
(http://www.first-sensor.com).
The pressure sensor dies of the first sensor are relatively big (1.8 x 1.8 x 1.2mm3), compared to
the die of the Bosch. This choice has to be made since a variety of die connections to different
PCBs are possible by having a single stand die.
2.9. Interconnection techniques
Mainly, there are four different interconnection techniques in electronic packaging: wire
bonding, flip chip bonding, beam lead and tape automated bonding. Wire bonding is the most
common used method since it does not need any special treatment of the chip or bond pads. If
the design changes, this method is flexible to get adapted to new design easily by changing
some parameters. If bonded wires are too long, the bonded chip cannot be used for high-
frequency application, which is a drawback of these methods.
The most common wire materials are gold and aluminum with the diameters of 20 - 80 μm.
Three common wire bonding methods are wedge-wedge ultrasonic bonding, thermo-
compression bonding, and thermo-sonic wire bonding.
Wedge-wedge ultrasonic bonding has a flat-end wire carrying a tool by which the wire is
pressed to the metallic interconnection pad for bonding. The bonding energy comes from an
ultrasonic source and transfers to the wire through the flat-end carrying tool [25]. Using this
method, wires can be bonded to even aluminum pads which are naturally covered by aluminum
oxide. The thin natural oxide is removed by ultrasonic energy and the wire will be bonded to
the interconnection pad.
In thermo-compression methods, as it comes from the name, the required energy for wire
bonding comes from an intensive heat. A capillary tool carries the bonding wire. The intensive
heat will melt the wire at the tip of the capillary tool and create a ball. The ball is carried down
by the tool and placed on the pad to have an interconnect [26].

Chapter 2: Resin front detection
64
Thermosonic bonding generally uses the similar tool as wedge-wedge bonding. The additional
heat supplied more energy besides ultrasonic energy to get stronger bonding [26].
These three methods provide only electrical connection and not mechanical. The wires have to
be protected from mechanical damage.
The second commonly used interconnection method is flip chip bonding. There are different
flip chip methods such as re-flow using solder bumps, thermo-compression and with
Anisotropic Conductive Adhesive (ACA). The re-flow processing by solder bumps is the most
common way among all flip chip techniques. The interconnections by re-flow technique are the
most reliable one. The Under Bump Metallization (UBM) to enable soldering is needed for the
widespread used aluminum pads. The natural oxide layer on aluminum pads cause some
challenges for soldering on them and this layer cannot be removed by solder-enhancing fluxes.
After the re-flow soldering, an under-fill is required to protect the solder bumps from moisture,
mechanical stress, thermal expansion mismatches between the component and to distribute the
forces from only bumps to the larger area.
The next common soldering method is a thermo-compression process. The thermo-compression
bonding is a solid-phase welding process that plastically deforms the weldments (gold bump),
removes the surface contaminations or even surface oxide and provides contact between two
surfaces. The gold stud or gold bumps are placed on one side of the interconnection; either on
PCB or chip side. The high interface temperature and force will result in melting the gold and
join chip to the PCB or packaging. Many chips cannot withstand the high required temperature
(300 – 400°C) and load (~1N per stud bump). Since gold is a noble metal, under-fill for
protection against moisture or corrosion is not required, while some epoxy can mechanically
fix the chip more reliable in packaging or on PCB [27].
Thermo-sonic bonding is invented in 1970 by Coucoulas when he combined heat with
ultrasonic energy. The drawback of thermo-compression bonding was the requirement of the
very high temperature which plasticizes many interconnections, surfaces, packaging and PCBs.
In thermo-sonic bonding, the required temperature is in the range of 125 – 220°C. The
ultrasonic energy removes the contaminations or thin oxide layer and the heat energy will
stabilize the contact. The combination also results in limited ultrasonic energy to keep the die
safe. To have gold stud bumps on the pad, the thin pure gold wire (25 – 50μm diameter) is
pulled out of the capillary tool and melted by a spark to form a gold ball. This gold ball will be
placed on the heated pad which is heated and by means of ultrasonic energy applied by the work
holder [26]. The stud bump can be placed on the aluminum pad since the ultrasonic energy will

Chapter 2: Resin front detection
65
remove the natural thin oxide layer and the pure gold stud bumps will sit on the aluminum
surface.
An alternative flip chip bonding to all discussed methods is using Anisotropic Conductive
Adhesive (ACA). ACA is an epoxy which is filled with small metallic spheres (e.g. Nickel)
coated with a thin insulating layer. By applying small force and temperature, the metal sphere
will be squeezed between two opposite pads and insulation layer will break and provide
electrical connection aligned with the applied force [27]. In this thesis, different interconnection
methods are studied, which are described in sections 2.10 to 2.13.
2.10. Wire bonding on pyralux
The most widespread method to make electrical contact between a chip on a PCB or in the
package is wire bonding. The design and arrangement of pads have more flexibility compared
to all other common methods. Therefore, the first trial has been done by using this method.
To get a fast prototype, a pyralux PCB is fabricated by photolithography in the clean-room. The
thickness of pyralux foil is about 25 μm and double side coated with copper. The fabrication
steps are explained in [12].
Figure 28: A pressure sensor die glued on Pyralux PCB prior to wire bonding.
Figure 28 shows the pressure sensor dies are glued using 2 component epoxy adhesive (UHU)
on the pyralux PCB. The pads on the sensor are wire bonded to pads on the PCB using
aluminum wire and wedge-wedge bonding. Then the bonded wires are protected by HIPEC®
Q1-4939 gel to protect them from breaking out or rupture.
Using negative molding a cap from glass fabric and the RTM6 resin is produced and diced.
This cap protects sensor membrane getting stimulated by the compaction of fibres after the
evacuation of vacuum bags. Ultimately, the sensors are embedded in glass fibre composite and

Chapter 2: Resin front detection
66
resin EPIKOTHE RIM 035C is infused. The results and discussion are already published in
[12].
2.11. Wire bonding on Kapton
The proposed method in section 2.10 has some drawbacks. The PCBs are relatively large and
without top insulation. The protection lid was also large, which influences the natural resin flow
through the fabric. To reduce the size of the embedded sensor, a new PCB made out of Kapton
with the dimension of W x L x T = 6 x 12.5 x 0.09mm3 (LeitOn GmbH, Germany) is used. The
pads of the PCB are coated by the so-called chemical gold (Cu: ~80μm, Ni: > 1.5μm, Au: >
0.03μm). The pressure sensor dies are glued using 2 component epoxy adhesive (UHU). Then,
using wire bonding method the sensor and PCB pads are connected electrically to each other.
To protect the bonded wire from rupturing, they are covered by GE 680 (Kationbond, UV-
curing encapsulant, www.delo.de). This epoxy is UV- curable and turned to be hard after
curing.
Figure 29:A wire bonded pressure sensor die on a KAPTON PCB. The bonded wires are protected by GE 680. A 3D printed
protection lid is glued on top of the sensor.
To reduce the size of the protective lid, compared with the experiment in section 2.10, a 3D
printed lid is used which is shown in Figure 29. The resin for 3D printed cap was Clear resin 1
from FormLabs.
Another major issue in the last measurement [12] was the read-out resolution that comes from
the microprocessor of the Arduino. In this trial, the sensor voltage is read by Labview and the
resolution of 10mbar is achieved.
Four pressure sensors are prepared and calibrated in the vacuum chamber in the range of 20 –
1000 mbar. The calibration method is explained in [12].
A VARI laminate from carbon fibre with totally 4 layers of fabric and 2 component epoxy resin
(EPIKOTE™ Resin MGS® RIMR 035c) is prepared. The laminate had the dimension of 72 x
58cm2. The sensors are laid down on the first bottom layer of carbon fabric and 3 more layers
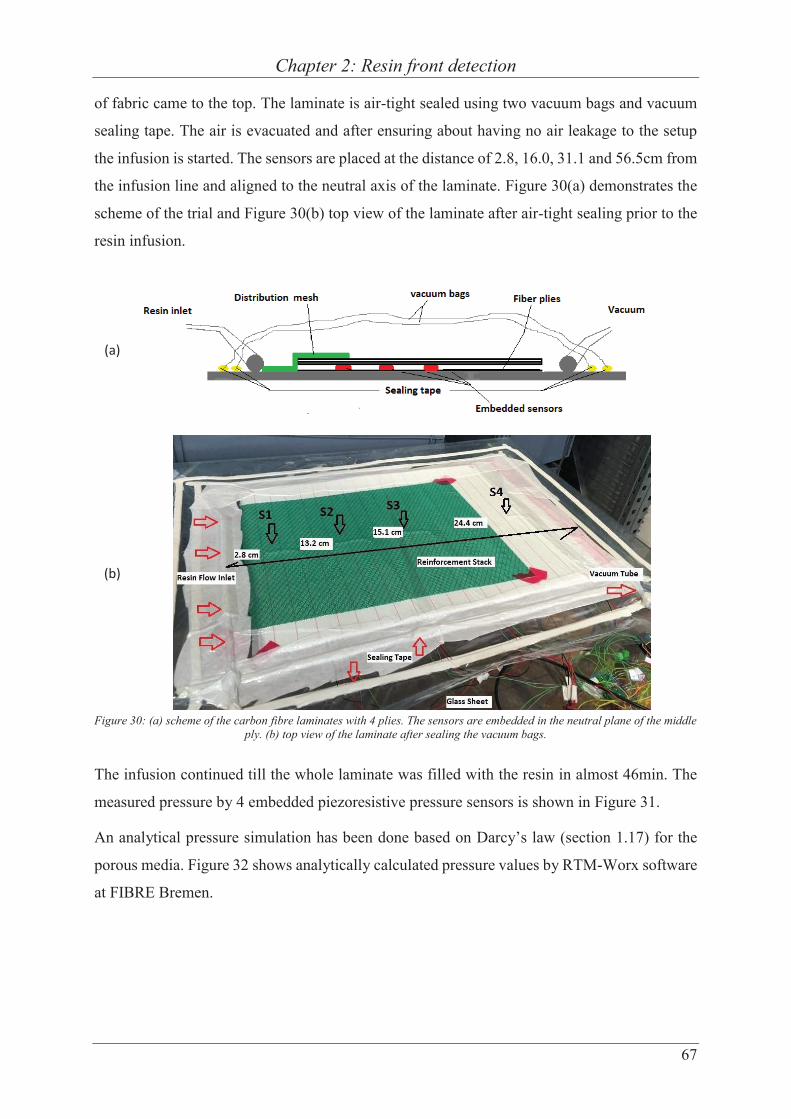
Chapter 2: Resin front detection
67
of fabric came to the top. The laminate is air-tight sealed using two vacuum bags and vacuum
sealing tape. The air is evacuated and after ensuring about having no air leakage to the setup
the infusion is started. The sensors are placed at the distance of 2.8, 16.0, 31.1 and 56.5cm from
the infusion line and aligned to the neutral axis of the laminate. Figure 30(a) demonstrates the
scheme of the trial and Figure 30(b) top view of the laminate after air-tight sealing prior to the
resin infusion.
(a)
(b)
Figure 30: (a) scheme of the carbon fibre laminates with 4 plies. The sensors are embedded in the neutral plane of the middle
ply. (b) top view of the laminate after sealing the vacuum bags.
The infusion continued till the whole laminate was filled with the resin in almost 46min. The
measured pressure by 4 embedded piezoresistive pressure sensors is shown in Figure 31.
An analytical pressure simulation has been done based on Darcy’s law (section 1.17) for the
porous media. Figure 32 shows analytically calculated pressure values by RTM-Worx software
at FIBRE Bremen.
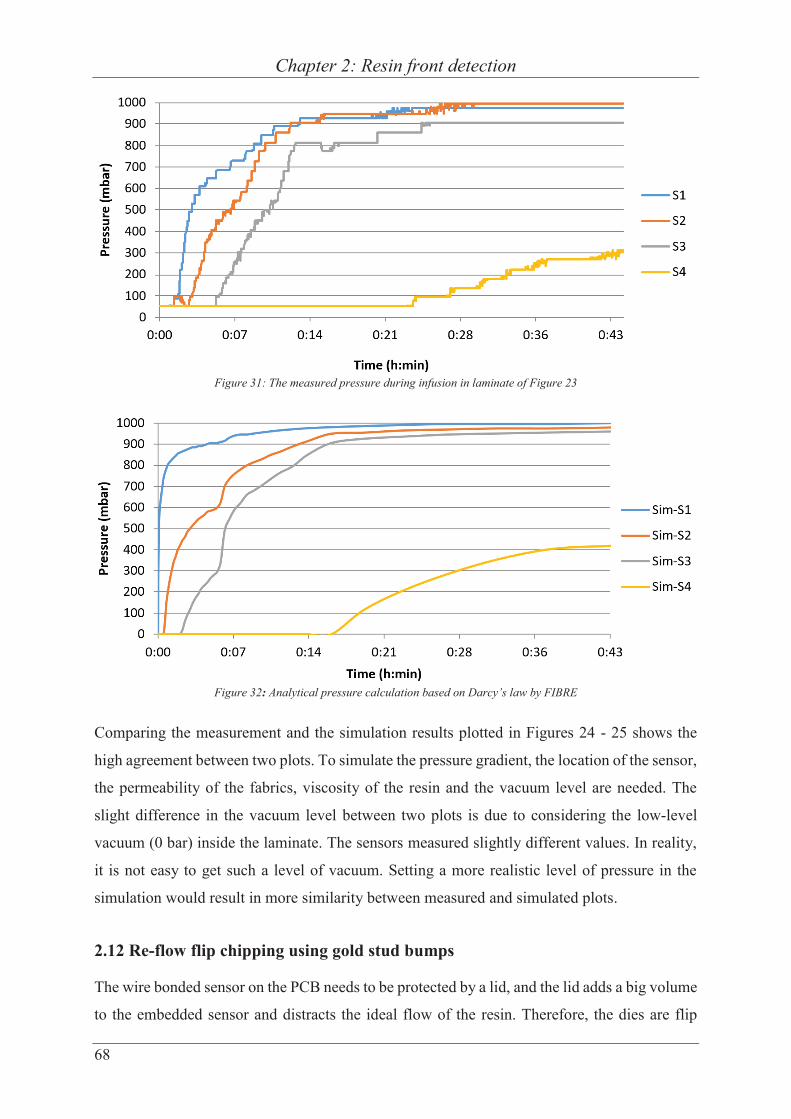
Chapter 2: Resin front detection
68
Figure 31: The measured pressure during infusion in laminate of Figure 23
Figure 32: Analytical pressure calculation based on Darcy’s law by FIBRE
Comparing the measurement and the simulation results plotted in Figures 24 - 25 shows the
high agreement between two plots. To simulate the pressure gradient, the location of the sensor,
the permeability of the fabrics, viscosity of the resin and the vacuum level are needed. The
slight difference in the vacuum level between two plots is due to considering the low-level
vacuum (0 bar) inside the laminate. The sensors measured slightly different values. In reality,
it is not easy to get such a level of vacuum. Setting a more realistic level of pressure in the
simulation would result in more similarity between measured and simulated plots.
2.12 Re-flow flip chipping using gold stud bumps
The wire bonded sensor on the PCB needs to be protected by a lid, and the lid adds a big volume
to the embedded sensor and distracts the ideal flow of the resin. Therefore, the dies are flip

Chapter 2: Resin front detection
69
chipped on PCBs with an embedded hole. The PCB is made out of FR4, with a dimension of
W x L x T = 13 x 5 x 0.2mm3. The PCB pads are coated with the so-called chemical gold (Cu:
~80μm, Ni: > 1.5 μm, Au: > 0.03μm). The PCB’s hole is in the comparable size to the sensor
membrane and via this hole, the sensor membrane will be deflected as the pressure changes in
the surrounding medium.
Stud bumps are placed by tpt multi-wire bonder and directly on the aluminum pads. The bumps
scratch the thin natural oxide layer on the aluminum pads by ultrasound energy and make a
connection to the aluminum underneath the oxide. Prior to placing gold stud bumps, under-
bump metallization , cleaning the aluminum pads with Ar-plasma or etching the thin oxide layer
is not required. The pitches under 100μm are achievable by stud bumping. The pure molten
gold from a 25 μm thick gold wire is placed on the aluminum pad and forms a stud bump as
illustrated in Figure 33(a). To get the similar height at all pads and get rid of the common tails
of the stud bumps, the flattening process using force is suggested [27]. A flattened gold stud
bump is photographed in Figure 33(b).
(a)
(b)
Figure 33: (a) Top view of a pressure sensor die after placing gold stud bumps on the pads (b) A flattened gold stud bump on
aluminium pad
The sensor pads are made out of aluminum. There is a thin natural oxide on this metal. This
natural oxide restricts the selection of solder pastes for re-flow soldering. In this thesis, first,
gold stud bumps are placed on the pads of the sensor. Antimony-bismuth (Sb-Bi) solder paste
is dispensed on PCB pads. Then, the die is flipped and aligned to the PCB using Fine Placer
device. The work holder is heated up which cause melting of solder paste. Figure 34 shows the
temperature profile which is set for the fine placer hot plate. The molten solder paste will
electrically connect the gold stud bumps to the PCB’s pads.
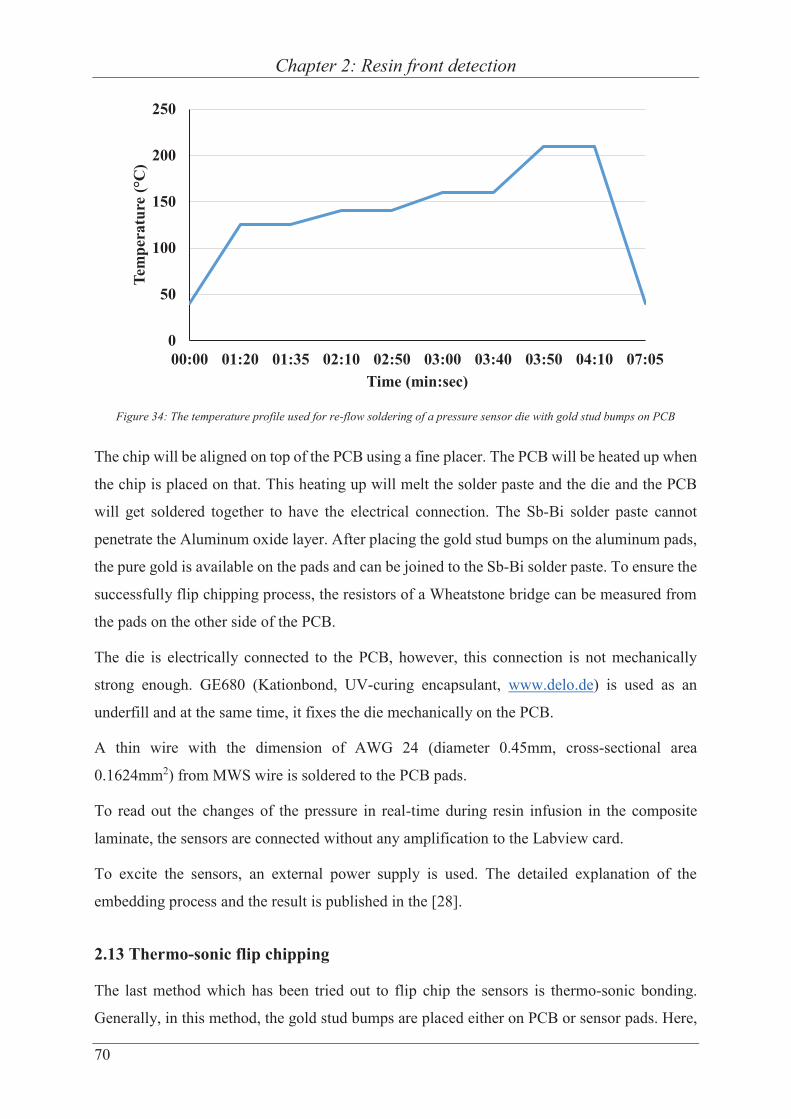
Chapter 2: Resin front detection
70
Figure 34: The temperature profile used for re-flow soldering of a pressure sensor die with gold stud bumps on PCB
The chip will be aligned on top of the PCB using a fine placer. The PCB will be heated up when
the chip is placed on that. This heating up will melt the solder paste and the die and the PCB
will get soldered together to have the electrical connection. The Sb-Bi solder paste cannot
penetrate the Aluminum oxide layer. After placing the gold stud bumps on the aluminum pads,
the pure gold is available on the pads and can be joined to the Sb-Bi solder paste. To ensure the
successfully flip chipping process, the resistors of a Wheatstone bridge can be measured from
the pads on the other side of the PCB.
The die is electrically connected to the PCB, however, this connection is not mechanically
strong enough. GE680 (Kationbond, UV-curing encapsulant, www.delo.de) is used as an
underfill and at the same time, it fixes the die mechanically on the PCB.
A thin wire with the dimension of AWG 24 (diameter 0.45mm, cross-sectional area
0.1624mm2) from MWS wire is soldered to the PCB pads.
To read out the changes of the pressure in real-time during resin infusion in the composite
laminate, the sensors are connected without any amplification to the Labview card.
To excite the sensors, an external power supply is used. The detailed explanation of the
embedding process and the result is published in the [28].
2.13 Thermo-sonic flip chipping
The last method which has been tried out to flip chip the sensors is thermo-sonic bonding.
Generally, in this method, the gold stud bumps are placed either on PCB or sensor pads. Here,
0
50
100
150
200
250
00:00 01:20 01:35 02:10 02:50 03:00 03:40 03:50 04:10 07:05
Tem
pera
ture
(°C
)
Time (min:sec)

Chapter 2: Resin front detection
71
the gold stud bumps are placed on the sensor pads. The PCB pads are covered with chemical
gold. The PCB and chip are aligned on the work table and by means of heat, force and ultrasonic
energy the gold stud bumps are turned to the plastic mode and soldering happens.
First, Kapton PCB with the thickness of 90μm is tried for thermo-sonic bonding of chips. This
PCB consists of two Kapton layers with integrated metallization in between. The Kapton layers
are glued together. The ultrasonic energy and temperature about 170°C has softened the glue
and consequently, those two Kapton layers are moved towards each other. Therefore, the pads
position is not fixed. Another drawback of the Kapton PCB for thermo-sonic soldering is its
natural softness. The stud bumps deformed the pads on Kapton PCB. To conclude, the Kapton
PCB gets soften by heat and deformed by force. Therefore, this type of PCB cannot be used for
thermos-sonic soldering. Figure 35 shows a pad on the Kapton PCB which is deformed by gold
stud under load and during the test for thermo-sonic bonding.
Figure 35: Gold stud bumps deformed the pads on Kapton PCB
The FR4 PCB with chemical gold pads are tried for thermo-sonic soldering. The sensor with
the gold stud bumps on its pad could thermo-sonically flip chip bonded to the rigid PCB.
Nevertheless, the connection was not mechanically strong enough and the membrane of the
sensor has been cracked in some cases by the ultrasonic energy. Thus, this type of the sensors,
cannot be flip chip bonded by thermos-sonic methods. Table 1 gives the thermo-sonic bonding
parameters.
Table 1: Parameters used for thermos-sonic flip chip bonding
Ultra sound energy (mW) 2500 Time of applying ultra sound energy (s) 45 Temperature of hot plate (°C) 170 Force (N) 15

Chapter 2: Resin front detection
72
2.14 Interlaminar shear test on CFRP with embedded piezoresistive pressure
sensors
There are numerous mechanical methods and choosing a method depends on material properties
and available equipment. 3-point bending test in agreement with DIN 2563 is one of the
common static testings [4]. The specimens are prepared using 8 layers of unidirectional carbon
fabrics of type G1157 and RTM6 resin. The composite laminate, after curing of the resin will
be cut to the dimension of 10 x 20mm2. There will be some composite specimens without any
embedded inlays and some others with embedded inlays. Using a hollow template, the inlays
are centered in the volume of the specimen. The failure of composite happens when a crack
initiate and propagated in the composite part. In this study, the embedded inlays are the
predetermined crack initiation point. The specimens have to be pre-conditioned before applying
the mechanical test and this pre-conditioning significantly affects the result. Each specimen is
placed on two rigid supports and the load is applied to the center of the specimen. This is shown
in Figure 36.
(a)
(b)
Figure 36: (a) scheme and (b) photograph of a specimen for inter-laminar shear strength test
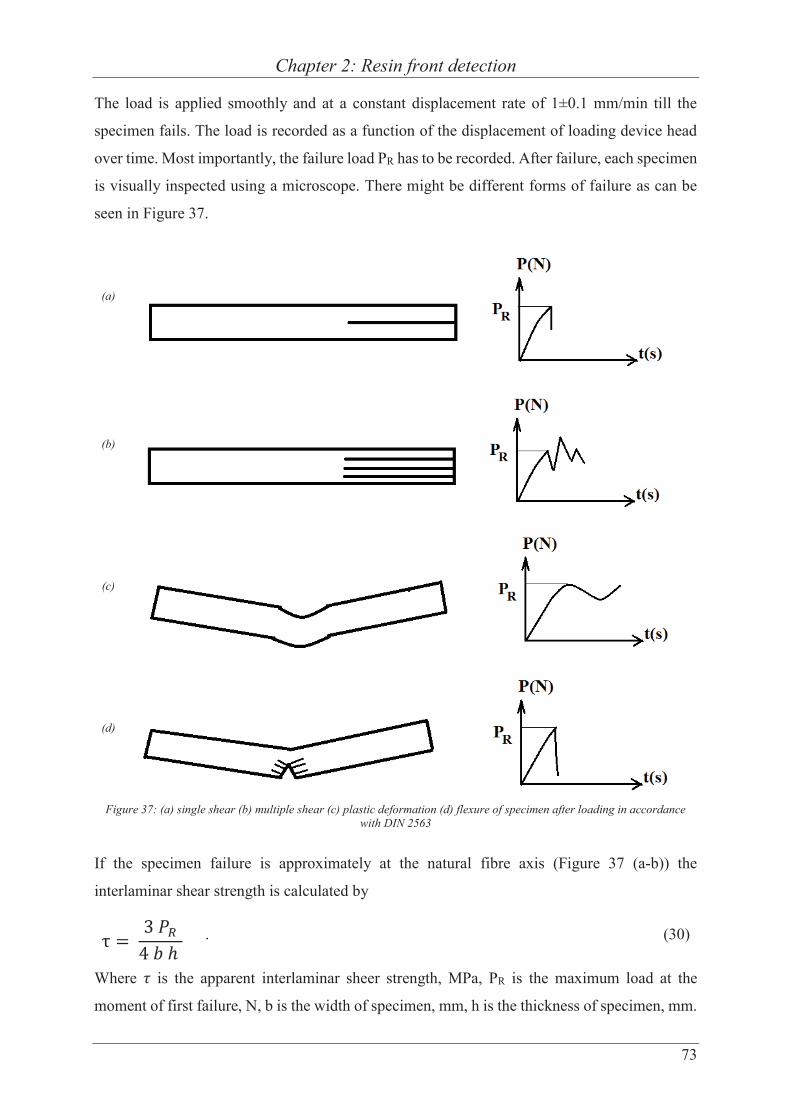
Chapter 2: Resin front detection
73
The load is applied smoothly and at a constant displacement rate of 1±0.1 mm/min till the
specimen fails. The load is recorded as a function of the displacement of loading device head
over time. Most importantly, the failure load PR has to be recorded. After failure, each specimen
is visually inspected using a microscope. There might be different forms of failure as can be
seen in Figure 37.
(a)
(b)
(c)
(d)
Figure 37: (a) single shear (b) multiple shear (c) plastic deformation (d) flexure of specimen after loading in accordance
with DIN 2563
If the specimen failure is approximately at the natural fibre axis (Figure 37 (a-b)) the
interlaminar shear strength is calculated by τ = 3 4 ℎ . (30)
Where is the apparent interlaminar sheer strength, MPa, PR is the maximum load at the
moment of first failure, N, b is the width of specimen, mm, h is the thickness of specimen, mm.
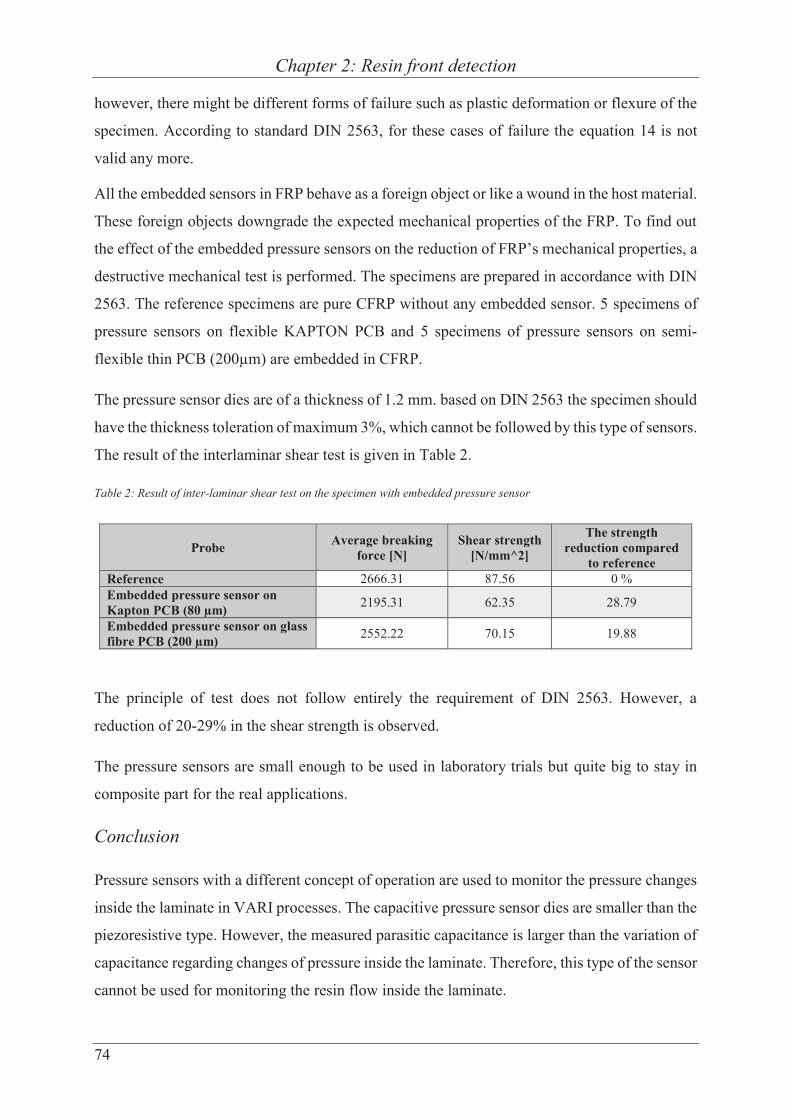
Chapter 2: Resin front detection
74
however, there might be different forms of failure such as plastic deformation or flexure of the
specimen. According to standard DIN 2563, for these cases of failure the equation 14 is not
valid any more.
All the embedded sensors in FRP behave as a foreign object or like a wound in the host material.
These foreign objects downgrade the expected mechanical properties of the FRP. To find out
the effect of the embedded pressure sensors on the reduction of FRP’s mechanical properties, a
destructive mechanical test is performed. The specimens are prepared in accordance with DIN
2563. The reference specimens are pure CFRP without any embedded sensor. 5 specimens of
pressure sensors on flexible KAPTON PCB and 5 specimens of pressure sensors on semi-
flexible thin PCB (200μm) are embedded in CFRP.
The pressure sensor dies are of a thickness of 1.2 mm. based on DIN 2563 the specimen should
have the thickness toleration of maximum 3%, which cannot be followed by this type of sensors.
The result of the interlaminar shear test is given in Table 2.
Table 2: Result of inter-laminar shear test on the specimen with embedded pressure sensor
Probe Average breaking force [N]
Shear strength [N/mm^2]
The strength reduction compared
to reference Reference 2666.31 87.56 0 % Embedded pressure sensor on Kapton PCB (80 μm) 2195.31 62.35 28.79
Embedded pressure sensor on glass fibre PCB (200 μm) 2552.22 70.15 19.88
The principle of test does not follow entirely the requirement of DIN 2563. However, a
reduction of 20-29% in the shear strength is observed.
The pressure sensors are small enough to be used in laboratory trials but quite big to stay in
composite part for the real applications.
Conclusion
Pressure sensors with a different concept of operation are used to monitor the pressure changes
inside the laminate in VARI processes. The capacitive pressure sensor dies are smaller than the
piezoresistive type. However, the measured parasitic capacitance is larger than the variation of
capacitance regarding changes of pressure inside the laminate. Therefore, this type of the sensor
cannot be used for monitoring the resin flow inside the laminate.
Chapter 2: Resin front detection
75
Piezoresistive pressure sensors are electrically connected to the PCB using different
interconnection techniques such as wire bonding, thermo-sonic and re-flow soldering. The wire
bonding is the most flexible and easiest interconnect technique. However, in the case of wire
bonding, a protection lid is required. This lid will prevent the deflection of the membrane due
to the compaction of the textile in a vacuum bag. This protection lid adds an extra volume to
the embedded sensing element, which is a drawback of this method.
To reduce the volume of the embedded sensor and PCB, the size of the PCB is reduced and the
sensor is flip chipped by thermo-sonic and re-flow soldering methods. Since the membrane of
the sensor is around 20μm, increasing of the ultrasound power to get a more mechanically stable
connection, resulted in failing and cracks in the membrane.
The pads and interconnection between piezo resistors on the sensor are made out of aluminum.
Naturally, the aluminum surface is covered with a few nanometers of aluminum oxide. This
thin oxide layer restricts the choices of solder paste for re-flow soldering of the chip on a PCB.
Therefore, a molten droplet of gold using ultrasound power is placed on the sensor pads. The
ultrasound power will remove the aluminum oxide underneath the gold stud and the stud will
be in contact with the aluminum layer. Having gold instead of aluminum oxide provides an
opportunity to choose a variety of different solder pastes. The sensors with a gold stud on their
pads are flipped and re-flow solders to the PCB. This will significantly reduce the volume of
the embedded sensing elements.
The pressure sensors are able to real-time monitor the variation of pressure in glass and carbon
fabrics. The measurement is similar to the simulated pressure gradient, which validates the
precision of the simulation. However, considering more realistic values for the vacuum level,
the permeability of the fibrous mat and resin viscosity can optimize the simulation.


Chapter 3: Monitoring of resin cure
77
3 Monitoring of resin cure
The polymeric resin reinforces the fibres and keeps them in place. The resin itself has low
tensile strength compared with fibres. However, it transfers the load to the fibres and protects
the surface of the final FRP composite from corrosion by chemicals. It also protects the FRP
composite in high-temperature operating temperature. The expected mechanical and chemical
properties are achieved if the resin is completely cured. There is a variety of methods to monitor
the resin cure. In the frame of this thesis, microscale interdigital planar capacitive sensors are
designed, fabricated and tested to measure the curing degree of thermoset resins. The sensors
have a thin polyimide foil as a substrate with the thickness of about 5μm. The substrate is
perforated and therefore the resin will bridge the sensor. The substrate of the sensor is thermally
stable up to 450°C, which enables usage of the sensor for cure monitoring of various resin with
the room- or high-temperature curing requirements. The cured polyimide substrate does not
expand or shrink at high temperature. This is very important since any shrinkage or expansion
will change the sensor geometry and cause cracks in thin film metallization.
The metallization of the interdigital combs is covered with a thin metal oxide grown from the
thin film metallization itself. These sensors can be embedded in electrically conductive fabrics
such as carbon without getting short cut between electrodes.
3.1. Interdigital planar capacitive sensors
The most commonly used periodic electrode architecture is interdigital electrodes. The
electrodes are arranged in an interdigitated structure, which called also periodic, microstrip and
comb structure. The term interdigital comes from the digit-like periodic repeated electrodes in
a plane. They are widely used in microelectromechanical systems (MEMS), chemical sensing,
biology and telecommunications. It is impossible to develop one type of interdigital sensor and
use it in all different counted applications. For each specific application, the design, geometry
and material have to be studied and adapted [11].

Chapter 3: Monitoring of resin cure
78
The main reason for making an interdigital structure is to increase the so-called effective length
and consequently capacitance between combed electrodes. The first issued patent on interdigital
structures belongs to Nikola Tesla in 1891 [29]. He immersed rectangular plates, each behaves
as an electrode in an insulating liquid and discovered that the total capacitance increased almost
linearly by the number of plates. He named that first interdigital capacitive sensor the “electrical
condenser”. Based on his invention, many striped patterns are used in antenna designs [30],
charge flow transistors for monitoring the sheet resistance [31], and countless of biological and
chemical processes [32] and specific application of resin cure monitoring in this thesis.
The dielectric properties of the material under test delivers important information about the
chemical, physical and structural properties of that material. Therefore, the combination of
DEA method with the interdigital sensor and applying a voltage with different frequencies is
the best nondestructive method to analyze the material under test precisely. The fringing field
above the interdigital structure depends on the electrodes geometry and independent from the
frequency.
3.2. Design of microscale interdigital planar capacitive sensor
The main concept of designing microscale interdigital planar capacitive sensors is explained in
[33]. Here, some complementary explanation will be given on designing such a sensor as well
as a different design that has been done and they are not mentioned in the outline of [33].
3.3. Analytical model
The capacitance of the sensor can be calculated analytically based on Igreja method [34], which
is explained shortly here.
Each two neighboring electrodes have different fixed potential, either +V or –V, and therefore
there is and equipotential plane in between with V=0. Figure 38 shows the equipotential planes.
In a parallel plate capacitor, most of the electrical field is a bulk field and only a small part at
the corner is a fringing field. Despite, in the planar capacitor, the main part of the electric field
is a fringing field. Conformal mapping helps to calculate the impedance of such a structure. The
fringing field will transfer to the homogeneous field using conformal mapping. In parallel plate
capacitance, the capacity is calculated by equation 31
= . (31)

Chapter 3: Monitoring of resin cure
79
Figure 38: Planar interdigital capacitor, each two neighboring electrodes have different fixed potential (adapted from [34])
Where C is the capacitance, is the permittivity of the medium or material under test, A is the
area of one plate and d is the distance between two plates.
After conformal mapping, A and d have to be replaced by other parameters that come from the
geometry of the capacitor. The assumption that the thickness of electrodes is much smaller than
the electrode width and the length of the electrode is highly larger than width and spacing of
that is still valid. In our case, the electrode thickness is about 300nm which is much smaller
than the electrode width of 5, 7 or 10μm. In different designs, the electrode length is 2 or 3mm
which is much larger than the width and spacing of 5, 7 or 10μm. This helps to consider the
planar interdigital capacitive sensor as a 2D structure rather than a 3D.
Figure 39 shows the equivalent circuit diagram for an interdigital planar capacitor based on
Igreja model [34]. There is an equipotential surface in which the voltage is zero between each
two neighboring electrodes. The capacitance between each electrode and equipotential plane
on each side of that is interior capacitance, shown by CI; there is another type of capacitance
between the outer electrodes and the equipotential plane, called exterior capacitance, CE.
CE stands for exterior capacity and CI for interior capacity between each electrode and the equipotential surface. The capacitance of both material under test and substrate (sub) are drawn.

Chapter 3: Monitoring of resin cure
80
Figure 39: Equivalent electrical model of a planar interdigital sensor based on Igreja [34].
Using conformal mapping, the equipotential planes are transformed to the horizontal plane and
then by Schwartz-Christoffel transformation to the imaginary plane, where the electrodes are
parallel. Based on Schwartz-Christoffel formulas, the interior and exterior capacitance are
calculated by equations 32 and 33
= ( )( ′ ) , (32)
= ( )( ′ ) . (33)
is the permittivity of the vacuum, is the specific permittivity of the medium which could
be material under test or substrate. represents the complete elliptical integral of the first kind,
is the integral modulus and = √1 − called the complementary modulus.
For an infinite layer, the modulus for internal and external electrodes is calculated by equations
34 and 35
= sin(2 ) , (34)
= 21 + . (35)
is the metallization ratio. The partial capacitance can be calculated by equation 36
= ( − 3) 2 + 2 + . (36)
The equation 36 is valid for any planar capacitance with more than 3 electrodes. Igreja [34]
showed that his model can be used for finite layers and finite and infinite layers on top of
electrodes.
The equivalent circuit for effective impedance measurement representing the capacity and the
resistivity of both substrate and material under test is given in Figure 40. There are exterior and
interior capacity and resistivity for both substrate and material under test. The total effective
impedance can be calculated by equation 37. can be measured from the sensor contact
pads

Chapter 3: Monitoring of resin cure
81
1 = 1 + 1 . (37)
represents the impedance of any sort of gas, liquid or solid phase of material under test.
is the substrate impedance.
Figure 40: The equivalent circuit for impedance measurement considering capacitance and impedance of material under test
and substrate based on Starzyk model [35]
The most common used model for the interdigital sensors is proposed by Igreja [34], in which
he proposes measuring the interior and exterior capacitance of the sensor. Ultimately using
equation 36 the total capacitance of the sensor is calculated analytically. Since, in this thesis,
the interdigital sensors are used for impedance spectroscopy, considering the impedance of both
substrate and material under test is necessary. Since the impedance of both substrate and
material under test are getting measured and they both depend on the frequency. Therefore, in
this thesis, the proposed electrical model for interdigital sensors (IDs) is in agreement with
Starzyk model [35] drawn in Figure 40.
3.4. Choosing suitable material for sensor substrate
A study has been done to find out suitable material as sensor substrate [36], [37]. In that study
[36], materials like polyimide, SU8, conformask 2500, parylene, silicon are tested. Except
silicon, other polymeric substrates are prepared in different sizes of 1.0 x 4.5, 2.0 x 9.0, 2.0 x
2.25, 1.5 x 3.0, 3.0 x 6.0, 6.0 x 12mm2. These substrates are perforated in different patterns as
shown in Figure 41. Each cavity is of a dimension of 15 x 100 μm. Finally, they are embedded
in CFRP with 8 layers of uni-directional carbon fabric type G1157 and the RTM6 resin. All
inlays are placed on the middle layer of the laminate and aligned with the natural fibres
direction. Based on DIN 2563 the 3-points bending test is applied. This mechanical test is also
called inter-laminar shear test. The CFRP pieces with the embedded inlays that show the most

Chapter 3: Monitoring of resin cure
82
similar breaking force to the pure CFRP are the optimum one [37]. This means that specific
inlay concerning its size, material and perforation pattern, which offers less wound effect in the
host material will be selected as the sensor substrate.
Figure 41: Different perforation patterns on the substrates to be embedded in CFRP
Silicon is the most common material in Microelectromechanical Systems (MEMS).
Nevertheless, this material is not a good option to be embedded in CFRP since it is very brittle.
Still, different silicon inlays with a dimension of 3 x 6mm are embedded in CFRP. Three-point
bending test confirms that this material behaves strongly as a wound in CFRP. More
explanation about the specimens and result can be found in [36], [37].
The adhesion between the different flexible substrate and RTM6 is tested by pull and peel test
using XYZ tech multi-testing machine. The result of these tests is reported in [36], [37]. The
result of pull, peel and inter-laminar shear test clarifies that:
- having cavities reduces the wound effect of the embedded inlays in the host CFRP material.
In fact, the resin will fill the cavities and bridge the substrate.
- best inlay size based on shear test is 1.0 x 4.5, 2.0 x 9.0, 2.0 x 2.25, 1.5 x 3.0, 3.0 x 6.0mm.
- the need for high thermal stable material put Parylene C out of our choice.
- having thin substrate leads to minimum downgrading the mechanical properties of the host
material. Therefore, polyimide (5μm) and SU8 (7.5μm) are better than Conformask (32mils)
or silicon (with the thicknesses of 45, 385 and 500μm).
- since polyimide is highly flexible compared with SU8, ultimately, this material is chosen as
a suitable sensor substrate. The cured polyimide shows a very small stress of about -1 MPa.
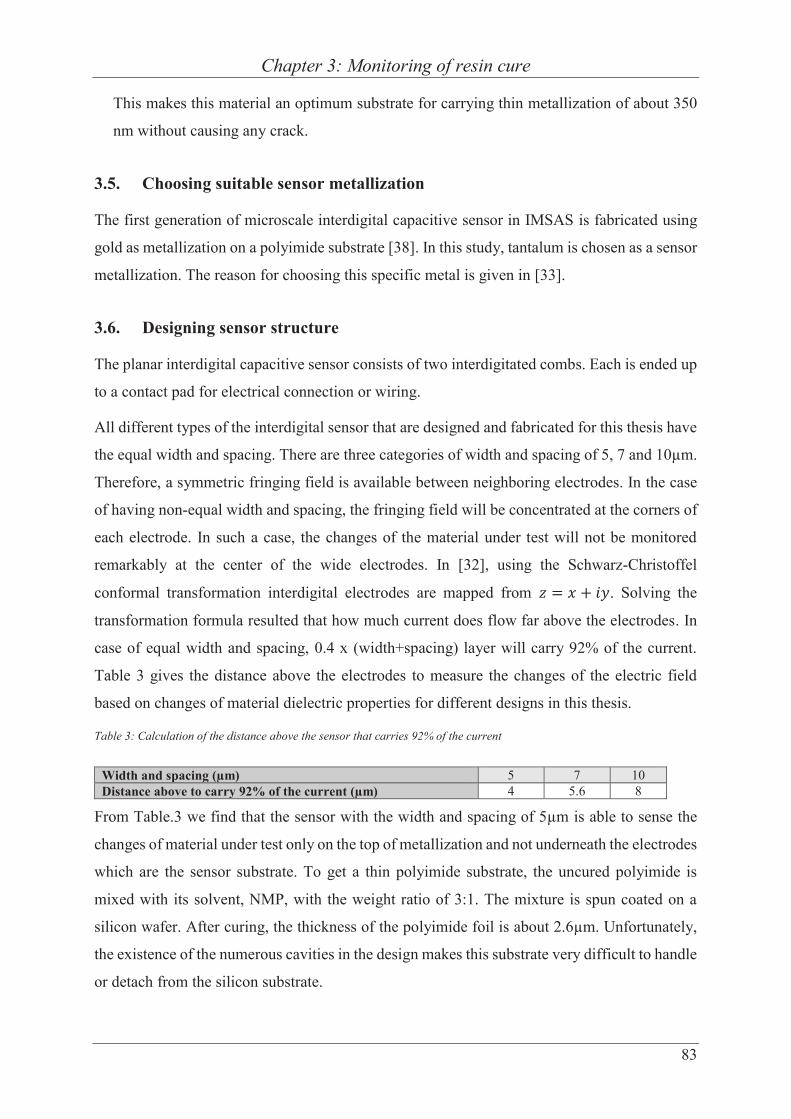
Chapter 3: Monitoring of resin cure
83
This makes this material an optimum substrate for carrying thin metallization of about 350
nm without causing any crack.
3.5. Choosing suitable sensor metallization
The first generation of microscale interdigital capacitive sensor in IMSAS is fabricated using
gold as metallization on a polyimide substrate [38]. In this study, tantalum is chosen as a sensor
metallization. The reason for choosing this specific metal is given in [33].
3.6. Designing sensor structure
The planar interdigital capacitive sensor consists of two interdigitated combs. Each is ended up
to a contact pad for electrical connection or wiring.
All different types of the interdigital sensor that are designed and fabricated for this thesis have
the equal width and spacing. There are three categories of width and spacing of 5, 7 and 10μm.
Therefore, a symmetric fringing field is available between neighboring electrodes. In the case
of having non-equal width and spacing, the fringing field will be concentrated at the corners of
each electrode. In such a case, the changes of the material under test will not be monitored
remarkably at the center of the wide electrodes. In [32], using the Schwarz-Christoffel
conformal transformation interdigital electrodes are mapped from = + . Solving the
transformation formula resulted that how much current does flow far above the electrodes. In
case of equal width and spacing, 0.4 x (width+spacing) layer will carry 92% of the current.
Table 3 gives the distance above the electrodes to measure the changes of the electric field
based on changes of material dielectric properties for different designs in this thesis.
Table 3: Calculation of the distance above the sensor that carries 92% of the current
Width and spacing (μm) 5 7 10 Distance above to carry 92% of the current (μm) 4 5.6 8
From Table.3 we find that the sensor with the width and spacing of 5μm is able to sense the
changes of material under test only on the top of metallization and not underneath the electrodes
which are the sensor substrate. To get a thin polyimide substrate, the uncured polyimide is
mixed with its solvent, NMP, with the weight ratio of 3:1. The mixture is spun coated on a
silicon wafer. After curing, the thickness of the polyimide foil is about 2.6μm. Unfortunately,
the existence of the numerous cavities in the design makes this substrate very difficult to handle
or detach from the silicon substrate.

Chapter 3: Monitoring of resin cure
84
To reduce the active area that carries the combs, the cavities are etched from the spacing
between electrodes. The idea behind having these cavities in the substrate is given in section
3.7. Conclusively, the designed width and spacing are suitable for monitoring the resin curing
in fibre reinforced composite.
In 3.4 the best sizes of the sensor area are suggested. The small sizes diminish the desired
mechanical properties less than the bigger sizes. Even though, the geometry of the sensor cannot
be infinitely small. The reason is the dependency of sensor capacitance on two dimensionless
factors which both come from the geometry of the sensor: metallization ratio, and length of
electrodes, L. The metallization ratio is driven by equation 38. The metallization ratio for all
different types of sensors in this thesis is 50%
= + = 2 . (38)
is the wave length of the sensor which is calculated by equation 39
This wave length is different from the wave length that usually is calculated by dividing speed
of light over wave frequency. Table 4 gives the wave length of sensors in different types.
Table 4: Wavelength of sensors in different designs calculated using equation 24
Width and spacing (μm) 5 7 10 wavelength (μm) 10 28 40
The length of electrodes is much larger than the wavelength of the sensor; therefore, the
electrodes can be considered infinite long (2 or 3mm in different designs compared to 10, 28 or
40μm). Therefore, all the equations in section 3.3 are valid for our designed microscale sensors
proposed in this thesis and in [33]
3.7. Cavities
In the previous study [37], the importance of cavities to reduce the foreign body effect of the
embedded sensor in the host material is proved. Thus, cavities with the length of 50μm are
considered in the substrate and in the spacing between neighboring electrodes. Table 5 lists
more information about the cavities in different designs. It is mentioned in section 3.6. that the
sensors active area which contains electrodes on comb drives cannot be infinitely small.
Therefore, the active areas with the sizes of 3 x 6mm and 2 x 9mm are chosen in this thesis.
= 2 ( + ) . (39)

Chapter 3: Monitoring of resin cure
85
The cavities perforated the active area to make the reinforcement of the sensor in FRP possible.
Moreover, the cavities reduce the size of sensor active area on which the electrodes are located.
Table 5: Different designs of microscale interdigital sensor
Type
Size of
active area (mm
x mm)
Length of
electrode (mm)
Number of
electrodes
Length of
cavity (μm)
Width of electrode
(μm)
Width of
cavity (μm)
Distance between
two neighboring
cavities (μm)
Total number
of cavities
Total cavities
area (mm2)
1 2x9 2 900 50 5 5 50 17,550 4.387 2 3x6 3 600 50 5 5 50 17,700 4.425 3 2x9 2 900 850 5 5 300 1,350 5.737 4 3x6 3 600 1355 5 5 290 900 6.097 5 2x9 2 642 50 7 7 50 12,520 4.382 6 3x6 3 428 50 7 7 50 11,556 4.045 7 2x9 2 450 50 10 10 70 8,775 4.387 8 3x6 3 300 50 10 10 70 7,350 3.375
Some microscope images of different sensor types are demonstrated in Figure 42.
(a) (b) Figure 42: Microscopic image of top view from sensors (a) type 3 or 4 (b) types 1, 2, 5 or 6
There are some designs like type 3 and 4 with a long cavity etched from the polyimide substrate
with the length of 850 or 1355μm. These types of the sensor could not be detached safely from
the handling silicon wafer without rupture. In fact, a very long cavity along the electrodes
downgraded the mechanical stability of the polyimide substrate.
3.8. Fabrication of microscale interdigital sensor
All different designs mentioned in Table.5 are fabricated in the clean-room using silicon wafer
<100> as a handling substrate. Generally, silicon wafers with a diameter of 4 inches and
thickness of 500μm are used as a handling wafer. The wafers have 500 nm thermal silicon
oxide. 50nm titanium is sputtered as an adhesion promoter layer. The next step is sputtering
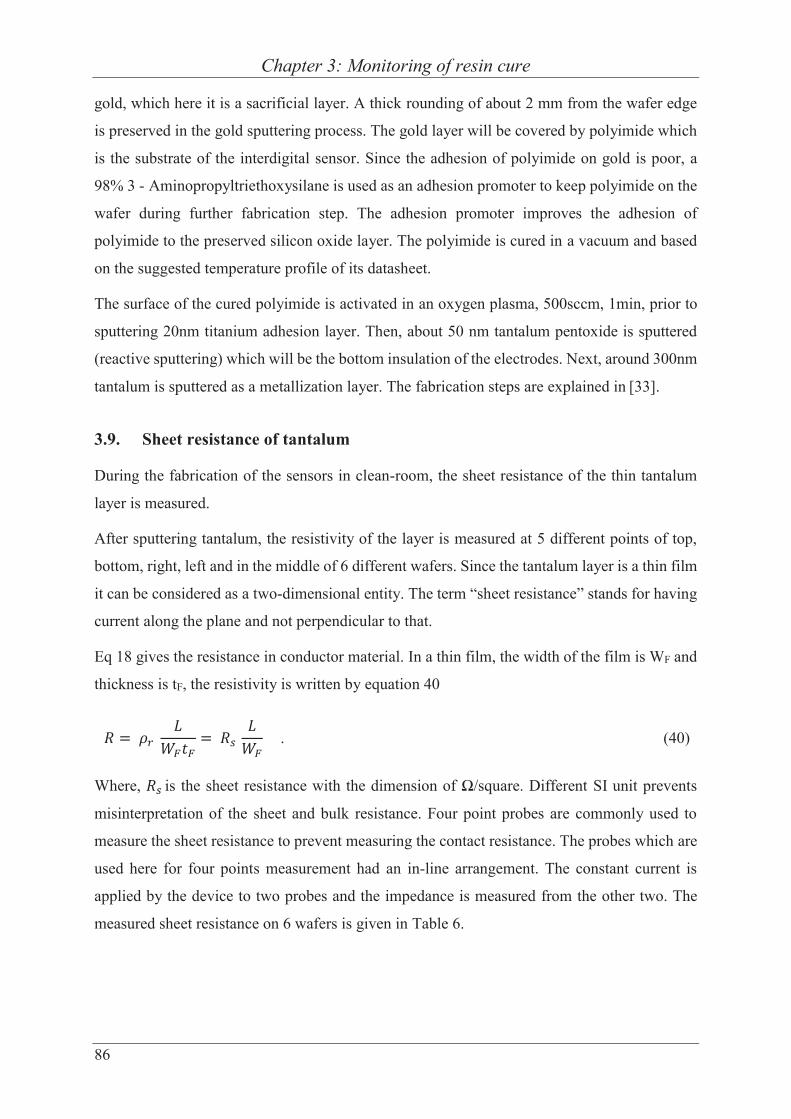
Chapter 3: Monitoring of resin cure
86
gold, which here it is a sacrificial layer. A thick rounding of about 2 mm from the wafer edge
is preserved in the gold sputtering process. The gold layer will be covered by polyimide which
is the substrate of the interdigital sensor. Since the adhesion of polyimide on gold is poor, a
98% 3 - Aminopropyltriethoxysilane is used as an adhesion promoter to keep polyimide on the
wafer during further fabrication step. The adhesion promoter improves the adhesion of
polyimide to the preserved silicon oxide layer. The polyimide is cured in a vacuum and based
on the suggested temperature profile of its datasheet.
The surface of the cured polyimide is activated in an oxygen plasma, 500sccm, 1min, prior to
sputtering 20nm titanium adhesion layer. Then, about 50 nm tantalum pentoxide is sputtered
(reactive sputtering) which will be the bottom insulation of the electrodes. Next, around 300nm
tantalum is sputtered as a metallization layer. The fabrication steps are explained in [33].
3.9. Sheet resistance of tantalum
During the fabrication of the sensors in clean-room, the sheet resistance of the thin tantalum
layer is measured.
After sputtering tantalum, the resistivity of the layer is measured at 5 different points of top,
bottom, right, left and in the middle of 6 different wafers. Since the tantalum layer is a thin film
it can be considered as a two-dimensional entity. The term “sheet resistance” stands for having
current along the plane and not perpendicular to that.
Eq 18 gives the resistance in conductor material. In a thin film, the width of the film is WF and
thickness is tF, the resistivity is written by equation 40
= = . (40)
Where, is the sheet resistance with the dimension of Ω/square. Different SI unit prevents
misinterpretation of the sheet and bulk resistance. Four point probes are commonly used to
measure the sheet resistance to prevent measuring the contact resistance. The probes which are
used here for four points measurement had an in-line arrangement. The constant current is
applied by the device to two probes and the impedance is measured from the other two. The
measured sheet resistance on 6 wafers is given in Table 6.

Chapter 3: Monitoring of resin cure
87
Table 6: Sheet resistance of tantalum thin film with the thickness of about 300 nm
Measuring section
Wafer
number
Middle (Ω/square)
Up (Ω/square)
Down (Ω/square)
Right (Ω/square)
Left (Ω/square)
Average on each wafer (Ω/square)
1 0.0718 0.072 0.0693 0.0695 0.0722 0.0709 2 0.0747 0.076 0.0715 0.0736 0.0764 0.0744 3 0.0710 0.0686 0.0719 0.0693 0.0717 0.0705 4 0.0699 0.0677 0.0712 0.0678 0.0712 0.695 5 0.0708 0.0677 0.0713 0.0689 0.0713 0.0700 6 0.0703 0.0691 0.0719 0.0715 0.0689 0.0703
3.10. Stress measurement
A common method to measure the stress is measuring the substrate curvature before and after
thin film deposition. The total substrate curvature is the sum of a linear superposition of bending
effects coming from each of the deposited films on the substrate. To calculate the superposed
stress of different thin films, the superposition principle of Stoney is used. The Stoney principle
predicts the internal stress value in a sandwich of thin films [39].
To find out the tensile/compression stress of a single sensor imposed by different metallization
layers, the stress of each single film and a sandwich of different metallization layers are
measured.
Double sided polished silicon wafers with the thickness of 385μm are chosen. Since these
wafers are thinner than the commonly used one side polished wafer with the thickness of
525μm, they will better reflect the imposed stress by deposited layers. The bow of the wafers
is measured prior to deposition of each layer in three iterations. After deposition, the bow is
measured and compared with the initial values. The thickness of the deposited layer has to enter
into the software for calculation of the stress.
For fabrication of microscale interdigital sensor, there are different layers of tantalum
(~300nm), titanium (~20nm), tantalum oxide (~50nm), and polyimide (~5μm).
Since almost a decade polyimide is getting used in IMSAS with the known the very low stress
of about -1MPa. Therefore, this compressive stress value is not measured here again.
The measured values are given in Table 7. In microsystem technology all the stresses below
GPa are negligible. Therefore, each single thin film layer and even a sandwich of all
metallization are considered as a low-stress film.
Table 7: The measured stress in different thin films
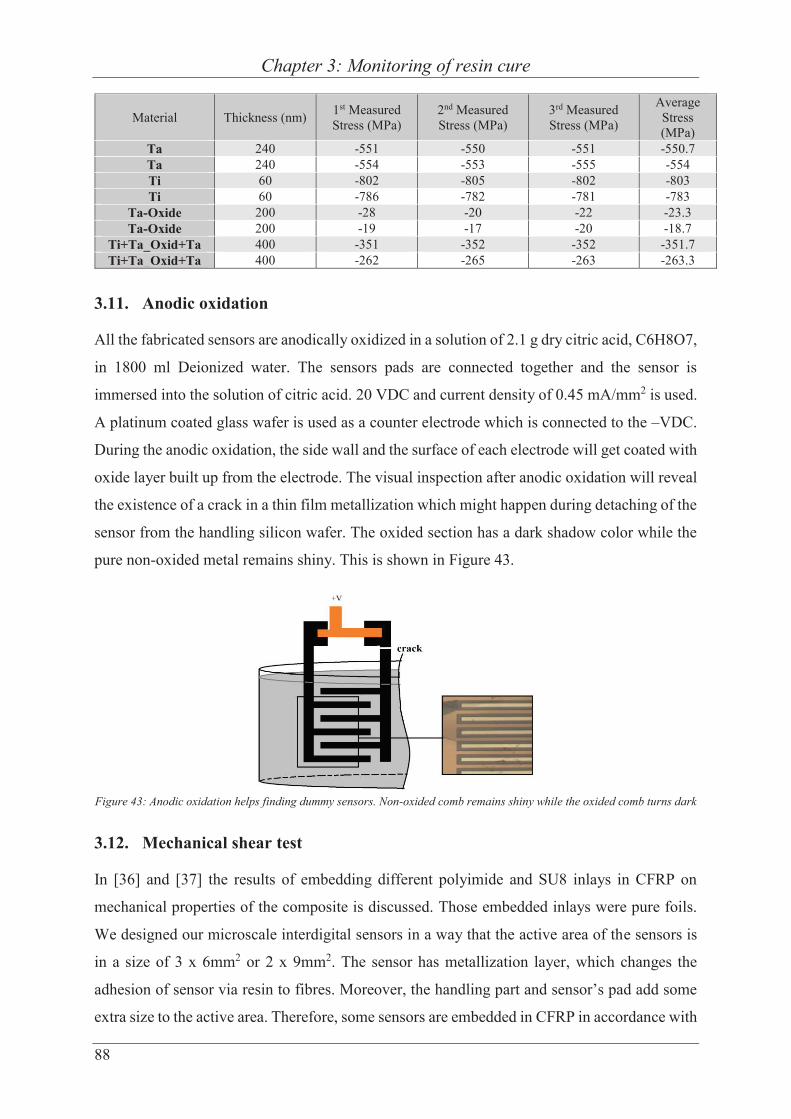
Chapter 3: Monitoring of resin cure
88
Material Thickness (nm) 1st Measured Stress (MPa)
2nd Measured Stress (MPa)
3rd Measured Stress (MPa)
Average Stress (MPa)
Ta 240 -551 -550 -551 -550.7 Ta 240 -554 -553 -555 -554 Ti 60 -802 -805 -802 -803 Ti 60 -786 -782 -781 -783
Ta-Oxide 200 -28 -20 -22 -23.3 Ta-Oxide 200 -19 -17 -20 -18.7
Ti+Ta_Oxid+Ta 400 -351 -352 -352 -351.7 Ti+Ta_Oxid+Ta 400 -262 -265 -263 -263.3
3.11. Anodic oxidation
All the fabricated sensors are anodically oxidized in a solution of 2.1 g dry citric acid, C6H8O7,
in 1800 ml Deionized water. The sensors pads are connected together and the sensor is
immersed into the solution of citric acid. 20 VDC and current density of 0.45 mA/mm2 is used.
A platinum coated glass wafer is used as a counter electrode which is connected to the –VDC.
During the anodic oxidation, the side wall and the surface of each electrode will get coated with
oxide layer built up from the electrode. The visual inspection after anodic oxidation will reveal
the existence of a crack in a thin film metallization which might happen during detaching of the
sensor from the handling silicon wafer. The oxided section has a dark shadow color while the
pure non-oxided metal remains shiny. This is shown in Figure 43.
Figure 43: Anodic oxidation helps finding dummy sensors. Non-oxided comb remains shiny while the oxided comb turns dark
3.12. Mechanical shear test
In [36] and [37] the results of embedding different polyimide and SU8 inlays in CFRP on
mechanical properties of the composite is discussed. Those embedded inlays were pure foils.
We designed our microscale interdigital sensors in a way that the active area of the sensors is
in a size of 3 x 6mm2 or 2 x 9mm2. The sensor has metallization layer, which changes the
adhesion of sensor via resin to fibres. Moreover, the handling part and sensor’s pad add some
extra size to the active area. Therefore, some sensors are embedded in CFRP in accordance with

Chapter 3: Monitoring of resin cure
89
DIN 2563. Figure 44 shows the placement of the sensor on unidirectional carbon fabric G1157
using a hollow template. All sensors are aligned to the natural fibre direction. The laminate is
manufactured by infusing RTM6 and curing at 180°C for around 2h.
Figure 44: Preparing specimens for 3-point shear test in accordance with DIN 2563
The inter-laminar shear test has been done on reference specimens which are pure CFRPs and
on CFRPs with embedded sensors. All the embedded sensors have polyimide substrate,
tantalum oxide bottom insulation, tantalum metallization and cavities on the polyimide
substrate. Different types of the sensor based on different cavities are listed in Table 5. Table
8gives the shear strength values. Since the commercially available IDS from Netzsch is bigger
than the specimen size of 10 x 20mm2 in accordance with DIN 2563, this sensor is not
embedded in composite for the mechanical test.
Table 8: Shear test results on reference specimen (CFRP without embedded sensors) and on specimens with embedded sensors of different types. The types of the sensors are in accordance with Table 5
Probe Average breaking force [N]
Shear strength [N/mm^2]
The strength reduction
compared to reference
Reference 2666.31 87.56 0 % Sensor type 1 2389.4 79.7 8.96 % Sensor type 2 2514.77 82.89 5.33 % Sensor type 3 2445.42 81.56 6.85 % Sensor type 4 2354.13 79.06 9.7 % Sensor type 5 2447.91 81.3 7.15 % Sensor type 6 2479.97 82.55 5.72 % Sensor type 7 2377.94 78.94 9.84 % Sensor type 8 2452.08 82.08 6.25 %

Chapter 3: Monitoring of resin cure
90
The minimum strength reduction of the specimens with embedded microscale IDS belong to
sensors with type 2, 6 and 8 respectively. All these three types have the active area of 3 x 6mm
and the cavities are of a dimension of s x 100μm, in which s stands for spacing of electrodes.
The s for type 2, 6 and 8 is 5, 7 and 10μm respectively.
None of the sensors with the active area of 2 x 9mm2 has been among the three best mechanical
test result. These types (1, 3, 5 and 7) of sensors reduced the mechanical strength of specimen
6.85-9.84% compared to the reference sample.
To conclude, the microscale IDS type 2 with the active area of 3 x 6mm2 and repeated cavity
pattern of 5 x 100μm2 are the best types for been embedded in composite materials.
3.13. Temperature effect on measurement
In this thesis, all the measurement of resin cure by microscale IDS has been done at low
temperature. The maximum temperature that sensor has been through was 70°C. The substrate
of IDS is polyimide. According to polyimide datasheet, the cured polymer decomposes at a
temperature above 450 °C and it does not show any shrinkage or expansion at high temperature.
This means that the sensors can be used for high temperature applications like RTM6 process
[38]. Table 9 gives the measured capacitance from sensor type 2 in the air and in silicone gel at
different temperature and different frequency.
Table 9: Measuring capacitance of microscale IDS type 2 at different temperature and in air and silicone
Frequency
Temperature
Air Silicone
100 Hz 2000 Hz 100 Hz 2000 Hz
25 2.25E-08 1.82E-08 8.30E-08 2.24E-08 40 1.57E-07 1.85E-08 1.68E-10 1.28E-10 65 1.42E-06 2.06E-08 1.74E-10 1.30E-10 80 2.29E-07 1.86E-08 1.83E-10 1.34E-10 95 2.69E-07 1.88E-08 2.43E-10 1.44E-10
110 4.53E-10 1.85E-10 3.17E-10 1.77E-10
Generally, the capacitance decreases by temperature increase in both air and silicone gel
(Wacker). The relative permittivity of air is 1 and silicone gel has a relative permittivity of
2.60334 which remains unchanged in the temperature range of -50 to 200°C.
3.14. A/d Ratio and Csub
To find out A/d ratio and Csub, two media with the known relative permittivity is required. For
this purpose, the measurement is done in air and in silicone gel (Wacker) at a certain frequency

Chapter 3: Monitoring of resin cure
91
of 1 KHz. Since the measurement below this frequency is noisy, the suggested operating
frequency for the microscale IDC is 1 KHz.
Since the sensors type 2, 6 and 8 show the highest compatibility to the host material, the A/d
and Csub for these three types is given in Table 10. The method for calculating these two
parameters is already given in [33].
Table 10: Measuring A/d and Csub for different sensor type
Type A/d (m) Csub (F) 2 0.581 4.10E-12 6 0.749 2.25E-11 8 0.834 7.73E-12
3.14. Comparison between microscale and Netzsch interdigital sensors
One of the objectives of this thesis was to realize a microscale InterDigital Sensor (IDS) sensor
that can measure the dynamic polymerization change in a polymeric resin during FRP
composite production. The sensor has to be designed in a way to withstand the production
process and small enough to remain in the final part. Figure 45 illustrates a microscale IDS in
comparison to the commercially available Netzsch sensor. Both sensors are embedded in GFRP
for cure monitoring of thermoset resin RIM 035c and hardener 037. The specimen containing
sensors is cut and polished. Figure 45 shows a photograph and microscopic images of
microscale vs Netzsch interdigital capacitive sensor. It can be seen in in Figure 45 (c) that the
cavities in the polyimide substrate is filled with the resin. Comparing the scales in the images
shows the successfully miniaturization of the sensor, while both sensors are able to in-situ
monitor the polymerization degree of the resin.
a)

Chapter 3: Monitoring of resin cure
92
Figure 45: (a) Top view of a microscale IDS and a commercial Netzsch sensor Microscopic image of a (b) Netzsch sensor and (c)longitudinal cross section of microscale IDS embedded in GFRP (d) measurement of resin RIM 35 polymerization by
microscale IDC and by Netzsch sensor in GFRP [33]
The measurement of the resin cure [33] admits that the sensor works as well as the Netzsch
sensor, while the miniaturized dimensions of the sensor makes it an excellent alternative to the
commercially available Netzsch.
Conclusion In-situ monitoring the polymerization progress by dielectric analysis (DEA) is the only method
that shows the real-time changes of the resin state during the cure. An interdigital structure is
commonly used for DEA analysis. The commercially available sensors are either attached to
the mold, which providing a very localized information or very large that can be only used in
laboratory experiments. The newly developed miniaturized interdigital planar capacitive sensor
on a perforated substrate has excellent specification such as:
(b)
(c)
(d)

Chapter 3: Monitoring of resin cure
93
- having a miniaturized dimension (3mm x 7mm x 5μm or 2mm x 10mm x 5μm)
- having a perforated substrate to let the resin bridge the sensor and reinforce it inside the
laminate
- having a thin and durable insulated electrodes from the metal oxide grown from the comb
structure to enable usage of the sensors in electrically conductive fibres
- having a high-temperature stable polyimide substrate with the thermal stability up to 450°C
without shrinkage or expansion at high temperature
Each and every part of these aspects makes this sensor a unique option for in-situ cure
monitoring of the resin in the real manufacturing of composite parts and not only at the
laboratory trials.
The result of the mechanical 3-point bending test reveals that sensor type 2 reduces the
mechanical strength of the composite only 5.3%, which is negligible. All types of the
microscale IDSs are able to measure accurately the curing of the resin. Among all the different
designs, type 2 would be suggested as the optimum type by the minimum reduction of the
composite strength compared to the other types.


95
4 IDS on plasticized RTM6
The microscale interdigital sensors (IDSs) are successfully fabricated on polyimide [33]. The
polyimide substrate is perforated to let the resin bridge it as explained in section 3.7.
Nevertheless, the substrate of the sensor is made out of material with a different coefficient of
thermal expansion of 52.7 e-6 /K for RTM6 from Hexcel and 20 e-6 /K for Kapton polyimide
from Du Pont. This results in some thermal and thermo-mechanical stresses in the composite
with the embedded polyimide sensory part.
Some tests have been done to find out another material rather than polyimide as a substrate of
the interdigital capacitive sensor. The idea was having a substrate that survives the fabrication
process but will be melted when the temperature rises in RTM6 processes. Finally, the molten
substrate will be mixed with resin or go out to the resin trap on the way to the vacuum pump
and only the thin film metallization of the sensor will remain in the host material.
To realize this idea, three substrates made out of Poly Styrene (PS), Poly Methyl Methacrylate
(PMMA) and Poly Carbonate (PC) with the dimension of 3 x 6mm2 are prepared. The melting
temperature of PS stands in the range of 210-249°C. PMMA has a softening temperature range
of 47-117°C and PC flows at a temperature above 155°C.
The substrates of PS, PMMA and PC are embedded in 8 layers laminate of unidirectional carbon
fibre type G1157 and reinforced by RTM6 resin and cured at 180°C for about 2h. There were
three blistered parts at the sections with the embedded substrates as it is shown in Figure 46.
(a) (b) Figure 46: (a) Top view and (b) side view of CFRP with the embedded PS (left), PMMA (middle) and PC (right)

Chapter 4: IDS on plasticized RTM6
96
To get a better understanding of what happened to these three materials in CFRP, another
embedding is done in pure RTM6 without carbon fibre. Figure 47 illustrates the RTM6 cube
containing PS, PMMA and PC. The resin is cured at 180°C for about 2h.
Figure 47: Pure RTM6 with embedded PS (left), PMMA (middle) and PC (right). The resin is cured at 180 °C for about 2h
None of these three materials are proper to fulfill our initial goal. PS is stretched, PMMA did
not really get mixed with RTM6 and PC showed highly degassing at high temperature. In the
case of the fabricating sensor on any of these three substrates, during embedding, the drastic
deformation of the substrate will cause a crack in the metallization. In the next step, the
thermoset resin for high-performance application, e.g. aerospace and aviation, Resin Transfer
Molding, type RTM6 is selected to fabricate planar interdigital capacitive sensor on that. RTM6
is a one component neat epoxy resin which belongs to the category of thermosets with an
irreversible curing process. A thin cured layer of RTM6 is highly fragile. It is impossible to
handle a thin cured layer of RTM6 or fabricate a sensor on that. The objective is having a sensor
to monitor the material made out of similar material. Therefore, different plasticizers are added
to RTM6 to make it flexible while it is thin enough to stay in composite with minimal wound
effect and non-destructive measurement.
To ensure that the newly developed plasticized RTM6 is a better option compared to standard
polyimide substrate, the mechanical pulling test is applied to measure the adhesion of both
materials to CFRP cubes, which is studied in [40].
4.1. Plasticizing RTM6 by camphor (C10H16O)
The chemical properties of a polymer can be modified by adding plasticizers. The mixing of a
substance with plasticizer shifts the thermoelastic range to a lower temperature range [41].
Camphor (TH. Geyer) is used as a plasticizer in manufacturing of fireworks and celluloid and
can be used for control of mites and moths. At room temperature, camphor is a white crystalline,
powdery substance which is readily soluble in petroleum ether, ether, acetone, chloroform, and
fatty oils but not in water or glycerol. The melting point of camphor is 175°C [41].

Chapter 4: IDS on plasticized RTM6
97
The different weight ratio of camphor and RTM6 are mixed and cured at different temperatures
and time to obtain a flexible substrate. All the mixtures are degassed in vacuum prior to the
curing process. Table 11 gives some results of mixing RTM6 and camphor.
Table 11: Different mixing ratio of RTM6 and Camphor, curing time and obtained flexibility
RTM6 (g) Camphor (g) Curing T (°C) Curing time (h) Flexibility/breaking 20 1 180 2 Inflexible 10 1 180 2 Inflexible 10 2 180 2 Inflexible 10 3 180 2 Inflexible 5 2 180 2 Slightly flexible 5 3 180 2 Slightly flexible 5 1 180 2 Slightly flexible
2.5 1 180 2 Immediate break 2.5 1.5 180 2 early break 2.5 2 180 2 Slightly flexible 2.5 2.5 180 2 Slightly flexible 2.5 1.4 145 8 Slightly flexible 2.5 2 145 8 Slightly flexible 2.5 2.5 145 8 Slightly flexible 2.5 2.5 145 8 Slightly flexible
1.25 1.5 145 8 Early break 1.25 1.75 145 8 Early break
By curing the mixture at 180°C, the cured mixture had a dark brown color. This could come
from curing in a convection oven and existence of oxygen, or curing at the temperature higher
than the melting point of Camphor. Therefore, the curing temperature is reduced to 145°C and
the time increased from 2 to 8h. The result had similar golden color as the pure RTM6. The
change of the color at high temperature is due to the existence of oxygen. By curing RTM6 at
145°C, the maximum curing degree of 85% can be obtained [42].
The mixture is spun coated on aluminum wafers with speed of 1500rpm, 30s. After curing,
there is surface tension at the edges which makes the peeling of the mixture difficult.
To get a uniform layer of resin mixture on the wafer and be able to detach the cured mixture
easily from the wafer, two release agents and a primer experimented.
4.1.1. Sylgard 184
Sylgard is a silicone elastomer which belongs to primers group. Primers are adhesives which
increase the surface adhesion between two materials [41]. Here, Sylgard is used to get a
homogeneous layer of cured mixture on the wafer. Sylgard is spun coated with the speed of
4000rpm for 30s. It is cured at room temperature after 24h or at 100°C for 30min. The wafers
are pretreated with Sylgard 184 prior to being spun coated with RTM6: Camphor with the
weight ratio 1:1. The SEM image shows a thickness of 20μm after curing on the wafer.

Chapter 4: IDS on plasticized RTM6
98
When the wafer is taken out of the oven after curing process, the cloudy color of the layer shows
the mixing of three substances (RTM6, Camphor and Sylgard 184). Therefore, this primer is
not suitable for our application.
4.1.2. Release agent
Release agents in chemistry are often applied to parts in molding processes to protect them from
sticking to the product. Here, there is no molding process, but the undesired sticking of the resin
mixture to aluminum wafer has to be eliminated. Thus, BGL-GZ-83 and Bayer release agent M
Silicone-based release agents are tried out. In both cases the resin mixture is chemically reacted
with the release agents and a milky layer is observed. In the case of using BGL-GZ-83, the area
with high concentration of the release agent appeared as colored droplets underneath the resin
mixture. This can be seen in Figure 48.
Figure 48: Cured resin mixture (RTM6: Camphor; 1:1 weight ratio). The aluminum wafer is pretreated with release agent
BGL- GZ-83
After unsatisfactory results of using different release agents and a primer, the mixture of RTM6
and Camphor is spun coated on the aluminum wafer without any pretreatment. Even though,
the spin coating speed and time are reduced from 2750rpm and 1 min to 1000rpm and 30s. The
speed is reduced to increase the thickness and expecting to ease the detaching of the cured layer.
Nevertheless, detaching a thick cured resin layer did not get easy.
4.1.3. Variation of mixing temperature
Since the camphor crystalline uptakes water, they usually form a bulk mass. It is hard to break
this mass. The resin has been heated up to 78°C to increase the solubility of camphor mass in
that. This temperature is still below the threshold when polymerization initiates in RTM6 resin.
Apparently, the camphor is solved better in the warm resin and only a few residuals remained
unsolved. During degassing of the mixture by vacuum the mixture was discolored and many

Chapter 4: IDS on plasticized RTM6
99
bubbles were trapped in the mixture. Thus, another temperature rise is not an option for
increasing of the solubility.
4.1.4. Pre-solving of camphor in different solutions
As an alternative to temperature increase, the plasticizer is pre-solved in different solutions
prior to mixing with resin. The selected solutions included Acetone, Buthyl acetate and 1-
Methoxy-2-Propyl-Acetat. The mixture of camphor and solution ultimately is blended with
RTM6 at 55°C temperature. 1.5g of plasticizer is mixed with 0.1g of the solution in each term.
Acetone is evaporated quickly and the remaining camphor powder had smaller grains compared
with camphor crystalline and got better solved in RTM6 at 55°C. The surface adhesion of this
compound was less than the mixture without pre-solving in acetone. After the spin coating is
done, only a semi star-shaped substance in the middle of the wafer was left and all the other
region stayed uncovered. After curing at 145°C for 8 h, only 3 circular regions were found on
the wafer. Therefore, pre-solving with acetone is not suitable.
Camphor is mixed with Butyl acetate (weight ratio 1.5: 0.1 g) and then blended with RTM6 at
the temperature of 55°C. The residuals of the camphor crystallines are observed in RTM6
before and after curing process at 145 °C for 8 h.
The last solution that tried for the pre-solving of camphor was 1-Methoxy-2-Propyl-Acetat with
the weight ratio of 1.5:0.1 (camphor: 1-Methoxy-2-Propyl-Acetat). Compared to Butyl acetate,
a few crystalline is observed after stir mixing of two components. Finally, even after curing at
145°C for 8h a non-homogeneous layer is left on the aluminum wafer. Thus, pretreatment of
camphor with 1-Methoxy-2-Propyl-Acetat is improper.
4.1.5. Sedimentation
The efforts to get rid of the camphor crystalline in sections 4.1.3 and 4.1.4 were not successful.
Therefore, a trial with sedimentation is done to transfer the mixture of camphor and RTM6 to
a syringe and vertically store it at 22°C in UV-extracted light for 24h. All the crystalline are
sediment at the bottom of the syringe and can be drained out. The rest of the mixture in the
syringe is spun coated on an aluminum wafer and cured at 145°C for 8h, which results in a very
smooth surface without any residuals of camphor crystalline. Unfortunately, it is not possible
to measure the real mixed ration of camphor and RTM6, since the drained part from the syringe
contains RTM6 as well.

Chapter 4: IDS on plasticized RTM6
100
The result is a crystalline-free layer. Even though, still the difficulty of detaching of cured layer
from the wafer has to be solved.
Conclusion
To conclude, the proper mixing ratio of RTM6 resin and camphor plasticizer and a suitable time
and curing temperature is found. In all the experiments the aluminum wafer is used since it is
cheaper than silicon wafer and does not break under the applied stress from different resin
mixture. If the mixture of resin and camphor is directly spun coated on the aluminum wafer,
after cutting the cured mixture by scalpel, the mixture will delaminate from the wafer within
24h. Any other try to use a release agent, primer or polystyrene protection film was not
successful. The only way to have a flexible layer of the polymer without camphor crystalline is
sedimentation. However, it is not possible to precisely measure the ratio of resin and camphor
after draining the crystalline from the syringe.
4.2. Plasticizing RTM6 by Dibutyl Sebacate
Dibutyl Sebacate is primarily used as plasticizers in plastics and is also used in cosmetics and
pharmaceutical products. It is a colorless, odorless liquid [41], [40] at room temperature. The
tryout with Dibutyl Sebacate has been done like camphor by finding the optimum mixing ratio.
Table 12 shows the result.
Table 12: Different mixing ratio and curing time of RTM6 and Dibutyl Sebacate
RTM6 (g) Dibutyl Sebacate (g)
Oven Temperature (°C) Curing time (h) Flexibility/breaking
1.5 0.25 180 2 Inflexible 1.5 0.5 180 2 Inflexible 1.5 0.75 180 2 Inflexible 1.0 0.75 145 8 Highly flexible 1.0 1.0 145 8 Slightly flexible 1.0 1.2 145 8 Slightly flexible
The mixing weight ratio of 1:0.75 for RTM6: Dibutyl Sebacate and curing condition of 145°C,
8h results in a highly flexible layer without any residual compared with mixture contained
camphor. To facilitate the mixing process, RTM6 needs to be heated up to 60°C for viscosity
reduction. Then, hand stir mixing for 5min will result in a homogeneous mixture.
Likewise, camphor, to detach the cured mixture easily from the wafer, two release agents and
a primer are tested.
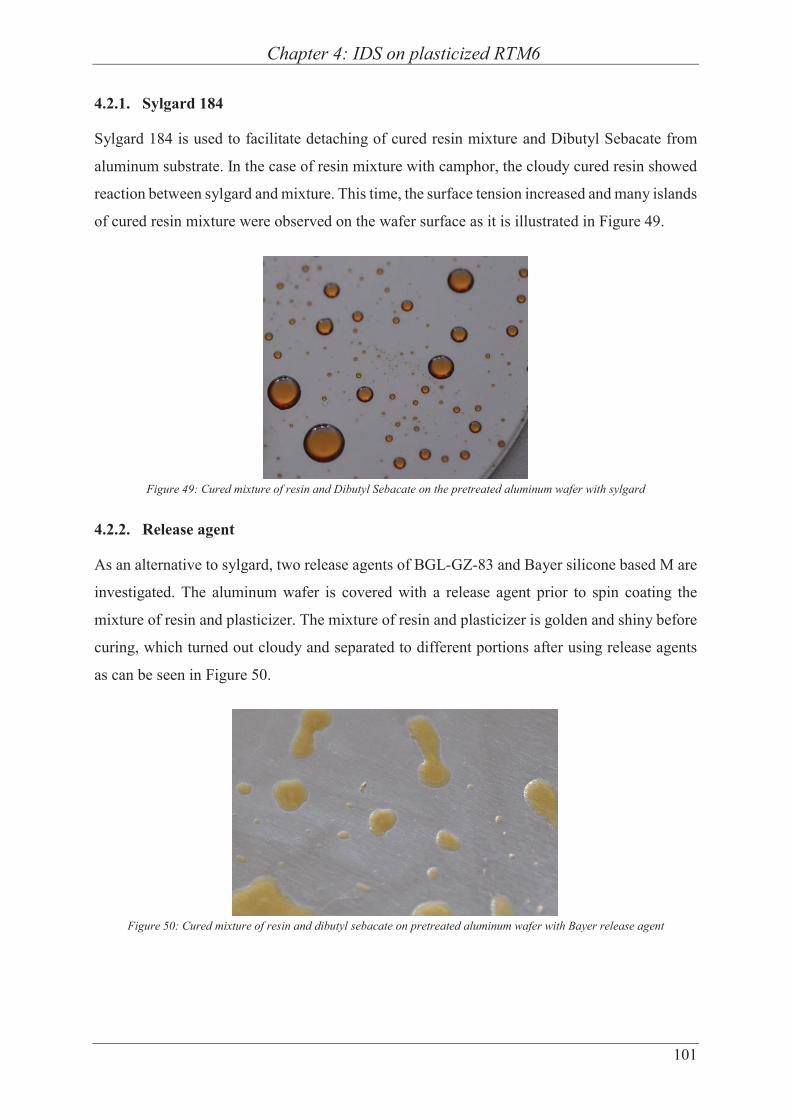
Chapter 4: IDS on plasticized RTM6
101
4.2.1. Sylgard 184
Sylgard 184 is used to facilitate detaching of cured resin mixture and Dibutyl Sebacate from
aluminum substrate. In the case of resin mixture with camphor, the cloudy cured resin showed
reaction between sylgard and mixture. This time, the surface tension increased and many islands
of cured resin mixture were observed on the wafer surface as it is illustrated in Figure 49.
Figure 49: Cured mixture of resin and Dibutyl Sebacate on the pretreated aluminum wafer with sylgard
4.2.2. Release agent
As an alternative to sylgard, two release agents of BGL-GZ-83 and Bayer silicone based M are
investigated. The aluminum wafer is covered with a release agent prior to spin coating the
mixture of resin and plasticizer. The mixture of resin and plasticizer is golden and shiny before
curing, which turned out cloudy and separated to different portions after using release agents
as can be seen in Figure 50.
Figure 50: Cured mixture of resin and dibutyl sebacate on pretreated aluminum wafer with Bayer release agent

Chapter 4: IDS on plasticized RTM6
102
4.2.3. Conformask 2500 or E 8020
Conformask and E 8020 are photo sensible polymers, which are supplied as a foil and can be
laminated on top of PCBs for protection against water and humidity or for photolithography.
These foils are supplied by having a protection film made out of poly styrene. In this thesis, the
conformask is laminated on the aluminum wafer and the protection film is kept after lamination.
This film, later on, will help as a release film. The mixture of RTM6 and Dibutyl Sebacate is
spun coated on the wafer covered with conformask and cured at 145°C for 8h. Using a scalpel,
the desired area can be cut and detach from the poly estyrene protection film as shown in Figure
51.
Figure 51: Cured mixture of resin and Dibutyl Sebacate is peeled off using scalpel from pre-coated aluminium wafer with
E8020
The SEM image in Figure 52 shows the thickness of 10μm of cured resin mixture on the
polystyrene protection film. The mixture was spun coated with 2750rpm, 1min. If the spin
coating speed increases to 3750rpm a layer with the thickness of 1μm can be achieved. This
ultra-thin layer is not mechanically stable enough to be detached from the wafer.
Figure 52: SEM image measuring the thickness of cured mixture of resin and Dibutyl Sebacate on E8020, the mixture is spun
coated at 2750 rpm for 1 min
4.3. Plasticizing RTM6 by Binder EPR 05311
As a further option Bakelite® EPR 05311 is tried. It is provided by the Fibre Institute Bremen,
ev. FIBRE. The Bakelite EPR 05311 is a powder epoxy. It is basically used as a binder in the

Chapter 4: IDS on plasticized RTM6
103
preform processes for producing a semi-flexible composite. This semi-flexibility can be
observed when only a few layers of fabrics are reinforced and the resin is mixed with a binder.
The EPR 05311 is added in two different proportions to RTM6. Similar to the procedure in
FIBRE, RTM6 is mixed with 4% and 10% weight ratio to the binder. Both mixtures are cured
at 145°C for 8 hours. The mixture with 4% by weight is slightly more flexible than the blend
with 10% by weight but still, they are much less flexible compared to combination with
camphor and Dibutyl Sebacate. Thus, both samples show insufficient properties for use as a
flexible layer.
4.4. Mechanical test
A thin layer of the pure resin is brittle after curing, therefore, the fabrication and handling of
sensors are impossible. Many different trials have been done to plasticize a high-performance
thermoset resin, RTM6, which is due to highly cross-linkage after curing is rigid. Now, the
important question is whether this new material really is better compared with standard
polyimide as a sensor substrate? To answer this, the mechanical pulling test is performed.
To prepare the samples for mechanical pulling test, cubes of CFRP is needed. These CFRP
cubes are made out of 8 layers’ unidirectional carbon fibre G1157 and they are reinforced by
RTM6 at 180°C for 2h. The total thickness of the final composite cube is approximately 2.0mm.
The CFRP is cut to the dimension of 5 x mm2.
Two aluminum cubes are also required to fix the sample on the bottom and top. RTM6 is used
on both sides of CFRPs cubes and the substrate under the test is placed centralized in between
two CFRP cubes. Cubes are also glued by RTM6 between aluminum holders as it is shown in
Figure 53(a).

Chapter 4: IDS on plasticized RTM6
104
(a)
(b)
(c)
Figure 53: (a) Schematically drawn of specimens for mechanical pulling test (b) A photograph of CFRPs and aluminium
cube to prepare specimens for pulling test (c) photograph of the specimen in the XYZtech pulling test machine
The upper aluminum cube will be screwed to the pulling test machine and the lower one will
be clamped by the gripper on the bottom of the machine. Figure 53 (b) shows a photograph of
a specimen in the machine right before pulling test. The hook will pull the screw up, till the
sample breaks and the maximum required a force at breaking moment are recorded by the
software. Only the values are considered as a required breaking force in which the sample is
broken at the connection between CFRP cubes and the substrate under the test.
The graph of Figure 54 demonstrates the stress to break the samples with polyimide substrate
in green column. These specimens show early breaking of 0.4 – 1.2MPa. The specimens with

Chapter 4: IDS on plasticized RTM6
105
the embedded mixture of RTM6 and Dibutyl sebacate show an increase in the required breaking
force, which is followed by specimens of pure CFRP cubes as a reference value.
Figure 54: Breaking forces for specimens with embedded polyimide (PI), mixture of RTM6 and Dibutyl Sebacate and
reference samples (only two CFRP cubes) [40]
4.5. Glass transition temperature of plasticized RTM6
DSC is performed to investigate whether the newly developed material fulfills the requirements
of thermal stability during composite production. The TG of the pure RTM6 as a reference and
the mixture of RTM6 and Dibutyl Sebacate with the mixing ration of 1:0.75 is measured. The
TG of pure RTM6 by curing at 160°C for 8h stands at 196.5°C; while the TG of RTM6 mixed
with Dibutyl Sebacate cured in similar condition is slightly reduced to 168.7°C.
4.6. Screen printing interdigital structure
To prepare the substrate made out of RTM6 and Dibutyl Sebacate a mold using two component
silicone (smoothonic) is prepared. The mold has a rectangular cavity with W x L x T of 1.5 x
1.5 x 0.045mm3. The mold is filled with the resin mixture. The resin mixture has to be cured in
a convection oven at 155°C for 8 h. It is very easy to remove the cured resin mixture from the
silicone mold. When the resin is solidified, an interdigital structure is printed on that using a
manual screen printing machine with a plastic screen from SEFAR (PCF FC 180-27-Y-PW).
The conducting silver paste KA801 (Du Pont) is chosen for interdigitated combs. After screen
printing, the silver paste is cured in a convection oven at 135°C for 15 min. A photograph of
such a printed interdigital structure is shown in Figure 55.

Chapter 4: IDS on plasticized RTM6
106
Figure 55: Printed interdigital planar capacitive sensor using silver paste on a plasticized RTM6 with Dibutyl Sebacate
substrate. The smallest scale is in mm.
4.7. Measurement in glass fibre
The sensor is wired using single copper core AWG 26 (MWS Wire Industries) and silver filled
one component epoxy from Panacol EL3012. The sensor is placed in an aluminum petri dish
and on top of a glass fabric. Another layer of glass fabric is placed on top of the sensor. The
mold is filled with 15 ml RTM6. The preform is compacted using the second aluminum petri
dish on the top and 400g weight. The setup is heated up on the hot plate to 150°C for 2h.
For all thermoset resins, the viscosity of the resin drops by temperature increase, till the resin
riches the point of minimum viscosity. Then, the polymerization starts which results in an
increase of viscosity and gelation. Ultimately, the resin will turn to be solid and this is an
irreversible chemical change [33]. The curing process of RTM6 and RIM 035C is already
monitored with microscale interdigital sensors which are reported in [33], [38] The
measurement of curing RTM6 shown in Figure 56 is similar to that two measurements which
prove that the measurement is done properly.
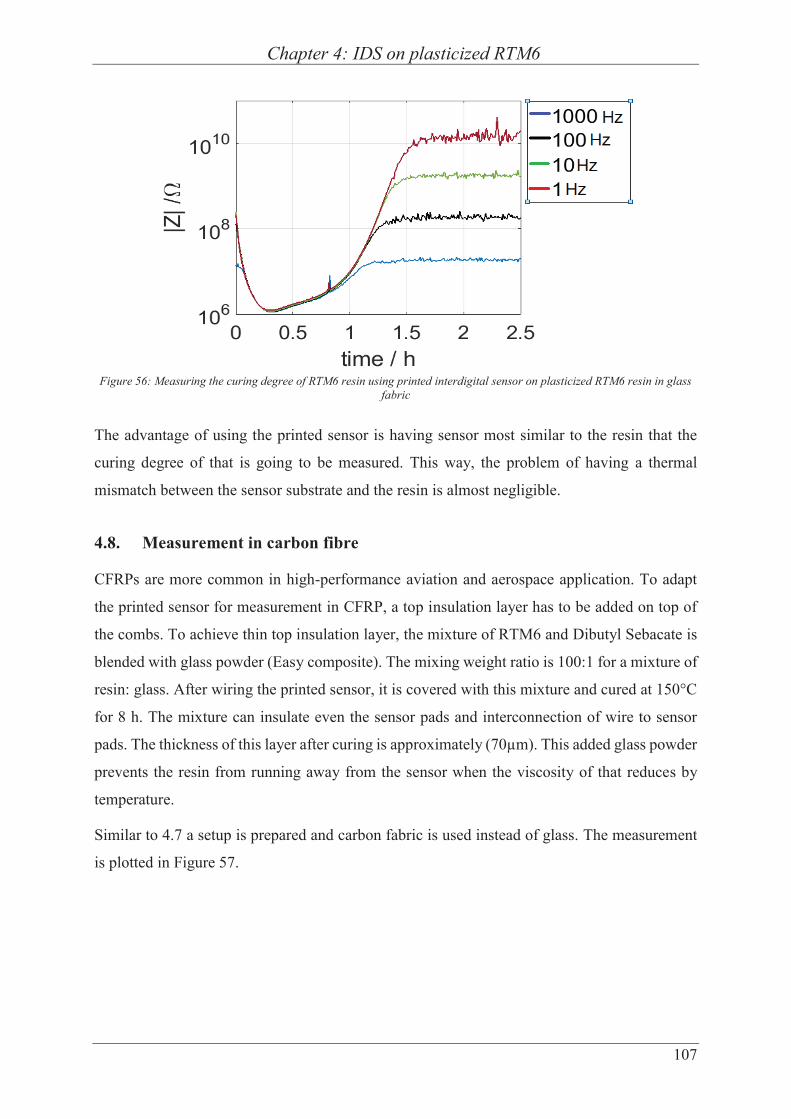
Chapter 4: IDS on plasticized RTM6
107
Figure 56: Measuring the curing degree of RTM6 resin using printed interdigital sensor on plasticized RTM6 resin in glass
fabric
The advantage of using the printed sensor is having sensor most similar to the resin that the
curing degree of that is going to be measured. This way, the problem of having a thermal
mismatch between the sensor substrate and the resin is almost negligible.
4.8. Measurement in carbon fibre
CFRPs are more common in high-performance aviation and aerospace application. To adapt
the printed sensor for measurement in CFRP, a top insulation layer has to be added on top of
the combs. To achieve thin top insulation layer, the mixture of RTM6 and Dibutyl Sebacate is
blended with glass powder (Easy composite). The mixing weight ratio is 100:1 for a mixture of
resin: glass. After wiring the printed sensor, it is covered with this mixture and cured at 150°C
for 8 h. The mixture can insulate even the sensor pads and interconnection of wire to sensor
pads. The thickness of this layer after curing is approximately (70μm). This added glass powder
prevents the resin from running away from the sensor when the viscosity of that reduces by
temperature.
Similar to 4.7 a setup is prepared and carbon fabric is used instead of glass. The measurement
is plotted in Figure 57.

Chapter 4: IDS on plasticized RTM6
108
Figure 57: Measuring the curing degree of RTM6 resin using printed interdigital sensor on plasticized RTM6 resin in glass
fabric
Since the measurement is done in a convection oven next to a climate chamber, there are some
noises due to turning on/off the fans of these two devices.
Conclusion
To integrate an identical sensor to CFRP, the high-performance application resin type RTM6 is
selected to be plasticized. A thin cured layer of RTM6 resin is brittle, on which a sensor cannot
be fabricated or handled. The resin is mixes with three different plasticizers and the best mixing
ratio and curing time and temperature is find out. The best result obtained by mixing RTM6
with Dibutyl Sebacate, by weight mixing ratio of 1:0.75 and curing at temperature 145-160°C
for 6-8h. this results a highly flexible substrate.
To detach the cured flexible resin from the aluminium wafer, different primers and two release
agents are examined. Ultimately, a negative mold using silicone solved the detaching problem.
An interdigital structure is screen printed on the flexible resin substrate. The curing degree of
RTM6 in glass fibre is successfully measured with this sensor. The active area of the sensor is
coated with a thin layer of plasticized resin: glass powder with the weight mixing ratio of 100:1.
This layer works as an insulator and enables the measurement of RTM6 curing in CFRP.
Adding plasticizers decreases the glass transition temperature of polymers. This fact happened
about our newly developed flexible RTM6. The Tg of plasticized polymer decreased to 168.7°C
by curing at 160°C for 8h. More investigation can be done to find different plasticizer that
minimally reduces the Tg.

109
5 Conclusion and outlook
The focus of this thesis was the application of different sensors for online process monitoring
of composite manufacturing. The vacuum assisted resin transfer infusion (VARI) processes
with glass and carbon fibres are investigated in the scope of this thesis.
The first focus of this thesis was to find a suitable pressure sensor to measure the hydrostatic
pressure of the resin in VARI composite manufacturing. The capacitive and piezoresistive
pressure sensors are investigated. The capacitive pressure sensors are mainly affected by
dielectric properties of the surrounding media. Therefore, the measured parasitic capacitance
was bigger than the changes in capacitance due to the pressure changes. The piezoresistive
pressure sensors with different interconnection techniques are embedded in glass and carbon
fibre laminate to detect the resin front and measure hydrostatic resin pressure in real-time. The
chosen piezoresistive pressure sensor dies are of a dimension of 1.8 x 1.8 x 1.2 mm3. At the
time of choosing pressure sensor, there was not any other possible option to work in clean air
and fluid. Different PCBs with thicknesses of 45-200 μm are used. Still, some optimization to
the PCB size can be done to make them smaller. Moreover, there might be smaller dies
commercially available.
Since the specifications of each sensor chip are slightly different from the others, each single
chip has to be calibrated from vacuum to atmosphere pressure. Using LabVIEW for data
acquisition the resolution is of 10 mbar. The sensors are wire bonded and flip-chipped on the
PCB and both methods are examined in glass and carbon fibre laminate production in a VARI
process. The wire bonded sensors on PCBs require a protection lid. This lid prevents fibres to
sit on the sensor membrane due to compaction of the laminate in a vacuum. This protection lid
adds extra volume to the embedded sensing element. Therefore, sensors are flip chip bonded to
the PCB to eliminate the need for the protection lid and reduce the volume.
110
The second focus of this thesis was fabricating microscale planar interdigital capacitive sensors
for in-situ cure monitoring of the thermoset resins in glass/carbon FRPs. Some commercial
planar interdigital capacitive sensors are available for in-situ cure monitoring of the polymeric
resins. These sensors are either attached to the mold that provides only localized information
about the resin state; or too large that only can be used in laboratory trials. In this thesis,
microscale planar interdigital capacitive sensors are designed and fabricated in the clean-room
environment. The microscale sensors have a perforated polyimide substrate with the thickness
of around 5 μm. Since polyimide is thermally stable up to 450 °C and the sensor’s metallization
is covered with a thin oxide layer. Therefore, these sensors can be used in a variety of composite
manufacturing processes regardless of curing temperature of the resin and electrically
conductivity of the fibres. The 3-point bending test shows that the sensors are small enough to
remain in composite with negligible downgrading the mechanical properties of the product. The
sensors are extremely smaller than the available commercial sensors. However, the interconnect
techniques need to be miniaturized.
Ideally, to eliminate the wound effect of integrating different materials, the embedded sensor
in fibre reinforced polymer composites should be made out of the identical fibres or resin. In
this thesis, the high-performance resin for aerospace and automobile industry, type RTM6, is
mixed with different plasticizers. A thin layer of pure resin is brittle after curing and therefore
it cannot be used as a substrate for any sensors. Adding suitable plasticizer a thin and flexible
resin substrate is developed for the first time. The interdigital structure is screen-printed on this
substrate. The adhesion test proves the better integrity of this new polymer to the CFRP than
the primarily used polyimide. More miniaturization of this type of sensor can be done as a future
task.
In fact, adding plasticizer has reduced the glass transition temperature of the mixture of resin
and plasticizer compared to the pure resin. More investigation to find another plasticizer would
be suggested.

111
References
[1] Scott M. Rossell, Fluid flow modelling of resin transfer molding for composite material wind turbine blade structures, Montana state university, 2004.
[2] G. Andrew, Optimization of resin infusion processing for composite materials: simulation and characterization strategies, University of Stuttgart: Institute of aircraft design, 2011.
[3] E. E. Gdoutos, K. Pilakoutas und C. A. Rodopoulo, Failure Analysis of Industrial Composite Materials, McGraw-Hill Professional, 2000.
[4] „Guide to Composites,“ Gurit SP. TM, Report Number: GTC-3-0509.
[5] A. Johnston, An integrate model of the development of process-induced deformation in autoclave processing of composites structures, PhD Thesis, Vancouver, Canada: The University of British Columbia, 1996.
[6] R. S. Dave und A. C. Loos, Processing of Composites, Munic: Hanser, 2000.
[7] M. K. Yoon, J. Baidoo, J. W. GILLESPIE JR und D. Heider, „Vacuum Assisted Resin Transfer Molding (VARTM) Process Incorporating Gravitational Effects: A Closed-form Solution,“ Journal of COMPOSITE MATERIALS, Bd. 39, Nr. 24, pp. 2227- 2242, 2005.
[8] T. Kruckenberg und R. Paton, Resin Transfer Moulding for Aerospace Structures, Kluwer Academic Publishers, 1998.
[9] H. P. G. Darcy , „Les fontaines publiques de la ville deDijon“. Dalmont , Paris 1856.
[10] A. E. Scheideeger, The Physics of Flow Through Poros Media, University of Toronto Press, 1974.
[11] S. Kaviany, Principle of heat transfer in porous media, NewYork: Springer-Verlag, 1991.
[12] M. Kahali Moghaddam, A. Breede, C. Brauner und W. Lang, „Embedding Piezoresistive Pressure Sensors to Obtain Online Pressure Profiles Inside Fiber Composite Laminates,“ sensors, pp. 7499-7511, 2015.
[13] A. V. Mamishev, K. Sundara- Rajan, Y. Du und M. Zahn, „Interdigital sensors and transducers,“ proceedings of the IEEE, Bd. 92, 2004.
[14] E. Schmachtenberg, J. Schulte zur Heide und J. Töpke, „Application of ultrasonics for the process control of Resin Transfer Moulding (RTM),“ Polymer Testing, Bd. 24, pp. 330-338, 2005.

112
[15] J. Döring, W. Stark und G. Splitt, „On-line process monitoring of thermosets by ultrasonic methods,“ in NDT.net 3 (11), 1998.
[16] D. D. Shepard und K. R. Smith, „Ultrasonic Cure monitoring of advanced composites,“ Sensor Review, Bd. 19, Nr. 3, pp. 187-194, 1997.
[17] S. Konstantopoulos, E. Fauster und R. Schledjewski, „Monitoring the production of FRP composites: A review of in-line sensing methods,“ eXPRESS Polymer Letters, pp. 823-840, 2014.
[18] P. Wang, J. Molimard, S. Drapier und A. Vautrin , „Monitoring the Liquid Resin Infusion (LRI) manufacturing process under industrial environment using distributed sensors,“ in ICCM17proceedings.
[19] P. Wang, M. Demirel, I. S. Drapier und J. Molimard, „In-plane and transverse detection of the fluid flow front during the LRI manufacturing process,“ in The 9th International Conference on Flow Processes in Composite Materials, Montréal (Québec), Canada, 2008.
[20] G. Pandey, H. Deffor, E. T. Thostenson und D. Heider, „Smart tooling with integrated time domain reflectometry sensing line for non-invasive flow and cure monitoring during composites manufacturing,“ Composites Part A: Applied Science and Manufacturing, Bd. 47, pp. 102-108, 2013.
[21] S. J. Buggy, E. Chehura, S. W. James und R. P. Tatam, „Optical fibre grating refractometers for resin cure monitoring,“ Journal of Optics A: Pure and Applied Optics, Bd. 9, pp. 60-65, 2007.
[22] U. Sampath, H. Kim, D. Kim, Y. Kim und M. Song, „In-situ cure monitoring of wind turbine blades by using fiber brag grating sensors and frenchel reflection measurement,“ Sensors, pp. 18229-18238, 2015.
[23] T. Schary, M. Meiners, W. Lang und W. Benecke, „Fused Silica as Substrate Material for Surface Micromachined Capacitive Pressure Sensors Operable in Touch-Mode,“ IEEE, 2005.
[24] U. Sampath Kumar und N. Jagadesh Babu, „Design and Simulation of MEMS Piezoresistive Pressure Sensor to Improve the Sensitivity,“ International Journal of innovative research in electrical, electronics, instrumentation and control engineering, pp. 153-155, 2015.
[25] T.-R. Hsu, MEMS Packaging, San Jose University, USA: MPG Books Limited, 2004.
[26] G. Herman, Wire bonding in microelectronics, USA: McGraw-Hill Education, 2010.
[27] M. Fretz, Flip chip bonding technologies for hybrid integration, PhD Thesis, Neuchatel: University of Neuchatel, 2009.
[28] M. Kahali Moghaddam, M. Salas, I. Erzoez, I. Michels und W. Lang, „Study of resin flow in carbon fiber reinforced polymer composites by means of pressure sensor,“ Journal of Composite Materials, Bd. 0, Nr. 0, pp. 1-10, 2017.

113
[29] N. Tesla, „Electric condenser“. USA Patent 464 667, 1891.
[30] E. H. Love, „Some electrostatic distributions in two dimensions,“ in Proceeding London Mathematical Society, London, March 8th, 1923.
[31] S. D. Senturia und C. M. Sechen, „The use of the charge-flow transistor to distinguish surface and bulk components of thin-film sheet resistance,“ IEEE Trans., Bd. 24, Nr. 9, pp. 1207-1207, 1977.
[32] R. Igreja und C. J. Dias, „Analytical evaluation of the interdigital electrodes capacitance for a multi-layered structure,“ Sensors and Actuators A: Physical, Bd. 112, pp. 291-301, 2004.
[33] M. Kahali Moghaddam, A. Breede, A. Chaloupka, A. Bödecker, C. Habben, E. M. Meyer, C. Brauner und W. Lang, „Design, fabrication and embedding of microscale interdigital sensors for real-time cure monitoring during composite manufacturing,“ Sensors and Actuators A: Physical, Bd. 243, pp. 123-133, 2016.
[34] R. Igreja und C. J. Dias, „Extension to the analytical model of the interdigital electrodes capacitance for a multi-layer structure,“ Sensors and Actuators A: Physical, Bd. 172, pp. 392-399, 2011.
[35] F. Starzyk, „Parametrisation of interdigit comb capacitor for dielectric impedance spectroscopy,“ International scientific journal, world academy of materials and manufacturing engineering, pp. 31-34, 2008.
[36] M. Kahali Moghaddam, „Flexible substrate of the sensor for embedding into carbon fiber reinforced polymer,“ Bremen, 2013.
[37] M. Kahali Moghaddam, D. Boll und W. Lang, „Embedding Rigid and Flexible Inlays in Carbon Fiber Reinforced Plastic,“ in IEEE/ASME International Conference on Advanced Intelligent Mechatronics (AIM), Besancon, France, 2014.
[38] D. Boll, K. Schubert, C. Brauner und W. Lang, „Miniaturized Flexible Interdigital Sensor for In Situ Dielectric Cure Monitoring of Composite Materials,“ IEEE sensors journal, Bd. 14, Nr. 7, pp. 2193- 2197, 2014.
[39] J. Laconte, D. Flandre und J. P. Raskin, Micromachined thin-film sensors for SOI-CMOS Co-Integration, ISBN: 978-0-387-28842-0, page 61, 2006.
[40] M. Kahali Moghaddam, J. Hellmann und W. Lang, „Plasticisation of epoxy resin transfer molding substrate for fabrication of interdigital capacitive sensors,“ in 30th Eurosensors Conference, Budapest, Hungary, 2016.
[41] J. Hellmann, „Plastifizieren von RTM6-Substrat zur Herstellung eines interdigitalen kapazitiven Sensors,“ Bremen University, bachelor thesis , Bremen, 2015.

114
[42] C. Brauner, „Analysis of process induced distortions and residual stresses in composite structures,“ PhD thesis, Logos Verlag, Berlin, 2013.
[43] S. Bickerton und S. G. Advani, „Experimental Analysis and Numerical Modeling of Flow Channel Effects in Resin Transfer Molding,“ Polymer Composites, pp. 134-153, 2000.
[44] D. B. Mastbergen, Simulation and testing of resin infusion manufacturing process for large composite structures, Montana: Bozeman, 2004.
[45] B. K. Flink, K. T. Hsiao, R. Mathur, J. W. Gillespi und S. Advani, „An analytical vacuum assisted resin transfer molding (VARTM) flow model,“ Army research laboratory report, 2000.
[46] M. Griebel und M. Klitz, „Homogenisation and numerical simulation of flow in geometries with textile microstructures,“ Multiscale Model. Simul., Bd. 4, pp. 1439-1460, 2010.
[47] N. C. Correia, F. Robitaille, A. C. Long, C. D. Rudd, P. Simacek und S. Advani, „Use of Resin Transfer Molding Simulation to Predict Flow, Saturation, and Compaction in the VARTM Process,“ Journal of fluids engineering, Bd. 126, pp. 210-215, 2004.
[48] N. C. Judd und W. W. Wright, „Voids and their Effects on the Mechanical Properties of Composites – An Appraisal,“ SAMPE Journal, pp. 10-14, 1978.

115
List of Figures Figure 1: Mechanical performance of common fibres and isotropic materials [2] ................. 24
Figure 2: Schematic of relevant axis to the fabric roll ............................................................. 25
Figure 3. Curing process of polymeric resin [5] ...................................................................... 26
Figure 4. Schematically represented (a) chemical structure of polyester (Isophthalic polyester)
(b) uncured and (c) cured polyester resin ................................................................................. 27
Figure 5. (a) A typical vinyl ester molecule. The ∗ is the reactive site of a molecule. (b)
schematic of an uncured vinylester (c) schematic of cured venilester ..................................... 28
Figure 6. (a) Simple epoxy structure (Ethylene Oxide) (b) chemical structure of a typical epoxy
(Diglycidyl ether of bisphenol-A), (c) schematic of 3D cured epoxy resin ............................. 29
Figure 7: A simplified hand lay-up production process ........................................................... 32
Figure 8: Resin infusion process in dry textile assisted by a vacuum pump ............................ 32
Figure 9: Prepreg composite production in a mold tool ........................................................... 33
Figure 10: RTM fibre reinforced composite production in a closed mold ............................... 33
Figure 11: A simplified pultrosion fibre reinforced composite production ............................. 35
Figure 12: Scheme of an autoclave for VARTM composite production ................................. 36
Figure 13: Pressure variation between infusion and vacuum lines. (adapted from [17]) ......... 40
Figure 14: Arrangement of charges (a) in absence of external electric field (b) with applying
excitation voltage ..................................................................................................................... 42
Figure 15: The difference in amplitude and phase between the excitation voltage (V) and
measured current (A) ................................................................................................................ 42
Figure 16: Ultrasonic transmitter (red) and receiver (green). The transmitter and receiver are
arranged in a) transmission b) reflection mode. ....................................................................... 50
Figure 17: Monitoring of resin flow in transparent mold using a camera ................................ 51
Figure 18: (a) The Evanescent and (b)Frensel optical fibre refractometers. The incident light
(blue) is reflected (red) from axial interface in Evanescent and from cross-sectional interface in
Frensel refractometers .............................................................................................................. 52

116
Figure 19: Capacitive pressure sensor in ceramic housing made by PROTRON Micro technique
.................................................................................................................................................. 53
Figure 20: An oscillating circuit to detect the changes of sensor capacity .............................. 54
Figure 21: (a) The capacitive pressure sensor on the PCB having an oscillating circuit (b)
location of pressure sensors in glass fibre composite and (b) scheme of the whole stack during
infusion ..................................................................................................................................... 55
Figure 22: Calibration graph for capacitive pressure sensor of PROTRON ............................ 56
Figure 23: (a) Measured pressure by S1, (b) Measured pressure by S2 and (c) Measured pressure
by S3 ......................................................................................................................................... 57
Figure 24: Scheme of a piezo-resistive pressure sensor showing its different parts. ............... 60
Figure 25: Scheme of a Wheatstone bridge ............................................................................. 61
Figure 26: BMP085 barometric pressure sensor ...................................................................... 62
Figure 27: Monitoring of the resin flow and resin pressure in glass fibre laminate using Bosch
barometric pressure sensor BMP 085....................................................................................... 62
Figure 28: A pressure sensor die glued on Pyralux PCB prior to wire bonding. ..................... 65
Figure 29:A wire bonded pressure sensor die on a KAPTON PCB. The bonded wires are
protected by GE 680. A 3D printed protection lid is glued on top of the sensor. .................... 66
Figure 30: (a) scheme of the carbon fibre laminates with 4 plies. The sensors are embedded in
the neutral plane of the middle ply. (b) top view of the laminate after sealing the vacuum bags.
.................................................................................................................................................. 67
Figure 31: The measured pressure during infusion in laminate of Figure 23 .......................... 68
Figure 32: Analytical pressure calculation based on Darcy’s law by FIBRE .......................... 68
Figure 33: (a) Top view of a pressure sensor die after placing gold stud bumps on the pads (b)
A flattened gold stud bump on aluminium pad ........................................................................ 69
Figure 34: The temperature profile used for re-flow soldering of a pressure sensor die with gold
stud bumps on PCB .................................................................................................................. 70
Figure 35: Gold stud bumps deformed the pads on Kapton PCB ............................................ 71
Figure 36: (a) scheme and (b) photograph of a specimen for inter-laminar shear strength test
.................................................................................................................................................. 72

117
Figure 37: (a) single shear (b) multiple shear (c) plastic deformation (d) flexure of specimen
after loading in accordance with DIN 2563 ............................................................................. 73
Figure 38: Planar interdigital capacitor, each two neighboring electrodes have different fixed
potential (adapted from [39]) ................................................................................................... 79
Figure 39: Equivalent electrical model of a planar interdigital sensor based on Igreja [39]. .. 80
Figure 40: The equivalent circuit for impedance measurement considering capacitance and
impedance of material under test and substrate based on Starzyk model [40] ........................ 81
Figure 41: Different perforation patterns on the substrates to be embedded in CFRP ............ 82
Figure 42: Microscopic image of top view from sensors (a) type 3 or 4 (b) types 1, 2, 5 or 6 85
Figure 43: Anodic oxidation helps finding dummy sensors. Non-oxided comb remains shiny
while the oxided comb turns dark ............................................................................................ 88
Figure 44: Preparing specimens for 3-point shear test in accordance with DIN 2563 ............. 89
Figure 45: (a) Top view of a microscale IDS and a commercial Netzsch sensor Microscopic
image of a (b) Netzsch sensor and (c)longitudinal cross section of microscale IDS embedded in
GFRP (d) measurement of resin RIM 35 polymerization by microscale IDC and by Netzsch
sensor in GFRP [38] ................................................................................................................. 92
Figure 46: (a) Top view and (b) side view of CFRP with the embedded PS (left), PMMA
(middle) and PC (right) ............................................................................................................ 95
Figure 47: Pure RTM6 with embedded PS (left), PMMA (middle) and PC (right). The resin is
cured at 180 °C for about 2h .................................................................................................... 96
Figure 48: Cured resin mixture (RTM6: Camphor; 1:1 weight ratio). The aluminum wafer is
pretreated with release agent BGL- GZ-83 .............................................................................. 98
Figure 49: Cured mixture of resin and Dibutyl Sebacate on the pretreated aluminum wafer with
sylgard .................................................................................................................................... 101
Figure 50: Cured mixture of resin and dibutyl sebacate on pretreated aluminum wafer with
Bayer release agent ................................................................................................................. 101
Figure 51: Cured mixture of resin and Dibutyl Sebacate is peeled off using scalpel from pre-
coated aluminium wafer with E8020 ..................................................................................... 102
Figure 52: SEM image measuring the thickness of cured mixture of resin and Dibutyl Sebacate
on E8020, the mixture is spun coated at 2750 rpm for 1 min ................................................ 102

118
Figure 53: (a) Schematically drawn of specimens for mechanical pulling test (b) A photograph
of CFRPs and aluminium cube to prepare specimens for pulling test (c) photograph of the
specimen in the XYZtech pulling test machine ..................................................................... 104
Figure 54: Breaking forces for specimens with embedded polyimide (PI), mixture of RTM6 and
Dibutyl Sebacate and reference samples (only two CFRP cubes) [45] .................................. 105
Figure 55: Printed interdigital planar capacitive sensor using silver paste on a plasticized RTM6
with Dibutyl Sebacate substrate ............................................................................................. 106
Figure 56: Measuring the curing degree of RTM6 resin using printed interdigital sensor on
plasticized RTM6 resin in glass fabric ................................................................................... 107
Figure 57: Measuring the curing degree of RTM6 resin using printed interdigital sensor on
plasticized RTM6 resin in glass fabric .................................................................................. 108

119
Appendix A
Publications in Journals
Maryam Kahali Moghaddam, Arne Breede, Christian Brauner, Walter Lang,
Embedding Piezoresistive Pressure Sensors to Obtain Online Pressure Profiles Inside
Fibre Composite Laminates. Sensors 15, (4), pp 7499-7511, 2015
Maryam Kahali Moghaddam, Arne Breede, Alexander Chaloupka, André Bödecker,
Christian Habben, Eva-Maria Meyer, Christian Brauner, Walter Lang, Design,
Fabrication and Embedding of Microscale Interdigital Sensors for Real-Time Cure
Monitoring during Composite Manufacturing, Journal of Sensors and Actuators part A,
2016, Vol 243, 123-133
Maryam Kahali Moghaddam, Mariugenia Salas, Ibrahim Erzöz, Ingrid Michels and
Walter Lang, Study of resin flow in carbon fibre reinforced polymer composites by
means of pressure sensor, Journal of Composite Materials, 0(0) 1–10, DOI:
10.1177/0021998317691877, 2017
Conference Proceedings
Maryam Kahali Moghaddam, Dmitriy Boll, Walter Lang, Embedding Rigid and
Flexible Inlays in Carbon Fibre Reinforced Plastic Proc. IEEE/ASME International
Conference on Advanced Intelligent Mechatronics (AIM), Besancon, France, pp 1387-
1392, 2014
Maryam Kahali Moghaddam, Jan Hellmann, Walter Lang, Plasticisation of epoxy resin
transfer molding substrate for fabrication of interdigital capacitive sensors, 30th
Eurosensors, Budapest, Hungary, pp 1110-1113, 2016
Book chapters
Martina Hübner, Maryam Kahali Moghaddam, Mariugenia Salas, Gerrit Dumstorff
and Walter Lang, Materialintegrierte Sensorik für Fahrzeug-Leichtbautechnik. In
Automobil-Sensorik (pp. 191-216). Springer Berlin Heidelberg, 2016
Maryam Kahali Moghaddam, Mariugenia Salas, Michael Koerdt, Christian Brauner,
Martina Hübner, Dirk Lehmhus and Walter Lang, Material-Integrated Intelligent

120
Systems - Technologies and Applications. Wiley-VCH, Weinheim, in preparation,
publication expected until December 2017
Other Publications
Martina Hübner, Gerrit Dumstorff, Maryam Kahali Moghaddam, Peter Plagemann,
Walter Lang, Ultra-thin capacitive foil sensor for characterization of an adhesive
join, Eurosensors 2015, Freiburg, Deutschland, Procedia Engineering 120, 2015
Arne Breede, Maryam Kahali Moghaddam, Christian Brauner, Axel S. Herrmann,
Walter Lang, Online Process Monitoring and Control by Dielectric Sensors for a
Composite Main Spar for Wind Turbine Blades. Proc. 20th International Conference on
Composite Materials, Kopenhagen, Dänemark, 2015
Mariugenia Salas, Michel Koerdt, Martina Hübner, Maryam Kahali, Walter Lang,
Material integrated sensors for an optimal baseline selection on a wireless SHM
network, IEEE sensors, Orlando, Florida, USA, pp 976-978, 2016
Poornachandra Papireddy Vinayaka, Maryam Kahali Moghaddam, Sander Van Den
Driesche, Roland Blank, Walter Lang, Michael Vellekoop, Sensor Sticker for Detection
of Fungi Spore Contamination on Bananas, International Conference on Smart and
Multifunctional materials, Structures and Systems, CIMTEC, Perugia, Italy, pp 130-
133, 2016
Michael Koerdt, Christian Brauner, Martina Hübner, Maryam Kahali Moghaddam,
Walter Lang, Axel Siegfried Herrmann, Integration von minimalinvasiven Sensoren in
Faserkunststoffverbunde zur Herstellungsprozesskontrolle und Zustandsüberwachung,
Symposium für Smarte Strukturen und Systeme (4SMARTS), Braunschweig, June,
2017
Supervised Works
J. Hellmann, Plastifizieren von RTM6-Substrat zur Herstellung eines interdigitalen
kapazitiven Sensoren, Bacheloraibeit, Bremen, 2015
M. Hübner, Characterisierung einer Klebefuge mit eingebetteten kapazitiven Sensoren,
Diplomarbeit, Bremen, 2015
A. Shariati, Evaluierung der Strukturintegrität von sensorisierten endlosfaserverstärkten
Kunststoffen, Bachelor thesis at FIBRE, Bremen University, 2016