Embarcadero Performance Center 2.5 Expert Guide:...
138
Embarcadero Performance Center 2.5 Expert Guide: Sybase
Transcript of Embarcadero Performance Center 2.5 Expert Guide:...
Embarcadero Performance Center 2.5 Expert Guide: Sybase

Copyright © 1994-2008 Embarcadero Technologies, Inc.
Embarcadero Technologies, Inc. 100 California Street, 12th FloorSan Francisco, CA 94111 U.S.A.All rights reserved.
All brands and product names are trademarks or registered trademarks of their respective owners. This software/documentation contains proprietary information of Embarcadero Technologies, Inc.; it is provided under a license agreement containing restrictions on use and disclosure and is also protected by copyright law. Reverse engineering of the software is prohibited.
If this software/documentation is delivered to a U.S. Government Agency of the Department of Defense, then it is delivered with Restricted Rights and the following legend is applicable:
Restricted Rights Legend Use, duplication, or disclosure by the Government is subject to restrictions as set forth in subparagraph (c)(1)(ii) of DFARS 252.227-7013, Rights in Technical Data and Computer Software (October 1988).
If this software/documentation is delivered to a U.S. Government Agency not within the Department of Defense, then it is delivered with Restricted Rights, as defined in FAR 552.227-14, Rights in Data-General, including Alternate III (June 1987).
Information in this document is subject to change without notice. Revisions may be issued to advise of such changes and additions. Embarcadero Technologies, Inc. does not warrant that this documentation is error-free.
Contents
Sybase Expert Guide . . . . . . . . . . . . . . . . . . . . . . . . . . . . . . . . . . . . . . . . . . . . . . . . . . . . . . . . . . . . . . . . . . . . . . . . . . 10
Enabling MDA Tables . . . . . . . . . . . . . . . . . . . . . . . . . . . . . . . . . . . . . . . . . . . . . . . . . . . . . . . . . . . . . . . . . 10
Home View Statistics - Sybase . . . . . . . . . . . . . . . . . . . . . . . . . . . . . . . . . . . . . . . . . . . . . . . . . . . . . . . . . . . . . . . . 11
Memory Vital Signs . . . . . . . . . . . . . . . . . . . . . . . . . . . . . . . . . . . . . . . . . . . . . . . . . . . . . . . . . . . . . . . . . . . . . . 12
Data Cache Hit Rate . . . . . . . . . . . . . . . . . . . . . . . . . . . . . . . . . . . . . . . . . . . . . . . . . . . . . . . . . . . . . . . . . . 12
Procedure Cache Hit Rate . . . . . . . . . . . . . . . . . . . . . . . . . . . . . . . . . . . . . . . . . . . . . . . . . . . . . . . . . . . . . 13
Large I/O Hit Rate . . . . . . . . . . . . . . . . . . . . . . . . . . . . . . . . . . . . . . . . . . . . . . . . . . . . . . . . . . . . . . . . . . . . 13
Clean Buffer Grab Rate. . . . . . . . . . . . . . . . . . . . . . . . . . . . . . . . . . . . . . . . . . . . . . . . . . . . . . . . . . . . . . . . 14
Contention Vital Signs. . . . . . . . . . . . . . . . . . . . . . . . . . . . . . . . . . . . . . . . . . . . . . . . . . . . . . . . . . . . . . . . . . . . 14
Blocking Lock Rate . . . . . . . . . . . . . . . . . . . . . . . . . . . . . . . . . . . . . . . . . . . . . . . . . . . . . . . . . . . . . . . . . . . 14
Deadlock Rate. . . . . . . . . . . . . . . . . . . . . . . . . . . . . . . . . . . . . . . . . . . . . . . . . . . . . . . . . . . . . . . . . . . . . . . 15
Device I/O Contention . . . . . . . . . . . . . . . . . . . . . . . . . . . . . . . . . . . . . . . . . . . . . . . . . . . . . . . . . . . . . . . . . 16
Network Contention Rate . . . . . . . . . . . . . . . . . . . . . . . . . . . . . . . . . . . . . . . . . . . . . . . . . . . . . . . . . . . . . . 16
I/O Vital Signs . . . . . . . . . . . . . . . . . . . . . . . . . . . . . . . . . . . . . . . . . . . . . . . . . . . . . . . . . . . . . . . . . . . . . . . . . . 16
Total Server Reads . . . . . . . . . . . . . . . . . . . . . . . . . . . . . . . . . . . . . . . . . . . . . . . . . . . . . . . . . . . . . . . . . . . 17
Total Server Writes . . . . . . . . . . . . . . . . . . . . . . . . . . . . . . . . . . . . . . . . . . . . . . . . . . . . . . . . . . . . . . . . . . . 17
Txn Log Writes . . . . . . . . . . . . . . . . . . . . . . . . . . . . . . . . . . . . . . . . . . . . . . . . . . . . . . . . . . . . . . . . . . . . . . 17
I/O Errors. . . . . . . . . . . . . . . . . . . . . . . . . . . . . . . . . . . . . . . . . . . . . . . . . . . . . . . . . . . . . . . . . . . . . . . . . . . 17
Users Vital Signs. . . . . . . . . . . . . . . . . . . . . . . . . . . . . . . . . . . . . . . . . . . . . . . . . . . . . . . . . . . . . . . . . . . . . . . . 17
Total Connections . . . . . . . . . . . . . . . . . . . . . . . . . . . . . . . . . . . . . . . . . . . . . . . . . . . . . . . . . . . . . . . . . . . . 18
Active Connections . . . . . . . . . . . . . . . . . . . . . . . . . . . . . . . . . . . . . . . . . . . . . . . . . . . . . . . . . . . . . . . . . . . 18
Committed Transactions . . . . . . . . . . . . . . . . . . . . . . . . . . . . . . . . . . . . . . . . . . . . . . . . . . . . . . . . . . . . . . . 18
Current Locks . . . . . . . . . . . . . . . . . . . . . . . . . . . . . . . . . . . . . . . . . . . . . . . . . . . . . . . . . . . . . . . . . . . . . . . 19
Space Vital Signs . . . . . . . . . . . . . . . . . . . . . . . . . . . . . . . . . . . . . . . . . . . . . . . . . . . . . . . . . . . . . . . . . . . . . . . 19
Databases Low on Space . . . . . . . . . . . . . . . . . . . . . . . . . . . . . . . . . . . . . . . . . . . . . . . . . . . . . . . . . . . . . . 19
Logs Low on Space. . . . . . . . . . . . . . . . . . . . . . . . . . . . . . . . . . . . . . . . . . . . . . . . . . . . . . . . . . . . . . . . . . . 20
Network Vital Signs . . . . . . . . . . . . . . . . . . . . . . . . . . . . . . . . . . . . . . . . . . . . . . . . . . . . . . . . . . . . . . . . . . . . . . 20
Network Requests . . . . . . . . . . . . . . . . . . . . . . . . . . . . . . . . . . . . . . . . . . . . . . . . . . . . . . . . . . . . . . . . . . . . 20
Network Delays . . . . . . . . . . . . . . . . . . . . . . . . . . . . . . . . . . . . . . . . . . . . . . . . . . . . . . . . . . . . . . . . . . . . . . 20
Bytes Received . . . . . . . . . . . . . . . . . . . . . . . . . . . . . . . . . . . . . . . . . . . . . . . . . . . . . . . . . . . . . . . . . . . . . . 21
Bytes Sent . . . . . . . . . . . . . . . . . . . . . . . . . . . . . . . . . . . . . . . . . . . . . . . . . . . . . . . . . . . . . . . . . . . . . . . . . . 21
Memory Statistics - Sybase. . . . . . . . . . . . . . . . . . . . . . . . . . . . . . . . . . . . . . . . . . . . . . . . . . . . . . . . . . . . . . . . . . . 21
Data Cache Activity. . . . . . . . . . . . . . . . . . . . . . . . . . . . . . . . . . . . . . . . . . . . . . . . . . . . . . . . . . . . . . . . . . . . . . 22
New Pages Allocated . . . . . . . . . . . . . . . . . . . . . . . . . . . . . . . . . . . . . . . . . . . . . . . . . . . . . . . . . . . . . . . . . . . . 23
Dirty Buffers Grabbed . . . . . . . . . . . . . . . . . . . . . . . . . . . . . . . . . . . . . . . . . . . . . . . . . . . . . . . . . . . . . . . . . . . . 23
Dirty Read Requests . . . . . . . . . . . . . . . . . . . . . . . . . . . . . . . . . . . . . . . . . . . . . . . . . . . . . . . . . . . . . . . . . . . . . 23
Dirty Read Restarts. . . . . . . . . . . . . . . . . . . . . . . . . . . . . . . . . . . . . . . . . . . . . . . . . . . . . . . . . . . . . . . . . . . . . . 23
EMBARCADERO TECHNOLOGIES > EMBARCADERO PERFORMANCE CENTER 2.5 EXPERT GUIDE: SYBASE 3
CONTENTS >
Procedure Cache Activity . . . . . . . . . . . . . . . . . . . . . . . . . . . . . . . . . . . . . . . . . . . . . . . . . . . . . . . . . . . . . . . . . 24
Procedure Requests . . . . . . . . . . . . . . . . . . . . . . . . . . . . . . . . . . . . . . . . . . . . . . . . . . . . . . . . . . . . . . . . . . . . . 25
Procedure Reads from Disk . . . . . . . . . . . . . . . . . . . . . . . . . . . . . . . . . . . . . . . . . . . . . . . . . . . . . . . . . . . . . . . 25
Procedure Writes to Disk . . . . . . . . . . . . . . . . . . . . . . . . . . . . . . . . . . . . . . . . . . . . . . . . . . . . . . . . . . . . . . . . . 25
Procedure Removals. . . . . . . . . . . . . . . . . . . . . . . . . . . . . . . . . . . . . . . . . . . . . . . . . . . . . . . . . . . . . . . . . . . . . 26
Large I/O Hit Rate . . . . . . . . . . . . . . . . . . . . . . . . . . . . . . . . . . . . . . . . . . . . . . . . . . . . . . . . . . . . . . . . . . . . . . . 26
Session Leaders - Memory . . . . . . . . . . . . . . . . . . . . . . . . . . . . . . . . . . . . . . . . . . . . . . . . . . . . . . . . . . . . . . . . 27
Cache Allocations . . . . . . . . . . . . . . . . . . . . . . . . . . . . . . . . . . . . . . . . . . . . . . . . . . . . . . . . . . . . . . . . . . . . . . . 27
Memory Detail View . . . . . . . . . . . . . . . . . . . . . . . . . . . . . . . . . . . . . . . . . . . . . . . . . . . . . . . . . . . . . . . . . . . . . 28
Leading Sessions Tab. . . . . . . . . . . . . . . . . . . . . . . . . . . . . . . . . . . . . . . . . . . . . . . . . . . . . . . . . . . . . . . . . 28
Cache Activity Tab . . . . . . . . . . . . . . . . . . . . . . . . . . . . . . . . . . . . . . . . . . . . . . . . . . . . . . . . . . . . . . . . . . . 29
Page Activity Tab . . . . . . . . . . . . . . . . . . . . . . . . . . . . . . . . . . . . . . . . . . . . . . . . . . . . . . . . . . . . . . . . . . . . 29
I/O Statistics - Sybase. . . . . . . . . . . . . . . . . . . . . . . . . . . . . . . . . . . . . . . . . . . . . . . . . . . . . . . . . . . . . . . . . . . . . . . 30
Requested Disk I/Os . . . . . . . . . . . . . . . . . . . . . . . . . . . . . . . . . . . . . . . . . . . . . . . . . . . . . . . . . . . . . . . . . . . . . 30
Completed Disk I/Os . . . . . . . . . . . . . . . . . . . . . . . . . . . . . . . . . . . . . . . . . . . . . . . . . . . . . . . . . . . . . . . . . . . . . 30
Outstanding Disk I/Os . . . . . . . . . . . . . . . . . . . . . . . . . . . . . . . . . . . . . . . . . . . . . . . . . . . . . . . . . . . . . . . . . . . . 31
Delayed Disk I/Os . . . . . . . . . . . . . . . . . . . . . . . . . . . . . . . . . . . . . . . . . . . . . . . . . . . . . . . . . . . . . . . . . . . . . . . 31
Transaction Log Writes . . . . . . . . . . . . . . . . . . . . . . . . . . . . . . . . . . . . . . . . . . . . . . . . . . . . . . . . . . . . . . . . . . . 32
Transaction Log Allocations . . . . . . . . . . . . . . . . . . . . . . . . . . . . . . . . . . . . . . . . . . . . . . . . . . . . . . . . . . . . . . . 32
Session Leaders - I/O . . . . . . . . . . . . . . . . . . . . . . . . . . . . . . . . . . . . . . . . . . . . . . . . . . . . . . . . . . . . . . . . . . . . 32
I/O Error Rate . . . . . . . . . . . . . . . . . . . . . . . . . . . . . . . . . . . . . . . . . . . . . . . . . . . . . . . . . . . . . . . . . . . . . . . . . . 32
I/O Detail View . . . . . . . . . . . . . . . . . . . . . . . . . . . . . . . . . . . . . . . . . . . . . . . . . . . . . . . . . . . . . . . . . . . . . . . . . 33
Leading Sessions Tab. . . . . . . . . . . . . . . . . . . . . . . . . . . . . . . . . . . . . . . . . . . . . . . . . . . . . . . . . . . . . . . . . 33
Devices Tab . . . . . . . . . . . . . . . . . . . . . . . . . . . . . . . . . . . . . . . . . . . . . . . . . . . . . . . . . . . . . . . . . . . . . . . . 34
Engines Tab . . . . . . . . . . . . . . . . . . . . . . . . . . . . . . . . . . . . . . . . . . . . . . . . . . . . . . . . . . . . . . . . . . . . . . . . 34
Index Scans Tab . . . . . . . . . . . . . . . . . . . . . . . . . . . . . . . . . . . . . . . . . . . . . . . . . . . . . . . . . . . . . . . . . . . . . 35
Space Statistics - Sybase . . . . . . . . . . . . . . . . . . . . . . . . . . . . . . . . . . . . . . . . . . . . . . . . . . . . . . . . . . . . . . . . . . . . 36
Database Overview. . . . . . . . . . . . . . . . . . . . . . . . . . . . . . . . . . . . . . . . . . . . . . . . . . . . . . . . . . . . . . . . . . . . . . 36
Log Overview . . . . . . . . . . . . . . . . . . . . . . . . . . . . . . . . . . . . . . . . . . . . . . . . . . . . . . . . . . . . . . . . . . . . . . . . . . 36
Device Overview . . . . . . . . . . . . . . . . . . . . . . . . . . . . . . . . . . . . . . . . . . . . . . . . . . . . . . . . . . . . . . . . . . . . . . . . 37
Space Detail View . . . . . . . . . . . . . . . . . . . . . . . . . . . . . . . . . . . . . . . . . . . . . . . . . . . . . . . . . . . . . . . . . . . . . . . 38
Device Detail Tab . . . . . . . . . . . . . . . . . . . . . . . . . . . . . . . . . . . . . . . . . . . . . . . . . . . . . . . . . . . . . . . . . . . . 38
Cache Detail Tab. . . . . . . . . . . . . . . . . . . . . . . . . . . . . . . . . . . . . . . . . . . . . . . . . . . . . . . . . . . . . . . . . . . . . 38
Segment Detail Tab. . . . . . . . . . . . . . . . . . . . . . . . . . . . . . . . . . . . . . . . . . . . . . . . . . . . . . . . . . . . . . . . . . . 39
Object Detail Tab. . . . . . . . . . . . . . . . . . . . . . . . . . . . . . . . . . . . . . . . . . . . . . . . . . . . . . . . . . . . . . . . . . . . . 41
Databases Statistics - Sybase . . . . . . . . . . . . . . . . . . . . . . . . . . . . . . . . . . . . . . . . . . . . . . . . . . . . . . . . . . . . . . . . 41
Database Summary . . . . . . . . . . . . . . . . . . . . . . . . . . . . . . . . . . . . . . . . . . . . . . . . . . . . . . . . . . . . . . . . . . . . . 41
Database Detail View . . . . . . . . . . . . . . . . . . . . . . . . . . . . . . . . . . . . . . . . . . . . . . . . . . . . . . . . . . . . . . . . . . . . 42
Suspect Objects Tab . . . . . . . . . . . . . . . . . . . . . . . . . . . . . . . . . . . . . . . . . . . . . . . . . . . . . . . . . . . . . . . . . . 42
Table Statistics Tab. . . . . . . . . . . . . . . . . . . . . . . . . . . . . . . . . . . . . . . . . . . . . . . . . . . . . . . . . . . . . . . . . . . 43
EMBARCADERO TECHNOLOGIES > EMBARCADERO PERFORMANCE CENTER 2.5 EXPERT GUIDE: SYBASE 4
CONTENTS >
Index Statistics Tab . . . . . . . . . . . . . . . . . . . . . . . . . . . . . . . . . . . . . . . . . . . . . . . . . . . . . . . . . . . . . . . . . . . 44
Storage Tab. . . . . . . . . . . . . . . . . . . . . . . . . . . . . . . . . . . . . . . . . . . . . . . . . . . . . . . . . . . . . . . . . . . . . . . . . 45
Options Tab. . . . . . . . . . . . . . . . . . . . . . . . . . . . . . . . . . . . . . . . . . . . . . . . . . . . . . . . . . . . . . . . . . . . . . . . . 46
Contention Statistics - Sybase . . . . . . . . . . . . . . . . . . . . . . . . . . . . . . . . . . . . . . . . . . . . . . . . . . . . . . . . . . . . . . . . 46
Logical Lock Contention . . . . . . . . . . . . . . . . . . . . . . . . . . . . . . . . . . . . . . . . . . . . . . . . . . . . . . . . . . . . . . . . . . 47
Address Lock Contention . . . . . . . . . . . . . . . . . . . . . . . . . . . . . . . . . . . . . . . . . . . . . . . . . . . . . . . . . . . . . . . . . 48
Group Commit Sleeps. . . . . . . . . . . . . . . . . . . . . . . . . . . . . . . . . . . . . . . . . . . . . . . . . . . . . . . . . . . . . . . . . . . . 48
Modify Conflicts. . . . . . . . . . . . . . . . . . . . . . . . . . . . . . . . . . . . . . . . . . . . . . . . . . . . . . . . . . . . . . . . . . . . . . . . . 48
Device I/O Contention . . . . . . . . . . . . . . . . . . . . . . . . . . . . . . . . . . . . . . . . . . . . . . . . . . . . . . . . . . . . . . . . . . . . 48
Disk I/O Structures . . . . . . . . . . . . . . . . . . . . . . . . . . . . . . . . . . . . . . . . . . . . . . . . . . . . . . . . . . . . . . . . . . . . . . 49
Server Configuration Limit. . . . . . . . . . . . . . . . . . . . . . . . . . . . . . . . . . . . . . . . . . . . . . . . . . . . . . . . . . . . . . . . . 49
Engine Configuration Limit . . . . . . . . . . . . . . . . . . . . . . . . . . . . . . . . . . . . . . . . . . . . . . . . . . . . . . . . . . . . . . . . 50
Operating System Limit. . . . . . . . . . . . . . . . . . . . . . . . . . . . . . . . . . . . . . . . . . . . . . . . . . . . . . . . . . . . . . . . . . . 50
Deadlock Rate. . . . . . . . . . . . . . . . . . . . . . . . . . . . . . . . . . . . . . . . . . . . . . . . . . . . . . . . . . . . . . . . . . . . . . . . . . 50
Deadlocks . . . . . . . . . . . . . . . . . . . . . . . . . . . . . . . . . . . . . . . . . . . . . . . . . . . . . . . . . . . . . . . . . . . . . . . . . . . . . 51
Current Locks . . . . . . . . . . . . . . . . . . . . . . . . . . . . . . . . . . . . . . . . . . . . . . . . . . . . . . . . . . . . . . . . . . . . . . . . . . 51
Lock Contention . . . . . . . . . . . . . . . . . . . . . . . . . . . . . . . . . . . . . . . . . . . . . . . . . . . . . . . . . . . . . . . . . . . . . . . . 52
Blocked . . . . . . . . . . . . . . . . . . . . . . . . . . . . . . . . . . . . . . . . . . . . . . . . . . . . . . . . . . . . . . . . . . . . . . . . . . . . . . . 52
Network Contention Rate . . . . . . . . . . . . . . . . . . . . . . . . . . . . . . . . . . . . . . . . . . . . . . . . . . . . . . . . . . . . . . . . . 53
Network Delays . . . . . . . . . . . . . . . . . . . . . . . . . . . . . . . . . . . . . . . . . . . . . . . . . . . . . . . . . . . . . . . . . . . . . . . . . 54
Network Requests. . . . . . . . . . . . . . . . . . . . . . . . . . . . . . . . . . . . . . . . . . . . . . . . . . . . . . . . . . . . . . . . . . . . . . . 54
Contention Detail View . . . . . . . . . . . . . . . . . . . . . . . . . . . . . . . . . . . . . . . . . . . . . . . . . . . . . . . . . . . . . . . . . . . 54
All Locks Tab. . . . . . . . . . . . . . . . . . . . . . . . . . . . . . . . . . . . . . . . . . . . . . . . . . . . . . . . . . . . . . . . . . . . . . . . 54
Blocking Locks Tab . . . . . . . . . . . . . . . . . . . . . . . . . . . . . . . . . . . . . . . . . . . . . . . . . . . . . . . . . . . . . . . . . . . 55
Users Statistics - Sybase . . . . . . . . . . . . . . . . . . . . . . . . . . . . . . . . . . . . . . . . . . . . . . . . . . . . . . . . . . . . . . . . . . . . 57
Active Connections . . . . . . . . . . . . . . . . . . . . . . . . . . . . . . . . . . . . . . . . . . . . . . . . . . . . . . . . . . . . . . . . . . . . . . 57
Inactive Connections. . . . . . . . . . . . . . . . . . . . . . . . . . . . . . . . . . . . . . . . . . . . . . . . . . . . . . . . . . . . . . . . . . . . . 57
Current Locks . . . . . . . . . . . . . . . . . . . . . . . . . . . . . . . . . . . . . . . . . . . . . . . . . . . . . . . . . . . . . . . . . . . . . . . . . . 58
Users Blocked . . . . . . . . . . . . . . . . . . . . . . . . . . . . . . . . . . . . . . . . . . . . . . . . . . . . . . . . . . . . . . . . . . . . . . . . . . 58
Committed Transactions . . . . . . . . . . . . . . . . . . . . . . . . . . . . . . . . . . . . . . . . . . . . . . . . . . . . . . . . . . . . . . . . . . 59
ULC Flushes . . . . . . . . . . . . . . . . . . . . . . . . . . . . . . . . . . . . . . . . . . . . . . . . . . . . . . . . . . . . . . . . . . . . . . . . . . . 59
Rows Inserted . . . . . . . . . . . . . . . . . . . . . . . . . . . . . . . . . . . . . . . . . . . . . . . . . . . . . . . . . . . . . . . . . . . . . . . . . . 59
Rows Updated. . . . . . . . . . . . . . . . . . . . . . . . . . . . . . . . . . . . . . . . . . . . . . . . . . . . . . . . . . . . . . . . . . . . . . . . . . 60
Rows Updated (Data Only Locks). . . . . . . . . . . . . . . . . . . . . . . . . . . . . . . . . . . . . . . . . . . . . . . . . . . . . . . . . . . 60
Rows Deleted . . . . . . . . . . . . . . . . . . . . . . . . . . . . . . . . . . . . . . . . . . . . . . . . . . . . . . . . . . . . . . . . . . . . . . . . . . 60
Total Rows Affected . . . . . . . . . . . . . . . . . . . . . . . . . . . . . . . . . . . . . . . . . . . . . . . . . . . . . . . . . . . . . . . . . . . . . 61
Session Leaders - Memory . . . . . . . . . . . . . . . . . . . . . . . . . . . . . . . . . . . . . . . . . . . . . . . . . . . . . . . . . . . . . . . . 61
Session Leaders - I/O . . . . . . . . . . . . . . . . . . . . . . . . . . . . . . . . . . . . . . . . . . . . . . . . . . . . . . . . . . . . . . . . . . . . 61
Session Leaders - CPU. . . . . . . . . . . . . . . . . . . . . . . . . . . . . . . . . . . . . . . . . . . . . . . . . . . . . . . . . . . . . . . . . . . 62
Users Detail View . . . . . . . . . . . . . . . . . . . . . . . . . . . . . . . . . . . . . . . . . . . . . . . . . . . . . . . . . . . . . . . . . . . . . . . 62
EMBARCADERO TECHNOLOGIES > EMBARCADERO PERFORMANCE CENTER 2.5 EXPERT GUIDE: SYBASE 5

CONTENTS >
Applications Tab . . . . . . . . . . . . . . . . . . . . . . . . . . . . . . . . . . . . . . . . . . . . . . . . . . . . . . . . . . . . . . . . . . . . . 63
Processes Tab . . . . . . . . . . . . . . . . . . . . . . . . . . . . . . . . . . . . . . . . . . . . . . . . . . . . . . . . . . . . . . . . . . . . . . 63
Locks Tab . . . . . . . . . . . . . . . . . . . . . . . . . . . . . . . . . . . . . . . . . . . . . . . . . . . . . . . . . . . . . . . . . . . . . . . . . . 64
Blocking Locks Tab . . . . . . . . . . . . . . . . . . . . . . . . . . . . . . . . . . . . . . . . . . . . . . . . . . . . . . . . . . . . . . . . . . . 65
DML Detail Tab . . . . . . . . . . . . . . . . . . . . . . . . . . . . . . . . . . . . . . . . . . . . . . . . . . . . . . . . . . . . . . . . . . 67
Transactions Tab. . . . . . . . . . . . . . . . . . . . . . . . . . . . . . . . . . . . . . . . . . . . . . . . . . . . . . . . . . . . . . . . . . . . . 67
Network Statistics - Sybase . . . . . . . . . . . . . . . . . . . . . . . . . . . . . . . . . . . . . . . . . . . . . . . . . . . . . . . . . . . . . . . . . . 68
Total Packets Received . . . . . . . . . . . . . . . . . . . . . . . . . . . . . . . . . . . . . . . . . . . . . . . . . . . . . . . . . . . . . . . . . . 69
Total Packets Sent . . . . . . . . . . . . . . . . . . . . . . . . . . . . . . . . . . . . . . . . . . . . . . . . . . . . . . . . . . . . . . . . . . . . . . 69
Total Bytes Received . . . . . . . . . . . . . . . . . . . . . . . . . . . . . . . . . . . . . . . . . . . . . . . . . . . . . . . . . . . . . . . . . . . . 69
Total Bytes Sent . . . . . . . . . . . . . . . . . . . . . . . . . . . . . . . . . . . . . . . . . . . . . . . . . . . . . . . . . . . . . . . . . . . . . . . . 69
Network Errors . . . . . . . . . . . . . . . . . . . . . . . . . . . . . . . . . . . . . . . . . . . . . . . . . . . . . . . . . . . . . . . . . . . . . . . . . 69
Network Contention Rate . . . . . . . . . . . . . . . . . . . . . . . . . . . . . . . . . . . . . . . . . . . . . . . . . . . . . . . . . . . . . . . . . 70
Network Delays . . . . . . . . . . . . . . . . . . . . . . . . . . . . . . . . . . . . . . . . . . . . . . . . . . . . . . . . . . . . . . . . . . . . . . . . . 70
Network Requests. . . . . . . . . . . . . . . . . . . . . . . . . . . . . . . . . . . . . . . . . . . . . . . . . . . . . . . . . . . . . . . . . . . . . . . 70
Other Views and Statistics . . . . . . . . . . . . . . . . . . . . . . . . . . . . . . . . . . . . . . . . . . . . . . . . . . . . . . . . . . . . . . . . . . . . . . 72
Archive View . . . . . . . . . . . . . . . . . . . . . . . . . . . . . . . . . . . . . . . . . . . . . . . . . . . . . . . . . . . . . . . . . . . . . . . . . . . . . . 72
Health Index View . . . . . . . . . . . . . . . . . . . . . . . . . . . . . . . . . . . . . . . . . . . . . . . . . . . . . . . . . . . . . . . . . . . . . . . . . 73
Hot Objects . . . . . . . . . . . . . . . . . . . . . . . . . . . . . . . . . . . . . . . . . . . . . . . . . . . . . . . . . . . . . . . . . . . . . . . . . . . . . . . 73
Hot Tables. . . . . . . . . . . . . . . . . . . . . . . . . . . . . . . . . . . . . . . . . . . . . . . . . . . . . . . . . . . . . . . . . . . . . . . . . . . . . 73
Hot Code . . . . . . . . . . . . . . . . . . . . . . . . . . . . . . . . . . . . . . . . . . . . . . . . . . . . . . . . . . . . . . . . . . . . . . . . . . . . . . 74
Lock View . . . . . . . . . . . . . . . . . . . . . . . . . . . . . . . . . . . . . . . . . . . . . . . . . . . . . . . . . . . . . . . . . . . . . . . . . . . . . . . . 74
All Locks Tab. . . . . . . . . . . . . . . . . . . . . . . . . . . . . . . . . . . . . . . . . . . . . . . . . . . . . . . . . . . . . . . . . . . . . . . . . . . 75
All Locks Tab for Oracle . . . . . . . . . . . . . . . . . . . . . . . . . . . . . . . . . . . . . . . . . . . . . . . . . . . . . . . . . . . . . . . 75
All Locks Tab for SQL Server . . . . . . . . . . . . . . . . . . . . . . . . . . . . . . . . . . . . . . . . . . . . . . . . . . . . . . . . . . . 75
All Locks Tab for Sybase. . . . . . . . . . . . . . . . . . . . . . . . . . . . . . . . . . . . . . . . . . . . . . . . . . . . . . . . . . . . . . . 76
All User Locks Tab . . . . . . . . . . . . . . . . . . . . . . . . . . . . . . . . . . . . . . . . . . . . . . . . . . . . . . . . . . . . . . . . . . . . . . 77
Blocking Locks Tab . . . . . . . . . . . . . . . . . . . . . . . . . . . . . . . . . . . . . . . . . . . . . . . . . . . . . . . . . . . . . . . . . . . . . . 78
Blocking Locks Tab for Oracle . . . . . . . . . . . . . . . . . . . . . . . . . . . . . . . . . . . . . . . . . . . . . . . . . . . . . . . . . . 78
Blocking Locks Tab for SQL Server . . . . . . . . . . . . . . . . . . . . . . . . . . . . . . . . . . . . . . . . . . . . . . . . . . . . . . 79
Blocking Locks Tab for Sybase . . . . . . . . . . . . . . . . . . . . . . . . . . . . . . . . . . . . . . . . . . . . . . . . . . . . . . . . . . 80
Locks View for DB2. . . . . . . . . . . . . . . . . . . . . . . . . . . . . . . . . . . . . . . . . . . . . . . . . . . . . . . . . . . . . . . . . . . . . . 81
Applications . . . . . . . . . . . . . . . . . . . . . . . . . . . . . . . . . . . . . . . . . . . . . . . . . . . . . . . . . . . . . . . . . . . . . . . . . 82
Locks Held Tab . . . . . . . . . . . . . . . . . . . . . . . . . . . . . . . . . . . . . . . . . . . . . . . . . . . . . . . . . . . . . . . . . . . . . . 82
Locks Waiting Tab. . . . . . . . . . . . . . . . . . . . . . . . . . . . . . . . . . . . . . . . . . . . . . . . . . . . . . . . . . . . . . . . . . . . 82
Unit of Work Tab . . . . . . . . . . . . . . . . . . . . . . . . . . . . . . . . . . . . . . . . . . . . . . . . . . . . . . . . . . . . . . . . . . . . . 83
Operating System View . . . . . . . . . . . . . . . . . . . . . . . . . . . . . . . . . . . . . . . . . . . . . . . . . . . . . . . . . . . . . . . . . . . . . 83
OS Page Statistics . . . . . . . . . . . . . . . . . . . . . . . . . . . . . . . . . . . . . . . . . . . . . . . . . . . . . . . . . . . . . . . . . . . . . . . . . 84
Summary Tab . . . . . . . . . . . . . . . . . . . . . . . . . . . . . . . . . . . . . . . . . . . . . . . . . . . . . . . . . . . . . . . . . . . . . . . . . . 85
EMBARCADERO TECHNOLOGIES > EMBARCADERO PERFORMANCE CENTER 2.5 EXPERT GUIDE: SYBASE 6
CONTENTS >
Processor Time . . . . . . . . . . . . . . . . . . . . . . . . . . . . . . . . . . . . . . . . . . . . . . . . . . . . . . . . . . . . . . . . . . . . . . . . . 85
Processor Speed. . . . . . . . . . . . . . . . . . . . . . . . . . . . . . . . . . . . . . . . . . . . . . . . . . . . . . . . . . . . . . . . . . . . . . . . 86
Processor . . . . . . . . . . . . . . . . . . . . . . . . . . . . . . . . . . . . . . . . . . . . . . . . . . . . . . . . . . . . . . . . . . . . . . . . . . . . . 86
Disk Time . . . . . . . . . . . . . . . . . . . . . . . . . . . . . . . . . . . . . . . . . . . . . . . . . . . . . . . . . . . . . . . . . . . . . . . . . . . . . 86
Load Average . . . . . . . . . . . . . . . . . . . . . . . . . . . . . . . . . . . . . . . . . . . . . . . . . . . . . . . . . . . . . . . . . . . . . . . . . . 86
Paged Memory Used . . . . . . . . . . . . . . . . . . . . . . . . . . . . . . . . . . . . . . . . . . . . . . . . . . . . . . . . . . . . . . . . . . . . 86
Number of Processors . . . . . . . . . . . . . . . . . . . . . . . . . . . . . . . . . . . . . . . . . . . . . . . . . . . . . . . . . . . . . . . . . . . 87
Swap Memory Used . . . . . . . . . . . . . . . . . . . . . . . . . . . . . . . . . . . . . . . . . . . . . . . . . . . . . . . . . . . . . . . . . . . . . 87
Average Disk Queue. . . . . . . . . . . . . . . . . . . . . . . . . . . . . . . . . . . . . . . . . . . . . . . . . . . . . . . . . . . . . . . . . . . . . 87
Page Faults/Sec . . . . . . . . . . . . . . . . . . . . . . . . . . . . . . . . . . . . . . . . . . . . . . . . . . . . . . . . . . . . . . . . . . . . . . . . 87
Processor Queue . . . . . . . . . . . . . . . . . . . . . . . . . . . . . . . . . . . . . . . . . . . . . . . . . . . . . . . . . . . . . . . . . . . . . . . 88
Network Output Queue/Network Queue . . . . . . . . . . . . . . . . . . . . . . . . . . . . . . . . . . . . . . . . . . . . . . . . . . . . . . 88
Available Physical Memory . . . . . . . . . . . . . . . . . . . . . . . . . . . . . . . . . . . . . . . . . . . . . . . . . . . . . . . . . . . . . . . . 88
Available Paged Memory . . . . . . . . . . . . . . . . . . . . . . . . . . . . . . . . . . . . . . . . . . . . . . . . . . . . . . . . . . . . . . . . . 89
Available Swap Memory . . . . . . . . . . . . . . . . . . . . . . . . . . . . . . . . . . . . . . . . . . . . . . . . . . . . . . . . . . . . . . . . . . 89
Total Physical Memory . . . . . . . . . . . . . . . . . . . . . . . . . . . . . . . . . . . . . . . . . . . . . . . . . . . . . . . . . . . . . . . . . . . 89
Total Paged Memory/Total Swap Memory . . . . . . . . . . . . . . . . . . . . . . . . . . . . . . . . . . . . . . . . . . . . . . . . . . . . 89
Used Disk Space. . . . . . . . . . . . . . . . . . . . . . . . . . . . . . . . . . . . . . . . . . . . . . . . . . . . . . . . . . . . . . . . . . . . . . . . 90
Total Disk Space . . . . . . . . . . . . . . . . . . . . . . . . . . . . . . . . . . . . . . . . . . . . . . . . . . . . . . . . . . . . . . . . . . . . . . . . 90
Free Disk Space . . . . . . . . . . . . . . . . . . . . . . . . . . . . . . . . . . . . . . . . . . . . . . . . . . . . . . . . . . . . . . . . . . . . . . . . 90
Top Memory Process . . . . . . . . . . . . . . . . . . . . . . . . . . . . . . . . . . . . . . . . . . . . . . . . . . . . . . . . . . . . . . . . . 90
Processes Overview . . . . . . . . . . . . . . . . . . . . . . . . . . . . . . . . . . . . . . . . . . . . . . . . . . . . . . . . . . . . . . . . . . . . . 91
Top CPU Process . . . . . . . . . . . . . . . . . . . . . . . . . . . . . . . . . . . . . . . . . . . . . . . . . . . . . . . . . . . . . . . . . . . . 91
Top I/O Process . . . . . . . . . . . . . . . . . . . . . . . . . . . . . . . . . . . . . . . . . . . . . . . . . . . . . . . . . . . . . . . . . . . . . 91
Number of Logins . . . . . . . . . . . . . . . . . . . . . . . . . . . . . . . . . . . . . . . . . . . . . . . . . . . . . . . . . . . . . . . . . . . . . . . 91
Number of Processes . . . . . . . . . . . . . . . . . . . . . . . . . . . . . . . . . . . . . . . . . . . . . . . . . . . . . . . . . . . . . . . . . . . . 91
CPU Tab . . . . . . . . . . . . . . . . . . . . . . . . . . . . . . . . . . . . . . . . . . . . . . . . . . . . . . . . . . . . . . . . . . . . . . . . . . . 91
CPU Utilization . . . . . . . . . . . . . . . . . . . . . . . . . . . . . . . . . . . . . . . . . . . . . . . . . . . . . . . . . . . . . . . . . . . 92
Processor Queue Length. . . . . . . . . . . . . . . . . . . . . . . . . . . . . . . . . . . . . . . . . . . . . . . . . . . . . . . . . . . . 93
Processes Tab . . . . . . . . . . . . . . . . . . . . . . . . . . . . . . . . . . . . . . . . . . . . . . . . . . . . . . . . . . . . . . . . . . . . . . 93
I/O Tab . . . . . . . . . . . . . . . . . . . . . . . . . . . . . . . . . . . . . . . . . . . . . . . . . . . . . . . . . . . . . . . . . . . . . . . . . . . . 94
Memory Tab . . . . . . . . . . . . . . . . . . . . . . . . . . . . . . . . . . . . . . . . . . . . . . . . . . . . . . . . . . . . . . . . . . . . . . . . 95
Paging Activity . . . . . . . . . . . . . . . . . . . . . . . . . . . . . . . . . . . . . . . . . . . . . . . . . . . . . . . . . . . . . . . . . . . . 95
Cache Efficiency . . . . . . . . . . . . . . . . . . . . . . . . . . . . . . . . . . . . . . . . . . . . . . . . . . . . . . . . . . . . . . . . . . 97
Space Tab . . . . . . . . . . . . . . . . . . . . . . . . . . . . . . . . . . . . . . . . . . . . . . . . . . . . . . . . . . . . . . . . . . . . . . . . . . 98
Disk Space Free . . . . . . . . . . . . . . . . . . . . . . . . . . . . . . . . . . . . . . . . . . . . . . . . . . . . . . . . . . . . . . . . . . 98
Disk Space Detail . . . . . . . . . . . . . . . . . . . . . . . . . . . . . . . . . . . . . . . . . . . . . . . . . . . . . . . . . . . . . . . . . 98
Network Tab . . . . . . . . . . . . . . . . . . . . . . . . . . . . . . . . . . . . . . . . . . . . . . . . . . . . . . . . . . . . . . . . . . . . . . . . 99
Session Detail View . . . . . . . . . . . . . . . . . . . . . . . . . . . . . . . . . . . . . . . . . . . . . . . . . . . . . . . . . . . . . . . . . . . . . . . . 99
Oracle Session Detail View. . . . . . . . . . . . . . . . . . . . . . . . . . . . . . . . . . . . . . . . . . . . . . . . . . . . . . . . . . . . . . . . 99
EMBARCADERO TECHNOLOGIES > EMBARCADERO PERFORMANCE CENTER 2.5 EXPERT GUIDE: SYBASE 7
CONTENTS >
Session Memory Tab for Oracle . . . . . . . . . . . . . . . . . . . . . . . . . . . . . . . . . . . . . . . . . . . . . . . . . . . . . . . . 100
Session I/O Tab for Oracle . . . . . . . . . . . . . . . . . . . . . . . . . . . . . . . . . . . . . . . . . . . . . . . . . . . . . . . . . . . . 100
Session Contention Tab for Oracle . . . . . . . . . . . . . . . . . . . . . . . . . . . . . . . . . . . . . . . . . . . . . . . . . . . . . . 100
Session Objects Tab for Oracle . . . . . . . . . . . . . . . . . . . . . . . . . . . . . . . . . . . . . . . . . . . . . . . . . . . . . . . . 101
Session Network Tab for Oracle . . . . . . . . . . . . . . . . . . . . . . . . . . . . . . . . . . . . . . . . . . . . . . . . . . . . . . . . 102
Session SQL Tab for Oracle . . . . . . . . . . . . . . . . . . . . . . . . . . . . . . . . . . . . . . . . . . . . . . . . . . . . . . . . . . . 102
Session Statistics Tab for Oracle . . . . . . . . . . . . . . . . . . . . . . . . . . . . . . . . . . . . . . . . . . . . . . . . . . . . . . . 102
SQL Server Session Detail View. . . . . . . . . . . . . . . . . . . . . . . . . . . . . . . . . . . . . . . . . . . . . . . . . . . . . . . . . . . 103
Overview Tab for SQL Server . . . . . . . . . . . . . . . . . . . . . . . . . . . . . . . . . . . . . . . . . . . . . . . . . . . . . . . . . . 103
SQL Tab for SQL Server . . . . . . . . . . . . . . . . . . . . . . . . . . . . . . . . . . . . . . . . . . . . . . . . . . . . . . . . . . . . . . 105
Blocked By Tab for SQL Server . . . . . . . . . . . . . . . . . . . . . . . . . . . . . . . . . . . . . . . . . . . . . . . . . . . . . . . . 105
Blocking Tab for SQL Server. . . . . . . . . . . . . . . . . . . . . . . . . . . . . . . . . . . . . . . . . . . . . . . . . . . . . . . . . . . 107
All Locks Tab for SQL Server . . . . . . . . . . . . . . . . . . . . . . . . . . . . . . . . . . . . . . . . . . . . . . . . . . . . . . . . . . 108
Sybase Session Detail View . . . . . . . . . . . . . . . . . . . . . . . . . . . . . . . . . . . . . . . . . . . . . . . . . . . . . . . . . . . . . . 109
Overview Tab for Sybase . . . . . . . . . . . . . . . . . . . . . . . . . . . . . . . . . . . . . . . . . . . . . . . . . . . . . . . . . . . . . 109
SQL Tab for Sybase . . . . . . . . . . . . . . . . . . . . . . . . . . . . . . . . . . . . . . . . . . . . . . . . . . . . . . . . . . . . . . . . . 110
Blocked By Tab for Sybase . . . . . . . . . . . . . . . . . . . . . . . . . . . . . . . . . . . . . . . . . . . . . . . . . . . . . . . . . . . . 111
Blocking Tab for Sybase . . . . . . . . . . . . . . . . . . . . . . . . . . . . . . . . . . . . . . . . . . . . . . . . . . . . . . . . . . . . . . 111
All Locks Tab for Sybase. . . . . . . . . . . . . . . . . . . . . . . . . . . . . . . . . . . . . . . . . . . . . . . . . . . . . . . . . . . . . . 112
DB2 Session Detail View . . . . . . . . . . . . . . . . . . . . . . . . . . . . . . . . . . . . . . . . . . . . . . . . . . . . . . . . . . . . . . . . 113
Application Tab for DB2 . . . . . . . . . . . . . . . . . . . . . . . . . . . . . . . . . . . . . . . . . . . . . . . . . . . . . . . . . . . . . . 114
Unit of Work Tab for DB2 . . . . . . . . . . . . . . . . . . . . . . . . . . . . . . . . . . . . . . . . . . . . . . . . . . . . . . . . . . . . . 115
Locking Tab for DB2 . . . . . . . . . . . . . . . . . . . . . . . . . . . . . . . . . . . . . . . . . . . . . . . . . . . . . . . . . . . . . . . . . 117
Memory Tab for DB2 . . . . . . . . . . . . . . . . . . . . . . . . . . . . . . . . . . . . . . . . . . . . . . . . . . . . . . . . . . . . . . . . . 118
I/O Tab for DB2 . . . . . . . . . . . . . . . . . . . . . . . . . . . . . . . . . . . . . . . . . . . . . . . . . . . . . . . . . . . . . . . . . . . . . 119
SQL Statistics Tab for DB2 . . . . . . . . . . . . . . . . . . . . . . . . . . . . . . . . . . . . . . . . . . . . . . . . . . . . . . . . . . . . 121
Top Sessions View . . . . . . . . . . . . . . . . . . . . . . . . . . . . . . . . . . . . . . . . . . . . . . . . . . . . . . . . . . . . . . . . . . . . . . . . 122
Memory Tab . . . . . . . . . . . . . . . . . . . . . . . . . . . . . . . . . . . . . . . . . . . . . . . . . . . . . . . . . . . . . . . . . . . . . . . . . . 122
Memory Tab for Oracle . . . . . . . . . . . . . . . . . . . . . . . . . . . . . . . . . . . . . . . . . . . . . . . . . . . . . . . . . . . . . . . 123
Memory Tab for SQL Server . . . . . . . . . . . . . . . . . . . . . . . . . . . . . . . . . . . . . . . . . . . . . . . . . . . . . . . . . . . 123
Memory Tab for Sybase . . . . . . . . . . . . . . . . . . . . . . . . . . . . . . . . . . . . . . . . . . . . . . . . . . . . . . . . . . . . . . 124
Memory Tab for DB2 . . . . . . . . . . . . . . . . . . . . . . . . . . . . . . . . . . . . . . . . . . . . . . . . . . . . . . . . . . . . . . . . . 125
I/O Tab . . . . . . . . . . . . . . . . . . . . . . . . . . . . . . . . . . . . . . . . . . . . . . . . . . . . . . . . . . . . . . . . . . . . . . . . . . . . . . 126
I/O Tab for Oracle . . . . . . . . . . . . . . . . . . . . . . . . . . . . . . . . . . . . . . . . . . . . . . . . . . . . . . . . . . . . . . . . . . . 126
I/O Tab for SQL Server . . . . . . . . . . . . . . . . . . . . . . . . . . . . . . . . . . . . . . . . . . . . . . . . . . . . . . . . . . . . . . . 127
I/O Tab for Sybase . . . . . . . . . . . . . . . . . . . . . . . . . . . . . . . . . . . . . . . . . . . . . . . . . . . . . . . . . . . . . . . . . . 128
I/O Tab for DB2 . . . . . . . . . . . . . . . . . . . . . . . . . . . . . . . . . . . . . . . . . . . . . . . . . . . . . . . . . . . . . . . . . . . . . 129
CPU Tab . . . . . . . . . . . . . . . . . . . . . . . . . . . . . . . . . . . . . . . . . . . . . . . . . . . . . . . . . . . . . . . . . . . . . . . . . . . . . 130
CPU Tab for Oracle. . . . . . . . . . . . . . . . . . . . . . . . . . . . . . . . . . . . . . . . . . . . . . . . . . . . . . . . . . . . . . . . . . 131
CPU Tab for SQL Server. . . . . . . . . . . . . . . . . . . . . . . . . . . . . . . . . . . . . . . . . . . . . . . . . . . . . . . . . . . . . . 131
EMBARCADERO TECHNOLOGIES > EMBARCADERO PERFORMANCE CENTER 2.5 EXPERT GUIDE: SYBASE 8

CONTENTS >
CPU Tab for Sybase . . . . . . . . . . . . . . . . . . . . . . . . . . . . . . . . . . . . . . . . . . . . . . . . . . . . . . . . . . . . . . . . . 131
CPU Tab for DB2 . . . . . . . . . . . . . . . . . . . . . . . . . . . . . . . . . . . . . . . . . . . . . . . . . . . . . . . . . . . . . . . . . . . 132
Top SQL View . . . . . . . . . . . . . . . . . . . . . . . . . . . . . . . . . . . . . . . . . . . . . . . . . . . . . . . . . . . . . . . . . . . . . . . . . . . . 132
EMBARCADERO TECHNOLOGIES > EMBARCADERO PERFORMANCE CENTER 2.5 EXPERT GUIDE: SYBASE 9

Sybase Expert GuideThis section includes expert help for all Sybase ASE categories and statistics in the Embarcadero Performance Center views. For detailed information on using the application, see Using Embarcadero Performance Center. The Embarcadero Performance Center Sybase Expert Guide is divided into the following sections:
Home View
Memory Statistics
I/O Statistics
Space Statistics
Databases Statistics
Contention Statistics
Users Statistics
Network Statistics
Other Views and Statistics
NOTE: Sybase 12.5.0.3 users should make sure their MDA tables are properly configured so they can see all available statistics. Please refer to the instructions for enabling MDA tables.
Enabling MDA TablesIn ASE 12.5.0.3, a new feature called "MDA tables" was introduced. These proxy tables are mapped to RPCs which provide access to low-level monitoring information about the server.
For more information see: http://www.sybase.com/detail?id=1010039 “The MDA tables – New Monitoring Capabilities in ASE 12.5.0.3”
DBArtisan’s Performance Analyst for Sybase requires these tables be installed to enable several statistics, for example the Top SQL view.
Please follow the instructions below to install and configure these tables.
1 Ensure the ‘enable cis” configuration parameter is set to 1.
sp_configure 'enable cis'
go
2 Add the ‘loopback’ server name alias.
if not exists (select 1 from master..sysservers where srvname = "loopback")
BEGIN
exec sp_addserver "loopback", null, <enter your server name>
END
3 Install the MDA tables.
The script can be found in the following location:
$SYBASE/$SYBASE_ASE/scripts/installmontables.
EMBARCADERO TECHNOLOGIES > EMBARCADERO PERFORMANCE CENTER 2.5 EXPERT GUIDE: SYBASE 10
SYBASE EXPERT GUIDE > HOME VIEW STATISTICS - SYBASE
4 Assign the ‘mon_role’ to logins allowed MDA access.
NOTE: The ‘sa’ login requires this grant as well.
use master
go
grant role mon_role to sa
go
5 Enable the following configuration parameters.
exec sp_configure "enable monitoring", 1
exec sp_configure "sql text pipe active", 1
exec sp_configure "sql text pipe max messages", 2000
exec sp_configure "plan text pipe active", 1
exec sp_configure "plan text pipe max messages", 2000
exec sp_configure "statement pipe active", 1
exec sp_configure "statement pipe max messages", 2000
exec sp_configure "errorlog pipe active", 1
exec sp_configure "errorlog pipe max messages", 2000
exec sp_configure "deadlock pipe active", 1
exec sp_configure "deadlock pipe max messages", 2000
exec sp_configure "wait event timing", 1
exec sp_configure "process wait events", 1
exec sp_configure "object lockwait timing", 1
exec sp_configure "SQL batch capture", 1
exec sp_configure "statement statistics active", 1
exec sp_configure "per object statistics active", 1
exec sp_configure "max SQL text monitored", 2000
Home View Statistics - SybaseThe Embarcadero Performance Center Home view lets you review availability and overall performance of all monitored databases from a single window. Statistics on the Home view are organized into the following categories:
• Contention Vital Signs
• I/O Vital Signs
• Memory Vital Signs
• Network Vital Signs
• Space Vital Signs
• Users Vital Signs
EMBARCADERO TECHNOLOGIES > EMBARCADERO PERFORMANCE CENTER 2.5 EXPERT GUIDE: SYBASE 11

SYBASE EXPERT GUIDE > HOME VIEW STATISTICS - SYBASE
Memory Vital SignsThe following memory statistics are on the Sybase Home view:
• Data Cache Hit Rate
• Procedure Cache Hit Rate
• Large I/O Hit Rate
• Clean Buffer Grab Rate
Data Cache Hit Rate• Metrics
• Troubleshooting
Data read from memory produces end-user response times many times faster than when that same data is read from disk. The Sybase data cache assists with keeping physical I/Os to an absolute minimum.
The data cache hit rate is an excellent indicator of how often user requests for data are satisfied through memory vs. being physically read from disk. The table below describes the three key counters in Sybase used to arrive at this statistic:
TIP: Click this statistic to drill down to the Cache Activity tab of the Memory Detail view.
MetricsTo help ensure excellent performance, keep your cache hit rate in the neighborhood of 90% or greater. Lower amounts can be okay for user ad hoc databases where sporadic, large table scan operations occur. However, anything below this general threshold for normal databases can require tuning attention, and the adjustment of the Sybase memory tuning parameters.
If you are using named caches, you can drill down into the cache hit rates for each named cache. This helps you understand which objects/operations are depressing the overall cache hit rate for the server.
TroubleshootingIf a problem is found in Sybase servers, versions 11-12, you can increase the amount of the total memory configuration parameter or reduce the percentage of memory allocated to the procedure cache (by default, the data cache assumes any free memory left over after Sybase has met its kernel and procedure cache needs). Take care when reducing the procedure cache, as this could reduce performance in the server as it relates to reading procedures in from disk.
For Sybase 12.5, the total memory configuration parameter can again be increased to provide more memory for the data cache (and any named caches), but in 12.5, if you wish to reduce the size of the procedure cache, note that it is now configured in terms of literal size instead of a percentage of the overall configured memory.
Once the data cache has been adjusted, monitor Sybase to see if the cache hit rate improves. If it does not, another increase may be necessary and examination of unnecessary large table scan operations. Also, keep a careful eye on the actual machine’s memory limits and swap activity. Increased swap activity can be indicative of too little memory left for the server machine.
Counter Description
LOGICAL READS Data read from memory for user requests.
PAGES PER I/O The number of pages retrieved in a single I/O operation.
PHYSICAL READS Data read physically from disk.
EMBARCADERO TECHNOLOGIES > EMBARCADERO PERFORMANCE CENTER 2.5 EXPERT GUIDE: SYBASE 12

SYBASE EXPERT GUIDE > HOME VIEW STATISTICS - SYBASE
Procedure Cache Hit Rate• Metrics
• Troubleshooting
The Sybase procedure cache is used to hold the definitions and query plans of stored procedures and triggers. It is used for short-term memory needs like statistics and query plans for parallel queries. When a user executes a stored procedure, Sybase looks in the procedure cache for a query plan to use. If a query plan is available, Sybase places it on the most recently used (MRU) end of the memory chain and the procedure begins to execute. If no execution plan is in memory, or if all copies of the plan are currently being used, the query tree for the procedure is read in again from the data dictionary, optimized, put on the MRU end of the chain, and executed. Note that other operations, like CREATE INDEX, can also use the procedure cache even when no procedure is referenced.
The more often that a procedure’s plan and definition can be referenced in memory, the better the procedure execution time.
MetricsA high procedure cache hit rate is a desirable thing. You should strive for a hit ratio between 95-100%, with 95% being a good performance benchmark for procedure code reference. Note that when a database is first started, the procedure cache hit rate is not at an optimal level because all code being used is relatively new, and as such, must be read in from disk and placed into the cache. If, however, after a solid hour or two of steady database time, the procedure cache hit rate has not increased to desirable levels, you should look into the possibility of increasing the amount of memory allocated to the cache.
Note that you can drill down into the procedure cache to view the procedures currently in memory along with how much memory they are consuming.
If there is not enough memory to load a requested procedure, or the maximum number of compiled objects is already in use, Sybase returns an error (normally a 701).
TroubleshootingIf a problem is found in Sybase servers, versions 11-12, you can increase the amount of the total memory configuration parameter or increase the percentage of memory allocated to the procedure cache (by default, the data cache assumes any free memory left over after Sybase has met its kernel and procedure cache needs). Take care when increasing the procedure cache alone, as this could increase query response times due to more physical I/O being performed.
For Sybase 12.5, the total memory configuration parameter can again be increased to provide more memory for the Sybase server, but in 12.5, if you wish to increase the size of the procedure cache, note that it is now configured in terms of literal size instead of a percentage of the overall configured memory.
Once the procedure cache has been adjusted, monitor Sybase to see if the cache hit rate improves. If it does not, another increase may be necessary. Also, keep a careful eye on the actual machine’s memory limits and swap activity. Increased swap activity can be indicative of too little memory left for the server machine.
Large I/O Hit Rate• Metrics
• Troubleshooting
Large I/O can be enabled by splitting the default or any named cache into pools. By default, Sybase performs I/O operations based on a 2-KB page size. For queries where pages are stored and accessed in a sequential manner, it is possible to read many more data pages in a single I/O operation. Large I/O can greatly reduce disk access time when the right situations exist. Operations that routinely perform large table scans, access image or text data, do bulk copies, scan the leaf level of nonclustered indexes, or initiate DBCC tasks can benefit from large I/O.
EMBARCADERO TECHNOLOGIES > EMBARCADERO PERFORMANCE CENTER 2.5 EXPERT GUIDE: SYBASE 13

SYBASE EXPERT GUIDE > HOME VIEW STATISTICS - SYBASE
If large I/O has been configured and is being used, you should observe a high percentage of hits (the number of times large I/O could be performed vs. the number of times large I/O requests were denied by the server). If large I/O is not configured, no large I/O activity should be present.
MetricsAs you might expect, if large I/O is in use, a high hit rate is desirable. You should strive for a hit ratio between 90-100%, with 90% being a good performance benchmark.
TroubleshootingIf large I/O is configured, but a low hit rate is being observed, you should configure more caches for large I/O use.
Clean Buffer Grab Rate• Metrics
• Troubleshooting
As information is requested from users, buffers are moved into and out of the Sybase data cache. Pages are also modified in the cache (termed dirty buffers) and need to be written out to disk. If Sybase has to wait for a dirty buffer to be written out to disk before a requested buffer is placed into the cache, performance can suffer.
The clean buffer grab rate represents the percentage of time clean buffers were found and referenced in the cache as opposed to Sybase finding dirty buffers.
MetricsIdeally, the clean buffer grab rate should stay at or near 100%.
TroubleshootingSeeing a poor clean buffer grab rate for either the default or named caches could indicate that the cache size is too small. You can look into adjusting the total memory configuration parameter higher. Keep a careful eye on the actual machine’s memory limits and swap activity. Increased swap activity can be indicative of too little memory left for the server machine.
Contention Vital SignsThe following contention statistics are on the Sybase Home view:
• Blocking Lock Rate
• Deadlock Rate
• Device I/O Contention
• Network Contention Rate
Blocking Lock Rate• Metrics
• Troubleshooting
EMBARCADERO TECHNOLOGIES > EMBARCADERO PERFORMANCE CENTER 2.5 EXPERT GUIDE: SYBASE 14

SYBASE EXPERT GUIDE > HOME VIEW STATISTICS - SYBASE
A single blocking user has the potential to stop work for nearly all other processes on a small system, and can cause major headaches on large systems. Although Sybase supports flexible locking mechanisms, blocking lock situations do crop up. Blocks are most often caused by user processes holding exclusive locks and not releasing them via a proper COMMIT frequency.
The blocking lock rate displays the percentage of times blocks occurred vs. the percentage of locks requested and immediately granted.
TIP: Click this statistic to drill down to the Blocking Lock Rate tab of the Locks view.
MetricsImmediately investigate a percentage much above zero so the situation does not mushroom.
You can easily drill down with Embarcadero Performance Center and discover the exact process(es) holding locks that are blocking out other user activity.
TroubleshootingOnce you discover a blocking lock situation, you can normally remedy it by issuing a KILL against the offending process. This eliminates the user’s stranglehold on the objects the user was accessing, and usually results in other user processes completing in an instant. Embarcadero Performance Center makes discovering the blocked lock situation easier; preventing the blocking lock situation in the first place is tricky.
The culprit of blocking lock scenarios is usually the application design, or the SQL being used within the application itself. Properly coding an application to reference database objects in an efficient order, and then using the right SQL to get the job done, is an art. The key to avoiding lock contention is to process user transactions in the quickest and most efficient manner possible - something not always easy to do.
By default, all processes wait indefinitely for locks in Sybase. You can change this behavior by modifying the Lock Wait Period configuration parameter, which limits the number of seconds that a process waits for a lock before timing out.
Deadlock Rate• Metrics
• Troubleshooting
A deadlock occurs when two processes have a lock on a separate page or object and each wants to acquire a lock on the other process’ page or object. Each waits for the other to release the necessary lock. Sybase constantly checks for deadlocks and, when found, chooses the transaction that has accumulated the least amount of CPU time and terminates the transaction. The server then rolls back that transaction and issues a notification of the event. The other process gets to move forward.
The deadlock rate displays the percentage of times deadlocks occurred vs. the percentage of locks requested and immediately granted.
MetricsYou should immediately investigate a percentage much above zero to prevent the situation from mushrooming. You can easily drill down and discover the exact process(es) holding locks and deadlocks that are blocking out other user activity.
TroubleshootingWell-designed applications can minimize deadlocks by always acquiring locks in the same order. You should always do updates to multiple tables in the same order.
EMBARCADERO TECHNOLOGIES > EMBARCADERO PERFORMANCE CENTER 2.5 EXPERT GUIDE: SYBASE 15

SYBASE EXPERT GUIDE > HOME VIEW STATISTICS - SYBASE
Once Sybase discovers a deadlock, it takes action and remedies the situation. Embarcadero Performance Center makes it easier to discover how prevalent deadlock activity is on a system; preventing deadlocks from occurring in the first place is more difficult.
Those responsible for writing systems can minimize deadlocks by ensuring that applications acquire locks in the same order. Likewise, you should always do updates and other DML that act on multiple tables in the same order.
You can also shrink the amount of time that Sybase waits to check for deadlocks by modifying the deadlock checking period configuration parameter.
Device I/O Contention• Metrics
• Troubleshooting
When a request for data involves physical I/O, Sybase first fills out the block I/O structure and links it to a per engine I/O queue. If two or more Sybase engines request an I/O structure from the same device at the exact same time, the server puts one of them to sleep where it waits for the semaphore it needs.
MetricsAn I/O contention percentage consistently greater than 10% should be cause for concern.
TroubleshootingDistributing the accessed objects across multiple devices can lessen contention for I/O device semaphores. You can also place devices on different physical drives to lessen contention at the operating system level as well.
Network Contention Rate• Metrics
• Troubleshooting
The Sybase server normally sends and receives network packets at a regular rate. If the network begins to become saturated, Sybase could experience delays in network I/O. The network contention rate indicates the percentage of times network I/O activity was delayed.
MetricsSeeing a network contention rate greater than 1% could indicate a challenged network structure.
TroubleshootingOutside of ensuring that the existing network is sufficient for handling the current load (database and non-database), other items to look at from a Sybase specific standpoint include validating that only the necessary amount of data is being sent and returned to requesting users. You can also examine the default packet size and see if it is too small for the average packet size being sent/received by the Sybase server.
I/O Vital SignsThe following I/O statistics are on the Sybase Home view:
• Total Server Reads
• Total Server Writes
EMBARCADERO TECHNOLOGIES > EMBARCADERO PERFORMANCE CENTER 2.5 EXPERT GUIDE: SYBASE 16

SYBASE EXPERT GUIDE > HOME VIEW STATISTICS - SYBASE
• Txn Log Writes
• I/O Errors
Total Server Reads• Metrics
Total Server Reads reflect the total number of physical reads performed by the database server since the last refresh inside Embarcadero Performance Center.
MetricsLarge numbers of physical reads could reflect a too small data or procedure cache. You should examine the data and procedure cache hit rates to determine the overall effectiveness of logical vs. physical I/O.
Total Server WritesThe Total Server Writes value reflects total number of physical writes performed by the database server since the last refresh inside Embarcadero Performance Center.
MetricsNone.
Txn Log WritesTransaction Log Writes refers to the number of times Sybase wrote a transaction log page to disk since the last refresh inside Embarcadero Performance Center. When the current log page becomes full, Sybase writes it out to disk. Sybase also writes transaction log pages to disk after a transaction commits.
MetricsNone.
I/O Errors• Metrics
The I/O Errors value reflects total number of I/O errors (errors during read and write operations) encountered by the database server since the last refresh inside Embarcadero Performance Center.
MetricsYou should investigate large numbers of I/O errors by examining the database error log.
Users Vital SignsThe following user statistics are on the Sybase Home view:
• Total Connections
• Active Connections
EMBARCADERO TECHNOLOGIES > EMBARCADERO PERFORMANCE CENTER 2.5 EXPERT GUIDE: SYBASE 17
SYBASE EXPERT GUIDE > HOME VIEW STATISTICS - SYBASE
• Committed Transactions
• Current Locks
Total Connections• Metrics
• Troubleshooting
The Total Connections statistic represents the total number of open threads, or connections, currently reported in the Sybase server. This number includes both active and inactive processes.
TIP: Click this statistic to drill down to the Processes tab of the Users Detail view.
MetricsYou should view the total number of connections in light of the maximum number of processes allowed to connect to Sybase. The Number of User Connections parameter specifies the maximum number of user processes that can simultaneously connect to a Sybase server.
TroubleshootingIf the total number of connections approaches the number of user connections limit, you should:
1 Edit the configuration file for Sybase.
2 Increase the amount of number of user connections to a higher value.
3 Cycle the Sybase server when possible to allow the new value to take effect.
Active ConnectionsThe Active Connections statistic represents the total number of active and open threads reported in the Sybase server. This number displays the number of processes actively performing work.
TIP: Click this statistic to drill down to the Processes tab of the Users Detail view.
MetricsNone.
Committed Transactions• Metrics
Committed Transactions reflects the number of transactions committed since the last refresh inside Embarcadero Performance Center. This includes transactions that meet explicit, implicit, and ANSI definitions for committed transactions. Note also that Sybase counts multidatabase transactions.
TIP: Click this statistic to drill down to the Transactions tab of the Users Detail view.
MetricsMultidatabase transactions generally incur more overhead than single database transactions (for example, a transaction that modifies two databases is counted as two transactions). They usually involve more log activity, cause more ULC flushes, and involve two-phase commits between the different databases. You can improve performance by reducing the number of multidatabase transactions.
EMBARCADERO TECHNOLOGIES > EMBARCADERO PERFORMANCE CENTER 2.5 EXPERT GUIDE: SYBASE 18

SYBASE EXPERT GUIDE > HOME VIEW STATISTICS - SYBASE
Current Locks• Metrics
• Troubleshooting
The Current Locks statistic displays the total number of locks obtained/requested by processes in the database.
TIP: Click this statistic to drill down to the All Locks tab of the Locks view.
MetricsThe main thing to watch with respect to current locks is that no DML locks currently held on the system approach the number of locks limit specified in the Sybase server’s configuration. The parameter number of locks limits how many locks can exist on the system at one time.
TroubleshootingIf the total number of locks approaches the number of locks limit, you should:
1 Ensure that user processes are efficiently using locks and are committing frequently to avoid excessive lock hold times before editing the current Sybase configuration.
2 Edit the configuration file for the Sybase server.
3 Increase the amount of number of locks to a higher value.
4 Cycle the Sybase server when possible to allow the new value to take effect.
Space Vital SignsThe following space statistics are on the Sybase Home view:
• Databases Low on Space
• Logs Low on Space
Databases Low on Space• Metrics
• Troubleshooting
The Databases Low on Space statistic indicates if any databases in the server are approaching low levels of available free space. Although good to know, you need a more detailed listing by database to determine where any actual space shortages exist in the server. You can view this information in the Embarcadero Performance Center Space performance category view.
MetricsIf any one database begins to approach 90% used space, and is continuing to dynamically grow, you should take action to prevent any future space allocation errors.
TroubleshootingIf a database is approaching its limit on space, a DBA can either extend the database onto a new device, or if space exists on the device where the database currently resides, the DBA can allocate more space for the database on the current device.
EMBARCADERO TECHNOLOGIES > EMBARCADERO PERFORMANCE CENTER 2.5 EXPERT GUIDE: SYBASE 19

SYBASE EXPERT GUIDE > HOME VIEW STATISTICS - SYBASE
Logs Low on Space• Metrics
• Troubleshooting
This statistic indicates if any log for a database in the Sybase server is approaching low levels of available free space. Although good to know, a more detailed listing by database is needed to determine where any actual space shortages exist in the server. This information can be viewed in the Embarcadero Performance Center Space performance category view.
MetricsIf a database log’s used space begins to approach 90%, you should take action to prevent any future space allocation errors. If the transaction log runs out of space, no transactions can take place in the database until you free up space in the log.
TroubleshootingIf a database log consistently approaches its limit on used space, there are a few actions a DBA can take to prevent a database from freezing.
A backup (dump) of the log can be taken:
• If log backups are not required for disaster recovery, the truncate log on checkpoint option can be set for the database. Setting this option deletes any space devoted to transactions in the log that have already completed when a database checkpoint occurs.
• You can extend the log onto a new device. Or, if space exists on the device on which the database log currently resides, you can allocate more space for the log on the current device.
Network Vital SignsThe following network statistics are on the Sybase Home view:
• Network Requests
• Network Delays
• Bytes Received
• Bytes Sent
Network RequestsThe Network Requests statistic represents the total TDS packets received and sent since Embarcadero Performance Center was last refreshed.
MetricsNone.
Network Delays• Metrics
• Troubleshooting
EMBARCADERO TECHNOLOGIES > EMBARCADERO PERFORMANCE CENTER 2.5 EXPERT GUIDE: SYBASE 20

SYBASE EXPERT GUIDE > MEMORY STATISTICS - SYBASE
Network Delays represents the number of times I/O was delayed since Embarcadero Performance Center was last refreshed.
MetricsSeeing a value much above zero could indicate a challenged network structure.
TroubleshootingOutside of ensuring that the existing network is sufficient for handling the current load (database and non-database), other items to look at from a Sybase specific standpoint include validating that only the necessary amount of data is being sent and returned to requesting users. You can also examine the default packet size and see if it is too small for the average packet size being sent/received by the Sybase server.
Bytes ReceivedThis statistic represents the number of bytes received by Sybase since Embarcadero Performance Center was last refreshed.
MetricsNone.
Bytes SentBytes Sent represents the number of bytes sent by Sybase to client applications since Embarcadero Performance Center was last refreshed.
MetricsNone.
Memory Statistics - SybaseThe Memory performance category view displays the following vital Sybase memory statistics:
• Cache Allocations
• Dirty Buffers Grabbed
• Data Cache Activity
• Dirty Read Requests
• Dirty Read Restarts
• Large I/O Hit Rate
• Large I/O Acquired
• Large I/O Denied
• New Pages Allocated
• Procedure Cache Activity
• Procedure Reads from Disk
EMBARCADERO TECHNOLOGIES > EMBARCADERO PERFORMANCE CENTER 2.5 EXPERT GUIDE: SYBASE 21

SYBASE EXPERT GUIDE > MEMORY STATISTICS - SYBASE
• Procedure Requests
• Procedure Removals
• Procedure Writes from Disk
• Session Leaders - Memory
Data Cache Activity• Metrics
• Troubleshooting
Data read from memory produces end-user response times many times faster than when that same data is read from disk. Keeping physical I/Os to an absolute minimum is something that the Sybase data cache tries to assist with.
The data cache hit activity rate is an excellent indicator of how often user requests for data are satisfied through memory vs. being physically read from disk. The table below lists three key counters in Sybase used to arrive at this statistic:
TIP: Click this category heading to drill down to the Cache Activity tab of the Memory Detail view.
MetricsTo help ensure excellent performance, you want to keep your cache hit rate in the neighborhood of 90% or greater. Lower amounts can be okay for user ad hoc databases where sporadic, large table scan operations occur. However, anything below this general threshold for normal databases can require tuning attention, and the adjustment of the Sybase memory tuning parameters.
If you are using named caches, you can drill down into the cache hit rates for each named cache. This helps you understand which objects/operations are depressing the overall cache hit rate for the server.
TroubleshootingIf a problem is found in Sybase servers, versions 11-12, you can increase the amount of the total memory configuration parameter and/or reduce the percentage of memory allocated to the procedure cache (by default, the data cache assumes any free memory left over after Sybase has met its kernel and procedure cache needs). Take care when reducing the procedure cache, as this could reduce performance in the server as it relates to reading procedures in from disk.
For Sybase 12.5, the total memory configuration parameter can again be increased to provide more memory for the data cache (and any named caches), but in 12.5, if you wish to reduce the size of the procedure cache, note that it is now configured in terms of literal size instead of a percentage of the overall configured memory.
Once the data cache has been adjusted, monitor Sybase to see if the cache hit rate improves. If it does not, another increase may be necessary as will an examination of unnecessary large table scan operations.
Counter Description
LOGICAL READS Data read from memory for user requests.
PAGES PER I/O The number of pages retrieved in a single I/O operation.
PHYSICAL READS Data read physically from disk.
EMBARCADERO TECHNOLOGIES > EMBARCADERO PERFORMANCE CENTER 2.5 EXPERT GUIDE: SYBASE 22

SYBASE EXPERT GUIDE > MEMORY STATISTICS - SYBASE
New Pages AllocatedThe statistic reports the number of times that a new page was allocated in memory for Sybase since the last refresh in Embarcadero Performance Center.
MetricsNone.
Dirty Buffers Grabbed• Metrics
• Troubleshooting
As information is requested from users, buffers are moved into and out of the Sybase data cache. Pages are also modified in the cache (termed dirty buffers) and need to be written out to disk. If Sybase has to wait for a dirty buffer to be written out to disk before a requested buffer is placed into the cache, performance can suffer.
This statistic represents the number of times Sybase found dirty buffers since the last refresh in Embarcadero Performance Center.
MetricsIdeally, the dirty buffer grab statistic should stay close to zero.
TroubleshootingSeeing high numbers for this statistic could indicate that the cache size is too small. You can want to look into carefully adjusting the total memory configuration parameter higher. However, keep a careful eye on the actual machine’s memory limits and swap activity. Increased swap activity can be indicative of too little memory left for the server machine.
Dirty Read Requests• Metrics
Sybase allows dirty reads, which are reads of uncommitted data. To accomplish a dirty read, Sybase uses a special lightweight protection mechanism to gain access to an object without using actual page locks. This statistic displays the number of dirty reads that occurred since the last refresh in Embarcadero Performance Center.
MetricsDirty read page requests can incur significant overhead if they are observed with many dirty read restarts.
Dirty Read Restarts• Metrics
• Troubleshooting
Sybase allows dirty reads, which are reads of uncommitted data. To accomplish a dirty read, Sybase uses a special lightweight protection mechanism to gain access to an object without using actual page locks. A dirty read restart occurs when a dirty read is active on an object page, and another process makes changes to the page that cause the page to be deallocated in memory. The scan for the dirty read must be restarted. The amount shown for dirty read restarts are the number of restarts that occurred since the last Embarcadero Performance Center refresh.
EMBARCADERO TECHNOLOGIES > EMBARCADERO PERFORMANCE CENTER 2.5 EXPERT GUIDE: SYBASE 23

SYBASE EXPERT GUIDE > MEMORY STATISTICS - SYBASE
MetricsValues observed much above zero should serve as a signal that application modifications can be in order. Most applications should do everything possible to avoid restarts because of the large overhead they incur.
TroubleshootingIf the numbers observed for dirty read restarts are significant, you can want to look into modifying applications that use dirty reads to accomplish data acquisition.
Procedure Cache Activity• Metrics
• Troubleshooting
The Sybase procedure cache is used to hold the definitions and query plans of stored procedures and triggers and is used for short-term memory needs like statistics and query plans needed for parallel queries. When a user executes a stored procedure, Sybase looks in the procedure cache for a query plan to use. If a query plan is available, Sybase places it on the most recently used (MRU) end of the memory chain and execution of the procedure begins. If no execution plan is in memory, or if all copies of the plan are currently being used, the query tree for the procedure is read in again from the data dictionary, optimized, put on the MRU end of the chain, and executed. Note that other operations, like CREATE INDEX, can also use the procedure cache even when no procedure is referenced.
The percentage of times that a procedure’s plan and definition can be referenced in memory, the better the procedure execution time.
MetricsA high procedure cache hit rate is a desirable thing. You should strive for a hit ratio between 95-100%, with 95% being a good performance benchmark for procedure code reference. Note that when a database is first started, the procedure cache hit rate is not at an optimal level because all code being used is relatively new, and as such, must be read in from disk and placed into the cache. If, however, after a solid hour or two of steady database time, the procedure cache hit rate has not increased to desirable levels, you should look into the possibility of increasing the amount of memory allocated to the cache.
If there is not enough memory to load a requested procedure, or the maximum number of compiled objects is already in use, Sybase returns an error (normally a 701).
TroubleshootingIf a problem is found in Sybase servers, versions 11-12, you can increase the amount of the total memory configuration parameter and/or increase the percentage of memory allocated to the procedure cache (by default, the data cache assumes any free memory left over after Sybase has met its kernel and procedure cache needs). Take care when increasing the procedure cache alone, as this could increase query response times due to more physical I/O being performed.
For Sybase 12.5, the total memory configuration parameter can again be increased to provide more memory for the Sybase server, but in 12.5, if you wish to increase the size of the procedure cache, note that it is now configured in terms of literal size instead of a percentage of the overall configured memory.
Once the procedure cache has been adjusted, monitor Sybase to see if the cache hit rate improves. If it does not, another increase may be necessary. Also, keep a careful eye on the actual machine’s memory limits and swap activity. Increased swap activity can be indicative of too little memory left for the server machine.
EMBARCADERO TECHNOLOGIES > EMBARCADERO PERFORMANCE CENTER 2.5 EXPERT GUIDE: SYBASE 24
SYBASE EXPERT GUIDE > MEMORY STATISTICS - SYBASE
Procedure RequestsThis statistic reports the number of times that stored procedures were executed since Embarcadero Performance Center was last refreshed. Such a request could use either an unused copy of the procedure’s query plan in memory or if no such copy exists, the procedure must be read in from disk.
Metrics None.
Procedure Reads from Disk• Metrics
• Troubleshooting
This statistic reports the number of times since Embarcadero Performance Center was last refreshed that stored procedures were read from disk rather than copied in the procedure cache.
MetricsYou should examine this number in conjunction with the overall procedure cache hit rate. Observing large numbers in this statistic indicates a lower than ideal procedure cache hit rate. Note that when a database is first started, this statistic is likely larger than desired because all code being used is relatively new and as such, must be read in from disk and placed into the cache. If, however, after a solid hour or two of steady database time, the procedure cache hit rate has not increased to desirable levels and this statistic continues to sport high numbers, you should look into the possibility of increasing the amount of memory allocated to the cache.
TroubleshootingIf a problem is found in Sybase servers, versions 11-12, you can increase the amount of the total memory configuration parameter and/or increase the percentage of memory allocated to the procedure cache (by default, the data cache assumes any free memory left over after Sybase has met its kernel and procedure cache needs). Take care when increasing the procedure cache alone, as this could increase query response times due to more physical I/O being performed.
For Sybase 12.5, the total memory configuration parameter can again be increased to provide more memory for the Sybase server, but in 12.5, if you wish to increase the size of the procedure cache, note that it is now configured in terms of literal size instead of a percentage of the overall configured memory.
Once the procedure cache has been adjusted, monitor Sybase to see if the cache hit rate improves. If it does not, another increase may be necessary. Also, keep a careful eye on the actual machine’s memory limits and swap activity. Increased swap activity can be indicative of too little memory left for the server machine.
Procedure Writes to DiskThis statistic reports the number of times since Embarcadero Performance Center was last refreshed that stored procedures were created.
MetricsNone.
EMBARCADERO TECHNOLOGIES > EMBARCADERO PERFORMANCE CENTER 2.5 EXPERT GUIDE: SYBASE 25
SYBASE EXPERT GUIDE > MEMORY STATISTICS - SYBASE
Procedure Removals• Metrics
• Troubleshooting
This statistic reports the number of times since Embarcadero Performance Center was last refreshed that stored procedures were aged out of the procedure cache.
MetricsHigh numbers, along with a lower than desired procedure cache hit rate, could indicate too small a procedure cache.
TroubleshootingIf a problem is found in Sybase servers, versions 11-12, you can increase the amount of the total memory configuration parameter and/or increase the percentage of memory allocated to the procedure cache (by default, the data cache assumes any free memory left over after Sybase has met its kernel and procedure cache needs). Take care when increasing the procedure cache alone, as this could increase query response times due to more physical I/O being performed.
For Sybase 12.5, the total memory configuration parameter can again be increased to provide more memory for the Sybase server, but in 12.5, if you wish to increase the size of the procedure cache, note that it is now configured in terms of literal size instead of a percentage of the overall configured memory.
Once the procedure cache has been adjusted, monitor Sybase to see if the cache hit rate improves. If it does not, another increase may be necessary. Also, keep a careful eye on the actual machine’s memory limits and swap activity. Increased swap activity can be indicative of too little memory left for the server machine.
Large I/O Hit Rate• Metrics
• Troubleshooting
Large I/O can be enabled by splitting the default or any named cache into pools. By default, Sybase performs I/O operations based on a 2-KB page size. For queries where pages are stored and accessed in a sequential manner, it is possible to read many more data pages in a single I/O operation. Large I/O can greatly reduce disk access time when the right situations exist. Operations that routinely perform large table scans, access image or text data, do bulk copying, scan the leaf level of nonclustered indexes, or initiate DBCC tasks can benefit from large I/O.
If large I/O has been configured and is being used, you should observe a high percentage of hits (the number of times large I/O could be performed vs. the number of times large I/O requests were denied by the server). If large I/O is not configured, no large I/O activity should be present.
The table below describes the other large I/O statistics available on the Memory Detail view:
Statistic Description
Large I/O Acquired This statistic measures the number of times that a requested large I/O operation was performed since the last Embarcadero Performance Center refresh.
Large I/O Denied This statistic measures the number of times since the last Embarcadero Performance Center refresh that large I/O could not be performed since the last Embarcadero Performance Center refresh. You should examine nonzero numbers in light of the overall large I/O hit rate. If large I/O is configured, but you observe nonzero values for Large I/O Denied and a low Large I/O hit rate is also present, you should configure more caches for large I/O use.
EMBARCADERO TECHNOLOGIES > EMBARCADERO PERFORMANCE CENTER 2.5 EXPERT GUIDE: SYBASE 26
SYBASE EXPERT GUIDE > MEMORY STATISTICS - SYBASE
MetricsAs you might expect, if large I/O is in use, a high hit rate is desirable. You should strive for a hit ratio between 90-100%, with 90% being a good performance benchmark.
TroubleshootingIf large I/O is configured, but a low hit rate is being observed, you should configure more caches for large I/O use.
Session Leaders - Memory• Metrics
• Troubleshooting
It is common for one or two users to cause the majority of runtime problems that plague a database. The problem could be a runaway process, an untuned batch procedure, or other user-initiated operation. Frequently, user connections can get out of hand with memory consumption, and extreme cases have caused headaches at both the database and operating system levels.
The leading memory session’s display identifies the top users in the server with respect to memory consumption.
TIP: Click this category heading to drill down to the Leading Sessions tab of the I/O Detail view.
MetricsIf your server does not have an overabundance of memory, you should periodically check to see who your heavy memory users are along with the total percentage of memory each takes up. If you see one or two users who have more than 5-15% of the total memory usage, you should investigate the sessions further to see what activities they are performing.
TroubleshootingYou can use the Session Leaders - Memory statistic to find the users with the greatest current allocations of overall memory. Runaway processes can be immediately terminated from within the Embarcadero Performance Center Client.
Cache AllocationsThe Sybase cache areas are devoted to facilitating the transfer of data and information between clients and the Sybase database. The table below describes their main tunable components:
MetricsNone.
Component Description
Procedure Cache Is used to hold the definitions and query plans of stored procedures and triggers and is used for short-term memory needs like statistics and query plans needed for parallel queries.
Data Cache Maintains data blocks that are read from the database. Properly sizing the data cache (both default and named caches) goes a long way to improving response time performance.
EMBARCADERO TECHNOLOGIES > EMBARCADERO PERFORMANCE CENTER 2.5 EXPERT GUIDE: SYBASE 27
SYBASE EXPERT GUIDE > MEMORY STATISTICS - SYBASE
Memory Detail ViewThe following tabbed pages are available on the Memory Detail view:
• Cache Activity
• Leading Sessions
• Page Activity
Leading Sessions Tab• Metrics
It is not uncommon for one or two users to cause the majority of runtime problems that plague a database. The problem could be a runaway process, an untuned batch procedure, or other user-initiated operation. User connections can get out of hand with memory consumption, and extreme cases have caused headaches at both the database and operating system levels.
Embarcadero Performance Center displays information to help you find processes that are using the most memory on the server on the Leading Sessions tab of the Memory Detail view and the Memory tab of the Top Sessions view.
The table below describes the information available on these tabs:
NOTE: This information is available on both the Leading Sessions tab of the Memory Detail view and the Memory tab of the Top Sessions view.
TIP: To configure the grid to show/hide row numbers, use the Options Editor.
MetricsIf your database server does not have an overabundance of memory, you should periodically check to see who your heavy memory users are along with the total percentage of memory each takes up. If you see one or two users who have more than 5-15% of the total memory usage, you should investigate the sessions further to see what activities they are performing.
Column Description
PID The process ID.
User Name The logon name the session is using.
FID The process ID of the worker process' parent.
Status Indicates if the process is actively performing work, is idle, blocked by another process, etc.
Host The client machine name the session is using.
Program The executable the process is using against the Sybase server.
Memory The amount of memory currently allocated to the process.
Pct Mem Used The percentage of memory currently used by the process.
Database The database the process is attached to.
Command The command the process is currently issuing.
Trans The name of any active transaction.
EMBARCADERO TECHNOLOGIES > EMBARCADERO PERFORMANCE CENTER 2.5 EXPERT GUIDE: SYBASE 28

SYBASE EXPERT GUIDE > MEMORY STATISTICS - SYBASE
Cache Activity Tab• Metrics
Database administrators can configure multiple caches for the Sybase server. These can be used judiciously by a DBA to hold objects being requested for data and speed end use response times. The Cache Activity tab of the Memory Detail view contains information that you can use to see if configured caches are being used the way they were intended. The table below describes the information available on the Cache Activity tab of the Memory Detail view:
TIP: To configure the grid to show/hide row numbers, use the Options Editor.
MetricsSeeing low hit rates for any configured dynamic caches indicates that they are not large enough and that users experience slower than desirable response times. On the other hand, caches with zero hit rates can indicate that they are not being used and that their memory could be released to another cache or the operating system itself. Another indicator that this can be the case is a very low percent used reading.
Page Activity Tab• Metrics
Pages are read into and deallocated from memory constantly in a dynamic Sybase environment. The Page Activity tab of the Memory Detail view displays how many pages were moved into and out of memory during a particular monitoring interval. The table below describes the information available on the Page Activity tab of the Memory Detail view:
Column Description
Cache Name The name of the configured cache.
Hit Rate The percentage of times that a data page was found in the particular cache vs. having to be read in from disk. Higher percentages are desirable because data read from memory can be accomplished in much less time than data read from disk.
Pct Used The percentage of the cache currently being used.
Spinlocks How many spinlocks the cache has experienced.
LRU Buffers Indicates the number of buffers acting in accordance with the normal cache strategy of moving to the most recently used (MRU) end of the cache.
MRU Buffers The number of buffers following a fetch-and-discard cache strategy.
Large I/O The number of times large I/O requests were performed.
Dirty Reads The number of dirty reads (reads of uncommitted data) performed.
Column Description
Page Action The type of paging action that occurred, either Pages Allocated or Pages Released. Allocated pages are ones that were moved into memory during the monitoring interval. Released pages are ones that were deallocated from memory during the monitoring interval.
Count The number of pages moved.
EMBARCADERO TECHNOLOGIES > EMBARCADERO PERFORMANCE CENTER 2.5 EXPERT GUIDE: SYBASE 29

SYBASE EXPERT GUIDE > I /O STATISTICS - SYBASE
MetricsSeeing allocation and deallocation numbers that are close can indicate objects that have a fetch-and-discard cache strategy. If large table scans are continuously needed on a system, this can be a valid strategy (because large amounts of unnecessary data kept in a cache can crowd out needed data pages). If this is not the case, investigate further to ensure that objects have a valid cache strategy (most recently used or MRU) in place.
I/O Statistics - SybaseThe I/O performance category view displays the following vital Sybase I/O statistics:
• Completed Disk I/Os
• Delayed Disk I/Os
• I/O Error Rate
• Outstanding Disk I/Os
• Requested Disk I/Os
• Server I/O Busy Rate
• Session Leaders - I/O
• Transaction Log Allocations
• Transaction Log Writes
Requested Disk I/Os• Metrics
This statistic reports the number of times that Sybase requested disk I/Os since Performance Center was last refreshed .
TIP: Click this statistic to drill down to the Devices tab of the I/O Detail view.
MetricsThe numbers for requested disk I/Os and completed I/Os should be very close. If there are large differences in these two values, it is likely that network contention or saturation is occurring.
Note that the value for requested I/Os includes every request that was initiated during the sample period. It is possible, however, that some of them completed after the sample period ended. These I/Os would then be excluded from the total number of completed I/Os, and can give the appearance that network problems exist when that is not the case. The number for completed I/Os can also be larger than the value for requested I/Os if I/O requests were made before Performance Center polled the server but were completed during the polling interval.
Completed Disk I/Os• Metrics
The Completed Disk I/Os statistic reports the number of times that Sybase completed disk I/Os operations since Performance Center was last refreshed.
TIP: Click this statistic to drill down to the Engines tab of the I/O Detail view.
EMBARCADERO TECHNOLOGIES > EMBARCADERO PERFORMANCE CENTER 2.5 EXPERT GUIDE: SYBASE 30

SYBASE EXPERT GUIDE > I /O STATISTICS - SYBASE
MetricsThe numbers for requested disk I/Os and completed I/Os should be very close. If there are large differences in these two values, it is likely that network contention or saturation is occurring.
Note that the value for requested I/Os includes every request that was initiated during the sample period. It is possible, however, that some of them completed after the sample period ended. These I/Os would then be excluded from the total number of completed I/Os, and can give the appearance that network problems exist when that is not the case. The number for completed I/Os can also be larger than the value for requested I/Os if I/O requests were made before Performance Center polled the server but completed during the polling interval.
Outstanding Disk I/Os• Metrics
The Outstanding Disk I/Os statistic reflects the maximum number of I/Os pending for Sybase since the last refresh in Embarcadero Performance Center.
TIP: Click this statistic to drill down to the Engines tab of the I/O Detail view.
Metrics If nonzero numbers are observed for both outstanding and delayed disk I/Os, there could be a problem in many areas. The table below describes these areas:
Delayed Disk I/Os• Metrics
• Troubleshooting
The number of I/Os delayed by reaching the limit on disk I/O structures.
MetricsWhen Adaptive Server exceeds the number of available disk I/O control blocks, I/O is delayed because Adaptive Server requires that tasks get a disk I/O control block before initiating an I/O request.
Area Description
Delayed Disk I/O This statistic indicates the number of I/Os delayed for Sybase since the last refresh in Embarcadero Performance Center.
Transaction Log Writes This statistic indicates the number of times Sybase wrote a transaction log page to disk since the last refresh in Performance Center. When the current log page becomes full, it is written to disk. Transaction log pages are also written to disk after a transaction commits.
Transaction Log Allocations This statistic indicates the number of times since Performance Center was last refreshed that additional pages were allocated to the transaction log.
You can use this statistic for getting a feel for the rate of transaction log growth.
Server I/O Busy Rate This statistic indicates number of seconds in CPU time that Sybase has spent doing input and output operations.
Seeing a consistent rate of 90-100% could indicate a CPU bound server.
EMBARCADERO TECHNOLOGIES > EMBARCADERO PERFORMANCE CENTER 2.5 EXPERT GUIDE: SYBASE 31
SYBASE EXPERT GUIDE > I /O STATISTICS - SYBASE
TroubleshootingIf the result is a nonzero value, try increasing the number of available disk I/O control blocks by increasing the configuration parameter.
Transaction Log WritesTransaction Log Writes refers to the number of times Sybase wrote a transaction log page to disk since the last refresh inside Embarcadero Performance Center. When the current log page becomes full, Sybase writes it out to disk. Sybase also writes transaction log pages to disk after a transaction commits.
MetricsNone.
Transaction Log AllocationsTransaction Log Allocations refers to the number of times since Performance Center was last refreshed that additional pages were allocated to the transaction log. This statistic gives you a feel for the rate of transaction log growth.
MetricsNone.
Session Leaders - I/O• Metrics
Heavy I/O activity in a system can indicate that the user connections are contributing somewhat equally to the overall load. More often than not, however, one or two user connections are responsible for 75% or more of the I/O activity. It may be that your system is running a large batch load or other typical processes, which are perfectly okay. On the other hand, it may be a runaway process or other rogue connection, which you need to track down and possibly eliminate.
The leading I/O session's display lets you see who the leading sessions are in your system with respect to I/O.
NOTE: This statistic displays on both the Users performance category view and the I/O performance category view.
TIP: Click this statistic to drill down to the Leading Sessions tab of the I/O Detail view.
Metrics One or two users consuming more than 75% of the total I/O load can indicate a runaway or improper process. You can drill into the I/O activity of all users and quickly see if this is the case.
I/O Error Rate• Metrics
The I/O Error Rate statistic represent the percentage of times I/O errors occurred in the server. I/O Error Rate is a percentage based on Total I/O (the sum the physical reads and writes.)
EMBARCADERO TECHNOLOGIES > EMBARCADERO PERFORMANCE CENTER 2.5 EXPERT GUIDE: SYBASE 32
SYBASE EXPERT GUIDE > I /O STATISTICS - SYBASE
MetricsYou should investigate large numbers of I/O errors by examining the error log.
I/O Detail ViewThe following tabbed pages are available on the I/O Detail view:
• Devices
• Engines
• Index Scans
• Leading Sessions
Leading Sessions Tab• Metrics
When a system undergoes heavy I/O activity, sometimes you find that all the user connections are contributing somewhat equally to the overall load. Frequently, however, one or two user connections are responsible for 75% or more of the I/O activity. It may be that a large batch load or other typical process is running that is perfectly okay for your system. Alternatively, it may be a runaway process or other rogue connection that you should track down and eliminate.
Embarcadero Performance Center displays information to help you find processes that are using the most memory on the server on the Leading Sessions tab of the I/O Detail view and the I/O tab of the Top Sessions view.
The table below describes the information available on these tabs:
NOTE: This information is available on both the Leading Sessions tab of the I/O Detail view and the I/O tab of the Top Sessions view.
TIP: To configure the grid to show/hide row numbers, use the Options Editor.
Column Description
PID The process ID.
User Name The logon name the session is using.
FID The process ID of the worker process' parent.
Status Indicates if the process is actively performing work, is idle, blocked by another process, etc.
Host The client machine name the session is using.
Program The executable the process is using against the Sybase server.
Physical I/O The amount of I/O the process has currently accumulated.
Pct I/O Used The percentage of overall I/O that can be attributed to the process.
Database The database to which the process is attached.
Command The command the process is currently issuing.
Transaction The name of any transaction.
Blocked Indicates if the process is currently blocked by another process.
Time Blocked The amount of time that the process has been blocked, in seconds.
EMBARCADERO TECHNOLOGIES > EMBARCADERO PERFORMANCE CENTER 2.5 EXPERT GUIDE: SYBASE 33
SYBASE EXPERT GUIDE > I /O STATISTICS - SYBASE
MetricsPinpointing sessions with abnormally high I/O activity relative to other sessions in the system helps you identify accounts dragging down overall system performance. You should examine the activity of each session to determine the system workload and to determine if you can reduce the workload or tune the system for better performance.
Devices Tab• Metrics
• Troubleshooting
Devices are accessed repeatedly in a dynamic Sybase environment to satisfy end user requests for data, to handle write activity that records transactions in a database's transaction log, and to manage other I/O operations. Viewing the I/O activity for each device is a good way to see what the "hot" devices are in a Sybase server with respect to I/O usage. The same information can be used to spot heavy database usage in systems where the device-to-database mappings are one-to-one.
The Devices tab of the I/O Detail view displays information that is useful in determining device I/O patterns. The table below describes the information available on the Devices tab of the I/O Detail view:
TIP: To configure the grid to show/hide row numbers, use the Options Editor.
MetricsIf devices have one-to-one relationships with user databases, you can quickly tell which databases are experiencing the most demand on a server. If the device-to-physical drive/file system is a one-to-one relationship, you can also spot which physical drives on a server are getting the heaviest workouts. For servers that have many drives, it is normally desirable to spread devices across different physical drives and controllers so contention does not occur at the disk level. In addition, separating databases and their corresponding logs is normally recommended so that each is located on a distinct physical drive. If possible, write-intensive devices, like log devices, are best suited for non-RAID5 scenarios.
TroubleshootingIf device hit rates are low, you can add more devices or redistribute objects among different devices. Typically, segments can be used to redistribute objects among different devices or physical hard disks. Common techniques include placing tables and indexes on different segments and partitioning large tables.
If device loads appear skewed (one device has much more activity than others), you should focus attention on that device. Again, redistributing objects can lessen the device's workload.
Engines Tab• Metrics
Column Description
Device Name The name of the device.
Physical Name The name used by the operating system to identify the device.
Hit Rate The rate at which accesses to a device were granted immediately compared to the total number of requests.
Reads The total number of read operations for the device.
Writes The total number of write operations for the device.
Total I/O The combined total of read and write operations.
EMBARCADERO TECHNOLOGIES > EMBARCADERO PERFORMANCE CENTER 2.5 EXPERT GUIDE: SYBASE 34
SYBASE EXPERT GUIDE > I /O STATISTICS - SYBASE
• Troubleshooting
In symmetric multiprocessing (SMP) environments, a DBA can configure the Sybase server to use more than one "engine," which represents a certain amount of CPU power. By default, Sybase configures one engine for use. If you have a server machine with multiple CPUs, you can enable more engines to take advantage of the machine's additional processing ability.
The Engines tab of the I/O Detail view displays information with respect to how each engine is handling I/O. The table below describes the information available on the Engines tab of the I/O Detail view:
TIP: To configure the grid to show/hide row numbers, use the Options Editor.
MetricsIf the number of outstanding I/Os remains high or increases during periods of heavy activity, there may not be enough engines configured for the system.
TroubleshootingIf the server machine has multiple CPUs, you can configure more engines for Sybase to use by following this process:
1 Use the sp_configure procedure to change the current engine configuration. For example, to change the number of engines from one to two, you would run: 'sp_configure "max online engines",2'
2 Stop and restart the Sybase server.
Index Scans Tab• Metrics
Indexes are accessed frequently in dynamic Sybase server environments. The type of index access often determines the response time an end user experiences. Single row index accesses are the quickest, and complete index scans are the most time consuming (for large indexes at least).
The Index Scans tab of the I/O Detail view presents information with respect to index scans. The table below describes the information available on the Index Scans tab of the I/O Detail view:
MetricsThere are two basic scan types - ascending and descending. For ascending scans, Sybase moves up the index page chain from beginning to end. Sybase follows the page chain in reverse order for descending scans. Descending scans are normally the result of requests made for data by descending column order.
Within ascending and descending scans, a data-only lock, or DOL, styled access can also occur.
Column Description
Engine The name of the configured engine.
Completed I/Os The number of I/Os completed during the sample interval.
Outstanding I/Os The number of I/Os left outstanding during the sample interval.
Column Description
Scan Type The type of index scan.
Count The number of scans per type for the sample interval.
EMBARCADERO TECHNOLOGIES > EMBARCADERO PERFORMANCE CENTER 2.5 EXPERT GUIDE: SYBASE 35
SYBASE EXPERT GUIDE > SPACE STATISTICS - SYBASE
Space Statistics - SybaseThe Space performance category view displays the following vital Sybase space statistics:
• Database Overview
• Log Overview
• Device Overview
Database Overview• Metrics
• Troubleshooting
A Sybase server contains many databases, some of which are devoted to system-level activities (the master and tempdb databases, for example) and others that hold user data. The database overview displays details about the space situation for each database in a Sybase server, including the total, used, and free space. The percentage used amount for each database is also shown.
TIP: Click this statistic to drill down to the Object Detail tab of the Space Detail view.
MetricsIf a database’s used space percent amount goes above 90%, and the database is dynamic in nature (meaning that users are constantly adding and modifying data), then you should take action to ensure that the database does not run out of available free space.
TroubleshootingIf the percent used amount of a database is approaching problematic levels, there are two ways you can rectify the situation:
1 If the database device that the database currently resides on contains additional free space, you can ALTER the database to consume more available space on that device.
2 If the database device that the database currently resides on does not contain additional free space, you can do one of the following:
• Create a new device and issue an ALTER for the database to use that device for space in addition to those currently used.
• Choose another existing device that has free space and ALTER the database to use that device in addition to those currently in use.
Log Overview• Metrics
• Troubleshooting
Each database in Sybase has a transaction log, which can be placed on the same device as its database or assigned to a separate device for backup and performance purposes. The log overview displays details concerning each transaction log in the Sybase server and includes the total, used, and free space amounts. The percent used amount for each log is also shown.
EMBARCADERO TECHNOLOGIES > EMBARCADERO PERFORMANCE CENTER 2.5 EXPERT GUIDE: SYBASE 36
SYBASE EXPERT GUIDE > SPACE STATISTICS - SYBASE
MetricsIf any log’s used space exceeds 90%, you should take action to ensure that the log does not run out of available free space.
TroubleshootingThere are many things a DBA can do to ensure that a database’s log does not run out of available free space:
1 First, most transactional-oriented databases should have their logs assigned to a device separate from the database. Reasons for doing so include:
• It lets you have more granular and point-in-time backups because a log separate from its database’s device can make use of the dump transaction command.
• It prevents competition for space between the log and the database itself.
• It allows the log to be monitored for space more effectively.
• It improves performance.
• It enables better recovery from hard disk crashes because you can dump your transaction log, even when your data device is on a server’s damaged hard disk.
2 If the database is not critical in nature, you can set the truncate log on checkpoint option (trunc log on chkpt), which eliminates any inactive space in the log when a database checkpoint occurs.
3 Critical databases needing higher levels of recovery should have schedules established that regularly perform transaction log dumps. Doing so ensures better recovery scenarios as well as a reduced risk of the transaction log running out of space.
4 If a critical transaction log becomes full, it can be impossible to use standard procedures to dump transactions and reclaim space. The dump operation incorporates the no log or truncate only options.
5 If a transaction log continuously approaches dangerously low levels of free space, you should expand the database (if the transaction log is on the same device as the database) or expand the log onto its current device (if room exists) or a new device.
You should also be on the lookout for large load or data modification operations that do not make use of prudently timed commit points. A single, large transaction has the ability to overwhelm any transaction log because only inactive space in the transaction log is removed from log dumps or truncation operations.
Device Overview• Metrics
• Troubleshooting
Database devices are the logical containers for databases and transaction logs. Each device is mapped to a physical file that is located on a database server’s hard drive. The device overview displays details about every defined device on a Sybase server, including the total, used, and free space amounts. The percent of used space is also displayed.
TIP: Click this statistic to drill down to the Device Detail tab of the Space Detail view.
MetricsThe environment of the particular Sybase server as well as your work style dictate the metrics to use in evaluating a device that is running into trouble with space. Many DBAs create devices that parallel a single, corresponding database in size, and therefore, such devices show 100% utilization. Other DBAs create large devices that are not completely utilized.
EMBARCADERO TECHNOLOGIES > EMBARCADERO PERFORMANCE CENTER 2.5 EXPERT GUIDE: SYBASE 37
SYBASE EXPERT GUIDE > SPACE STATISTICS - SYBASE
Troubleshooting If a device has become too full, a DBA can begin the process of manually relocating databases from it onto other devices. The process of moving logs is somewhat easier and can be accomplished via singular commands (sp_logdevice).
Space Detail ViewThe following tabbed pages are available on the Space Detail view:
• Cache Detail
• Device Detail
• Object Detail
• Segment Detail
Device Detail Tab• Metrics
• Troubleshooting
The Device Detail tab of the Space Detail view presents details about a selected device located on the monitored Sybase server. The table below describes the information available on the Device Detail tab of the Space Detail view:
TIP: To configure the grid to show/hide row numbers, use the Options Editor.
MetricsThe environment of the particular Sybase server as well as the DBA's work style dictate the metrics to use in evaluating a device that is running into trouble with space. Many DBAs create devices that parallels a single, corresponding database in size, and therefore, such devices always show 100% utilization. Other DBAs create large devices that are not completely utilized.
TroubleshootingIf a device has become too full, a DBA can begin the process of manually relocating databases from it onto other devices. The process of moving logs is somewhat easier and can be accomplished via singular commands (sp_logdevice).
Cache Detail Tab• Metrics
• Troubleshooting
Column Description
Database Name The name of a database that uses all or part of the device for its database space, transaction log space, or both.
Space The amount of space used by the database on the device.
Space Type The type of space allocated (database, log, or both).
EMBARCADERO TECHNOLOGIES > EMBARCADERO PERFORMANCE CENTER 2.5 EXPERT GUIDE: SYBASE 38

SYBASE EXPERT GUIDE > SPACE STATISTICS - SYBASE
Caches retain frequently requested data and object information in memory. They can potentially boost performance by allowing users to read or write data in memory instead of to and from physical disk. Information requests satisfied in memory equate to much better response times than if that same data requires physical I/O access.
Named data caches can help achieve substantially greater concurrency and increase the likelihood that Sybase reads data from memory and not disk by letting you bind particularly active database objects to dedicated data caches. In addition, you can boost performance by creating memory pools, each configured for different I/O throughput (2 KB-16 KB), within every named data cache.
The table below describes the information available on the Cache Detail tab of the Space Detail view:
TIP: To configure the grid to show/hide row numbers, use the Options Editor.
MetricsThe data cache hit rate is an excellent indicator of how often user requests for data are satisfied through memory vs. being physically read from disk. To help ensure maximum performance, you want to keep your cache hit rate in the neighborhood of 90% or greater. Lower amounts can be okay for user ad hoc databases where sporadic, large table scan operations occur. But anything below this general threshold for normal databases can require tuning attention and the adjusting the Sybase memory tuning parameters.
If you are using named caches, you can drill down into the cache hit rates for each named cache (from the Memory performance category view). This helps you understand which objects/operations are depressing the overall cache hit rate for the server.
TroubleshootingIf a problem is found in Sybase servers, versions 11-12, you can increase the amount of the total memory configuration parameter or reduce the percentage of memory allocated to the procedure cache (by default, the data cache assumes any free memory left over after Sybase has met its kernel and procedure cache needs). Take care when reducing the procedure cache, as this could reduce performance in the server as it relates to reading procedures in from disk.
For Sybase 12.5, the total memory configuration parameter can again be increased to provide more memory for the data cache (and any named caches), but in 12.5, if you wish to reduce the size of the procedure cache, note that it is now configured in terms of literal size instead of a percentage of the overall configured memory.
Once the data cache has been adjusted, monitor Sybase to see if the cache hit rate improves. If it does not, then another increase may be necessary as will an examination of unnecessary large table scan operations. Also, keep a careful eye on the actual machine's memory limits and swap activity. Increased swap activity can be indicative of too little memory left for the server machine.
Segment Detail Tab• Metrics
• Troubleshooting
Column Description
Cache Name The name of the data cache.
Status The status of the cache (Active, Activation Pending, Deletion Pending).
Mode Mixed or log only.
Configured Size The defined size of the cache.
Running Size The actual running size of the cache.
Overhead The amount of overhead required to manage the cache.
EMBARCADERO TECHNOLOGIES > EMBARCADERO PERFORMANCE CENTER 2.5 EXPERT GUIDE: SYBASE 39

SYBASE EXPERT GUIDE > SPACE STATISTICS - SYBASE
Segments are instruments used for mapping objects (tables and indexes) to specific physical locations on disk. Mapping certain objects to defined segments allows you to potentially increase I/O throughput by placing heavily used tables and indexes on different physical devices. You can place tables and indexes on segments by including placement statements in your CREATE TABLE or CREATE INDEX statements.
The Segment Detail tab of the Space Detail view lets you view information about segments for selected databases. The table below describes the information available on the Segment Detail tab of the Space Detail view:
NOTE: This information is available on both the Segment Detail tab of the Space Detail view and the Segment Detail grid on the Storage tab of the Database Detail view.
TIP: To configure the grid to show/hide row numbers, use the Options Editor.
Metrics It is often good practice to separate tables and their corresponding indexes onto different physical devices to minimize I/O contention at the server level. Segments can be used to accomplish this within Sybase. If you have hot tables and indexes within your system, investigate the use of segments to place such objects on separate, faster physical devices.
TroubleshootingHot objects can be relocated onto different devices through the use of the sp_placeobject procedure.
Column Description
Segment Name The name of the segment.
Total (KB) Represents the total amount of space defined for the segment, in KB. Typically this equates to the amount of space on the device where the segment resides.
Used (KB) Represents the amount of space used by the segment alone, in KB. Segments containing no objects will show zero space used.
EMBARCADERO TECHNOLOGIES > EMBARCADERO PERFORMANCE CENTER 2.5 EXPERT GUIDE: SYBASE 40
SYBASE EXPERT GUIDE > DATABASES STATISTICS - SYBASE
Object Detail TabTables and indexes comprise every Sybase database. The Object Detail tab of the Space Detail view presents space-related information about tables and indexes for a selected database. The table below describes the information available on the Object Detail tab of the Space Detail view:
TIP: To configure the grid to show/hide row numbers, use the Options Editor.
Databases Statistics - SybaseThe Databases performance category view displays Sybase Database Summary statistics.
Database Summary• Metrics
• Troubleshooting
The Database Summary display lists every database in a Sybase server and includes an overview of the activity currently being experienced in each database. It also shows demographic information about each database, which includes the database owner, the last transaction dump date, and if the database itself or any object contained within it is suspect.
TIP: Click this statistic to drill down to the Suspect Objects tab of the Database Detail view.
MetricsDatabases with high numbers of blocked users could signal a contention problem. You should immediately investigate suspect databases or database objects.
Column Description
Owner The owner of the object.
Object Name The name of the table or index.
Type The type of object (table or index).
Rows The number of rows currently in the table.
Reserved (KB) The amount of space reserved for the object, in KB.
Data (KB) The amount of space consumed by data, in KB.
Indexes (KB) The amount of space used by an index, in KB.
Unused (KB) The amount of unused space (free space) that the object contains, in KB.
Segment Name The segment name that the object is assigned to.
EMBARCADERO TECHNOLOGIES > EMBARCADERO PERFORMANCE CENTER 2.5 EXPERT GUIDE: SYBASE 41

SYBASE EXPERT GUIDE > DATABASES STATISTICS - SYBASE
TroubleshootingThe action you need to take depends on the situation you are watching. The table below describes four situations that you can recognize and fix:
Database Detail ViewThe following tabbed pages are available on the Database Detail view:
• Index Statistics
• Options
• Storage
• Suspect Objects
• Table Statistics
Suspect Objects Tab• Metrics
• Troubleshooting
Situation Description
Blocked Users You should investigate lock contention problems in detail. If the blocking lock situation has been long in duration, or involves many users, you should consider terminating the process holding the offending locks.
Suspect Objects If Embarcadero Performance Center has indicated that a database contains suspect objects, the first thing to do is drill down to find exactly which objects are suspect. You can also do this manually by running a DBCC against the database. If the object is an index, you could try dropping and recreating it, or use the DBCC REINDEX command.
Suspect Database A suspect database can be a difficult thing from which to quickly recover. There are times when the actual cache of the database is suspect and not the actual database itself. Stopping and starting the Sybase server can verify if this is the case. If the database itself is actually damaged, there could be a true recovery situation. The suspect database can be dropped using the DBCC DBREPAIR DROPDB command. You would then need to recreate the database and perform a recovery operation using the most recent database dump.
Suspect Pages If you have to drop a table or index containing suspect pages, you must use a transaction in the master database. If you don't, the drop fails because it needs to delete entries for the suspect pages from the master database.
EMBARCADERO TECHNOLOGIES > EMBARCADERO PERFORMANCE CENTER 2.5 EXPERT GUIDE: SYBASE 42

SYBASE EXPERT GUIDE > DATABASES STATISTICS - SYBASE
Suspect objects normally indicate an internal problem in a server or that physical damage has occurred to part of a database. The Suspect Objects tab of the Database Detail view presents objects in a Sybase server that have been marked suspect for a selected database. The table below describes the information available on the Suspect Objects tab of the Database Detail view:
TIP: To configure the grid to show/hide row numbers, use the Options Editor.
MetricsSuspect objects have no place in a production database. If any suspect objects are identified, you should immediately take action.
TroubleshootingIf the suspect object is an index, you could try dropping and recreating it, or use the DBCC REINDEX command. Other damaged objects can complete rebuilding the database. A suspect database can be a difficult thing to recover from quickly. There are times when the cache of the database is suspect and not the database itself. Stopping and starting the Sybase server can verify if this is the case. If the database itself is actually damaged, there could be a true recovery situation. The suspect database can be dropped using the DBCC DBREPAIR DROPDB command. You would then need to re-create the database and perform a recovery operation using the most recent database dump.
Table Statistics Tab• Metrics
• Troubleshooting
Understanding the placement, shape, and organization of your tables enhances your ability to make correct decisions regarding their use and maintenance. The Table Statistics tab of the Database Detail view communicates useful measures to gauge the overall condition of the tables in a selected database. The first grid displays table demographic information. The second grid displays cache binding information. The table below describes the information available in the Table Demographics grid on the Table Statistics tab of the Database Detail view:
Column Description
Owner The owner of the suspect object.
Table Name The name of the table.
Index Name The name of any suspect index.
Column Description
Owner The owner of the table.
Table Name The name of the table.
Segment Name The segment that holds the table.
Last Statistic Date The date and time when statistics were last gathered for the table.
Row Count The reported number of rows in the table.
Reserved The amount of space reserved (in KB) of the table.
Avg Row Size The average size of a row in the table.
EMBARCADERO TECHNOLOGIES > EMBARCADERO PERFORMANCE CENTER 2.5 EXPERT GUIDE: SYBASE 43

SYBASE EXPERT GUIDE > DATABASES STATISTICS - SYBASE
The table below describes the information available in the Cache Bindings grid on the Table Statistics tab of the Database Detail view:
TIP: To configure a grid to display row numbers, use the Options Editor.
MetricsThere are a few data points worth noting with regard to the information presented in the Table Statistics tab of the Database Detail view:
• Heavily used tables and indexes can benefit from being separated onto different segments that correspond to different physical hard drives.
• The Sybase cost-based optimizer may not be choosing the proper access path for tables with out-of-date, or without any, statistics. Keeping dynamic objects current with respect to their internal statistics helps ensure that the Sybase kernel makes the proper decisions on how to satisfy user requests for data.
• Frequently accessed small - or look up - tables can benefit from being bound to a special cache that is used to retain their often-accessed data in memory.
TroubleshootingTo change the segment a table or index belongs to, you can use the sp_placeobject procedure. Keeping table statistics current can be handled by judicious use of the UPDATE STATISTICS command. Binding frequently accessed tables can be accomplished via the sp_bindcache procedure.
Index Statistics Tab• Metrics
• Troubleshooting
Understanding the placement, shape, and organization of your table's indexes enhances your ability to make the right decisions about using and maintaining them. The Index Statistics tab of the Database Detail view communicates a number of useful measures to gauge the overall condition of the indexes in a selected database. The first grid displays index demographics. The second grid displays cache bindings. The table below describes the information available in the Index Demographics grid on the Index Statistics tab of the Database Detail view:
Column Description
Owner The owner of the table.
Table Name The name of the table.
Cache Name The cache to which the table has been bound.
Column Description
Owner The owner of the table.
Index Name The name of the index in <table name>.<index name> fashion.
Segment Name The segment that holds the table.
Reserved (KB) The amount of space reserved of the table, in KB.
Tree Depth The height of the index. Can hold bogus values for indexes where statistics have not been gathered.
Leaf Count Number of leaf pages in the index.
Leaf Row Size The average size of a leaf row in the index.
EMBARCADERO TECHNOLOGIES > EMBARCADERO PERFORMANCE CENTER 2.5 EXPERT GUIDE: SYBASE 44
SYBASE EXPERT GUIDE > DATABASES STATISTICS - SYBASE
The table below describes the information available in the Cache Bindings grid on the Index Statistics tab of the Database Detail view:
TIP: To configure a grid to display row numbers, use the Options Editor.
MetricsThere are a few points worth noting with regard to the information presented in the Index Statistics view:
• Heavily used tables and indexes can benefit from being separated onto different segments that correspond to different physical hard drives.
• The Sybase cost-based optimizer could not be choosing the proper access path for tables that have indexes with out-of-date, or without any, statistics. Keeping dynamic objects current with respect to their internal statistics helps ensure that the Sybase kernel makes the proper decisions on how to satisfy user requests for data.
• Indexes that are frequently scanned can benefit from being bound to a special cache that can be used to retain their often-accessed data in memory.
TroubleshootingTo change the segment a table or index belongs to, you can use the sp_placeobject procedure. Keeping index statistics current can be handled by judicious use of the UPDATE STATISTICS command. Binding frequently scanned indexes can be accomplished via the sp_bindcache procedure.
Storage TabA database can contain a number of segments you can use to physically separate tables and indexes onto different physical devices. A database can also be bound to a specific data cache in hopes of improving performance through more frequent memory access. The first grid displays segment use by a database. The second grid displays cache use by a database.
The table below describes the information available in the Segment Detail grid on the Storage tab of the Database Detail view:
NOTE: The information in the Segment Detail grid is also available on the Segment Detail tab of the Space Detail view.
Column Description
Owner The owner of the table.
Table Name The name of the table.
Index Name The name of the index.
Cache Name The cache to which the table has been bound.
Column Description
Segment Name The name of the database segment.
Total (KB) The total amount of space allocated to the segment, in KB. Note that this normally corresponds to the device allocations for a database.
Used (KB) The amount of space used by the segment to hold tables and indexes, in KB. Note that space used by other segments that make use of the same device are not included in the total.
EMBARCADERO TECHNOLOGIES > EMBARCADERO PERFORMANCE CENTER 2.5 EXPERT GUIDE: SYBASE 45

SYBASE EXPERT GUIDE > CONTENTION STATISTICS - SYBASE
The table below describes the information available in the Cache Bindings grid on the Storage tab of the Database Detail view:
TIP: To configure a grid to display row numbers, use the Options Editor.
MetricsNone.
Options Tab• Metrics
A database can have a number of options set to determine behavior like transaction log usage, database access, etc. The Options tab of the Database Detail view presents all available database options for a selected database along with which options are in use. The table below describes the information available on the Options tab of the Database Detail view:
MetricsDepending on how it is used, a database can have many or few options set. For example, a production database that needs near point-in-time recovery abilities would not have the truncate log on checkpoint option set, because doing so would negate the use of transaction log dumps. However a development database that is loaded/reloaded many times a day with test data would likely make use of the option to prevent the transaction log from filling up. You should examine the specific needs of each database under your care to determine which options are right for it.
Contention Statistics - SybaseThe Contention performance category view displays the following vital Sybase contention statistics:
• Logical Lock Contention
• Address Lock Contention
• Group Commit Sleeps
• Modify Conflicts
• Device I/O Contention
Column Description
Cache Name The name of the data cache.
Status The status of the cache (Active, Activation Pending, Deletion Pending).
Configured Size (MB)
The defined size of the cache, in MB.
Running Size (MB) The actual running size of the cache, in MB.
Overhead (MB) The amount of overhead required to manage the cache, in MB.
Column Description
Option The name of the database option.
Setting Indicates whether the option is in use.
EMBARCADERO TECHNOLOGIES > EMBARCADERO PERFORMANCE CENTER 2.5 EXPERT GUIDE: SYBASE 46
SYBASE EXPERT GUIDE > CONTENTION STATISTICS - SYBASE
• Disk I/O Structures
• Server Configuration Limit
• Engine Configuration Limit
• Operating System Limit
• Lock Contention
• Blocked
• Current Locks
• Deadlock Rate
• Deadlocks
• Network Contention Rate
• Network Delays
• Network Requests
Logical Lock Contention• Metrics
• Troubleshooting
A single blocking user has the potential to stop work for nearly all processes on a small system, and can cause major headaches on large systems. Although Sybase supports flexible locking mechanisms, blocking lock situations do crop up. Blocks are most often caused by user processes holding exclusive locks and not releasing them via a proper COMMIT frequency.
The Logical Lock Contention statistic reflects the number of times a task/process was switched out because of contention over table/page locks.
MetricsSeeing consistent high numbers for this statistic should result in you investigating the lock details of your server before the situation has a chance to mushroom.
You can easily drill down and discover the exact process(es) holding locks that are blocking out other user activity.
TroubleshootingOnce you discover a blocking lock situation, you can normally remedy it by issuing a KILL against the offending process. This eliminates the user's stranglehold on the objects the user was accessing, and usually results in other user processes completing in an instant. Discovering the blocked lock situation is made easier by using tools like Performance Center, but preventing the blocking lock situation in the first place is where it gets tricky.
The culprit of blocking lock scenarios is usually the application design, or the SQL being used within the application itself. Properly coding an application to reference database objects in an efficient order, and then using the right SQL to get the job done, is an art. The key to avoiding lock contention is to process user transactions in the quickest and most efficient manner possible - something not always easy to do. You can also check to see if your queries are doing deferred and direct expensive updates, which can cause additional index locks.
By default, all processes wait indefinitely for locks in Sybase. You can change this behavior by modifying the lock wait period configuration parameter, which limits the number of seconds that a process waits for a lock before timing out.
EMBARCADERO TECHNOLOGIES > EMBARCADERO PERFORMANCE CENTER 2.5 EXPERT GUIDE: SYBASE 47
SYBASE EXPERT GUIDE > CONTENTION STATISTICS - SYBASE
Address Lock ContentionThis statistic reflects the number of times a task/process was switched out because of memory address lock problems. Sybase acquires address locks during update operations, and for index pages, OAM pages, allocation pages, and occasionally on data pages when page splits are performed.
MetricsNone.
Group Commit Sleeps• Metrics
• Troubleshooting
For databases needing high throughput, a large log I/O size is very important to prevent disk queuing problems on the transaction log. Group commit sleeps reflect the number of times a task performed a transactional commit operation and was put to sleep by the server until data in the log was written to disk.
MetricsYou should examine group commit sleeps in conjunction with the number of committed transactions (found on the Users performance category view).
TroubleshootingA high count for group commit sleeps is not necessarily a problem if the server’s transaction rate is low. If there are a significant number of transactions that result in group commit sleeps, and the log I/O size is greater than 2 KB, a smaller log I/O size can help to reduce commit time by causing more frequent page flushes.
Other factors that can effect group commit sleeps are the size of the server run queue and the speed of the hard disk where the log is located.
Modify ConflictsFor some database operations, Sybase uses a specialized protection mechanism to gain exclusive access to a page without using actual restrictive page locks. Examples include accessing certain system tables and dirty reads on data pages. These actions need exclusive access to the page in question, even though they do not actually modify it. Modify conflicts record how many times these actions conflicted with other processes needing true database locks.
MetricsNone.
Device I/O Contention• Metrics
• Troubleshooting
In Sybase, when a task or process needs to perform physical I/O, the server fills out the actual block I/O structure and links it to a per-engine I/O queue. If two Sybase engines request the same I/O structure from the exact same device at the identical time, one of them is put to sleep by the server and it waits for the semaphore it needs.
EMBARCADERO TECHNOLOGIES > EMBARCADERO PERFORMANCE CENTER 2.5 EXPERT GUIDE: SYBASE 48

SYBASE EXPERT GUIDE > CONTENTION STATISTICS - SYBASE
Device I/O Contention reflects the number of times a task or process was put to sleep while waiting for a semaphore for a particular database device.
MetricsNone.
TroubleshootingIf consistent high numbers are viewed for Device I/O Contention, you can try redistributing the tables across devices (that are located on separate hard disks) or by adding devices (again, that are located on separate hard disks) and moving tables and indexes to them.
Disk I/O Structures• Metrics
• Troubleshooting
When a Sybase server begins to experience I/O delays, the result can be a very dissatisfied user community. When such problems begin to occur, things to investigate include the various Sybase or operating system limits. It could be that I/O operations are being blocked by one or both.
The Disk I/O Structures statistic represents the number of I/O delays caused by Sybase reaching the limit on disk I/O structures. When Sybase exceeds the number of available disk I/O control blocks, I/O is deferred because Sybase requires that any task get a disk I/O control block before beginning an I/O request.
MetricsConsistent numbers above zero should be a cause for concern.
TroubleshootingIf you continue to see nonzero numbers for this statistic, you can try increasing the number of available disk I/O control blocks by increasing the configuration parameter disk I/O structures.
Server Configuration Limit• Metrics
• Troubleshooting
When a Sybase server begins to experience I/O delays, the result can be a very dissatisfied user community. When such problems begin to occur, things to investigate include the various Sybase or operating system limits. It could be that I/O operations are being blocked by one or both.
The Server Configuration Limit statistic shows nonzero numbers if Sybase has exceeded its limit for the number of asynchronous disk I/O requests that can be outstanding for the entire server at one time.
MetricsConsistent numbers above zero should be a cause for concern.
TroubleshootingIf you continue to see nonzero numbers for this statistic, you can raise this limit using sp_configure with the max async I/Os per server parameter.
EMBARCADERO TECHNOLOGIES > EMBARCADERO PERFORMANCE CENTER 2.5 EXPERT GUIDE: SYBASE 49

SYBASE EXPERT GUIDE > CONTENTION STATISTICS - SYBASE
Engine Configuration Limit• Metrics
• Troubleshooting
When a Sybase server begins to experience I/O delays, the result can be a very dissatisfied user community. When such problems begin to occur, things to investigate include the various Sybase or operating system limits. It could be that I/O operations are being blocked by one or both.
The Engine Configuration Limit statistic shows nonzero numbers if Sybase has exceeded its limit for the number of asynchronous disk I/O requests that can be outstanding for a Sybase engine at one time.
MetricsConsistent numbers above zero should be a cause for concern.
TroubleshootingIf you continue to see nonzero numbers for this statistic, you can raise this limit using sp_configure with the max async I/Os per engine parameter.
Operating System Limit• Metrics
• Troubleshooting
When a Sybase server begins to experience I/O delays, the result can be a very dissatisfied user community. When such problems begin to occur, things to investigate include the Sybase or operating system limits. It could be that I/O operations are being blocked by one or both.
The Operating System Limit statistic shows nonzero numbers if Sybase has detected that the limit for asynchronous I/Os has been exceeded.
MetricsConsistent numbers above zero should be a cause for concern.
TroubleshootingIn most UNIX operating systems, there is a kernel parameter that limits the number of asynchronous I/Os that can take occur at one time. If you continue to see nonzero numbers for this statistic, you should look into raising this limit.
Deadlock Rate• Metrics
• Troubleshooting
A deadlock occurs when two processes have a lock on a separate page or object and each wants to acquire a lock on the other process’ page or object. Each waits for the other to release the necessary lock. Sybase constantly checks for deadlocks and, when found, chooses the transaction that has accumulated the least amount of CPU time and terminates the transaction. The server then rolls back that transaction and issues a notification of the event. The other process gets to move forward.
The deadlock rate displays the percentage of times deadlocks occurred vs. the percentage of locks requested and immediately granted.
EMBARCADERO TECHNOLOGIES > EMBARCADERO PERFORMANCE CENTER 2.5 EXPERT GUIDE: SYBASE 50

SYBASE EXPERT GUIDE > CONTENTION STATISTICS - SYBASE
MetricsYou should immediately investigate a percentage much above zero to prevent the situation from mushrooming. You can easily drill down and discover the exact process(es) holding locks and deadlocks that are blocking out other user activity.
TroubleshootingWell-designed applications can minimize deadlocks by always acquiring locks in the same order. You should always do updates to multiple tables in the same order.
Once Sybase discovers a deadlock, it takes action and remedies the situation. Embarcadero Performance Center makes it easier to discover how prevalent deadlock activity is on a system; preventing deadlocks from occurring in the first place is more difficult.
Those responsible for writing systems can minimize deadlocks by ensuring that applications acquire locks in the same order. Likewise, you should always do updates and other DML that act on multiple tables in the same order.
You can also shrink the amount of time that Sybase waits to check for deadlocks by modifying the deadlock checking period configuration parameter.
Deadlocks• Metrics
• Troubleshooting
A deadlock occurs when two processes have a lock on a separate page or object and each wants to acquire a lock on the other process’ page or object. Each waits for the other to release the necessary lock. Sybase constantly checks for deadlocks and, when found, chooses the transaction that has accumulated the least amount of CPU time and terminates it (the transaction). The server then rolls back that transaction and issues a notification of the event. The other process gets to move forward.
The deadlock statistic displays the number of current deadlocks in a Sybase server.
MetricsA nonzero number should clue you into the fact that application conflicts are likely being experienced by your user community.
TroubleshootingWell-designed applications can minimize deadlocks by always acquiring locks in the same order. Updates to multiple tables should always be performed in the same order.
Once Sybase discovers a deadlock, it takes action and remedies the situation. Discovering how prevalent deadlock activity is on a system is made easier by using tools like Performance Center, but preventing deadlocks from occurring in the first place is more difficult.
Those responsible for writing systems can minimize deadlocks by ensuring that applications acquire locks in the same order. Likewise, updates and other DML that act on multiple tables should always be performed in the same order.
You can also shrink the amount of time that Sybase waits before performing a deadlock check by reducing the deadlock checking period parameter.
Current Locks• Metrics
EMBARCADERO TECHNOLOGIES > EMBARCADERO PERFORMANCE CENTER 2.5 EXPERT GUIDE: SYBASE 51
SYBASE EXPERT GUIDE > CONTENTION STATISTICS - SYBASE
• Troubleshooting
There are varieties of operations in Sybase that require the use of locks. The Current Locks statistic represents the number of total locks currently active in Sybase.
TIP: Click this statistic to drill down to the All Locks tab of the Locks view.
NOTE: This statistic is also available on the Users performance category view.
MetricsThe only thing to watch with respect to locks is if the number approaches the Sybase limit for available locks.
TroubleshootingIf the number of current locks in a Sybase server approaches the Sybase limit for available locks, you can look into increasing the Number of Locks configuration parameter.
Lock Contention• Metrics
• Troubleshooting
A single blocking user has the potential to stop work for nearly all other processes on a small system, and can cause major headaches on large systems. Although Sybase supports flexible locking mechanisms, blocking lock situations do crop up. Blocks are most often caused by user processes holding exclusive locks and not releasing them via a proper COMMIT frequency.
The blocking lock rate displays the percentage of times blocks occurred vs. the percentage of locks requested and immediately granted.
MetricsTo prevent a mushrooming situation, you should immediately investigate any percentages greater than zero for this statistic.
You can easily drill down and discover the exact process(es) holding locks that are blocking out other user activity.
TroubleshootingOnce you discover a blocking lock situation, you can normally remedy it by issuing a KILL against the offending process. This eliminates the user's stranglehold on the objects the user was accessing, and usually results in other user processes completing in an instant. Discovering the blocked lock situation is made easier by using tools like Performance Center, but preventing the blocking lock situation in the first place is tricky.
The culprit of blocking lock scenarios is usually the application design, or the SQL being used within the application itself. Properly coding an application to reference database objects in an efficient order, and then using the right SQL to get the job done, is an art. The key to avoiding lock contention is to process user transactions in the quickest and most efficient manner possible - something not always easy to do.
By default, all processes wait indefinitely for locks in Sybase. You can change this behavior by modifying the lock wait period configuration parameter, which limits the number of seconds that a process waits for a lock before timing out.
Blocked• Metrics
EMBARCADERO TECHNOLOGIES > EMBARCADERO PERFORMANCE CENTER 2.5 EXPERT GUIDE: SYBASE 52
SYBASE EXPERT GUIDE > CONTENTION STATISTICS - SYBASE
• Troubleshooting
A single blocking user has the potential to stop work for nearly all other processes on a small system, and can cause major headaches even on large systems. Although Sybase supports flexible locking mechanisms, blocking lock situations do crop up. Blocks are most often caused by user processes holding exclusive locks and not releasing them via a proper COMMIT frequency.
The Blocked statistic displays the number of current processes blocked by other processes.
TIP: Click this statistic to drill down to the Blocking Locks tab of the Locks view.
NOTE: This statistic is also available on the Users performance category view.
MetricsWhile the Lock Contention rate is a better measure of the overall lock contention situation, consistently seeing positive numbers for the Blocked statistic should also clue you into the fact that a bottleneck exists for some processes. You can easily drill down and discover the exact process(es) holding locks that are blocking other user activity.
TroubleshootingOnce you discover a blocking lock situation, you can normally remedy it by issuing a KILL against the offending process. This eliminates the user's stranglehold on the objects the user was accessing, and usually results in other user processes completing in an instant. Discovering the blocked lock situation is made easier by using tools like Performance Center, but preventing the blocking lock situation in the first place is tricky.
The culprit of blocking lock scenarios is usually the application design, or the SQL being used within the application itself. Properly coding an application to reference database objects in an efficient order, and then using the right SQL to get the job done, is an art. The key to avoiding lock contention is to process user transactions in the quickest and most efficient manner possible - something not always easy to do.
By default, all processes wait indefinitely for locks in Sybase. You can change this behavior by modifying the lock wait period configuration parameter, which limits the number of seconds that a process waits for a lock before timing out.
Network Contention Rate• Metrics
• Troubleshooting
The Sybase server normally sends and receives network packets at a regular rate. If the network begins to become saturated, Sybase could experience delays in network I/O. The Network Contention rate indicates the percentage of times network I/O activity was delayed. The following network contention rate statistics are available on the Contention performance category view:
• Network Delays
• Network Requests
MetricsSeeing a network contention rate greater than 1% could indicate a challenged network structure.
TroubleshootingOutside of ensuring that the existing network is sufficient for handling the current load (database and non-database), other items to look at from a Sybase specific standpoint include validating that only the necessary amount of data is being sent and returned to requesting users. You can also examine the default packet size and see if it is too small for the average packet size being sent/received by the Sybase server.
EMBARCADERO TECHNOLOGIES > EMBARCADERO PERFORMANCE CENTER 2.5 EXPERT GUIDE: SYBASE 53
SYBASE EXPERT GUIDE > CONTENTION STATISTICS - SYBASE
Network Delays• Metrics
• Troubleshooting
The Sybase server normally sends and receives network packets at a regular rate. If the network begins to become saturated, Sybase could experience delays in network I/O. The Network Delays statistic reflects the number of times network I/O activity was delayed.
NOTE: This statistic displays on both the Network performance category view and the Contention performance category view.
MetricsSeeing a network contention rate greater than 1% could indicate a challenged network structure.
TroubleshootingBeyond ensuring that the existing network is sufficient for handling the current load (database and nondatabase), other items to look at from a Sybase-specific standpoint include validating that only the necessary amount of data is being sent and returned to requesting users. You can also examine the default packet size and see if it is too small for the average packet size being sent/received by the Sybase server.
Network RequestsNetwork Requests represents the total TDS packets received and sent by Sybase.
NOTE: This statistic displays on both the Network performance category view and the Contention performance category view.
Contention Detail ViewThe following tabbed pages are available on the Contention Detail view:
• All Locks
• Blocking Locks
All Locks Tab• Metrics
• Troubleshooting
EMBARCADERO TECHNOLOGIES > EMBARCADERO PERFORMANCE CENTER 2.5 EXPERT GUIDE: SYBASE 54
SYBASE EXPERT GUIDE > CONTENTION STATISTICS - SYBASE
Data integrity is maintained in a database through the use of locks. There are many variations of locks that can be applied to data objects, with some being very restrictive. The All Locks tab of the Locks view presents granular information relating to locks that currently exist on the Sybase server. The table below describes the information available on the All Locks tab of the Locks view:
TIP: To configure the grid to show/hide row numbers, use the Options Editor.
MetricsThe main thing to watch for with respect to locks is that all DML locks currently held on the system do not approach the number of locks limit specified in the Sybase server's configuration. The parameter number of locks limits how many locks can exist on the system at one time.
TroubleshootingIf the total number of locks approaches the number of locks limit, you should:
• Ensure that user processes are efficiently using locks and are committing frequently to avoid excessive lock hold times before editing the current Sybase configuration.
• Edit the configuration file for the Sybase server.
• Increase the amount of number of locks to a higher value.
• Cycle the Sybase server when possible to allow the new value to take effect.
Blocking Locks Tab• Metrics
• Troubleshooting
Column Description
PID The process of the view.
User Name The login name of the user.
Database The database that contains the locks.
Lock Type The type of lock being applied.
Object Name The object name being locked.
Status The status of the transaction.
Lock Page The page number where the lock is currently applied.
Lock Class The name of the cursor the lock is associated with (if any).
Host The name of the host computer.
Program The program the process is running.
Command The command being issued by the process.
CPU Time The amount of CPU time accumulated for the current command.
Physical I/O The amount of physical I/O accumulated for the current command.
Mem Usage The amount of memory accumulated for the current command.
FID The process ID of the worker process’ parent.
Transaction The name of the associated transaction (if any).
EMBARCADERO TECHNOLOGIES > EMBARCADERO PERFORMANCE CENTER 2.5 EXPERT GUIDE: SYBASE 55
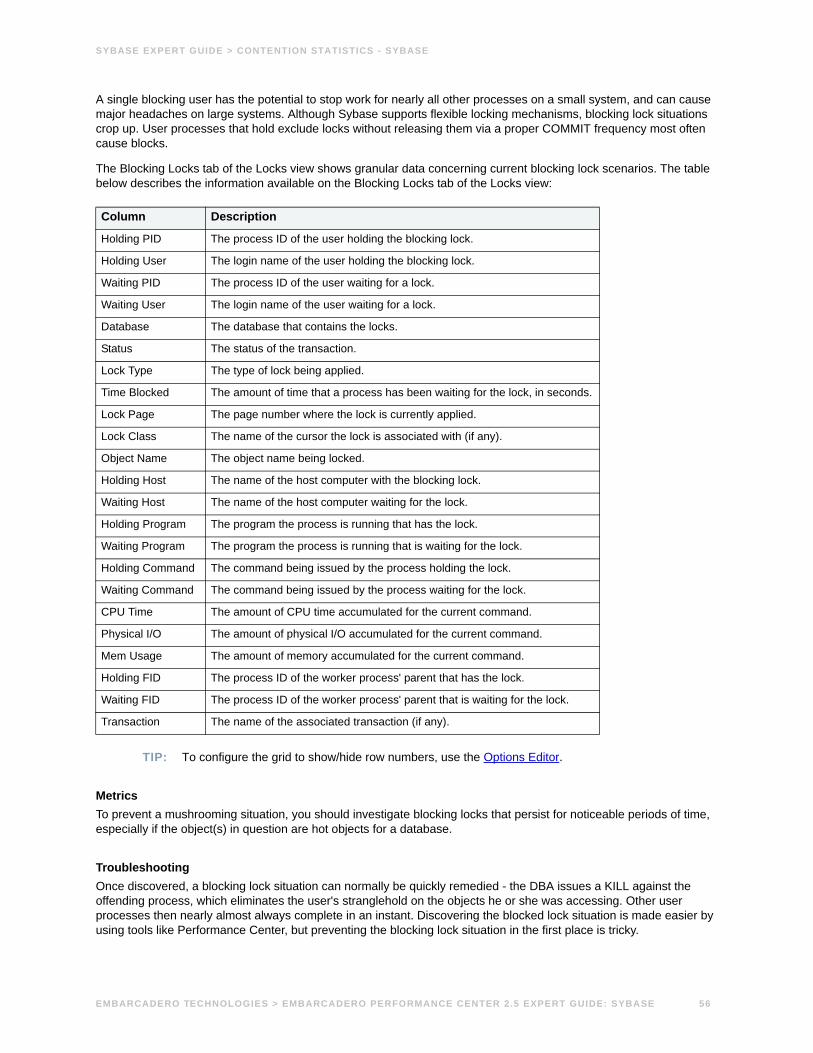
SYBASE EXPERT GUIDE > CONTENTION STATISTICS - SYBASE
A single blocking user has the potential to stop work for nearly all other processes on a small system, and can cause major headaches on large systems. Although Sybase supports flexible locking mechanisms, blocking lock situations crop up. User processes that hold exclude locks without releasing them via a proper COMMIT frequency most often cause blocks.
The Blocking Locks tab of the Locks view shows granular data concerning current blocking lock scenarios. The table below describes the information available on the Blocking Locks tab of the Locks view:
TIP: To configure the grid to show/hide row numbers, use the Options Editor.
MetricsTo prevent a mushrooming situation, you should investigate blocking locks that persist for noticeable periods of time, especially if the object(s) in question are hot objects for a database.
TroubleshootingOnce discovered, a blocking lock situation can normally be quickly remedied - the DBA issues a KILL against the offending process, which eliminates the user's stranglehold on the objects he or she was accessing. Other user processes then nearly almost always complete in an instant. Discovering the blocked lock situation is made easier by using tools like Performance Center, but preventing the blocking lock situation in the first place is tricky.
Column Description
Holding PID The process ID of the user holding the blocking lock.
Holding User The login name of the user holding the blocking lock.
Waiting PID The process ID of the user waiting for a lock.
Waiting User The login name of the user waiting for a lock.
Database The database that contains the locks.
Status The status of the transaction.
Lock Type The type of lock being applied.
Time Blocked The amount of time that a process has been waiting for the lock, in seconds.
Lock Page The page number where the lock is currently applied.
Lock Class The name of the cursor the lock is associated with (if any).
Object Name The object name being locked.
Holding Host The name of the host computer with the blocking lock.
Waiting Host The name of the host computer waiting for the lock.
Holding Program The program the process is running that has the lock.
Waiting Program The program the process is running that is waiting for the lock.
Holding Command The command being issued by the process holding the lock.
Waiting Command The command being issued by the process waiting for the lock.
CPU Time The amount of CPU time accumulated for the current command.
Physical I/O The amount of physical I/O accumulated for the current command.
Mem Usage The amount of memory accumulated for the current command.
Holding FID The process ID of the worker process' parent that has the lock.
Waiting FID The process ID of the worker process' parent that is waiting for the lock.
Transaction The name of the associated transaction (if any).
EMBARCADERO TECHNOLOGIES > EMBARCADERO PERFORMANCE CENTER 2.5 EXPERT GUIDE: SYBASE 56
SYBASE EXPERT GUIDE > USERS STATISTICS - SYBASE
The culprit of blocking lock scenarios is usually the application design, or the SQL being used within the application itself. Properly coding an application to reference database objects in an efficient order, and then using the right SQL to get the job done, is an art. The key to avoiding lock contention is to process user transactions in the quickest and most efficient manner possible - something not always easy to do.
By default, all processes wait indefinitely for locks in Sybase. You can change this behavior by modifying the lock wait period configuration parameter, which limits the number of seconds that a process waits for a lock before timing out.
Users Statistics - SybaseThe Users performance category view displays the following vital Sybase user statistics:
• Active Connections
• Current Locks
• Inactive Connections
• Rows Deleted
• Rows Inserted
• Rows Updated
• Row Updated (Data Locks Only)
• Session Leaders - CPU
• Session Leaders - I/O
• Session Leaders - Memory
• Total Rows Affected
• Committed Transactions
• ULC Flushes
• Users Blocked
Active ConnectionsThe Active Connections statistic represents the total number of active and open threads reported in the Sybase server. This number displays the number of processes actively performing work.
TIP: Click this statistic to drill down to the Processes tab of the Users Detail view.
MetricsNone.
Inactive Connections• Metrics
EMBARCADERO TECHNOLOGIES > EMBARCADERO PERFORMANCE CENTER 2.5 EXPERT GUIDE: SYBASE 57

SYBASE EXPERT GUIDE > USERS STATISTICS - SYBASE
The Inactive Connections statistic represents the total number of Sybase threads that are not actively running on one of the server engines.
TIP: Click this statistic to drill down to the Processes tab of the Users Detail view.
MetricsSeeing a large number of inactive connections is not generally a cause for concern. If the threads are in a sleeping state (waiting for a resource or performing large volumes of disk I/O), further investigation can be warranted.
Current Locks• Metrics
• Troubleshooting
The Current Lock statistic displays the total number of locks obtained/requested by processes in the database.
TIP: Click this statistic to drill down to the All Locks tab of the Locks view.
NOTE: This statistic is also available on the Contention performance category view.
MetricsThe main thing to watch with respect to current locks is that all DML locks currently held on the system do not approach the Number of Locks limit specified in the Sybase server’s configuration. The parameter for number of locks limits how many locks can exist on the system at once.
TroubleshootingIf the total number of locks approaches the number of locks limit, you should:
1 Ensure that user processes are efficiently using locks and are committing frequently to avoid excessive lock hold times before editing the current Sybase configuration.
2 Edit the configuration file for the Sybase server.
3 Increase the number of locks to a higher value.
4 Cycle the Sybase server when possible to allow the new value to take effect.
Users Blocked• Metrics
• Troubleshooting
A single blocking user has the potential to stop work for nearly all other processes on a small system, and can cause major headaches on large systems. Although Sybase supports flexible locking mechanisms, blocking lock situations do crop up. Blocks are most often caused by user processes holding exclusive locks and not releasing them via a proper COMMIT frequency.
The blocked statistic displays the number of current processes blocked by other processes.
NOTE: Click this statistic to drill down to the Blocking Locks tab of the Locks view.
NOTE: This statistic is also available on the Contention performance category view.
EMBARCADERO TECHNOLOGIES > EMBARCADERO PERFORMANCE CENTER 2.5 EXPERT GUIDE: SYBASE 58
SYBASE EXPERT GUIDE > USERS STATISTICS - SYBASE
MetricsWhile the lock contention rate is a better measure of the overall lock contention situation, consistently seeing positive numbers for the blocked statistic should clue you into the fact that there is a bottleneck for some processes. You can easily drill down and discover the exact process(es) holding locks that are blocking out other user activity.
TroubleshootingOnce you discover a blocking lock situation, you can normally remedy it by issuing a KILL against the offending process. This eliminates the user's stranglehold on the objects the user was accessing, and usually results in other user processes completing in an instant. Discovering the blocked lock situation is made easier by using tools like Performance Center, but preventing the blocking lock situation in the first place is tricky.
The culprit of blocking lock scenarios is usually the application design, or the SQL being used within the application itself. Properly coding an application to reference database objects in an efficient order, and then using the right SQL to get the job done, is an art. The key to avoiding lock contention is to process user transactions in the quickest and most efficient manner possible - something not always easy to do.
By default, all processes wait indefinitely for locks in Sybase. You can change this behavior by modifying the lock wait period configuration parameter, which limits the number of seconds that a process waits for a lock before timing out.
Committed Transactions• Metrics
Committed Transactions gives the number of transactions committed since the last refresh inside Performance Center. This includes transactions that meet explicit, implicit, and ANSI definitions for committed transactions. Note that multidatabase transactions are counted.
TIP: Click this statistic to drill down to the Transactions tab of the Users Detail view.
MetricsMultidatabase transactions generally incur more overhead than single database transactions (for example, a transaction that modifies two databases is counted as two transactions). They usually involve more log activity and two-phase commits between the different databases, as well as cause more ULC flushes. You can improve performance by reducing the number of multidatabase transactions.
ULC Flushes• Metrics
The total number of times that user log caches (ULCs) were flushed to a transaction log during the sampling interval.
MetricsNone.
Rows Inserted• Metrics
• Troubleshooting
EMBARCADERO TECHNOLOGIES > EMBARCADERO PERFORMANCE CENTER 2.5 EXPERT GUIDE: SYBASE 59
SYBASE EXPERT GUIDE > USERS STATISTICS - SYBASE
The Rows Inserted statistic reflects the number of row inserts to heap and clustered tables. Note that it does not include the number of fast bulk copy inserts, because these are written directly to the data pages themselves.
TIP: Click this statistic to drill down to the DML Detail tab of the Users Detail view.
MetricsLarge numbers of inserts are no cause for concern. The only thing to keep an eye on is that heavy insert activity on heap tables can potentially cause lock contention. It is easy to investigate lock contention in the Embarcadero Performance Center’s Locks view.
TroubleshootingIf insert activity seems to be causing lock contention, you can consider creating a clustered index that randomizes insert activity on the tables in question. Alternatives are establishing partitions on an unpartitioned table or increasing the number of partitions on a partitioned table.
Keep in mind that an unwanted by-product of clustered indexes is occasional page splitting.
Rows Updated• Metrics
The Rows Updated statistic represents all deferred and direct update activity.
TIP: Click this statistic to drill down to the DML Detail tab of the Users Detail view.
MetricsNone.
Rows Updated (Data Only Locks)• Metrics
The Rows Updated (Data Only Locks) statistic represents all deferred and direct update activity.
TIP: Click this statistic to drill down to the DML Detail tab of the Users Detail view.
MetricsNone.
Rows Deleted• Metrics
The Rows Deleted statistic represents all deferred and direct delete activity.
TIP: Click this statistic to drill down to the DML Detail tab of the Users Detail view.
MetricsNone.
EMBARCADERO TECHNOLOGIES > EMBARCADERO PERFORMANCE CENTER 2.5 EXPERT GUIDE: SYBASE 60

SYBASE EXPERT GUIDE > USERS STATISTICS - SYBASE
Total Rows Affected• Metrics
The Total Rows Affected statistic represents all rows impacted by some form of DML activity (inserts, updates, deletes).
TIP: Click this statistic to drill down to the DML Detail tab of the Users Detail view.
MetricsNone.
Session Leaders - Memory• Metrics
• Troubleshooting
It is not uncommon for one or two users to cause the majority of runtime problems that plague a database. The problems could be runaway processes, untuned batch procedures, or user-initiated operations. Often, user connections can get out of hand with memory consumption, and extreme cases have caused headaches at both the database and operating system levels.
NOTE: This statistic displays on both the Memory performance category view and the Users performance category view.
TIP: Click this statistic to drill down to the Leading Sessions tab of the Memory Detail view.
MetricsIf your Sybase server does not have an overabundance of memory, you should check periodically to see who your heavy memory users are. You should also check the total percentage of memory each takes up. If you see one or two users who have more than 5-15% of the total memory usage, you should investigate the sessions further to see what activities they are performing.
TroubleshootingYou can use the Session Leaders - Memory statistic to find the users with the greatest current allocations of overall memory. Runaway processes can be immediately terminated from within the Embarcadero Performance Center Client.
Session Leaders - I/O• Metrics
When a system undergoes heavy I/O activity, sometimes you find that all user connections are contributing equally to the overall load. More often than not, however, one or two user connections are responsible for 75% or more of the I/O activity. It can be that a large batch load or other typical process is running that is perfectly okay for your system. Alternatively, it can be a runaway process or other rogue connection that needs to be tracked down and possibly eliminated.
EMBARCADERO TECHNOLOGIES > EMBARCADERO PERFORMANCE CENTER 2.5 EXPERT GUIDE: SYBASE 61
SYBASE EXPERT GUIDE > USERS STATISTICS - SYBASE
The leading I/O session's display allows you to see who runs the leading sessions in your system with respect to I/O.
NOTE: This statistic displays on both the I/O performance category view and the Users performance category view.
TIP: Click this statistic to drill down to the Leading Sessions tab of the I/O Detail view.
Metrics Finding one or two users who consume more than 75% of the total I/O load can indicate runaway or improper processes. By drilling down into the I/O activity of all users, you can quickly see if this is the case.
Session Leaders - CPU• Metrics
It is not uncommon for one or two users to cause the majority of runtime problems that plague a database. The problem could be a runaway process, an untuned batch procedure, or other user-initiated operation. Often, user connections can get out of hand with CPU use, and extreme cases have caused headaches at both the database and operating system levels.
The leading CPU session's display allows you to see who runs the leading sessions are in your system with respect to CPU usage.
Metrics Finding one or two users who use the majority of the CPU can indicate runaway or improper processes. By drilling down into the CPU activity of all users, you can quickly see if this is the case.
Users Detail ViewThe following tabbed pages are available on the Users Detail view:
• Applications
• Blocking Locks
• DML Detail
• Locks
• Processes
• Transactions
EMBARCADERO TECHNOLOGIES > EMBARCADERO PERFORMANCE CENTER 2.5 EXPERT GUIDE: SYBASE 62

SYBASE EXPERT GUIDE > USERS STATISTICS - SYBASE
Applications TabDifferent programs/applications can access the Sybase server at the same time, with some being more resource-intensive than others. The Applications Detail tab on the Users Detail view summarizes resource consumption at the application level. The table below describes the information available on the Applications tab of the Users Detail view:
TIP: To configure the grid to show/hide row numbers, use the Options Editor.
MetricsNone.
Processes Tab• Metrics
It is not uncommon for one or two users to cause the majority of runtime problems that plague a database. The problem could be a runaway process, an untuned batch procedure, or other user-initiated operation. Often, user connections can get out of hand with memory consumption, CPU, or physical I/O, and extreme cases have caused headaches at both the database and operating system levels.
Column Description
Application The application name. NOTE: This can be blank if Sybase cannot determine the application accessing the server.
Application Count The total number of like applications accessing the server.
Active The count of active applications accessing the server.
Inactive The count of inactive applications accessing the server.
Memory Used The total amount of memory used by each application's current command.
CPU Used The total amount of CPU used by each application's current command.
Physical I/O The total amount of Physical I/O used by each application's current command.
EMBARCADERO TECHNOLOGIES > EMBARCADERO PERFORMANCE CENTER 2.5 EXPERT GUIDE: SYBASE 63

SYBASE EXPERT GUIDE > USERS STATISTICS - SYBASE
The Processes tab of the Users Detail view displays information to help pinpoint problem processes. The table below describes the information available on the Processes tab of the Users Detail view:
TIP: To configure the grid to show/hide row numbers, use the Options Editor.
MetricsThe key to spotting problem processes is to view their information in light of the total activity on a server. For example, if your database server does not have an overabundance of memory, you should periodically check to see who your heavy memory users are. You should also check the total percentage of memory each takes up. If you see one or two users who have more than 5-15% of the total memory usage, you should investigate the sessions further to see what activities they are performing and take action if necessary.
Locks Tab• Metrics
• Troubleshooting
Column Description
User Name The logon name the session is using.
PID The process ID.
FID The process ID of the worker process’ parent.
Database The database the process is attached to.
Status Indicates if the process is actively performing work, is idle, blocked by another process, etc.
Host The client machine name the session is using.
Program The executable the process is using against the Sybase server.
Memory The amount of memory currently allocated to the process.
CPU The amount of CPU currently in use by the process.
Physical I/O The amount of physical I/O currently accumulated by the process.
Blocked Whether the process is blocked by another process.
Command The command the process is currently issuing.
EMBARCADERO TECHNOLOGIES > EMBARCADERO PERFORMANCE CENTER 2.5 EXPERT GUIDE: SYBASE 64

SYBASE EXPERT GUIDE > USERS STATISTICS - SYBASE
Data integrity is maintained in a database through the use of locks. There are many variations of locks that can be applied to data objects, with some being very restrictive. The Locks tab of the Users Detail view presents granular information relating to locks that currently exist on the Sybase server. The table below describes the information available on the Locks tab of the Users Detail view:
TIP: To configure the grid to show/hide row numbers, use the Options Editor.
MetricsThe main thing to watch with respect to current locks is that all DML locks currently held on the system do not approach the number of locks limit specified in the Sybase server's configuration. The parameter number of locks limits how many locks can exist on the system at once.
TroubleshootingIf the total number of locks approaches the number of locks limit, then:
• Before editing the current Sybase configuration, ensure that user processes are efficiently using locks and are committing frequently to avoid excessive lock hold times.
• Edit the configuration file for the Sybase server.
• Increase the amount of number of locks to a higher value.
• Cycle the Sybase server when possible to allow the new value to take effect.
Blocking Locks Tab• Metrics
• Troubleshooting
Column Description
PID The process of the user.
User Name The login name of the user.
Database The database that contains the locks.
Lock Type The type of lock being applied.
Object Name The object name being locked.
Status The status of the transaction.
Lock Page The page number where the lock is currently applied.
Lock Class The name of the cursor the lock is associated with (if any).
Host The name of the host computer.
Program The program the process is running.
Command The command being issued by the process.
CPU Time The amount of CPU time accumulated for the current command.
Physical I/O The amount of physical I/O accumulated for the current command.
Mem Usage The amount of memory accumulated for the current command.
FID The process ID of the worker process' parent.
Transaction The name of the associated transaction (if any).
EMBARCADERO TECHNOLOGIES > EMBARCADERO PERFORMANCE CENTER 2.5 EXPERT GUIDE: SYBASE 65

SYBASE EXPERT GUIDE > USERS STATISTICS - SYBASE
A single blocking user has the potential to stop work for nearly all other processes on a small system, and can cause major headaches even on large systems. Although Sybase supports flexible locking mechanisms, blocking lock situations do crop up. User processes holding exclusive locks and not releasing them via a proper COMMIT frequency most often cause blocks.
The Blocking Locks tab of the Users Detail view shows granular data concerning current blocking lock scenarios. The table below describes the information available on the Blocking Locks tab of the Users Detail view:
TIP: To configure the grid to show/hide row numbers, use the Options Editor.
MetricsTo prevent a mushrooming situation, you should investigate blocking locks that persist for noticeable periods of time should, especially if the object(s) in question are hot objects for a database.
TroubleshootingOnce discovered, a blocking lock situation can normally be quickly remedied - the DBA issues a KILL against the offending process, which eliminates the user's stranglehold on the objects he or she was accessing. Other user processes then nearly almost always complete in an instant. Discovering the blocked lock situation is made easier by using tools like Performance Center, but preventing the blocking lock situation in the first place is where it gets tricky.
Column Description
Holding PID The process ID of the user holding the blocking lock.
Holding User The login name of the user holding the blocking lock.
Waiting PID The process ID of the user waiting for a lock.
Waiting User The login name of the user waiting for a lock.
Database The database that contains the locks.
Object Name The object name being locked.
Status The status of the transaction.
Lock Type The type of lock being applied.
Time Blocked The amount of time that a process has been waiting for the lock, in seconds.
Lock Page The page number where the lock is currently applied.
Lock Class The name of the cursor the lock is associated with (if any).
Holding Host The name of the host computer with the blocking lock.
Waiting Host The name of the host computer waiting for the lock.
Holding Program The program the process is running that has the lock.
Waiting Program The program the process is running that is waiting for the lock.
Holding Command The command being issued by the process holding the lock.
Waiting Command The command being issued by the process waiting for the lock.
CPU Time The amount of CPU time accumulated for the current command.
Physical I/O The amount of physical I/O accumulated for the current command.
Mem Usage The amount of memory accumulated for the current command.
Holding FID The process ID of the worker process' parent that has the lock.
Waiting FID The process ID of the worker process' parent that is waiting for the lock.
Transaction The name of the associated transaction (if any).
EMBARCADERO TECHNOLOGIES > EMBARCADERO PERFORMANCE CENTER 2.5 EXPERT GUIDE: SYBASE 66
SYBASE EXPERT GUIDE > USERS STATISTICS - SYBASE
The culprit of blocking lock scenarios is usually the application design, or the SQL being used within the application itself. Properly coding an application to reference database objects in an efficient order, and then using the right SQL to get the job done, is an art. The key to avoiding lock contention is to process user transactions in the quickest and most efficient manner possible - something not always easy to do.
By default, all processes wait indefinitely for locks in Sybase. You can change this behavior by modifying the lock wait period configuration parameter, which limits the number of seconds that a process waits for a lock before timing out.
DML Detail Tab • Metrics
Dynamic Sybase environments typically have large amounts of DML (data manipulation language) activity that occurs. Knowing the volume of INSERT, UPDATE, and DELETE activity can help you make correct decisions regarding sizing, object options, etc. The DML Detail tab of the Users Detail view provides a quick snapshot of the amount of object/data manipulation that is occurring. The table below describes details of the DML Detail tab of the Users Detail view:
The table below describes the statistics available on the DML Detail tab of the Users Detail view:
MetricsResponse times can differ greatly for various types of DML activity. For example, deferred UPDATE and DELETE operations (which are often caused by join conditions or because referential integrity conditions exist) normally perform slower than direct UPDATE and DELETEs. Deferred operations can involve rereading the transaction log to finalize the operation whereas direct operations have no such need. Another example would be that a direct expensive update involves additional index locks (and is therefore more restrictive), while direct cheap updates do not.
Transactions Tab• Metrics
Detail Description
Activity Type The type of INSERT, UPDATE, or DELETE.
Amount The number of operations that have taken place since the last refresh.
Statistic Description
Heap Table Inserts Total rows inserted into heap tables during sample interval.
Clustered Table Inserts Total rows inserted into clustered tables during sample interval.
Deferred Updates Total number of updates that were accomplished in two steps during sample interval.
Direct In Place Updates Total number of in-place updates (no data rows are moved on the data page) during sample interval.
Direct Cheap Updates Total number of on-page updates (the length of the data row changes) during sample interval.
Direct Expensive Updates Total number of delete/insert direct updates (rows are deleted from their original location and inserted at a new location) during sample interval.
Deferred Deletes Total rows deleted during the sample interval.
Direct Deletes Total rows directly deleted during the sample interval.
EMBARCADERO TECHNOLOGIES > EMBARCADERO PERFORMANCE CENTER 2.5 EXPERT GUIDE: SYBASE 67

SYBASE EXPERT GUIDE > NETWORK STATISTICS - SYBASE
Transactions are used in Sybase to preserve data integrity and keep logical units of work together. Long-running transactions, however, run the risk of holding data and object locks longer than necessary and possibly degrading overall system response times. The Transactions tab of the Users Detail view shows all running transactions in a database and their current state. The table below describes the information available on the Transactions tab of the Users Detail view:
TIP: To configure the grid to show/hide row numbers, use the Options Editor.
MetricsYou should examine transactions that have been running for excessive periods of time to see if they are being blocked by other transactions. If you find this is the case, Embarcadero Performance Center offers mechanisms that allow you to kill any process that is blocking another. If blocking lock activity is occurring, a small redesign of the application or more frequent COMMIT TRANSACTION points can prove to be useful preventive measures.
Network Statistics - SybaseThe Network performance category view displays the following vital network statistics:
• Total Packets Received
• Total Packets Sent
• Total Bytes Received
• Total Bytes Sent
• Network Errors
• Network Contention Rate
• Network Delays
• Network Requests
Column Description
SPID The process ID.
Login The login name of the user initiating the transaction.
Database The database involving the transaction.
Status The status of the transaction.
Start Time The time the transaction began.
Type The type of transaction (local, remote, etc.)
State The point where the transaction is (In Command, Committed, etc.)
Command The current command being issued.
Connection Whether the transaction is current attached or detached.
CPU The amount of CPU currently being used by the transaction.
Memory The amount of memory used by the current transaction.
Physical I/O The current cumulative number of reads and writes issued by the process.
EMBARCADERO TECHNOLOGIES > EMBARCADERO PERFORMANCE CENTER 2.5 EXPERT GUIDE: SYBASE 68

SYBASE EXPERT GUIDE > NETWORK STATISTICS - SYBASE
Total Packets Received• Metrics
Total Packets Received reflects the number of times Sybase received a packet from a client application.
MetricsNone.
Total Packets Sent• Metrics
Total Packets Sent reflects the number of times Sybase sent a packet to a client application.
MetricsNone.
Total Bytes Received• Metrics
Total Bytes Received reflects the number of bytes received by Sybase since the last refresh in Embarcadero Performance Center.
MetricsNone.
Total Bytes Sent• Metrics
Total Bytes Sent reflects the number of bytes sent to Sybase since the last refresh in Embarcadero Performance Center.
MetricsNone.
Network Errors• Metrics
• Troubleshooting
The Network Errors statistic reflects the number of times that network errors were detected by Sybase while reading and writing packets.
MetricsSeeing a consistent value much above zero could indicate a challenged network structure.
EMBARCADERO TECHNOLOGIES > EMBARCADERO PERFORMANCE CENTER 2.5 EXPERT GUIDE: SYBASE 69
SYBASE EXPERT GUIDE > NETWORK STATISTICS - SYBASE
TroubleshootingBeyond ensuring that the existing network is sufficient for handling the current load (database and non-database), other items to look at from a Sybase-specific standpoint include validating that only the necessary amount of data is being sent and returned to requesting users. You can also examine the default packet size and see if it is too small for the average packet size being sent/received by the Sybase server.
Network Contention Rate• Metrics
• Troubleshooting
The Sybase server normally sends and receives network packets at a regular rate. If the network begins to become saturated, Sybase can experience delays in network I/O. The network contention rate indicates the percentage of times network I/O activity was delayed.
MetricsSeeing a network contention rate greater than 1% could indicate a challenged network structure.
TroubleshootingOutside of ensuring that the existing network is sufficient for handling the current load (database and non-database), other items to look at from a Sybase-specific standpoint include validating that only the necessary amount of data is being sent and returned to requesting users. You can also examine the default packet size and see if it is too small for the average packet size being sent/received by the Sybase server.
Network Delays• Metrics
• Troubleshooting
The Sybase server normally sends and receives network packets at a regular rate. If the network begins to become saturated, Sybase can experience delays in network I/O. The Network Delays statistic reflects the number of times network I/O activity was delayed.
MetricsSeeing a network contention rate greater than 1% could indicate a challenged network structure.
TroubleshootingBeyond ensuring that the existing network is sufficient for handling the current load (database and non-database), other items to look at from a Sybase-specific standpoint include validating that only the necessary amount of data is being sent and returned to requesting users. You can also examine the default packet size and see if it is too small for the average packet size being sent/received by the Sybase server.
Network RequestsNetwork Requests represents the total TDS packets received and sent by Sybase.
MetricsNone.
EMBARCADERO TECHNOLOGIES > EMBARCADERO PERFORMANCE CENTER 2.5 EXPERT GUIDE: SYBASE 70

SYBASE EXPERT GUIDE > NETWORK STATISTICS - SYBASE
EMBARCADERO TECHNOLOGIES > EMBARCADERO PERFORMANCE CENTER 2.5 EXPERT GUIDE: SYBASE 71

Other Views and StatisticsIn addition to the Home view, Enterprise view and the performance category views, Embarcadero Performance Center offers many other views. The tables below lists, by database platform, the other views available in Embarcadero Performance Center:
Archive View• Metrics
To allow for point-in-time recovery, Oracle writes copies of redo log information to disk. When a database is running in archive log mode, a DBA, with proper backup techniques in place, can recover nicely from a database error and roll forward to almost any point in time as long as the proper archive logs are in place.
The I/O needed to write these archive logs is handled by Oracle's ARCH process. The Archive view allows archive files written by the ARCH process to be viewed by user-specified time frames. The table below describes the information available on the Archive view:
TIP: To configure the grid to show/hide row numbers, use the Options Editor.
MetricsNumerous archive files can be written to disk if there is heavy redo log activity. Batch jobs have the potential to move very fast; sometimes so fast that the online redo logs wrap back around before they have a chance to be archived. Messages indicating this has happened show up in the Oracle alert log. If this happens frequently, you should think about increasing the size of the online redo log files, or increasing the number of redo logs in general.
View Oracle SQL Server Sybase DB2
Alert Log x x x x
Archive x
Configuration Parameters x x x
Health Index x x x x
Hot Objects x
Instance Parameters x
Lock x x x x
Operating System x x x x
Session Detail x x x x
SQL Server Logs x
Top Sessions x x x x
Top SQL x x x
Trends x x x x
Column Description
Date/Time The timestamp of the archive log (when the log was written).
Title The actual archive log file name and path.
EMBARCADERO TECHNOLOGIES > EMBARCADERO PERFORMANCE CENTER 2.5 EXPERT GUIDE: SYBASE 93
OTHER VIEWS AND STATISTICS > HEALTH INDEX VIEW
Seeing archive files written at a rate of more than one every 30-60 minutes can indicate the redo size is too small (or there is an above-average data modification load).
If you do not want to lose an archive file that can be needed for recovery and you are using Oracle 8 or later, you can take advantage of the feature that lets you write archive files to more than one destination on disk. This feature also allows multiple ARCH processes to be invoked. Investigate using the Init.ora parameters log_archive_dest_n and log_archive_max_processes.
Always remember one thing with respect to archive files and running Oracle in archive log mode: Running out of archive file space on the server can halt all activity in a database. Make sure you have ample free space available on your archive drives. And, you should also implement a purge procedure for older archives in conjunction with your backup routine.
Health Index View • Metrics
Embarcadero Performance Center's global and category-specific health indexes are fast and efficient indicators you can use to determine if a database is experiencing problems. They also locate the most problematic area(s). With the Health Index view, you can scan individual category indexes simultaneously and see, over time, where the problem areas reside.
MetricsGenerically speaking, you should investigate any index that falls below 90. Temporary dips in a health index graph should not be a cause for concern unless the dips form a pattern and occur on a predictable and continuous basis.
Hot ObjectsThe following tabbed pages are available on the Hot Objects view:
• Hot Tables
• Hot Code
NOTE: The Hot Objects view is for Oracle datasources.
Hot Tables• Metrics
Certain objects in an Oracle database are accessed more than others. These objects can become a source of contention given certain conditions. The Hot Tables tab of the Hot Objects view identifies tables that are being frequently accessed through various SQL statements. The table below describes the information that Performance Center displays on the Hot Tables tab of the Hot Objects view:
Column Description
Table Owner The owner of the table.
Table Name The name of the table.
Command Issued The SQL statement command issued against the table.
Executions The number of SQL executions the object has experienced.
EMBARCADERO TECHNOLOGIES > EMBARCADERO PERFORMANCE CENTER 2.5 EXPERT GUIDE: SYBASE 94
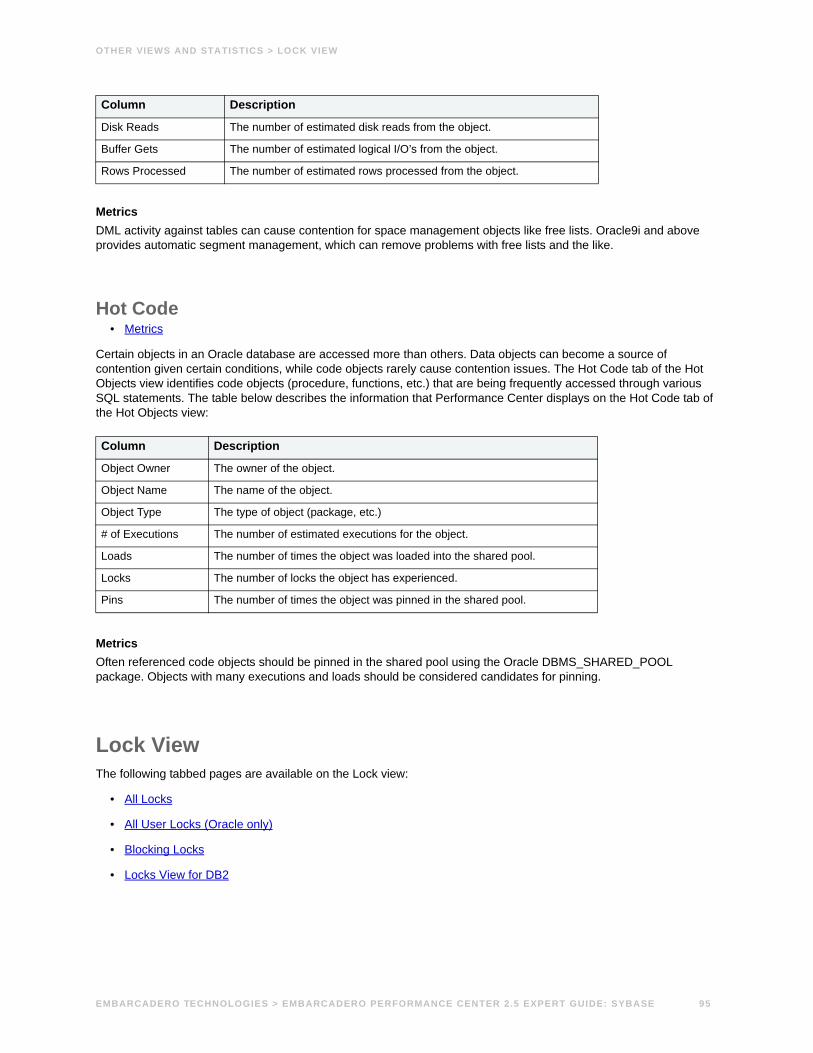
OTHER VIEWS AND STATISTICS > LOCK VIEW
MetricsDML activity against tables can cause contention for space management objects like free lists. Oracle9i and above provides automatic segment management, which can remove problems with free lists and the like.
Hot Code• Metrics
Certain objects in an Oracle database are accessed more than others. Data objects can become a source of contention given certain conditions, while code objects rarely cause contention issues. The Hot Code tab of the Hot Objects view identifies code objects (procedure, functions, etc.) that are being frequently accessed through various SQL statements. The table below describes the information that Performance Center displays on the Hot Code tab of the Hot Objects view:
MetricsOften referenced code objects should be pinned in the shared pool using the Oracle DBMS_SHARED_POOL package. Objects with many executions and loads should be considered candidates for pinning.
Lock ViewThe following tabbed pages are available on the Lock view:
• All Locks
• All User Locks (Oracle only)
• Blocking Locks
• Locks View for DB2
Disk Reads The number of estimated disk reads from the object.
Buffer Gets The number of estimated logical I/O’s from the object.
Rows Processed The number of estimated rows processed from the object.
Column Description
Object Owner The owner of the object.
Object Name The name of the object.
Object Type The type of object (package, etc.)
# of Executions The number of estimated executions for the object.
Loads The number of times the object was loaded into the shared pool.
Locks The number of locks the object has experienced.
Pins The number of times the object was pinned in the shared pool.
Column Description
EMBARCADERO TECHNOLOGIES > EMBARCADERO PERFORMANCE CENTER 2.5 EXPERT GUIDE: SYBASE 95

OTHER VIEWS AND STATISTICS > LOCK VIEW
All Locks TabThe information on the All Locks tab of the Locks view depends on the target DBMS:
• Oracle
• SQL Server
• Sybase
All Locks Tab for Oracle• Metrics
To modify database information or structures, a user session must obtain a lock on the object to perform its task. In addition to user locks, Oracle issues lock requests to carry out its internal duties. The All Locks tab of the Locks view displays information about all locks currently on a system. The table below describes the information available on the All Locks tab of the Locks view for Oracle:
TIP: To configure the grid to show/hide row numbers, use the Options Editor.
MetricsLocks held for unusually long periods are candidates for further investigation. The application logic can be inefficient or the program may not be issuing COMMIT frequently enough.
All Locks Tab for SQL Server• Metrics
To modify database information or structures, a user session must obtain a lock on the object to perform its task. In addition to user locks, SQL Server issues lock requests to carry out its internal duties. Embarcadero Performance Center displays information about all locks currently on a system on the All Locks tab of the Locks view and the Lock Detail grid on the Lock tab of the Contention Detail view.
Column Description
SID The session identifier of the session holding the lock.
User Name The user account of the session holding the lock. NULL if it is a background process.
Lock Mode The lock mode (EXCLUSIVE, SHARE, etc.)
Request Type The type of lock requested by the session.
Object Name The name of the object being locked.
Object Type The type of object being locked (TABLE, etc.)
Lock Type The type of lock (TRANSACTION, DML, etc.)
Lock ID 1 The lock identifier #1 (depends on type).
Lock ID 2 The lock identifier #2 (depends on type).
EMBARCADERO TECHNOLOGIES > EMBARCADERO PERFORMANCE CENTER 2.5 EXPERT GUIDE: SYBASE 96
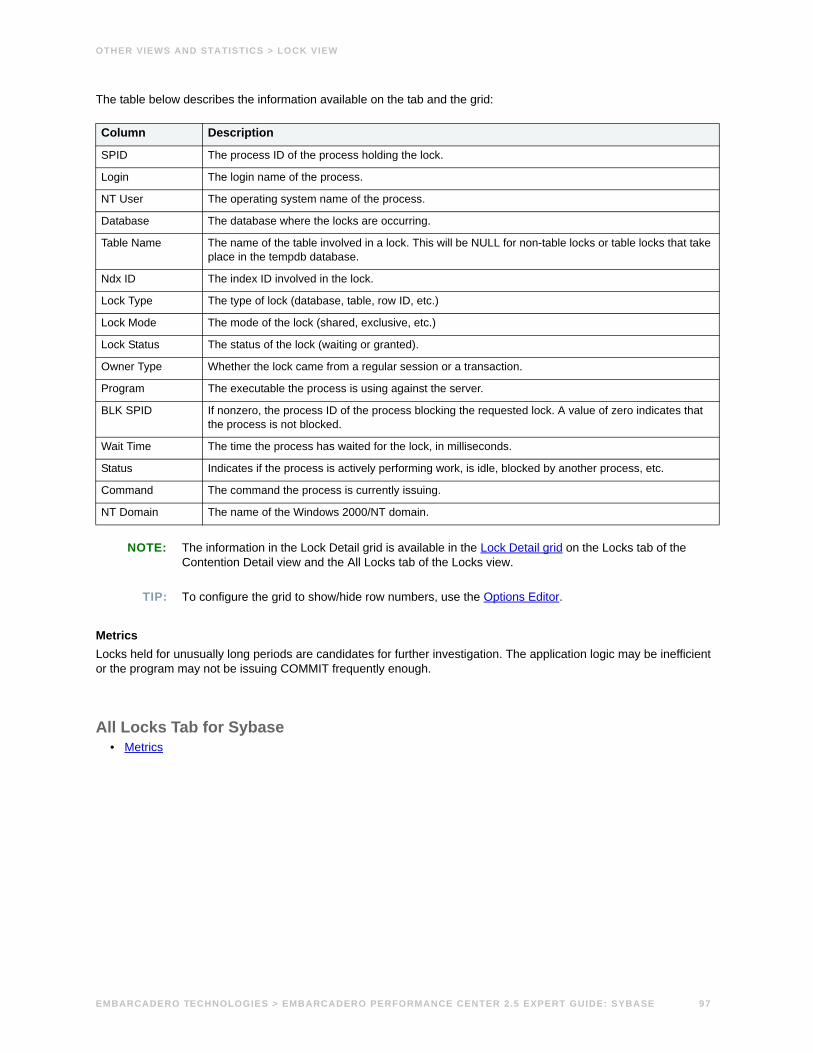
OTHER VIEWS AND STATISTICS > LOCK VIEW
The table below describes the information available on the tab and the grid:
NOTE: The information in the Lock Detail grid is available in the Lock Detail grid on the Locks tab of the Contention Detail view and the All Locks tab of the Locks view.
TIP: To configure the grid to show/hide row numbers, use the Options Editor.
MetricsLocks held for unusually long periods are candidates for further investigation. The application logic may be inefficient or the program may not be issuing COMMIT frequently enough.
All Locks Tab for Sybase• Metrics
Column Description
SPID The process ID of the process holding the lock.
Login The login name of the process.
NT User The operating system name of the process.
Database The database where the locks are occurring.
Table Name The name of the table involved in a lock. This will be NULL for non-table locks or table locks that take place in the tempdb database.
Ndx ID The index ID involved in the lock.
Lock Type The type of lock (database, table, row ID, etc.)
Lock Mode The mode of the lock (shared, exclusive, etc.)
Lock Status The status of the lock (waiting or granted).
Owner Type Whether the lock came from a regular session or a transaction.
Program The executable the process is using against the server.
BLK SPID If nonzero, the process ID of the process blocking the requested lock. A value of zero indicates that the process is not blocked.
Wait Time The time the process has waited for the lock, in milliseconds.
Status Indicates if the process is actively performing work, is idle, blocked by another process, etc.
Command The command the process is currently issuing.
NT Domain The name of the Windows 2000/NT domain.
EMBARCADERO TECHNOLOGIES > EMBARCADERO PERFORMANCE CENTER 2.5 EXPERT GUIDE: SYBASE 97
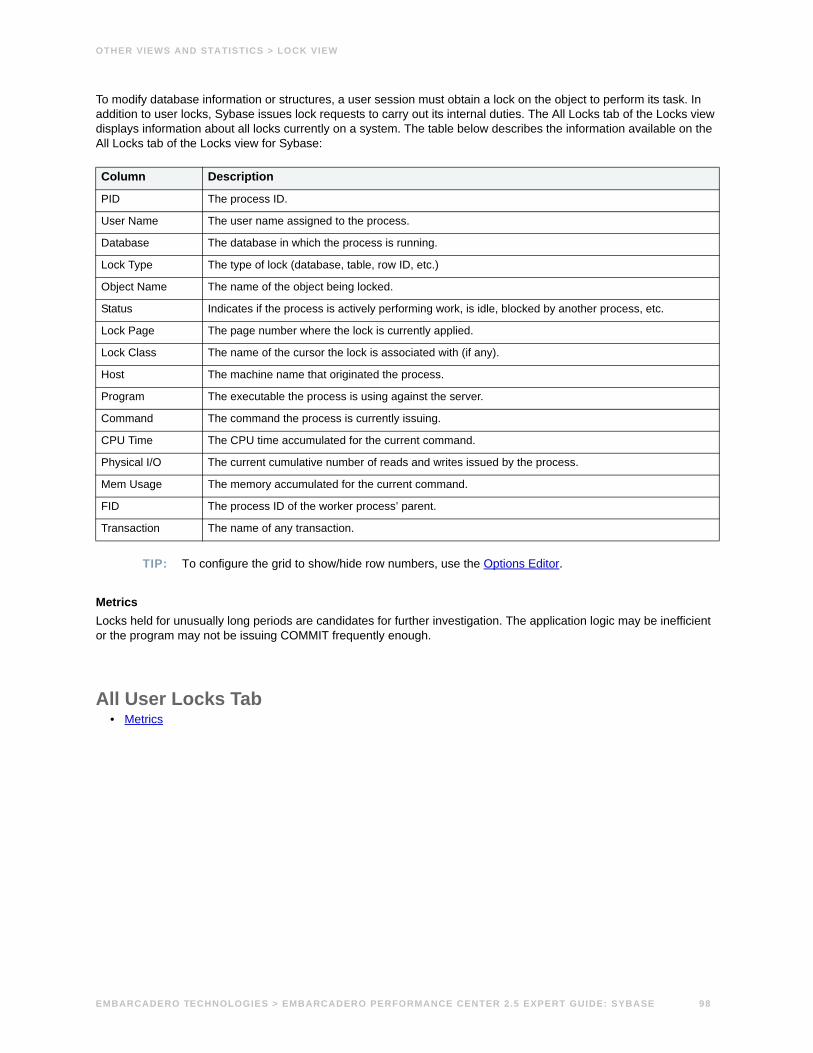
OTHER VIEWS AND STATISTICS > LOCK VIEW
To modify database information or structures, a user session must obtain a lock on the object to perform its task. In addition to user locks, Sybase issues lock requests to carry out its internal duties. The All Locks tab of the Locks view displays information about all locks currently on a system. The table below describes the information available on the All Locks tab of the Locks view for Sybase:
TIP: To configure the grid to show/hide row numbers, use the Options Editor.
MetricsLocks held for unusually long periods are candidates for further investigation. The application logic may be inefficient or the program may not be issuing COMMIT frequently enough.
All User Locks Tab• Metrics
Column Description
PID The process ID.
User Name The user name assigned to the process.
Database The database in which the process is running.
Lock Type The type of lock (database, table, row ID, etc.)
Object Name The name of the object being locked.
Status Indicates if the process is actively performing work, is idle, blocked by another process, etc.
Lock Page The page number where the lock is currently applied.
Lock Class The name of the cursor the lock is associated with (if any).
Host The machine name that originated the process.
Program The executable the process is using against the server.
Command The command the process is currently issuing.
CPU Time The CPU time accumulated for the current command.
Physical I/O The current cumulative number of reads and writes issued by the process.
Mem Usage The memory accumulated for the current command.
FID The process ID of the worker process’ parent.
Transaction The name of any transaction.
EMBARCADERO TECHNOLOGIES > EMBARCADERO PERFORMANCE CENTER 2.5 EXPERT GUIDE: SYBASE 98

OTHER VIEWS AND STATISTICS > LOCK VIEW
To modify database information or structures, a user session must obtain a lock on the object to perform its task. The All User Locks tab of the Locks view displays information about all user locks currently on a system. The table below describes the information available on the All User Locks tab of the Locks view:
NOTE: The All User Locks tab of the Locks view is only available for Oracle datasources.
TIP: To configure the grid to show/hide row numbers, use the Options Editor.
MetricsLocks held for unusually long periods are candidates for further investigation. The application logic may be inefficient or the program may not be issuing COMMITs frequently enough.
Blocking Locks TabThe information on the Blocking Locks tab of the Locks view depends on the target DBMS.
• Oracle
• SQL Server
• Sybase
Blocking Locks Tab for Oracle• Metrics
Blocking-lock situations can make the database appear frozen, rivalling only a stuck archive in effect. A single blocking user has the potential to stop work for nearly all other processes on a small system, or can cause major headaches on large systems. Although Oracle supports unlimited row-level locking, blocking-lock situations do occur - sometimes frequently.
Column Description
User Name The user account that holds the lock.
Terminal The machine name of the client session.
SID The unique Oracle identifier for the session.
Serial # The serial number of the lock.
Table The name of the object being locked.
Lock Mode The lock mode (EXCLUSIVE, SHARE, etc.)
Request The type of lock requested by the session.
EMBARCADERO TECHNOLOGIES > EMBARCADERO PERFORMANCE CENTER 2.5 EXPERT GUIDE: SYBASE 99

OTHER VIEWS AND STATISTICS > LOCK VIEW
The Blocking Locks tab of the Locks view contains information relating to user accounts that are currently blocked and the sessions that are blocking them. The table below describes the information available on the Blocking Locks tab of the Locks view for Oracle:
TIP: To configure the grid to show/hide row numbers, use the Options Editor.
MetricsWhen a blocking lock is discovered, the DBA can quickly remedy the situation by issuing a KILL against the offending process. This eliminates the user’s stranglehold on the objects the user was accessing. Other user processes then usually complete in an instant. Tools like Embarcadero Performance Center make it easier to discover the blocking-lock situation.
The culprit of blocking-lock scenarios is often the application design, or the SQL used within the application itself. Properly coding an application to reference database objects in an efficient order, and then using the right SQL to get the job done, is an art. Most DBAs who have had to face Oracle Forms applications have suffered through the dreaded SELECT…FOR UPDATE statements that place unnecessary restrictive locks on nearly every read operation. The key to avoiding lock contention is to process user transactions in the quickest and most efficient manner possible - something not always easy to do.
Data warehouses, whose data is mostly read, can benefit from tablespaces set in read-only mode. Read-only mode signals to the other databases that exclusive locks need not be used for the data contained within the tablespace. This is especially helpful in Oracle Parallel Server environments and drastically reduces ping activity.
Blocking Locks Tab for SQL Server• Metrics
Embarcadero Performance Center displays information about all blocking locks currently on a system on the Blocking Locks tab of the Locks view and the Blocking Lock Detail grid on the Blocking Lock tab of the Contention Detail view.
Column Description
Blocked SID The session ID of the session waiting for the lock.
Blocked User The user account of the session waiting for the lock.
Wait Time (sec) The current wait time for the session, in seconds.
Blocking SID The session ID of the session holding the offending lock.
Blocking User The user account of the session holding the offending lock.
Lock Type The type of lock (TRANSACTION, DML, etc.)
Lock Mode The lock mode (EXCLUSIVE, SHARE, etc.)
Request Type The type of lock being requested by the session.
Locked Object The name of the object being locked.
EMBARCADERO TECHNOLOGIES > EMBARCADERO PERFORMANCE CENTER 2.5 EXPERT GUIDE: SYBASE 100

OTHER VIEWS AND STATISTICS > LOCK VIEW
The table below describes the information available on the tab and the grid:
NOTE: The information in the Blocking Lock Detail grid is available in the Blocking Lock Detail grid on the Blocking Locks tab of the Contention view and the Blocking Locks tab of the Locks view.
TIP: To configure the grid to show/hide row numbers, use the Options Editor.
MetricsWhen a blocking lock is discovered, the DBA can quickly remedy the situation by issuing a KILL against the offending process. This eliminates the user’s stranglehold on the objects the user was accessing. Other user processes then usually complete in an instant. Tools like Embarcadero Performance Center make it easier to discover the blocking-lock situation.
Blocking Locks Tab for Sybase• Metrics
Column Description
SPID The process ID of the process holding the lock.
Login The login name of the process.
NT User The operating system name of the process.
Database The database where the locks are occurring.
Table Name The name of the table involved in a lock. This will be NULL for non-table locks or table locks that take place in the tempdb database.
Ndx ID The index ID involved in the lock.
Lock Type The type of lock (database, table, row ID, etc.).
Lock Mode The mode of the lock (shared, exclusive, etc.).
Lock Status The status of the lock (waiting or granted).
Owner Type Whether the lock came from a regular session or a transaction.
Program The executable the process is using against the server.
BLK SPID If nonzero, the process ID of the process blocking the requested lock. A value of zero indicates that the process is not blocked.
Wait Time The time the process has waited for the lock, in milliseconds.
Status Indicates if the process is actively performing work, is idle, blocked by another process, etc.
Command The command the process is currently issuing.
NT Domain The name of the Windows 2000/NT domain.
EMBARCADERO TECHNOLOGIES > EMBARCADERO PERFORMANCE CENTER 2.5 EXPERT GUIDE: SYBASE 101

OTHER VIEWS AND STATISTICS > LOCK VIEW
The Blocking Locks tab of the Locks view contains information relating to user accounts that are currently blocked and the sessions that are blocking them. The table below describes the information available on the Blocking Locks tab of the Locks view for Sybase:
TIP: To configure the grid to show/hide row numbers, use the Options Editor.
MetricsWhen a blocking lock is discovered, the DBA can quickly remedy the situation by issuing a KILL against the offending process. This eliminates the user’s stranglehold on the objects the user was accessing. Other user processes then usually complete in an instant. Tools like Embarcadero Performance Center make it easier to discover the blocking-lock situation.
Locks View for DB2The Locks view displays all processes that are currently holding locks on an IBM DB2 UDB database. The following sections of this view are available to display lock information:
• Applications
Column Description
Holding PID The process ID that owns the blocking lock.
Holding User The user account of the session holding the offending lock.
Waiting PID The session PID of the session waiting for the lock.
Waiting User The user account of the session waiting for the lock.
Database The database in which the process is running.
Object Name The table on which the lock is being held.
Status Indicates if the process is actively performing work, is idle, blocked by another process, etc.
Lock Type The type of lock being applied.
Time Blocked The time that a process has been waiting for the lock, in seconds.
Lock Page The page number where the lock is currently applied.
Lock Class The name of the cursor the lock is associated with (if any).
Holding Host The name of the host computer with the blocking lock.
Waiting Host The name of the host computer waiting for the lock.
Holding Program The program the process is running that has the lock.
Waiting Program The program the process is running that is waiting for the lock.
Holding Command The command being issued by the process holding the lock.
Waiting Command The command being issued by the process waiting for the lock.
CPU Time The CPU time accumulated for the current command.
Physical I/O The physical I/O accumulated for the current command.
Mem Usage The memory accumulated for the current command.
Holding FID The process ID of the worker process' parent that has the lock.
Waiting FID The process ID of the worker process' parent that is waiting for the lock.
Transaction The name of the associated transaction (if any).
EMBARCADERO TECHNOLOGIES > EMBARCADERO PERFORMANCE CENTER 2.5 EXPERT GUIDE: SYBASE 102
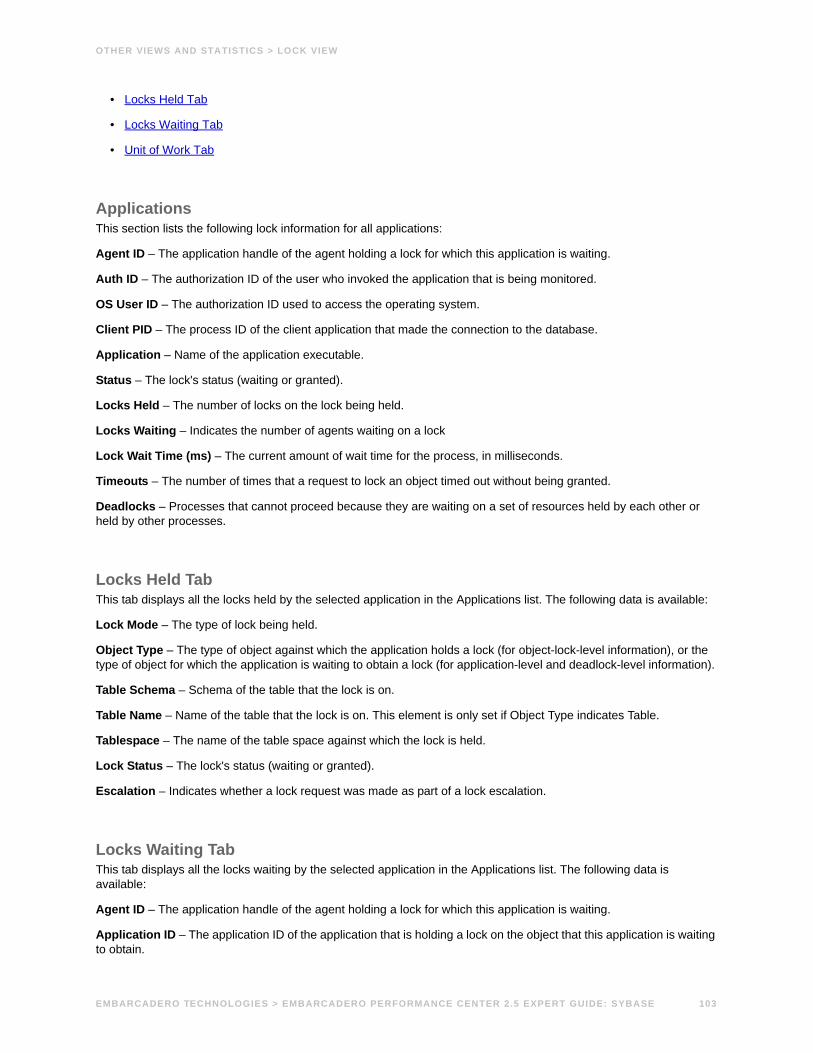
OTHER VIEWS AND STATISTICS > LOCK VIEW
• Locks Held Tab
• Locks Waiting Tab
• Unit of Work Tab
ApplicationsThis section lists the following lock information for all applications:
Agent ID – The application handle of the agent holding a lock for which this application is waiting.
Auth ID – The authorization ID of the user who invoked the application that is being monitored.
OS User ID – The authorization ID used to access the operating system.
Client PID – The process ID of the client application that made the connection to the database.
Application – Name of the application executable.
Status – The lock's status (waiting or granted).
Locks Held – The number of locks on the lock being held.
Locks Waiting – Indicates the number of agents waiting on a lock
Lock Wait Time (ms) – The current amount of wait time for the process, in milliseconds.
Timeouts – The number of times that a request to lock an object timed out without being granted.
Deadlocks – Processes that cannot proceed because they are waiting on a set of resources held by each other or held by other processes.
Locks Held TabThis tab displays all the locks held by the selected application in the Applications list. The following data is available:
Lock Mode – The type of lock being held.
Object Type – The type of object against which the application holds a lock (for object-lock-level information), or the type of object for which the application is waiting to obtain a lock (for application-level and deadlock-level information).
Table Schema – Schema of the table that the lock is on.
Table Name – Name of the table that the lock is on. This element is only set if Object Type indicates Table.
Tablespace – The name of the table space against which the lock is held.
Lock Status – The lock's status (waiting or granted).
Escalation – Indicates whether a lock request was made as part of a lock escalation.
Locks Waiting TabThis tab displays all the locks waiting by the selected application in the Applications list. The following data is available:
Agent ID – The application handle of the agent holding a lock for which this application is waiting.
Application ID – The application ID of the application that is holding a lock on the object that this application is waiting to obtain.
EMBARCADERO TECHNOLOGIES > EMBARCADERO PERFORMANCE CENTER 2.5 EXPERT GUIDE: SYBASE 103
OTHER VIEWS AND STATISTICS > OPERATING SYSTEM VIEW
Lock Mode – The type of lock being held.
Mode Requested – The lock mode being requested by the application.
Object Type – The type of object against which the application holds a lock.
Table Schema – Schema of the table that the lock is on.
Table Name – Name of the table that the lock is on. This element is only set if Object Type indicates Table.
Tablespace – The name of the table space against which the lock is held.
Wait Start Time – The date and time that this application started waiting to obtain a lock on the object that is currently locked by another application
Escalation – Indicates whether a lock request was made as part of a lock escalation.
Unit of Work TabThis tab displays the SQL statement text for the selected application. The statement is available if the selected application is in lock wait status or is the thread blocking other applications. This enables you to easily identify what SQL statements are causing lock wait conditions and to help diagnose deadlock scenarios.
Click Explain SQL to view an explain plan for the statement.
Operating System ViewThe Operating System view displays vital operating system statistics on the following tabbed pages:
• Summary
• CPU
• Processes
• I/O
• Memory
• Space
• Network
EMBARCADERO TECHNOLOGIES > EMBARCADERO PERFORMANCE CENTER 2.5 EXPERT GUIDE: SYBASE 104
OTHER VIEWS AND STATISTICS > OS PAGE STATISTICS
To use integrated security, or gather certain operating system statistics, there are two main things to know:
1 You must enable the Embarcadero Performance Center Server for operating system monitoring. To enable it, you must select the Enable operating system monitoring check box on the Machine tab of the Datasource Properties dialog box.
2 You must supply the credentials necessary to view these statistics. To be able to view performance counters on a remote computer, Microsoft requires specific permissions on the remote computer that you want to monitor.
Because the Embarcadero Performance Center Server collects data using the registry, monitoring a remote computer requires the use of the Remote Registry Service. If the service stops due to failure, the system restarts it automatically only once. Therefore, if the service stops again, you must manually restart it. You can change this default behavior by modifying the properties for Remote Registry Service. To access service properties, see Services under Services and Applications in Computer Management or see Administrative Tools. You can also check the Event Viewer’s Application and System Logs for events that might have stopped the service.
Remote data collection also requires access to specific registry subkeys and system files. To provide remote access to the registry to collect data on remote systems, Microsoft requires that users have a minimum of Read access to the Winreg subkey in HKEY_LOCAL_MACHINE\SYSTEM\CurrentControlSet\Control\SecurePipeServers. By default, members of the Administrators group have Full Control access and members of the Backup Operators group have Read access. Microsoft also requires that users have Read access to the registry subkey that stores counter names and descriptions used by System Monitor, HKEY_LOCAL_MACHINE\SOFTWARE\Microsoft\Windows NT\CurrentVersion\Perflib\LanguageID, where LanguageID is the numeric code for the spoken language for the operating system installation. (For English, the subkey is Perflib\009.) By default, Microsoft gives Full Control access to the System account and members of the Administrators and Creator Owners groups. Therefore, a local user on a server who is not logged in as an administrator cannot see performance counters.
In addition, users might also require read access to the files that supply counter names and descriptions to the registry, Perfc*.dat and Perfh*.dat. (where the asterisk is a wildcard character representing the specific language code; for English, these are Perfc009.dat and Perfh009.dat.) If these files reside on an NTFS volume, to have access to them, the access control lists (ACLs) on these files must specify that the user has such access. By default, members of the Administrators and Interactive groups have sufficient access.
OS Page StatisticsIn many scenarios, an optimally tuned database may not perform well because there are constraints imposed by the system where the database is running. These constraints may include processes competing with the database sever for resources (CPU, I/O, or Memory), a slow CPU, insufficient or slow I/O devices, and insufficient memory. The OS Statistics page of Performance Center lets you examine operating system metrics for the following platforms:
• AIX
• HP-UX
NOTE: To view processor info and swap disk info on an HP-UX box, you need to login as ROOT in the OS login.
• Linux
• Solaris
• Unix
• Windows XP, 2000, and NT
EMBARCADERO TECHNOLOGIES > EMBARCADERO PERFORMANCE CENTER 2.5 EXPERT GUIDE: SYBASE 105

OTHER VIEWS AND STATISTICS > OS PAGE STATISTICS
Summary TabThe OS Summary tab displays the following statistics to communicate the general overall performance levels of the operating system:
• Disk Time
• Load Average
• Processor Time
• Paged Memory Used (Windows)
• Swap Memory Used (AIX, HP-UX, Linux, Solaris, Unix)
• Average Disk Queue
• Network Output Queue (Windows)
• Network Queue (Solaris)
• Page Faults/Sec
• Processor Queue
• Processor Speed
• Processor
• Available Paged Memory (Windows)
• Available Physical Memory
• Available Swap Memory (AIX, HP-UX, Linux, Solaris, Unix)
• Total Paged Memory (Windows)
• Total Physical Memory
• Total Swap Memory (AIX, HP-UX, Linux, Solaris, Unix)
• Free Disk Space
• Total Disk Space
• Used Disk Space
• Number of Logins
• Number of Processes
• Number of Processors
• Top CPU Process
• Top I/O Process
• Top Memory Process
Processor TimeThe Processor Time statistic indicates the percentage of time the processor is working. This counter is a primary indicator of processor activity.
EMBARCADERO TECHNOLOGIES > EMBARCADERO PERFORMANCE CENTER 2.5 EXPERT GUIDE: SYBASE 106

OTHER VIEWS AND STATISTICS > OS PAGE STATISTICS
MetricsIf your computer seems to be running sluggishly, this statistic could be displaying a high percentage.
TroubleshootingUpgrade to a processor with a larger L2 cache, a faster processor, or install an additional processor.
Processor SpeedThe Processor Speed statistic displays the speed of the active processor in MHz. The speed is approximate.
ProcessorThe Processor Statistic displays the type of processor currently in use, for example, GenuineIntel.
Disk TimeThe Disk Time statistic is the percentage of elapsed time that the selected disk drive/device was busy servicing read or write requests.
MetricsYou should avoid consistently seeing values for this statistic greater then 90%.
TroubleshootingAdd more disk drives and partition the files among all of the drives.
Load AverageThe Load Average statistic represents the system load averages over the last 1, 5, and 15 minutes.
MetricsHigh load averages usually mean that the system is being used heavily and the response time is correspondingly slow.
Paged Memory UsedThe Paged Memory Used statistic is the ratio of Commit Memory Bytes to the Commit Limit. Committed memory is where memory space has been reserved in the paging file if it needs to be written to disk. The commit limit is determined by the size of the paging file. As the paging file increases, so does the commit limit.
NOTE: This statistic is available for the Windows platform.
MetricsThis value displays the current percentage value only and not an average. If the percentage of paged memory used is above 90%, you may be running out of memory.
EMBARCADERO TECHNOLOGIES > EMBARCADERO PERFORMANCE CENTER 2.5 EXPERT GUIDE: SYBASE 107
OTHER VIEWS AND STATISTICS > OS PAGE STATISTICS
TroubleshootingIncrease the size of page file.
Number of ProcessorsThis statistic displays the number of processors currently in use.
Swap Memory UsedThe Swap Memory Used statistic is the percentage of swap space currently in use.
MetricsIf the percentage of swap memory used is above 90%, you may be running out of memory.
TroubleshootingIncrease the size of your swap files.
Average Disk QueueThe Average Disk Queue statistic is the average number of both read and write requests that were queued for the selected disk during the sample interval.
MetricsThis metric is useful in identifying I/O related bottlenecks. If the disk queue lengths for certain disks are consistently much higher than others, you may need to redistribute the load among available disks. If the disk queues lengths for all disks are consistently large, and you see a high amount of I/O activity, your disks may be inefficient.
TroubleshootingSome things you can do if you have problems with this statistic include:
• Redistribute the data on the disk with the large average disk queue to other disks.
• Upgrade to faster disk(s).
Page Faults/SecThe Page Faults/Sec statistic is the overall rate faulted pages are handled by the processor. It is measured in numbers of pages faulted per second. A page fault occurs when a process requires code or data that is not in its working set. This counter includes both hard faults and soft faults.
MetricsThis counter displays the difference between the values observed in the last two samples, divided by the duration of the sample interval.
EMBARCADERO TECHNOLOGIES > EMBARCADERO PERFORMANCE CENTER 2.5 EXPERT GUIDE: SYBASE 108
OTHER VIEWS AND STATISTICS > OS PAGE STATISTICS
TroubleshootingIf the number of page faults remains consistently high, you can check with your Windows System Administrator for further investigation. Often, large numbers of page faults are not a problem so long as they are soft faults. However, hard faults, that require disk access, can cause delays.
Processor Queue The Processor Queue Length statistic is the number of threads in the processor queue.
MetricsUnlike the disk counters, this counter shows ready threads only, not threads that are running. There is a single queue for processor time even on computers with multiple processors. Therefore, if a computer has multiple processors, you need to divide this value by the number of processors servicing the workload. A sustained processor queue of less than 10 threads per processor is normally acceptable, dependent of the workload.
TroubleshootingA sustained high value in the Processor Queue could indicate that a processor bottleneck has developed due to threads of a process requiring more process cycles than are available. If this is the case, you should look at installing a faster (or an additional) processor.
Network Output Queue/Network QueueThe Network Output Queue Length statistic is the number of threads in the processor queue.
NOTE: The name of this statistic depends on the platform of the operating system.
MetricsUnlike the disk counters, this counter shows ready threads only, not threads that are running. There is a single queue for processor time even on computers with multiple processors. Therefore, if a computer has multiple processors, you need to divide this value by the number of processors servicing the workload. A sustained processor queue of less than 10 threads per processor is normally acceptable, dependent of the workload.
TroubleshootingA sustained high value in the Processor Queue Length could indicate that a processor bottleneck has developed due to threads of a process requiring more process cycles than are available. If this is the case, you should look at installing a faster (or an additional) processor.
Available Physical MemoryThe Available Physical Memory statistic represents the amount of RAM available to all processes.
MetricsThis counter displays the last observed value only and not an average. Use this value with the Total physical memory and paging metrics (Memory details page). If the available physical memory is very small compared to this value, and the paging activity is high, your system may be running low on memory.
TroubleshootingSome things you can do if you have problems with this statistic include:
EMBARCADERO TECHNOLOGIES > EMBARCADERO PERFORMANCE CENTER 2.5 EXPERT GUIDE: SYBASE 109

OTHER VIEWS AND STATISTICS > OS PAGE STATISTICS
• Check the running processes to see if there are any memory leaks.
• Stop any services that are not required.
• Install additional RAM.
Available Paged MemoryThe Available Paged Memory statistic shows the amount of virtual memory available for the processes.
NOTE: This statistic is available for the Windows platform.
MetricsIf the available virtual memory is less than 10% of the total virtual memory, your system may run out of memory.
TroubleshootingIncrease the size of page file.
Available Swap MemoryThe Available Swap Memory statistic represents the amount of virtual memory available for the processes.
MetricsIf the available Available Swap Memory is less than 10% of the total Swap Memory, your system may run out of memory.
TroubleshootingIncrease the size of swap files.
Total Physical MemoryThe Total Physical Memory statistic shows the amount of physical memory installed on your computer.
MetricsThis is an informational metric and displays the total amount installed on the machine. Use this value with the available physical memory and paging metrics (Memory details page). If the available physical memory is very small compared to this value, and the paging activity is high, your system may be running low on memory.
Total Paged Memory/Total Swap MemoryThe Total Paged Memory statistic shows the maximum amount of virtual memory available to all processes.
NOTE: The name of this statistic depends on the platform of the operating system.
MetricsIt is recommended that this value is between 1.5 to 3 times the amount of RAM on the system.
EMBARCADERO TECHNOLOGIES > EMBARCADERO PERFORMANCE CENTER 2.5 EXPERT GUIDE: SYBASE 110

OTHER VIEWS AND STATISTICS > OS PAGE STATISTICS
Used Disk SpaceThe Used Disk Space statistic shows the amount of allocated space, in megabytes on all logical disk drives.
TroubleshootingThere are many things a DBA can do to ensure that a database does not encounter a space problem due to physical space limitations:
• If a database currently resides on a disk that has little free space, you can add more files to the database. Of course, you should add the new files to other physical hard disks that can accommodate a growing database.
• You should examine hard disks with shrinking disk space to see if you can relocate or delete files to allow more free space.
Total Disk SpaceTotal Disk Space displays the total allocated and unallocated space, in megabytes on all logical disk drives.
TroubleshootingThere are many things a DBA can do to ensure that a database does not encounter a space problem due to physical space limitations, here are two:
1 If a database currently resides on a disk that has little free space, you can add more files to the database. Of course, you should add the new files to other physical hard disks that can accommodate a growing database.
2 You should examine hard disks with shrinking disk space to see if you can relocate or delete files to allow more free space.
Free Disk SpaceThe Free Disk Space statistic shows the unallocated space, in megabytes on all logical disk drives.
TroubleshootingThere are many things a DBA can do to ensure that a database does not encounter a space problem due to physical space limitations:
• If a database currently resides on a disk that has little free space, you can add more files to the database. Of course, you should add the new files to other physical hard disks that can accommodate a growing database.
• You should examine hard disks with shrinking disk space to see if you can relocate or delete files to allow more free space.
Top Memory ProcessTop Memory Process shows the current process that is consuming the most amount of memory. The information displayed is dependent on the platform of the operating system. Information displayed includes the name of the process, process ID, amount of memory consumed expressed in KB, amount of CPU expressed as a percentage, the amount of Major Page Faults, and the amount of I/O expressed in KB/sec.
MetricsIf you are running out of memory on the system, this is a quick way to identify the top memory user. If the displayed process is using a significant portion of the total memory, it could be causing the memory issues.
EMBARCADERO TECHNOLOGIES > EMBARCADERO PERFORMANCE CENTER 2.5 EXPERT GUIDE: SYBASE 111

OTHER VIEWS AND STATISTICS > OS PAGE STATISTICS
Processes OverviewThe Processes Overview of the OS Summary includes the following sections:
• Top CPU Process
• Top I/O Process
• Top Memory Process
Top CPU ProcessTop CPU Process shows the current process that is consuming the most amount of CPU. The information displayed is dependent on the platform of the operating system. Information displayed includes the name of the process, process ID, amount of memory consumed expressed in KB, amount of CPU expressed as a percentage, the amount of Major Page Faults, and the amount of I/O expressed in KB/sec.
MetricsIf the amount of CPU time used by this process is close to 100% and the CPU usage is very high, this process may be the bottleneck on the server.
TroubleshootingInvestigate the process further to see if it is in an inconsistent state. Also, look at minimum requirements for CPU speed for the process. You may need to upgrade your CPU.
Top I/O ProcessThe Top I/O Process statistic shows the current process that is consuming the most amount of CPU. The information displayed is dependent on the platform of the operating system. Information displayed includes the name of the process, process ID, amount of memory consumed expressed in KB, amount of CPU expressed as a percentage, the amount of Major Page Faults, and the amount of I/O expressed in KB/sec.
Number of LoginsThis statistic displays the total number of logins on the server.
Number of ProcessesThis statistic displays the total number of processes on the server.
CPU TabThe CPU tab of the OS Detail includes the following sections:
• Context Switches/Sec
• CPU Utilization
• Interrupts/Sec
• Processor Queue Length
EMBARCADERO TECHNOLOGIES > EMBARCADERO PERFORMANCE CENTER 2.5 EXPERT GUIDE: SYBASE 112

OTHER VIEWS AND STATISTICS > OS PAGE STATISTICS
CPU UtilizationThe CPU Utilization section includes the following information:
• % Privileged Time
• % User Time
% Privileged TimeThe % Privileged Time statistic is the percentage of elapsed time that the process threads spent executing code in privileged mode.
NOTE: For Windows systems, when a Windows system service is called, the service will often run in privileged mode to gain access to system-private data. Such data is protected from access by threads executing in user mode. Calls to the system can be explicit or implicit, such as page faults or interrupts. These kernel commands, are considered privileged to keep the low-level commands executing and prevent a system freeze. Unlike some early operating systems, Windows uses process boundaries for subsystem protection in addition to the traditional protection of user and privileged modes. Some work done by Windows on behalf of the application might appear in other subsystem processes in addition to the privileged time in the process.
MetricsThe ideal range should be 0-40% (less than 40% indicates excessive system activity).
TroubleshootingIf your CPU consistently runs at less than 40% you may need to upgrade your system to include a faster processor(s).
% User TimeThe % User Time statistic is the percentage of elapsed time the processor spends in the user mode. User mode is a restricted processing mode designed for applications, environment subsystems, and integral subsystems. The alternative, privileged mode, is designed for operating system components and allows direct access to hardware and all memory. The operating system switches application threads to privileged mode to access operating system services. This counter displays the average busy time as a percentage of the sample time.
MetricsIf the Privileged Time is high in conjunction with Physical Disk Reads, consider upgrading the disk I/O subsystem.
Interrupts/SecThe Interrupts/Sec statistic is the average rate, in incidents per second, at which the processor received and serviced hardware interrupts. It does not include deferred procedure calls (DPCs), which are counted separately. This value is an indirect indicator of the activity of devices that generate interrupts, such as the system clock, the mouse, disk drivers, data communication lines, network interface cards, and other peripheral devices. These devices normally interrupt the processor when they have completed a task or require attention. Normal thread execution is suspended. The system clock typically interrupts the processor every ten milliseconds, creating a background of interrupt activity. This counter displays the difference between the values observed in the last two samples, divided by the duration of the sample interval.
MetricsThe ideal rage should be 0-5000. A number greater then 5000 indicates possible excessive hardware interrupts; justification is dependent on device activity.
EMBARCADERO TECHNOLOGIES > EMBARCADERO PERFORMANCE CENTER 2.5 EXPERT GUIDE: SYBASE 113

OTHER VIEWS AND STATISTICS > OS PAGE STATISTICS
Context Switches/SecThe Context Switches/Sec section shows the combined rate at which all processors on the computer are switched from one thread to another. Context switches occur when a running thread voluntarily relinquishes the processor, is preempted by a higher priority ready thread, or switches between user-mode and privileged (kernel) mode to use an Executive or subsystem service.
MetricsThe ideal range should be between 0-10,000. GA number greater then 10,000 may indicate too many threads contending for resources.
Processor Queue LengthThe Processor Queue Length statistic is the number of threads in the processor queue. There is a single queue for processor time even on computers with multiple processors.
NOTE: For Windows systems, unlike the disk counters, this counter shows ready threads only, not threads that are running.
MetricsA sustained high value in the Processor Queue Length could indicate that a processor bottleneck has developed due to threads of a process requiring more process cycles than are available. If this is the case, you should look at installing a faster (or an additional) processor.
Processes TabThe Processes tab of the OS Detail page succinctly communicates the general overall performance levels of processes. The columns available in this table depend on the platform of operating system. The table below describes the information available in the table on this tab:
Column Description
Process The name of the process.
User The user of the process.
ID The ID Process is the unique identifier of this process. ID Process numbers are reused, so they only identify a process for the lifetime of that process.
CPU The CPU is the percentage of elapsed time that all of process threads used the processor to execution instructions.
User Mode The User Mode is the percentage of elapsed time that the process threads spent executing code in user mode.
Memory WINDOWS ONLY
Memory is the current size, in bytes, of the virtual address space the process is using. Use of virtual address space does not necessarily imply corresponding use of either disk or main memory pages. Virtual space is finite, and the process can limit its ability to load libraries.
Memory (MB) Memory is the current size, in bytes, of the virtual address space the process is using. Use of virtual address space does not necessarily imply corresponding use of either disk or main memory pages. Virtual space is finite, and the process can limit its ability to load libraries.
Memory Memory is the percentage of the memory used of the total memory.
Active Memory Active Memory is the amount of committed virtual memory, in bytes for this process. Active memory is the physical memory which has space reserved on the disk paging file(s). There can be one or more paging files on each physical drive. This counter displays the last observed value only; it is not an average.
EMBARCADERO TECHNOLOGIES > EMBARCADERO PERFORMANCE CENTER 2.5 EXPERT GUIDE: SYBASE 114
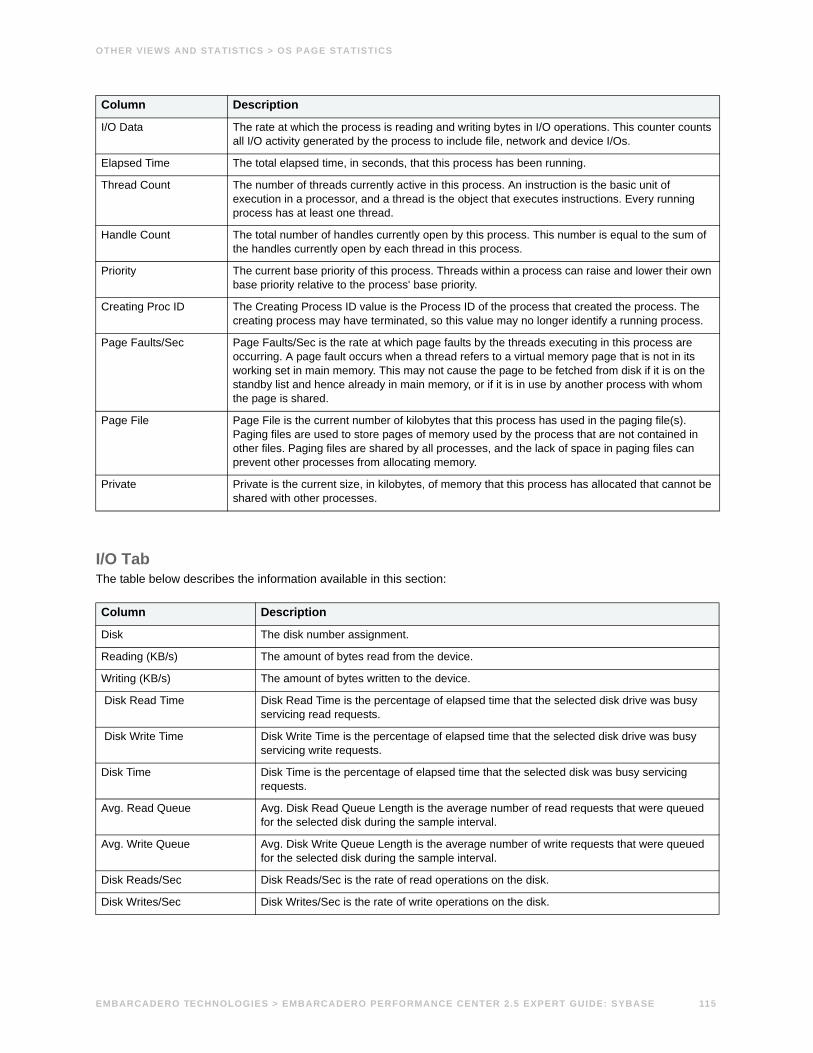
OTHER VIEWS AND STATISTICS > OS PAGE STATISTICS
I/O TabThe table below describes the information available in this section:
I/O Data The rate at which the process is reading and writing bytes in I/O operations. This counter counts all I/O activity generated by the process to include file, network and device I/Os.
Elapsed Time The total elapsed time, in seconds, that this process has been running.
Thread Count The number of threads currently active in this process. An instruction is the basic unit of execution in a processor, and a thread is the object that executes instructions. Every running process has at least one thread.
Handle Count The total number of handles currently open by this process. This number is equal to the sum of the handles currently open by each thread in this process.
Priority The current base priority of this process. Threads within a process can raise and lower their own base priority relative to the process' base priority.
Creating Proc ID The Creating Process ID value is the Process ID of the process that created the process. The creating process may have terminated, so this value may no longer identify a running process.
Page Faults/Sec Page Faults/Sec is the rate at which page faults by the threads executing in this process are occurring. A page fault occurs when a thread refers to a virtual memory page that is not in its working set in main memory. This may not cause the page to be fetched from disk if it is on the standby list and hence already in main memory, or if it is in use by another process with whom the page is shared.
Page File Page File is the current number of kilobytes that this process has used in the paging file(s). Paging files are used to store pages of memory used by the process that are not contained in other files. Paging files are shared by all processes, and the lack of space in paging files can prevent other processes from allocating memory.
Private Private is the current size, in kilobytes, of memory that this process has allocated that cannot be shared with other processes.
Column Description
Disk The disk number assignment.
Reading (KB/s) The amount of bytes read from the device.
Writing (KB/s) The amount of bytes written to the device.
Disk Read Time Disk Read Time is the percentage of elapsed time that the selected disk drive was busy servicing read requests.
Disk Write Time Disk Write Time is the percentage of elapsed time that the selected disk drive was busy servicing write requests.
Disk Time Disk Time is the percentage of elapsed time that the selected disk was busy servicing requests.
Avg. Read Queue Avg. Disk Read Queue Length is the average number of read requests that were queued for the selected disk during the sample interval.
Avg. Write Queue Avg. Disk Write Queue Length is the average number of write requests that were queued for the selected disk during the sample interval.
Disk Reads/Sec Disk Reads/Sec is the rate of read operations on the disk.
Disk Writes/Sec Disk Writes/Sec is the rate of write operations on the disk.
Column Description
EMBARCADERO TECHNOLOGIES > EMBARCADERO PERFORMANCE CENTER 2.5 EXPERT GUIDE: SYBASE 115

OTHER VIEWS AND STATISTICS > OS PAGE STATISTICS
Memory TabThe Memory tab of the OS Detail page includes the following sections:
• Cache Efficiency
• Free Physical
• Free Paged
• Paging Activity
• Page Faults
• Total Physical
• Total Paged
Paging ActivityThe Paging Activity section includes the following statistics:
• Pages Input/Sec
• Pages Output/Sec
Pages Input/SecThe Pages Input/Sec statistic is the number of pages read from disk to resolve hard page faults. Hard page faults occur when a process requires code or data that is not in its working set or elsewhere in physical memory, and must be retrieved from disk.
MetricsThis value was designed as a primary indicator of the kinds of faults that cause system-wide delays. It includes pages retrieved to satisfy faults in the file system cache (usually requested by applications) and in non-cached mapped memory files. This counter counts numbers of pages, and can be compared to other counts of pages, such as Memory: Page Faults/sec, without conversion. This counter displays the difference between the values observed in the last two samples, divided by the duration of the sample interval.
TroubleshootingAlthough it never hurts to have as much physical memory as your system can handle, there are some things you can check within your system to alleviate the memory bottleneck.
• Check to see if you have any drivers or protocols that are running but not being used. They use space in all memory pools even if they are idle.
• Check to see if you have additional space on your disk drive that you could use to expand the size of your page file. Normally, the bigger the initial size of your page file, the better, in performance terms.
Pages Output/SecThe Pages Output/Sec statistic is the number of pages written to disk to free up space in physical memory. Pages are written back to disk only if they are changed in physical memory. A high rate of pages output might indicate a memory shortage.
EMBARCADERO TECHNOLOGIES > EMBARCADERO PERFORMANCE CENTER 2.5 EXPERT GUIDE: SYBASE 116
OTHER VIEWS AND STATISTICS > OS PAGE STATISTICS
MetricsWindows NT writes more pages back to disk to free up space when low in physical memory. This counter counts numbers of pages, and can be compared to other counts of pages, without conversion. This counter displays the difference between the values observed in the last two samples, divided by the duration of the sample interval.
TroubleshootingAlthough it never hurts to have as much physical memory as your system can handle, there are some things you can check within your system to alleviate the memory bottleneck.
• Check to see if you have any drivers or protocols that are running but not being used. They use space in all memory pools even if they are idle.
• Check to see if you have additional space on your disk drive that you could use to expand the size of your page file. Normally, the bigger the initial size of your page file, the better, in performance terms.
Free PhysicalThe Free Physical statistic is the amount of physical memory that is uncommitted.
MetricsNone.
Free PagedThe Free Paged statistic is the amount of uncommitted virtual memory.
MetricsNone.
Total PhysicalThe Total Physical statistic is the total physical memory available.
MetricsNone.
Total PagedThe Total Paged statistic is the amount of total virtual memory, in bytes. Used Memory is the physical memory that has space reserved on the disk paging file(s). There can be one or more paging files on each physical drive.
MetricsNone.
Page Faults/SecThe Page Faults/Sec statistic is the overall rate faulted pages are handled by the processor. It is measured in numbers of pages faulted per second. A page fault occurs when a process requires code or data that is not in its working set. This counter includes both hard faults and soft faults.
EMBARCADERO TECHNOLOGIES > EMBARCADERO PERFORMANCE CENTER 2.5 EXPERT GUIDE: SYBASE 117

OTHER VIEWS AND STATISTICS > OS PAGE STATISTICS
MetricsThis counter displays the difference between the values observed in the last two samples, divided by the duration of the sample interval.
TroubleshootingIf the number of page faults remains consistently high, you can check with your Windows System Administrator for further investigation. Often, large numbers of page faults are not a problem so long as they are soft faults. However, hard faults, that require disk access, can cause delays.
Cache EfficiencyThe Cache Efficiency section of the Memory tab succinctly communicates the general overall performance levels of the server's memory. The following statistics are available in this section:
• Copy Read Hits%
• Data Map Hits%
• MDL Read Hits%
• Pin Read Hits%
Copy Read Hits %The Copy Read Hits % statistic is the percentage of cache copy read requests that hit the cache and does not require a disk read to provide access to the page in the cache.
MetricsWhen the page is pinned in the memory, the page's physical address in the file system cache will not be altered. A copy read is a file read operation where a page in the cache is copied to the application's buffer. Because this value reflects hits, it ideally should be close to 100%. An amount below 100% indicates misses.
TroubleshootingAdding physical memory to a server results in a larger file system cache, which is generally more efficient. Defragmenting disks also helps, putting related pages in the cache together and thereby improving the cache hit rate
Data Map Hits %The Data Map Hits % statistic is the percentage of data maps in the file system cache that could be resolved without having to retrieve a page from the disk.
MetricsBecause this value reflects hits, it ideally should be close to 100%. An amount below 100% indicates misses.
TroubleshootingAdding physical memory to a server results in a larger file system cache, which is generally more efficient. Defragmenting disks also helps, putting related pages in the cache together and thereby improving the cache hit rate.
MDL Read Hits %The MDL Read Hits % statistic is the percentage of Memory Descriptor List Read requests to the file system cache that hit the cache and does not require disk access to provide memory access to the pages in the cache.
EMBARCADERO TECHNOLOGIES > EMBARCADERO PERFORMANCE CENTER 2.5 EXPERT GUIDE: SYBASE 118
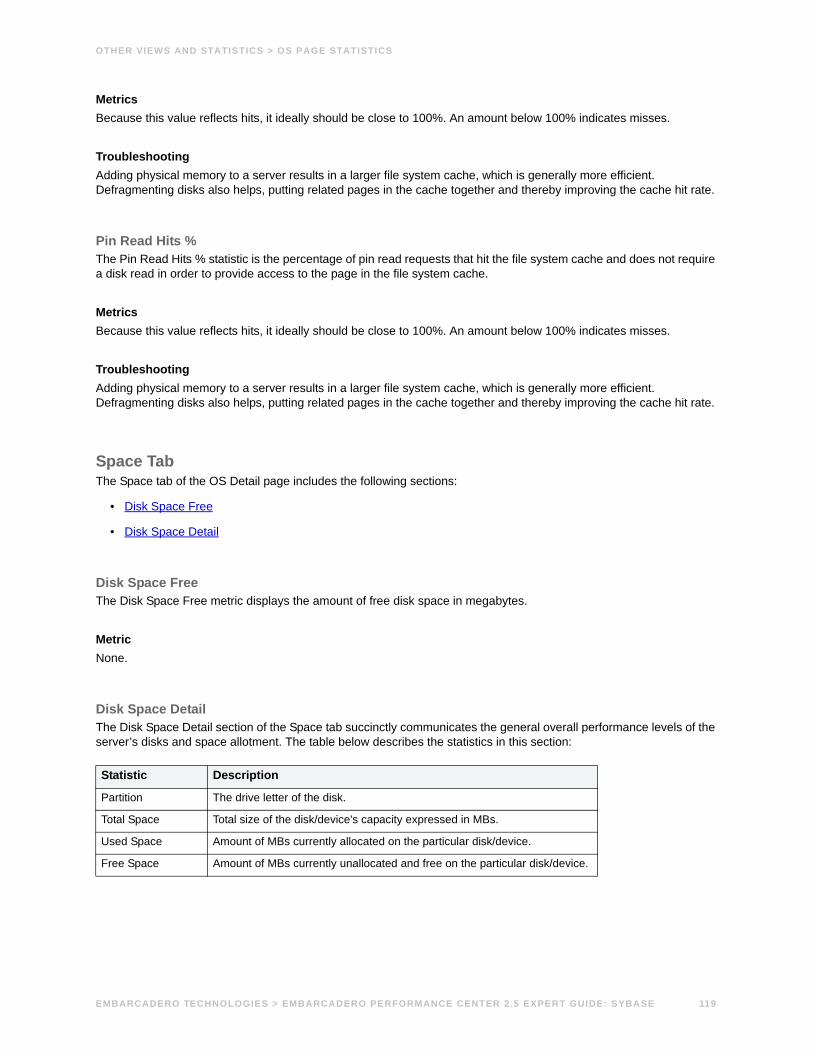
OTHER VIEWS AND STATISTICS > OS PAGE STATISTICS
MetricsBecause this value reflects hits, it ideally should be close to 100%. An amount below 100% indicates misses.
TroubleshootingAdding physical memory to a server results in a larger file system cache, which is generally more efficient. Defragmenting disks also helps, putting related pages in the cache together and thereby improving the cache hit rate.
Pin Read Hits %The Pin Read Hits % statistic is the percentage of pin read requests that hit the file system cache and does not require a disk read in order to provide access to the page in the file system cache.
MetricsBecause this value reflects hits, it ideally should be close to 100%. An amount below 100% indicates misses.
TroubleshootingAdding physical memory to a server results in a larger file system cache, which is generally more efficient. Defragmenting disks also helps, putting related pages in the cache together and thereby improving the cache hit rate.
Space TabThe Space tab of the OS Detail page includes the following sections:
• Disk Space Free
• Disk Space Detail
Disk Space FreeThe Disk Space Free metric displays the amount of free disk space in megabytes.
MetricNone.
Disk Space Detail The Disk Space Detail section of the Space tab succinctly communicates the general overall performance levels of the server’s disks and space allotment. The table below describes the statistics in this section:
Statistic Description
Partition The drive letter of the disk.
Total Space Total size of the disk/device's capacity expressed in MBs.
Used Space Amount of MBs currently allocated on the particular disk/device.
Free Space Amount of MBs currently unallocated and free on the particular disk/device.
EMBARCADERO TECHNOLOGIES > EMBARCADERO PERFORMANCE CENTER 2.5 EXPERT GUIDE: SYBASE 119
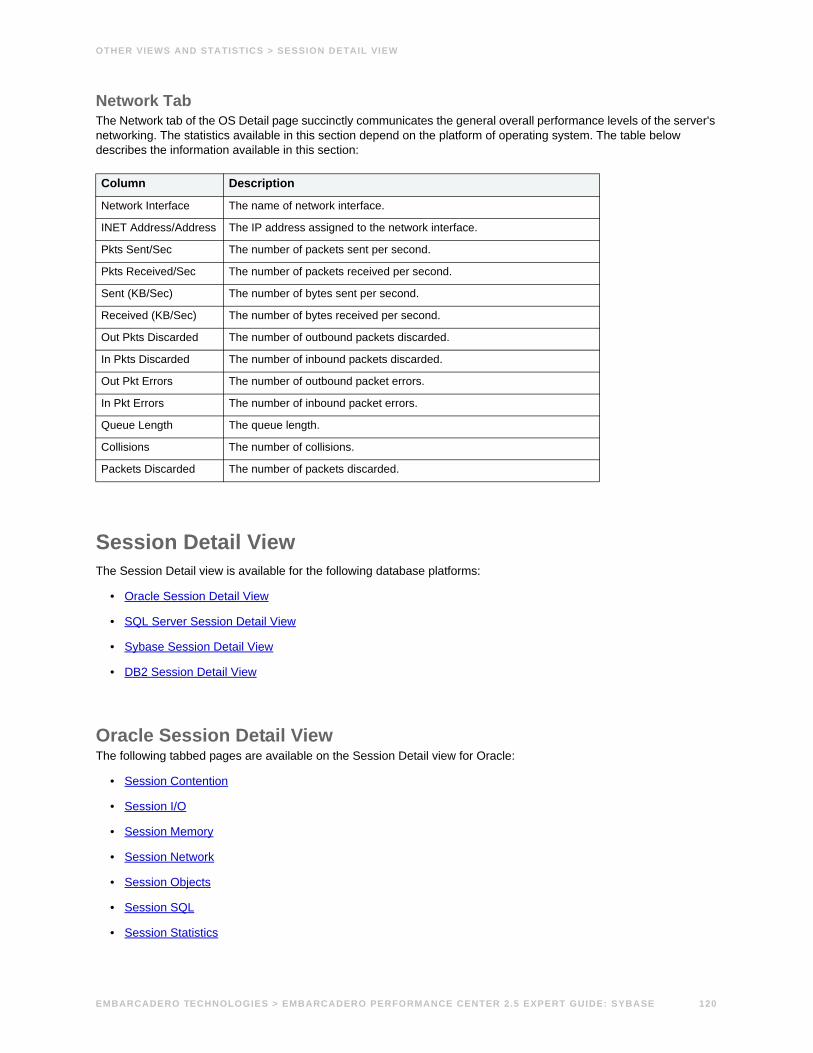
OTHER VIEWS AND STATISTICS > SESSION DETAIL VIEW
Network TabThe Network tab of the OS Detail page succinctly communicates the general overall performance levels of the server's networking. The statistics available in this section depend on the platform of operating system. The table below describes the information available in this section:
Session Detail View The Session Detail view is available for the following database platforms:
• Oracle Session Detail View
• SQL Server Session Detail View
• Sybase Session Detail View
• DB2 Session Detail View
Oracle Session Detail ViewThe following tabbed pages are available on the Session Detail view for Oracle:
• Session Contention
• Session I/O
• Session Memory
• Session Network
• Session Objects
• Session SQL
• Session Statistics
Column Description
Network Interface The name of network interface.
INET Address/Address The IP address assigned to the network interface.
Pkts Sent/Sec The number of packets sent per second.
Pkts Received/Sec The number of packets received per second.
Sent (KB/Sec) The number of bytes sent per second.
Received (KB/Sec) The number of bytes received per second.
Out Pkts Discarded The number of outbound packets discarded.
In Pkts Discarded The number of inbound packets discarded.
Out Pkt Errors The number of outbound packet errors.
In Pkt Errors The number of inbound packet errors.
Queue Length The queue length.
Collisions The number of collisions.
Packets Discarded The number of packets discarded.
EMBARCADERO TECHNOLOGIES > EMBARCADERO PERFORMANCE CENTER 2.5 EXPERT GUIDE: SYBASE 120
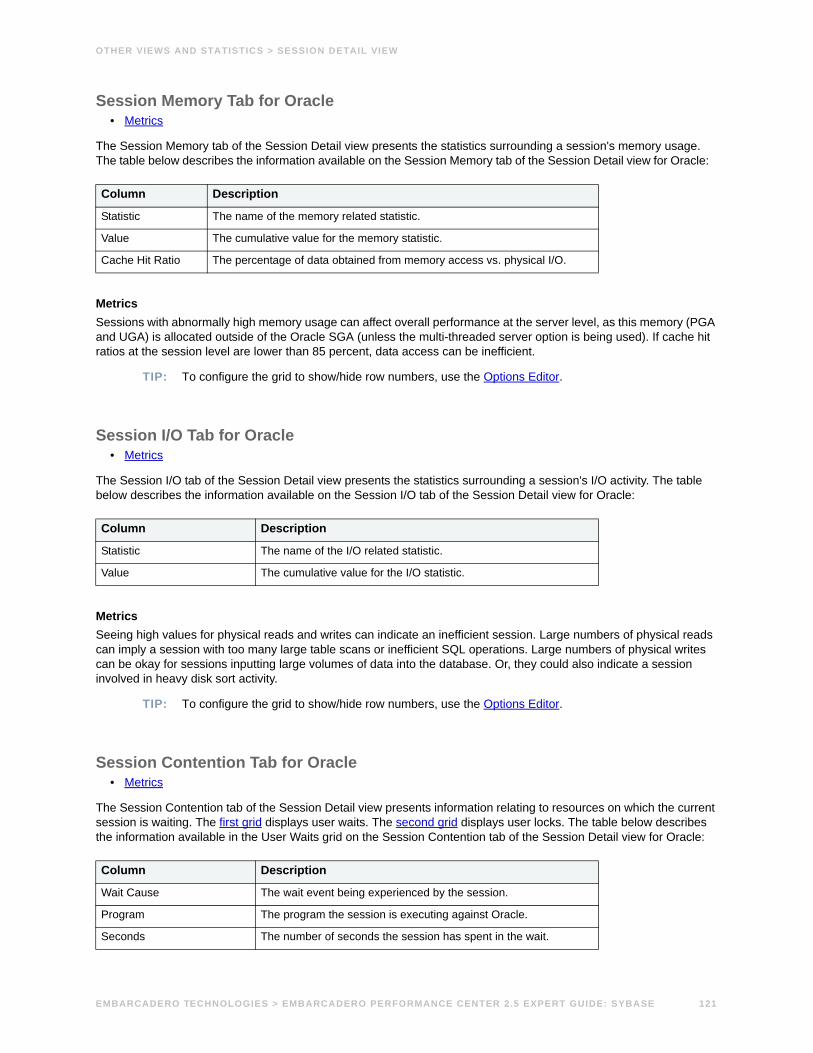
OTHER VIEWS AND STATISTICS > SESSION DETAIL VIEW
Session Memory Tab for Oracle• Metrics
The Session Memory tab of the Session Detail view presents the statistics surrounding a session's memory usage. The table below describes the information available on the Session Memory tab of the Session Detail view for Oracle:
MetricsSessions with abnormally high memory usage can affect overall performance at the server level, as this memory (PGA and UGA) is allocated outside of the Oracle SGA (unless the multi-threaded server option is being used). If cache hit ratios at the session level are lower than 85 percent, data access can be inefficient.
TIP: To configure the grid to show/hide row numbers, use the Options Editor.
Session I/O Tab for Oracle• Metrics
The Session I/O tab of the Session Detail view presents the statistics surrounding a session's I/O activity. The table below describes the information available on the Session I/O tab of the Session Detail view for Oracle:
MetricsSeeing high values for physical reads and writes can indicate an inefficient session. Large numbers of physical reads can imply a session with too many large table scans or inefficient SQL operations. Large numbers of physical writes can be okay for sessions inputting large volumes of data into the database. Or, they could also indicate a session involved in heavy disk sort activity.
TIP: To configure the grid to show/hide row numbers, use the Options Editor.
Session Contention Tab for Oracle• Metrics
The Session Contention tab of the Session Detail view presents information relating to resources on which the current session is waiting. The first grid displays user waits. The second grid displays user locks. The table below describes the information available in the User Waits grid on the Session Contention tab of the Session Detail view for Oracle:
Column Description
Statistic The name of the memory related statistic.
Value The cumulative value for the memory statistic.
Cache Hit Ratio The percentage of data obtained from memory access vs. physical I/O.
Column Description
Statistic The name of the I/O related statistic.
Value The cumulative value for the I/O statistic.
Column Description
Wait Cause The wait event being experienced by the session.
Program The program the session is executing against Oracle.
Seconds The number of seconds the session has spent in the wait.
EMBARCADERO TECHNOLOGIES > EMBARCADERO PERFORMANCE CENTER 2.5 EXPERT GUIDE: SYBASE 121

OTHER VIEWS AND STATISTICS > SESSION DETAIL VIEW
The table below describes the information available in the User Locks grid on the Session I/O tab of the Session Detail view for Oracle:
MetricsYou can ignore some waits, like the SQL*Net more data from client and SQL*Net message from client. Others, like enqueue waits, can be indicative of a lock contention problem. Waits, like db file scattered reads, can indicate sessions involved in long table scan operations.
Locks that are held for unusually long periods require further investigation. The application logic can be inefficient or the program is not issuing COMMITs frequently enough. The culprit of blocking-lock scenarios is usually the application design, or the SQL used within the application itself. Properly coding an application to reference database objects in an efficient order, and then using the correct SQL to get the job done is an art. Most DBAs who have had to face Oracle Forms applications have suffered through the dreaded SELECT…FOR UPDATE statements. These place unnecessary restrictive locks on nearly every read operation. The key to avoiding lock contention is to process user transactions as quickly and efficiently as possible.
TIP: To configure the grid to show/hide row numbers, use the Options Editor.
Session Objects Tab for Oracle• Metrics
The Session Objects tab of the Session Detail view presents information regarding the objects in use by a session. The table below describes the information available in the Objects Accessed grid on the Session Objects tab of the Session Detail view for Oracle:
The Rollback Segments Accessed grid displays the names of rollback segments currently being used by the session.
State The status of the wait event (WAITING, etc.)
Column Description
User The user account being used by the session.
Terminal The client machine name used by the session.
SID The unique Oracle identifier for the session.
Serial # The serial number for the session.
Table The object locked by the session.
Lock Mode The lock mode used by the session.
Title The lock request issued by the session.
Column Description
Owner The owner of the object.
Type The type of object (TABLE, VIEW, etc.).
Object The name of the object.
Column Description
EMBARCADERO TECHNOLOGIES > EMBARCADERO PERFORMANCE CENTER 2.5 EXPERT GUIDE: SYBASE 122
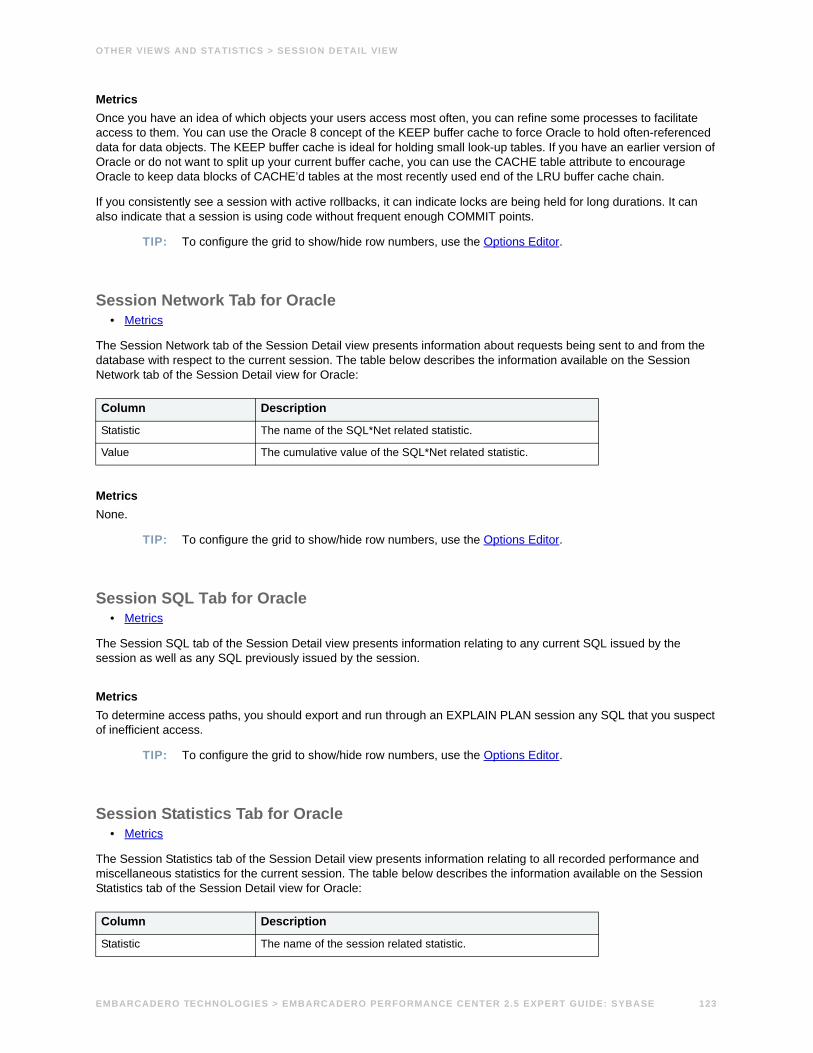
OTHER VIEWS AND STATISTICS > SESSION DETAIL VIEW
Metrics Once you have an idea of which objects your users access most often, you can refine some processes to facilitate access to them. You can use the Oracle 8 concept of the KEEP buffer cache to force Oracle to hold often-referenced data for data objects. The KEEP buffer cache is ideal for holding small look-up tables. If you have an earlier version of Oracle or do not want to split up your current buffer cache, you can use the CACHE table attribute to encourage Oracle to keep data blocks of CACHE’d tables at the most recently used end of the LRU buffer cache chain.
If you consistently see a session with active rollbacks, it can indicate locks are being held for long durations. It can also indicate that a session is using code without frequent enough COMMIT points.
TIP: To configure the grid to show/hide row numbers, use the Options Editor.
Session Network Tab for Oracle• Metrics
The Session Network tab of the Session Detail view presents information about requests being sent to and from the database with respect to the current session. The table below describes the information available on the Session Network tab of the Session Detail view for Oracle:
MetricsNone.
TIP: To configure the grid to show/hide row numbers, use the Options Editor.
Session SQL Tab for Oracle• Metrics
The Session SQL tab of the Session Detail view presents information relating to any current SQL issued by the session as well as any SQL previously issued by the session.
MetricsTo determine access paths, you should export and run through an EXPLAIN PLAN session any SQL that you suspect of inefficient access.
TIP: To configure the grid to show/hide row numbers, use the Options Editor.
Session Statistics Tab for Oracle• Metrics
The Session Statistics tab of the Session Detail view presents information relating to all recorded performance and miscellaneous statistics for the current session. The table below describes the information available on the Session Statistics tab of the Session Detail view for Oracle:
Column Description
Statistic The name of the SQL*Net related statistic.
Value The cumulative value of the SQL*Net related statistic.
Column Description
Statistic The name of the session related statistic.
EMBARCADERO TECHNOLOGIES > EMBARCADERO PERFORMANCE CENTER 2.5 EXPERT GUIDE: SYBASE 123

OTHER VIEWS AND STATISTICS > SESSION DETAIL VIEW
MetricsNone.
TIP: To configure the grid to show/hide row numbers, use the Options Editor.
SQL Server Session Detail ViewThe Session Detail view down provides a granular look at the details when a process is acting in a way that merits further investigation. It also presents data about a particular process in a way that makes it easier to understand and view apart from all other processes that SQL Server is running.
The following tabbed pages are available on the Session Detail view for SQL Server:
• All Locks
• Blocked By
• Blocking
• Overview
• SQL
Overview Tab for SQL Server• Metrics
The Overview tab of the Session Detail view displays information to analyze the details of a particular process. The tables below describe the statistics for each category on the Overview tab of the Session Detail view for SQL Server. The available categories are:
• Contention
• General
• I/O
• Memory
• Network
• Users
General StatisticsThe table below describes the statistics in the General category on the Overview tab of the Session Detail view:
Value The cumulative value of the session related statistic.
Statistic Description
SPID The SQL Server process ID. Unique value across all processes.
Login Name The SQL Server login name of the process.
NT User If using Windows Authentication, the name of the Windows NT user for this process. If using a trusted connection, the Windows NT user name.
Column Description
EMBARCADERO TECHNOLOGIES > EMBARCADERO PERFORMANCE CENTER 2.5 EXPERT GUIDE: SYBASE 124

OTHER VIEWS AND STATISTICS > SESSION DETAIL VIEW
Memory StatisticsThe table below describes the statistics in the Memory category on the Overview tab of the Session Detail view:
Contention StatisticsThe table below describes the statistics in the Contention category on the Overview tab of the Session Detail view:
I/O StatisticsThe table below describes the statistics in the I/O category on the Overview tab of the Session Detail view:
Users StatisticsThe table below describes the statistics in the Users category on the Overview tab of the Session Detail view:
Status Indicates if the process is actively performing work, is idle, blocked by another process, etc.
Database The database in which the process is running.
Program The executable the process is using against the server.
Host The machine name that originated the process.
Statistic Description
Memory Usage The number of pages in the procedure cache (SQL Cache) that are currently allocated to this process. A negative number indicates that pages are being released (freed) from this process.
Buffer Cache Hit Ratio The percentage of data page requests by this process that is available in memory as opposed to performing a physical I/O to disk.
Statistic Description
Blocked By If the process is being blocked, the SPID of the blocking process. A value of zero means that the process is not blocked.
Wait Time The number of milliseconds that the process has been waiting to be serviced. A value of zero indicates that the process is not waiting.
Last Wait Type The last or current SQL Server wait type.
Wait Resource The SQL Server's textual representation of a lock resource.
Statistic Description
Physical I/O The number of physical and logical reads performed by this session.
Physical Reads The number of physical reads from disk performed by this session.
Logical Reads The number of reads from memory performed by this process.
Logical Writes The number of writes to memory performed by this process.
Statistic Description
CPU Usage The cumulative CPU time for the process. The CPU usage is updated regardless of the value of the SET STATISTICS TIME ON option.
Open Trans The current number of open transactions owned by the process.
Login Time For client process, the last time a client logged into the SQL Server instance. For system processes, the time that SQL Server was started.
Statistic Description
EMBARCADERO TECHNOLOGIES > EMBARCADERO PERFORMANCE CENTER 2.5 EXPERT GUIDE: SYBASE 125

OTHER VIEWS AND STATISTICS > SESSION DETAIL VIEW
Network StatisticsThe table below describes the statistics in the Network category on the Overview tab of the Session Detail view:
MetricsHigh memory usage and a low cache hit ratio for a given process over a sustained period of time could indicate that the process is using poorly written code. Check the SQL tab to investigate further.
Also, watch for an unusually high percentage of CPU use over a long period of time. This could indicate a rogue process that must be terminated by the DBA using a KILL command for the session.
SQL Tab for SQL Server• Metrics
The SQL tab of the Session Detail view presents information relating to any current SQL issued by the session as well as any SQL previously issued by the session.
MetricsTo determine access paths, you should export and run through a QUERY PLAN session, any SQL suspect of inefficient access.
Blocked By Tab for SQL Server• Metrics
• Troubleshooting
Without a doubt, blocking lock situations can give the appearance of a “frozen” database almost more than anything else. A single blocking user has the potential to stop work for nearly all other processes on a small system, and can cause major headaches on large systems. Although SQL Server supports row-level locking, blocking lock situations do crop up - sometimes frequently.
Last Batch For client process, the last time a remote stored procedure call or an EXECUTE statement was executed. For system processes, the time that SQL Server was started.
Statistic Description
Net Address The unique identifier of the network card in the client machine that owns the process.
Net Library When a process is initiated from a client, the controlling mechanism is the network connection. Each network connection has a library associated with it. This value is the name library associated with the network connection responsible for this process.
Statistic Description
EMBARCADERO TECHNOLOGIES > EMBARCADERO PERFORMANCE CENTER 2.5 EXPERT GUIDE: SYBASE 126

OTHER VIEWS AND STATISTICS > SESSION DETAIL VIEW
MetricsThe Blocked By tab contains information relating to processes that are currently blocking the process featured in the Session Detail view. The table below describes the information available on the Blocked By tab of the Session Detail view for SQL Server:
TIP: To configure the grid to show/hide row numbers, use the Options Editor.
TroubleshootingOnce discovered, a blocking lock situation can normally be quickly remedied - the DBA issues a KILL against the offending process, which eliminates the user's stranglehold on the objects the user was accessing. Other user processes then nearly almost always complete in an instant. Discovering the blocked lock situation is made easier by using tools like Embarcadero Performance Center, but preventing the blocking lock situation in the first place is tricky.
The culprit of blocking lock scenarios is usually the application design, or the SQL being used within the application itself. Properly coding an application to reference database objects in an efficient order, and then using the right SQL to get the job done, is an art. The key to avoiding lock contention is to process user transactions in the quickest and most efficient manner possible - something not always easy to do.
By default, all processes wait indefinitely for locks in SQL Server. You can change this behavior by using the SET LOCK_TIMEOUT command, which limits the number of seconds that a process waits for a lock before timing out.
Column Description
SPID The SQL Server process ID. It is a unique value across all processes.
Status Indicates if the process is actively performing work, is idle, blocked by another process, etc.
Login The SQL Server login name of the process.
NT User If using Windows Authentication, the name of the Windows NT user for this process. If using a trusted connection, the Windows NT user name.
Host The machine name that originated the process.
Program The executable the process is using against the server.
Memory The number of pages in the procedure cache (SQL Cache) that are currently allocated to this process. A negative number indicates that pages are being released (freed) from this process.
CPU The cumulative CPU time for the process. The CPU usage is updated regardless of the value of the SET STATISTICS TIME ON option.
Physical I/O The current cumulative number of physical disk reads and writes issued by the process.
Blocked If the process is being blocked, the SPID of the blocking process.
Database The database in which the process is running.
Command The current command being executed by the process.
Last Batch For a client process, the last time a remote stored procedure call or an EXECUTE statement was executed. For system processes, the time that SQL Server was started.
Login Time For a client process, the last time a client logged into the SQL Server instance. For system processes, the time that SQL Server was started.
Wait Time The time that the process has been waiting to be serviced, in milliseconds. A value of zero indicates that the process is not waiting.
Wait Type The last or current SQL Server wait type.
Open Xacts The current number of open transactions owned by the process.
NT Domain If using Windows Authentication or a trusted connection, the name of the Windows domain of the user who owns the process.
EMBARCADERO TECHNOLOGIES > EMBARCADERO PERFORMANCE CENTER 2.5 EXPERT GUIDE: SYBASE 127
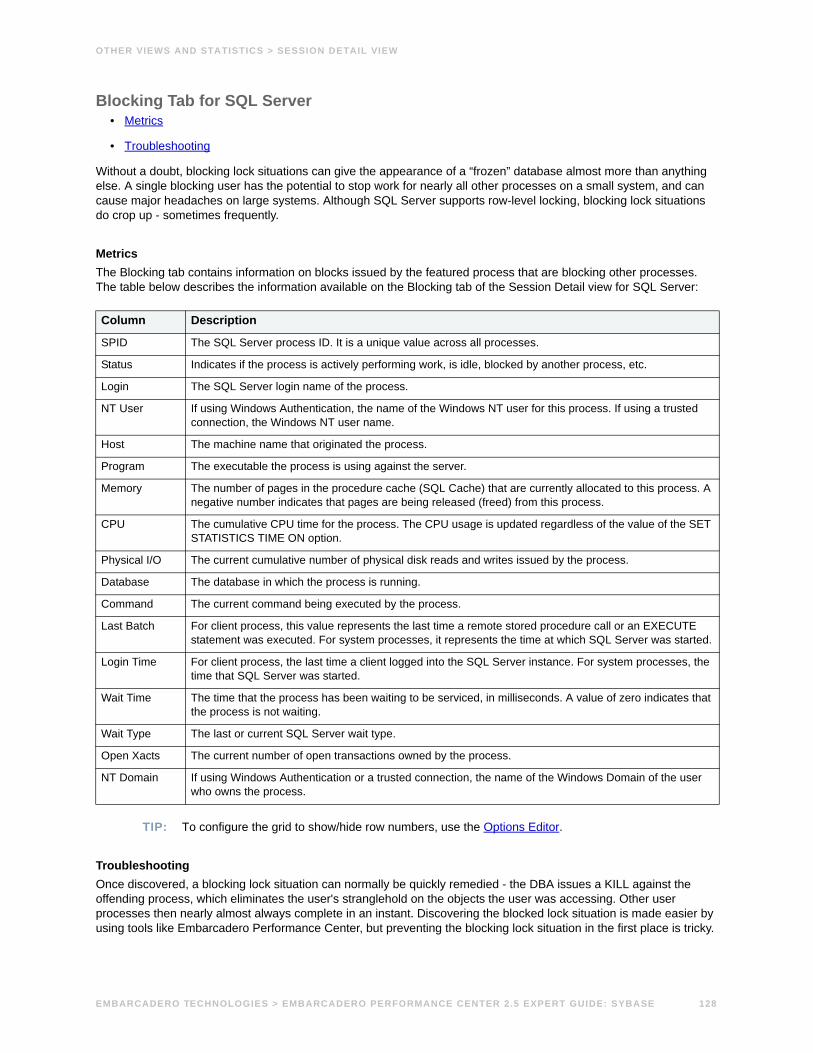
OTHER VIEWS AND STATISTICS > SESSION DETAIL VIEW
Blocking Tab for SQL Server• Metrics
• Troubleshooting
Without a doubt, blocking lock situations can give the appearance of a “frozen” database almost more than anything else. A single blocking user has the potential to stop work for nearly all other processes on a small system, and can cause major headaches on large systems. Although SQL Server supports row-level locking, blocking lock situations do crop up - sometimes frequently.
MetricsThe Blocking tab contains information on blocks issued by the featured process that are blocking other processes. The table below describes the information available on the Blocking tab of the Session Detail view for SQL Server:
TIP: To configure the grid to show/hide row numbers, use the Options Editor.
TroubleshootingOnce discovered, a blocking lock situation can normally be quickly remedied - the DBA issues a KILL against the offending process, which eliminates the user's stranglehold on the objects the user was accessing. Other user processes then nearly almost always complete in an instant. Discovering the blocked lock situation is made easier by using tools like Embarcadero Performance Center, but preventing the blocking lock situation in the first place is tricky.
Column Description
SPID The SQL Server process ID. It is a unique value across all processes.
Status Indicates if the process is actively performing work, is idle, blocked by another process, etc.
Login The SQL Server login name of the process.
NT User If using Windows Authentication, the name of the Windows NT user for this process. If using a trusted connection, the Windows NT user name.
Host The machine name that originated the process.
Program The executable the process is using against the server.
Memory The number of pages in the procedure cache (SQL Cache) that are currently allocated to this process. A negative number indicates that pages are being released (freed) from this process.
CPU The cumulative CPU time for the process. The CPU usage is updated regardless of the value of the SET STATISTICS TIME ON option.
Physical I/O The current cumulative number of physical disk reads and writes issued by the process.
Database The database in which the process is running.
Command The current command being executed by the process.
Last Batch For client process, this value represents the last time a remote stored procedure call or an EXECUTE statement was executed. For system processes, it represents the time at which SQL Server was started.
Login Time For client process, the last time a client logged into the SQL Server instance. For system processes, the time that SQL Server was started.
Wait Time The time that the process has been waiting to be serviced, in milliseconds. A value of zero indicates that the process is not waiting.
Wait Type The last or current SQL Server wait type.
Open Xacts The current number of open transactions owned by the process.
NT Domain If using Windows Authentication or a trusted connection, the name of the Windows Domain of the user who owns the process.
EMBARCADERO TECHNOLOGIES > EMBARCADERO PERFORMANCE CENTER 2.5 EXPERT GUIDE: SYBASE 128

OTHER VIEWS AND STATISTICS > SESSION DETAIL VIEW
The culprit of blocking lock scenarios is usually the application design, or the SQL being used within the application itself. Properly coding an application to reference database objects in an efficient order, and then using the right SQL to get the job done, is an art. The key to avoiding lock contention is to process user transactions in the quickest and most efficient manner possible - something not always easy to do.
By default, all processes wait indefinitely for locks in SQL Server. You can change this behavior by using the SET LOCK_TIMEOUT command, which limits the number of seconds that a process waits for a lock before timing out.
All Locks Tab for SQL Server• Metrics
• Troubleshooting
Without a doubt, blocking lock situations can give the appearance of a “frozen” database almost more than anything else. A single blocking user has the potential to stop work for nearly all other processes on a small system, and can cause major headaches even on large systems. Although SQL Server supports row-level locking, blocking lock situations do crop up - sometimes frequently.
MetricsThe All Locks tab contains information on all locks associated with the featured SPID, including locks that are held by the process and locks that are blocking the process. The table below describes the information available on the All Locks tab of the Session Detail view for SQL Server:
TIP: To configure the grid to show/hide row numbers, use the Options Editor.
TroubleshootingOnce discovered, a blocking lock situation can normally be quickly remedied - the DBA issues a KILL against the offending process, which eliminates the user's stranglehold on the objects the use was accessing. Other user processes then nearly almost always complete in an instant. Discovering the blocked lock situation is made easier by using tools like Embarcadero Performance Center, but preventing the blocking lock situation in the first place is tricky.
Column Description
Database The database where the locks are occurring.
Table Name The name of the table involved in a lock. NULL for non-table locks or table locks that take place in the tempdb database.
Ndx ID The index ID involved in the lock.
Lock Type The type of lock (database, table, row ID, etc.).
Lock Mode The mode of the lock (shared, exclusive, etc.).
Lock Status The status of the lock (waiting or granted).
Owner Type Whether the lock came from a regular session or a transaction.
Program The executable the process is using against the server.
BLK SPID If nonzero, the process ID of the process blocking the requested lock. A value of zero indicates that the process is not blocked.
Wait Time The time the process has waited for the lock, in milliseconds.
Status Indicates if the process is actively performing work, is idle, blocked by another process, etc.
Command The command the process is currently issuing.
NT Domain The name of the Windows 2000/NT domain.
EMBARCADERO TECHNOLOGIES > EMBARCADERO PERFORMANCE CENTER 2.5 EXPERT GUIDE: SYBASE 129

OTHER VIEWS AND STATISTICS > SESSION DETAIL VIEW
The culprit of blocking lock scenarios is usually the application design, or the SQL being used within the application itself. Properly coding an application to reference database objects in an efficient order, and then using the right SQL to get the job done, is an art. The key to avoiding lock contention is to process user transactions in the quickest and most efficient manner possible - something not always easy to do.
By default, all processes wait indefinitely for locks in SQL Server. You can change this behavior by using the SET LOCK_TIMEOUT command, which limits the number of seconds that a process waits for a lock before timing out.
Sybase Session Detail ViewThe Session Detail view down provides a granular look at the details when a process is acting in a way that merits further investigation. It also presents data about a particular process in a way that makes it easier to understand and view apart from all other processes that Sybase is running.
The following tabbed pages are available on the Session Detail view for Sybase:
• Overview
• SQL
• Blocked By
• Blocking
• All Locks
Overview Tab for SybaseThe Overview tab of the Session Detail view displays information to analyze the details of a particular process. The tables below describe the statistics for each category on the Overview tab of the Session Detail view for Sybase. The available categories are:
• Contention
• Execution
• General
• I/O
• Memory
• Users
General StatisticsThe table below describes the statistics in the General category on the Overview tab of the Session Detail view:
Statistic Description
SPID The Sybase process ID. Unique value across all processes.
Login Name The Sybase login name of the process.
Family ID The ID of the coordinating process and all of its worker processes.
Status Indicates if the process is actively performing work, is idle, blocked by another process, etc.
Database The database in which the process is running.
Program The executable the process is using against the server.
EMBARCADERO TECHNOLOGIES > EMBARCADERO PERFORMANCE CENTER 2.5 EXPERT GUIDE: SYBASE 130

OTHER VIEWS AND STATISTICS > SESSION DETAIL VIEW
Memory StatisticsThe Memory Usage statistic in the Memory category on the Overview tab of the Session Detail view is the number of pages in the procedure cache (SQL Cache) that are currently allocated to this process. A negative number indicates that pages are being released (freed) from this process.
Contention StatisticsThe table below describes the statistics in the Contention category on the Overview tab of the Session Detail view:
I/O StatisticsThe Physical I/O statistic in the I/O category on the Overview tab of the Session Detail view is the number of physical and logical reads performed by this session.
Users StatisticsThe table below describes the statistics in the Users category on the Overview tab of the Session Detail view:
Execution StatisticsThe table below describes the statistics in the Execution category on the Overview tab of the Session Detail view:
SQL Tab for Sybase• Metrics
The SQL tab of the Session Detail view presents information relating to any current SQL issued by the session as well as any SQL previously issued by the session.
Metrics To determine access paths, you should export and run through a QUERY PLAN session, any SQL suspect of inefficient access.
Host The machine name that originated the process.
Statistic Description
Blocked By If the process is being blocked, the SPID of the blocking process. A value of zero indicates that the process is not blocked.
Time Blocked The SQL Server's wait time.
Statistic Description
CPU Usage The cumulative CPU time for the process. The CPU usage is updated regardless of the value of the SET STATISTICS TIME ON option.
Active Trans The current number of open transactions owned by the process.
Statistic Description
Exec Class The execution class for the current process.
Priority The priority of the current process.
Affinity The affinity level for the current process.
Statistic Description
EMBARCADERO TECHNOLOGIES > EMBARCADERO PERFORMANCE CENTER 2.5 EXPERT GUIDE: SYBASE 131

OTHER VIEWS AND STATISTICS > SESSION DETAIL VIEW
Blocked By Tab for Sybase• Metrics
• Troubleshooting
Without a doubt, blocking lock situations can give the appearance of a “frozen” database almost more than anything else. A single blocking user has the potential to stop work for nearly all other processes on a small system, and can cause major headaches even on large systems.
Metrics The Blocked By tab contains information relating to processes that are currently blocking the process featured in the Session Detail view. The table below describes the information available on the Blocked By tab of the Session Detail view for Sybase:
TIP: To configure the grid to show/hide row numbers, use the Options Editor.
TroubleshootingOnce discovered, a blocking lock situation can normally be quickly remedied - the DBA issues a KILL against the offending process, which eliminates the user's stranglehold on the objects the user was accessing. Other user processes then nearly almost always complete in an instant. Discovering the blocked lock situation is made easier by using tools like Embarcadero Performance Center, but preventing the blocking lock situation in the first place is tricky.
The culprit of blocking lock scenarios is usually the application design, or the SQL being used within the application itself. Properly coding an application to reference database objects in an efficient order, and then using the right SQL to get the job done, is an art. The key to avoiding lock contention is to process user transactions in the quickest and most efficient manner possible - something not always easy to do.
Blocking Tab for Sybase• Metrics
• Troubleshooting
Column Description
SPID The Sybase process ID. This is a unique value across all processes.
Status Indicates if the process is actively performing work, is idle, blocked by another process, etc.
Login The Sybase login name of the process.
Host The machine name that originated the process.
Program The executable the process is using against the server.
Memory The number of pages in the procedure cache (SQL Cache) that are currently allocated to this process. A negative number indicates that pages are being released (freed) from this process.
CPU The cumulative CPU time for the process. The CPU usage is updated regardless of the value of the SET STATISTICS TIME ON option.
Physical I/O The current cumulative number of physical disk reads and writes issued by the process.
Database The database in which the process is running.
Command The current command being executed by the process.
Time Blocked The time that the process has been blocked, in seconds.
Transaction The name of any transaction.
EMBARCADERO TECHNOLOGIES > EMBARCADERO PERFORMANCE CENTER 2.5 EXPERT GUIDE: SYBASE 132

OTHER VIEWS AND STATISTICS > SESSION DETAIL VIEW
Without a doubt, blocking lock situations can give the appearance of a “frozen” database almost more than anything else. A single blocking user has the potential to stop work for nearly all other processes on a small system, and can cause major headaches on large systems.
Metrics The Blocking tab contains information on blocks issued by the featured process that are blocking other processes. The table below describes the information available on the Blocking tab of the Session Detail view for Sybase:
TIP: To configure the grid to show/hide row numbers, use the Options Editor.
TroubleshootingOnce discovered, a blocking lock situation can normally be quickly remedied - the DBA issues a KILL against the offending process, which eliminates the user's stranglehold on the objects they were accessing. Other user processes then nearly almost always complete in an instant. Discovering the blocked lock situation is made easier by using tools like Embarcadero Performance Center, but preventing the blocking lock situation in the first place is tricky.
The culprit of blocking lock scenarios is usually the application design, or the SQL being used within the application itself. Properly coding an application to reference database objects in an efficient order, and then using the right SQL to get the job done, is an art. The key to avoiding lock contention is to process user transactions in the quickest and most efficient manner possible - something not always easy to do.
All Locks Tab for Sybase• Metrics
• Troubleshooting
Without a doubt, blocking lock situations can give the appearance of a “frozen” database almost more than anything else. A single blocking user has the potential to stop work for nearly all other processes on a small system, and can cause major headaches on large systems.
Column Description
SPID The Sybase process ID. This is a unique value across all processes.
Status Indicates if the process is actively performing work, is idle, blocked by another process, etc.
Login The Sybase login name of the process.
Host The machine name that originated the process.
Program The executable the process is using against the server.
Memory The number of pages in the procedure cache (SQL Cache) that are currently allocated to this process. A negative number indicates that pages are being released (freed) from this process.
CPU The cumulative CPU time for the process. The CPU usage is updated regardless of the value of the SET STATISTICS TIME ON option.
Physical I/O The current cumulative number of physical disk reads and writes issued by the process.
Database The database in which the process is running.
Command The current command being executed by the process.
Time Blocked The time that the process has been blocked, in seconds.
Transaction The name of any transaction.
EMBARCADERO TECHNOLOGIES > EMBARCADERO PERFORMANCE CENTER 2.5 EXPERT GUIDE: SYBASE 133
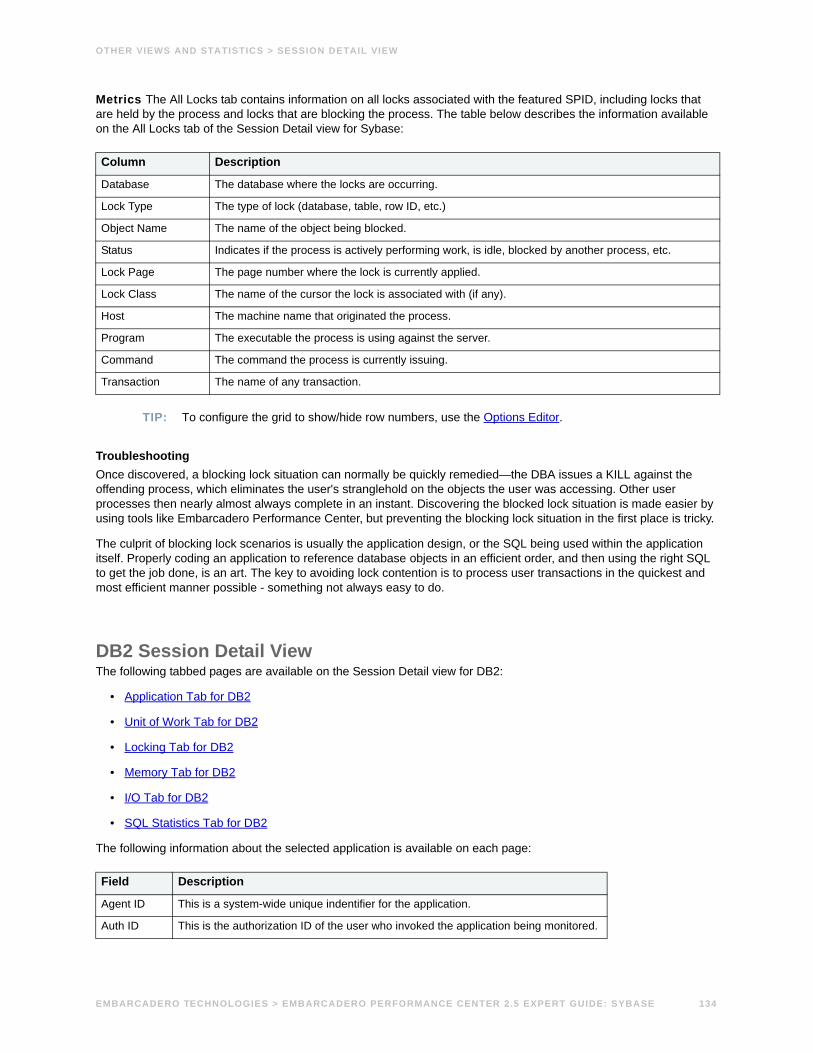
OTHER VIEWS AND STATISTICS > SESSION DETAIL VIEW
Metrics The All Locks tab contains information on all locks associated with the featured SPID, including locks that are held by the process and locks that are blocking the process. The table below describes the information available on the All Locks tab of the Session Detail view for Sybase:
TIP: To configure the grid to show/hide row numbers, use the Options Editor.
TroubleshootingOnce discovered, a blocking lock situation can normally be quickly remedied—the DBA issues a KILL against the offending process, which eliminates the user's stranglehold on the objects the user was accessing. Other user processes then nearly almost always complete in an instant. Discovering the blocked lock situation is made easier by using tools like Embarcadero Performance Center, but preventing the blocking lock situation in the first place is tricky.
The culprit of blocking lock scenarios is usually the application design, or the SQL being used within the application itself. Properly coding an application to reference database objects in an efficient order, and then using the right SQL to get the job done, is an art. The key to avoiding lock contention is to process user transactions in the quickest and most efficient manner possible - something not always easy to do.
DB2 Session Detail ViewThe following tabbed pages are available on the Session Detail view for DB2:
• Application Tab for DB2
• Unit of Work Tab for DB2
• Locking Tab for DB2
• Memory Tab for DB2
• I/O Tab for DB2
• SQL Statistics Tab for DB2
The following information about the selected application is available on each page:
Column Description
Database The database where the locks are occurring.
Lock Type The type of lock (database, table, row ID, etc.)
Object Name The name of the object being blocked.
Status Indicates if the process is actively performing work, is idle, blocked by another process, etc.
Lock Page The page number where the lock is currently applied.
Lock Class The name of the cursor the lock is associated with (if any).
Host The machine name that originated the process.
Program The executable the process is using against the server.
Command The command the process is currently issuing.
Transaction The name of any transaction.
Field Description
Agent ID This is a system-wide unique indentifier for the application.
Auth ID This is the authorization ID of the user who invoked the application being monitored.
EMBARCADERO TECHNOLOGIES > EMBARCADERO PERFORMANCE CENTER 2.5 EXPERT GUIDE: SYBASE 134

OTHER VIEWS AND STATISTICS > SESSION DETAIL VIEW
Application Tab for DB2The Application tab contains application and client detail information from the application snapshot record for the selected application.
Application Details
OS User ID This is the authorization ID used to access the operating system.
Application This is the name of the application executable.
Statistic Description
Application Agent ID This is a system-wide unique indentifier for the application.
Application Agent PID The process ID (UNIX) or thread ID (Windows) of a DB2 agent.
Application Agent System CPU (sec) This is the total system CPU time (in seconds) used by the database manager agent process.
Application Agent User CPU (sec) This is the total CPU time (in seconds) used by database manager agent process.
Application Agents This is the number of agents currently executing statements or subsections.
Application Agents Stolen This is the number of times agents are stolen from the application. Agents are stolen when an idle agent is reassigned from one application to another.
Application Assoc Agents HWM This is the maximum number of subagents associated with the application.
Application Assoc Sub-Agents This is the number of subagents associated with the application.
Application Authorization ID This is the authorization ID of the user who invoked the application being monitored.
Application Codepage This is the code page identifier.
Application Connect Complete Time This is the date and time a connection request was granted.
Application Connect Start Time This is the date and time an application started a connection request.
Application Coord Agent PID This is the process ID (UNIX) or thread ID (Windows) of the coordinator agent for the selected application.
Application Coord Node In a multi-node system, this is the node number of the node where the selected application connected or attached to the instance.
Application Coord Token This is the DRDA AS correlation token.
Application ID This is generated when the application connects to the database at the database manager or when DDCS receives a request to connect to a DRDA database.
Application Idle Time This is the number of seconds since the selected application last issued any requests to the server. This includes applications that have not terminated a transaction, for example not issued a commit or rollback.
Application Name Name of the application executable.
OS User ID The authorization ID used to access the operating system.
Application Priority This is the priority of the agents working for this application.
Application Priority Type This is the operating system priority type for the agent working on behalf of the application.
Application Sequence Number This identifier is incremented when a unit of work ends (when a COMMIT or ROLLBACK terminates a unit of work). Together, the application ID and application sequence number uniquely identify a transaction.
Field Description
EMBARCADERO TECHNOLOGIES > EMBARCADERO PERFORMANCE CENTER 2.5 EXPERT GUIDE: SYBASE 135
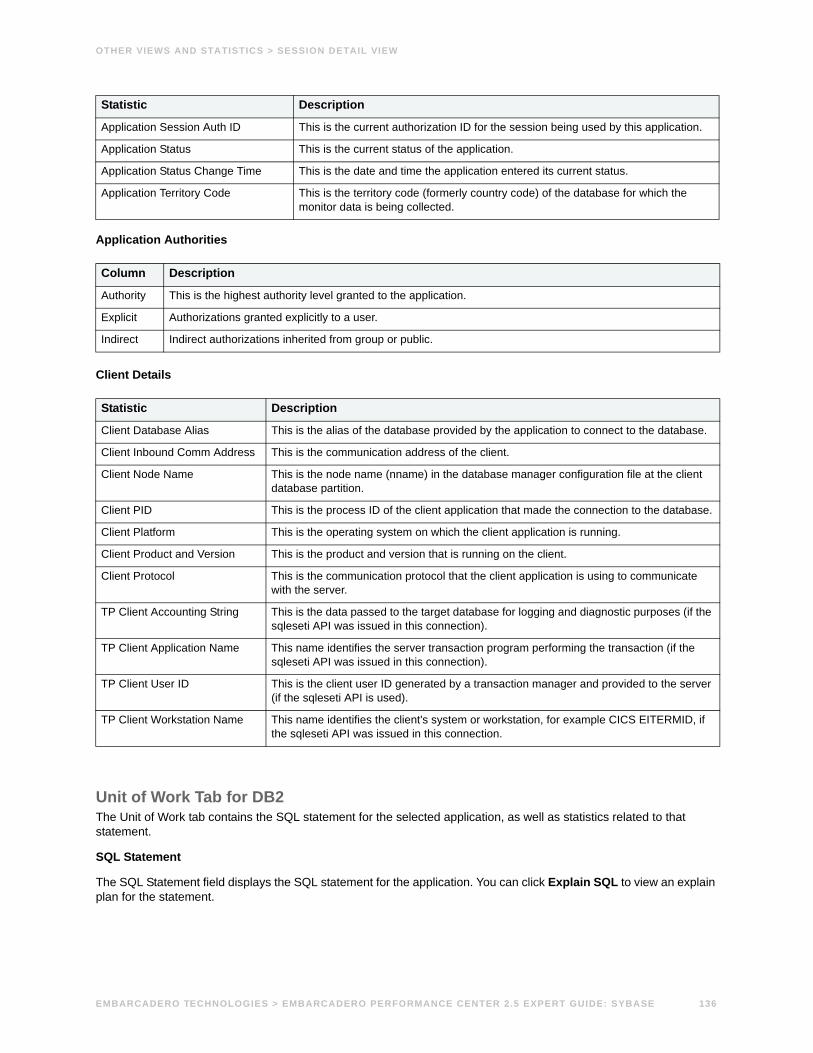
OTHER VIEWS AND STATISTICS > SESSION DETAIL VIEW
Application Authorities
Client Details
Unit of Work Tab for DB2The Unit of Work tab contains the SQL statement for the selected application, as well as statistics related to that statement.
SQL Statement
The SQL Statement field displays the SQL statement for the application. You can click Explain SQL to view an explain plan for the statement.
Application Session Auth ID This is the current authorization ID for the session being used by this application.
Application Status This is the current status of the application.
Application Status Change Time This is the date and time the application entered its current status.
Application Territory Code This is the territory code (formerly country code) of the database for which the monitor data is being collected.
Column Description
Authority This is the highest authority level granted to the application.
Explicit Authorizations granted explicitly to a user.
Indirect Indirect authorizations inherited from group or public.
Statistic Description
Client Database Alias This is the alias of the database provided by the application to connect to the database.
Client Inbound Comm Address This is the communication address of the client.
Client Node Name This is the node name (nname) in the database manager configuration file at the client database partition.
Client PID This is the process ID of the client application that made the connection to the database.
Client Platform This is the operating system on which the client application is running.
Client Product and Version This is the product and version that is running on the client.
Client Protocol This is the communication protocol that the client application is using to communicate with the server.
TP Client Accounting String This is the data passed to the target database for logging and diagnostic purposes (if the sqleseti API was issued in this connection).
TP Client Application Name This name identifies the server transaction program performing the transaction (if the sqleseti API was issued in this connection).
TP Client User ID This is the client user ID generated by a transaction manager and provided to the server (if the sqleseti API is used).
TP Client Workstation Name This name identifies the client's system or workstation, for example CICS EITERMID, if the sqleseti API was issued in this connection.
Statistic Description
EMBARCADERO TECHNOLOGIES > EMBARCADERO PERFORMANCE CENTER 2.5 EXPERT GUIDE: SYBASE 136

OTHER VIEWS AND STATISTICS > SESSION DETAIL VIEW
Statement Detail
Statement Statistics
Statistic Description
SQL Statement This is the text of the dynamic SQL statement.
Node This is the node where the statement was executed.
Type This is the type of statement processed.
Creator This is the authorization ID of the user that pre-compiled the application.
Operation This is the statement operation currently being processed or that was most recently processed (if none are currently running).
Agents Created This is the maximum number of agents that were used when executing the statement.
Agents Working This is the number of concurrent agents currently executing a statement or subsection.
Cursor Name This is the name of the cursor corresponding to this SQL statement.
Blocking Cursor This indicates if the statement being executed is using a blocking cursor.
Package Name This is the name of the package that contains the SQL statement that is currently executing.
Package Version This identifies the version identifier of the package that contains the currently executing SQL statement.
Section Number This is the internal section number in the package for the SQL statement currently processing or most recently processed.
Parallelism Degree This is the degree of parallelism requested when the query was bound.
Query Cost Estimate This is the estimated cost for a query (in timerons) as determined by the SQL compiler.
Query Card Estimate This is an estimate of the number of rows that will be returned by a query.
Statistic Description
Statement Start Time This is the date and time when the statement operation (stmt_operation) monitor element started executing.
Statement Stop Time This is the date and time when the statement operation (stmt_operation) monitor element stopped executing.
Statement Sort Time (sec) This is the total elapsed time (in seconds) for all sorts that have been executed.
Statement User CPU (sec) This is the total user CPU time (in seconds) used by the currently executing statement.
Statement System CPU (sec) This is the total system CPU time (in seconds) used by the currently executing statement.
Statement Elapsed Time (sec) This is the elapsed execution time (in seconds) of the most recently completed statement.
UOW Start Time This is the date and time that the unit of work first required database resources.
UOW Stop Time This is the date and time that the most recent unit of work completed. This occurs when database changes are committed or rolled back.
UOW Prev Stop Time This is the time the previous unit of work completed.
UOW Elapsed Time (sec) This is the elapsed execution time (in seconds) of the most recently completed unit of work.
UOW Lock Wait Time (sec) This is the total amount of elapsed time (in seconds) this unit of work has spent waiting for locks.
UOW Log Space Used (KB) This is the amount of log space (in kilobytes) used in the current unit of work of the monitored application.
UOW Completion Status This is the status of the unit of work and how it stopped.
EMBARCADERO TECHNOLOGIES > EMBARCADERO PERFORMANCE CENTER 2.5 EXPERT GUIDE: SYBASE 137
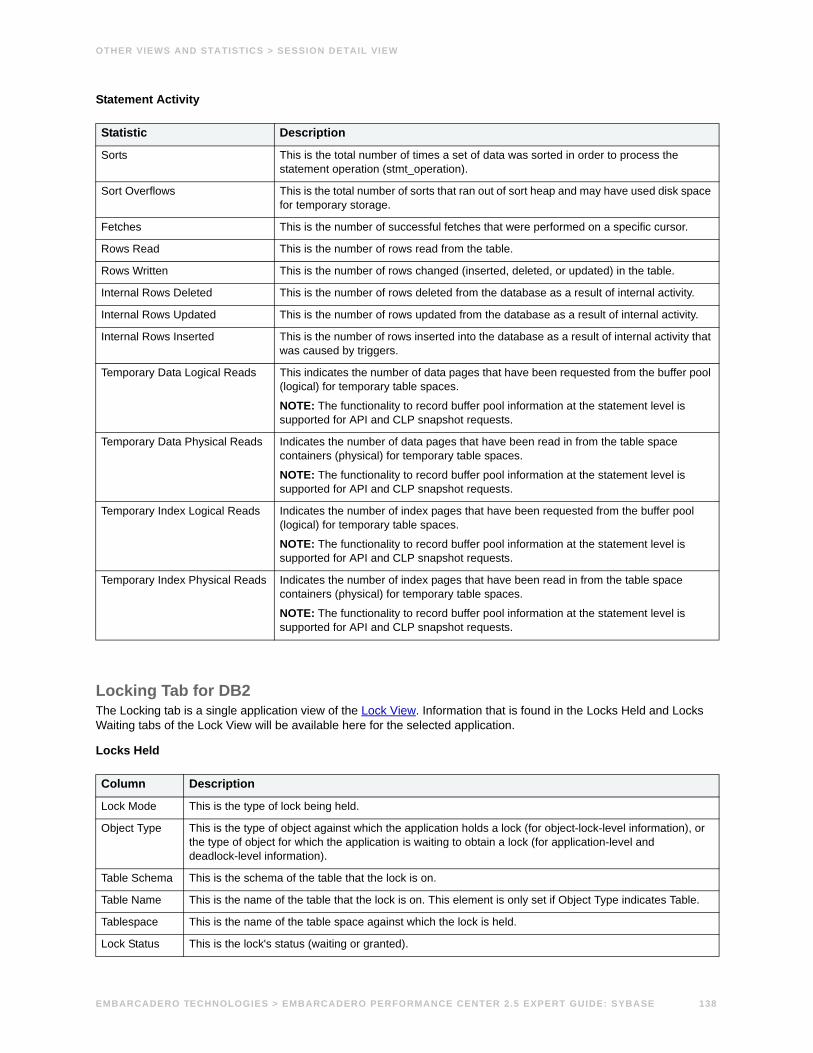
OTHER VIEWS AND STATISTICS > SESSION DETAIL VIEW
Statement Activity
Locking Tab for DB2The Locking tab is a single application view of the Lock View. Information that is found in the Locks Held and Locks Waiting tabs of the Lock View will be available here for the selected application.
Locks Held
Statistic Description
Sorts This is the total number of times a set of data was sorted in order to process the statement operation (stmt_operation).
Sort Overflows This is the total number of sorts that ran out of sort heap and may have used disk space for temporary storage.
Fetches This is the number of successful fetches that were performed on a specific cursor.
Rows Read This is the number of rows read from the table.
Rows Written This is the number of rows changed (inserted, deleted, or updated) in the table.
Internal Rows Deleted This is the number of rows deleted from the database as a result of internal activity.
Internal Rows Updated This is the number of rows updated from the database as a result of internal activity.
Internal Rows Inserted This is the number of rows inserted into the database as a result of internal activity that was caused by triggers.
Temporary Data Logical Reads This indicates the number of data pages that have been requested from the buffer pool (logical) for temporary table spaces.
NOTE: The functionality to record buffer pool information at the statement level is supported for API and CLP snapshot requests.
Temporary Data Physical Reads Indicates the number of data pages that have been read in from the table space containers (physical) for temporary table spaces.
NOTE: The functionality to record buffer pool information at the statement level is supported for API and CLP snapshot requests.
Temporary Index Logical Reads Indicates the number of index pages that have been requested from the buffer pool (logical) for temporary table spaces.
NOTE: The functionality to record buffer pool information at the statement level is supported for API and CLP snapshot requests.
Temporary Index Physical Reads Indicates the number of index pages that have been read in from the table space containers (physical) for temporary table spaces.
NOTE: The functionality to record buffer pool information at the statement level is supported for API and CLP snapshot requests.
Column Description
Lock Mode This is the type of lock being held.
Object Type This is the type of object against which the application holds a lock (for object-lock-level information), or the type of object for which the application is waiting to obtain a lock (for application-level and deadlock-level information).
Table Schema This is the schema of the table that the lock is on.
Table Name This is the name of the table that the lock is on. This element is only set if Object Type indicates Table.
Tablespace This is the name of the table space against which the lock is held.
Lock Status This is the lock's status (waiting or granted).
EMBARCADERO TECHNOLOGIES > EMBARCADERO PERFORMANCE CENTER 2.5 EXPERT GUIDE: SYBASE 138

OTHER VIEWS AND STATISTICS > SESSION DETAIL VIEW
Locks Waiting
Memory Tab for DB2The Memory tab displays all the memory pools for the application and key cache statistics specific to the application.
Memory Pools
Memory Statistics
Escalation This indicates whether a lock request was made as part of a lock escalation.
Column Description
Agent ID This is the application handle of the agent holding a lock for which this application is waiting.
Application ID This is the application ID of the application that is holding a lock on the object that this application is waiting to obtain.
Lock Mode This is the type of lock being held.
Mode Requested This is the lock mode being requested by the application.
Object Type This is the type of object against which the application holds a lock.
Table Schema This is the schema of the table that the lock is on.
Tablespace This is the name of the table that the lock is on. This element is only set if Object Type indicates Table.
Wait Start Time This is the date and time that this application started waiting to obtain a lock on the object that is currently locked by another application.
Escalation This indicates whether a lock request was made as part of a lock escalation.
Column Description
Node This is the number assigned to the node in the db2nodes.cfg file.
Memory Pool This is the type of memory pool.
Utilization This is the percentage of memory pool used.
High Watermark (MB) This is the largest size of a memory pool (in megabytes) since its creation.
Current Size (MB) This is the current size of a memory pool (in megabytes).
Max Size (MB) This is the internally configured size of a memory pool (in megabytes) in DB2.
Statistic Description
Application Section Inserts This is the number of inserts of SQL sections by an application from its SQL work area.
Application Section Lookups This is the number of lookups of SQL sections by an application from its SQL work area.
Catalog Cache Inserts This is the number of times that the system tried to insert table descriptor or authorization information into the catalog cache.
Catalog Cache Lookups This is the number of times that the catalog cache was referenced to obtain table descriptor information or authorization information.
Catalog Cache Overflows This is the number of times that the catalog cache overflowed the bounds of its allocated memory.
Column Description
EMBARCADERO TECHNOLOGIES > EMBARCADERO PERFORMANCE CENTER 2.5 EXPERT GUIDE: SYBASE 139

OTHER VIEWS AND STATISTICS > SESSION DETAIL VIEW
Cache Hit Ratios
I/O Tab for DB2The I/O tab displays detailed I/O information from the application snapshot record for the selected application.
I/O Statistics
Package Cache Inserts This is the total number of times that a requested section was not available for use and had to be loaded into the package cache. This includes any implicit prepares performed by the system.
Package Cache Lookups This is the number of times an application looked for a section or package in the package cache.
Private Workspace Inserts This is the number of inserts of SQL sections by an application into the private workspace.
Private Workspace Lookups This is the number of lookups of SQL sections by an application in its agents' private workspace.
Private Workspace Overflows This is the number of times that the private workspaces overflowed the bounds of its allocated memory.
Private Workspace HWM (KB) This is the largest size (in kilobytes) reached by the private workspace.
Shared Workspace Inserts This is the number of inserts of SQL sections by applications into shared workspaces.
Shared Workspace Lookups This is the number of lookups of SQL sections by applications in shared workspaces.
Shared Workspace Overflows This is the number of times that shared workspaces overflowed the bounds of their allocated memory.
Shared Workspace HWM (KB) This is the largest size (in kilobytes) reached by shared workspaces.
Ratio Description
Catalog Cache The catalog cache hit ratio indicates how well the catalog cache is helping to avoid actual accesses to the catalog on disk. A high ratio indicates successful avoidance of actual disk I/O accesses.
Package Cache The package cache hit ratio indicates how well the package cache is helping to avoid reloading packages and sections for static SQL from the system catalogs as well as helping to avoid recompiling dynamic SQL statements. A high ratio indicates successful avoidance of these activities.
Shared Workspace The shared workspace hit ratio indicates how well the shared SQL workspace is helping to avoid having to initialize sections for SQL statements that are about to be executed. A high ratio indicate successful avoidance of this action.
Private Workspace The private workspace hit ratio indicates how well the private SQL workspace is helping to avoid having to initialize sections for SQL statements that are about to be executed. A high ratio indicate successful avoidance of this action.
Application Workspace The application workspace hit ratio indicates how well the application SQL workspace is helping to avoid having to initialize sections for SQL statements that are about to be executed. A high ratio indicate successful avoidance of this action.
Statistic Description
Buffered Data Logical Reads This indicates the number of data pages that have been requested from the buffer pool (logical) for regular and large table spaces.
Statistic Description
EMBARCADERO TECHNOLOGIES > EMBARCADERO PERFORMANCE CENTER 2.5 EXPERT GUIDE: SYBASE 140

OTHER VIEWS AND STATISTICS > SESSION DETAIL VIEW
I/O Distribution Ratios
Buffered Data Physical Reads This indicates the number of data pages that have been read from the table space containers (physical) for regular and large table spaces.
Buffered Data Writes This indicates the number of times a buffer pool data page was physically written to disk.
Buffered Index Logical Reads This indicates the number of index pages that have been requested from the buffer pool (logical) for regular and large table spaces.
Buffered Index Physical Reads This indicates the number of index pages that have been read from the table space containers (physical) for regular and large table spaces.
Buffered Index Writes This indicates the number of times a buffer pool index page was physically written to disk.
Buffered Read Time (sec) This indicates the total amount of time (in seconds) spent reading data and index pages from the table space containers (physical) for all types of table spaces.
Buffered Write Time (sec) This indicates the total amount of time (in seconds) spent physically writing data or index pages from the buffer pool to disk.
Direct Reads This is the number of read operations that do not use the buffer pool.
Direct Read Requests This is the number of requests to perform a direct read of one or more sectors of data.
Direct Writes This is the number of write operations that do not use the buffer pool.
Direct Write Requests This is the number of requests to perform a direct write of one or more sectors of data.
Direct Read Time (sec) This is the elapsed time (in seconds) required to perform the direct reads.
Direct Write Time (sec) This is the elapsed time (in seconds) required to perform the direct writes.
Extended Storage – Data Pages From This is the number of buffer pool data pages copied from extended storage.
Extended Storage – Data Pages To This is the number of buffer pool data pages copied to extended storage.
Extended Storage – Index Pages From This is the number of buffer pool index pages copied from extended storage.
Extended Storage – Index Pages To This is the number of buffer pool index pages copied to extended storage.
Prefetch Pages Unread This indicates the number of pages that the prefetcher read in that were never used.
Prefetch Wait Time (sec) This is the time an application spent waiting for an I/O server (prefetcher) to finish loading pages into the buffer pool.
Temporary Data Logical Reads This indicates the number of data pages which have been requested from the buffer pool (logical) for temporary table spaces.
Temporary Data Physical Reads This indicates the number of data pages read in from the table space containers (physical) for temporary table spaces.
Temporary Index Logical Reads This indicates the number of index pages which have been requested from the buffer pool (logical) for temporary table spaces.
Temporary Index Physical Reads This indicates the number of index pages read in from the table space containers (physical) for temporary table spaces.
Ratio Description
Direct Read Ratio Direct Reads are read operations that do not use the buffer pool. Direct Read Ratio is the percentage of all reads that were direct reads.
Statistic Description
EMBARCADERO TECHNOLOGIES > EMBARCADERO PERFORMANCE CENTER 2.5 EXPERT GUIDE: SYBASE 141
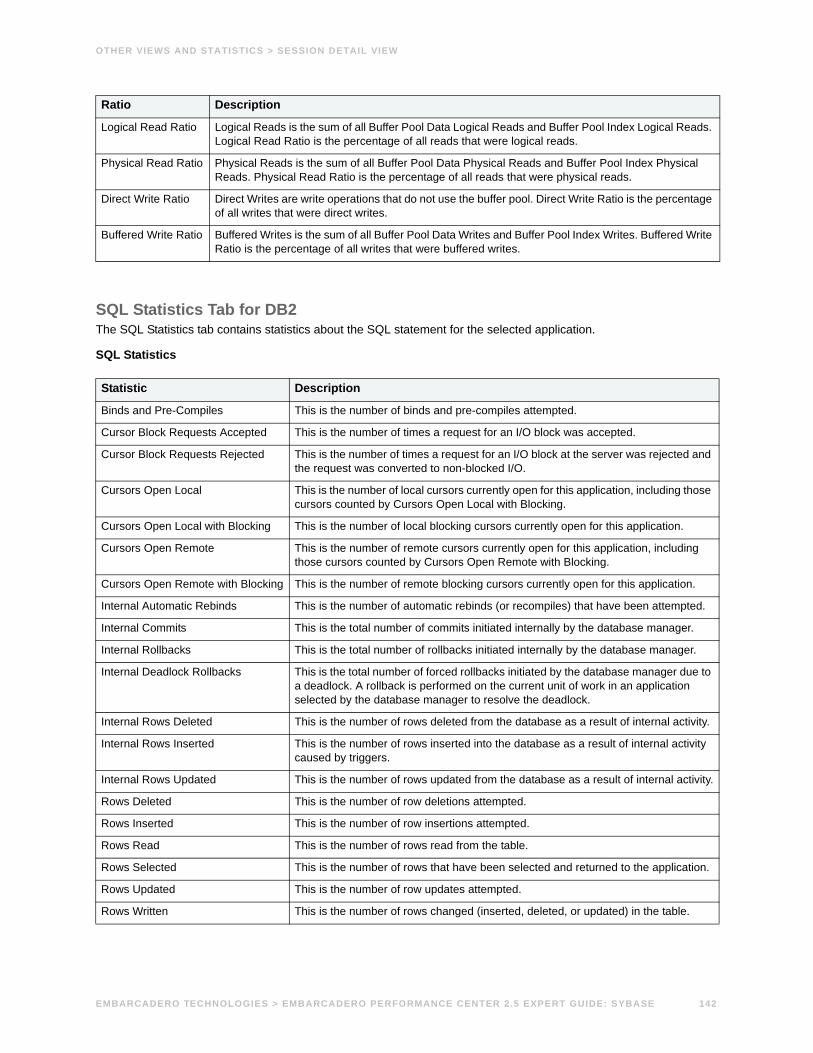
OTHER VIEWS AND STATISTICS > SESSION DETAIL VIEW
SQL Statistics Tab for DB2The SQL Statistics tab contains statistics about the SQL statement for the selected application.
SQL Statistics
Logical Read Ratio Logical Reads is the sum of all Buffer Pool Data Logical Reads and Buffer Pool Index Logical Reads. Logical Read Ratio is the percentage of all reads that were logical reads.
Physical Read Ratio Physical Reads is the sum of all Buffer Pool Data Physical Reads and Buffer Pool Index Physical Reads. Physical Read Ratio is the percentage of all reads that were physical reads.
Direct Write Ratio Direct Writes are write operations that do not use the buffer pool. Direct Write Ratio is the percentage of all writes that were direct writes.
Buffered Write Ratio Buffered Writes is the sum of all Buffer Pool Data Writes and Buffer Pool Index Writes. Buffered Write Ratio is the percentage of all writes that were buffered writes.
Statistic Description
Binds and Pre-Compiles This is the number of binds and pre-compiles attempted.
Cursor Block Requests Accepted This is the number of times a request for an I/O block was accepted.
Cursor Block Requests Rejected This is the number of times a request for an I/O block at the server was rejected and the request was converted to non-blocked I/O.
Cursors Open Local This is the number of local cursors currently open for this application, including those cursors counted by Cursors Open Local with Blocking.
Cursors Open Local with Blocking This is the number of local blocking cursors currently open for this application.
Cursors Open Remote This is the number of remote cursors currently open for this application, including those cursors counted by Cursors Open Remote with Blocking.
Cursors Open Remote with Blocking This is the number of remote blocking cursors currently open for this application.
Internal Automatic Rebinds This is the number of automatic rebinds (or recompiles) that have been attempted.
Internal Commits This is the total number of commits initiated internally by the database manager.
Internal Rollbacks This is the total number of rollbacks initiated internally by the database manager.
Internal Deadlock Rollbacks This is the total number of forced rollbacks initiated by the database manager due to a deadlock. A rollback is performed on the current unit of work in an application selected by the database manager to resolve the deadlock.
Internal Rows Deleted This is the number of rows deleted from the database as a result of internal activity.
Internal Rows Inserted This is the number of rows inserted into the database as a result of internal activity caused by triggers.
Internal Rows Updated This is the number of rows updated from the database as a result of internal activity.
Rows Deleted This is the number of row deletions attempted.
Rows Inserted This is the number of row insertions attempted.
Rows Read This is the number of rows read from the table.
Rows Selected This is the number of rows that have been selected and returned to the application.
Rows Updated This is the number of row updates attempted.
Rows Written This is the number of rows changed (inserted, deleted, or updated) in the table.
Ratio Description
EMBARCADERO TECHNOLOGIES > EMBARCADERO PERFORMANCE CENTER 2.5 EXPERT GUIDE: SYBASE 142
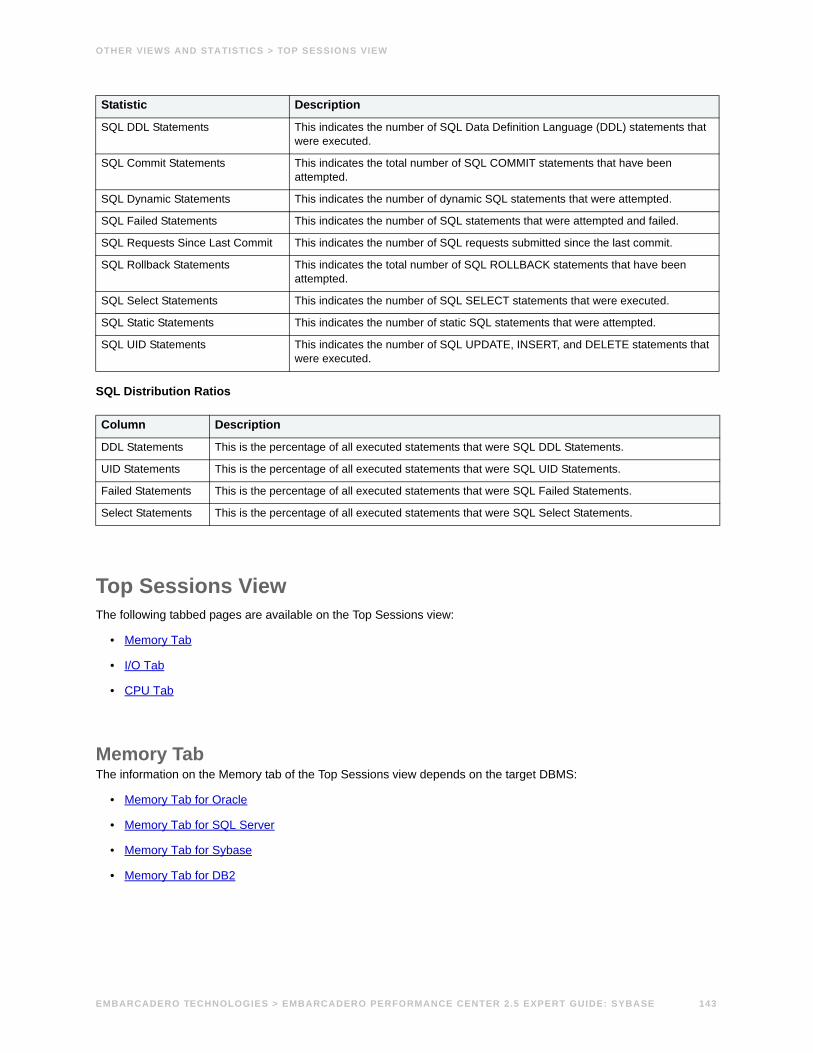
OTHER VIEWS AND STATISTICS > TOP SESSIONS VIEW
SQL Distribution Ratios
Top Sessions ViewThe following tabbed pages are available on the Top Sessions view:
• Memory Tab
• I/O Tab
• CPU Tab
Memory TabThe information on the Memory tab of the Top Sessions view depends on the target DBMS:
• Memory Tab for Oracle
• Memory Tab for SQL Server
• Memory Tab for Sybase
• Memory Tab for DB2
SQL DDL Statements This indicates the number of SQL Data Definition Language (DDL) statements that were executed.
SQL Commit Statements This indicates the total number of SQL COMMIT statements that have been attempted.
SQL Dynamic Statements This indicates the number of dynamic SQL statements that were attempted.
SQL Failed Statements This indicates the number of SQL statements that were attempted and failed.
SQL Requests Since Last Commit This indicates the number of SQL requests submitted since the last commit.
SQL Rollback Statements This indicates the total number of SQL ROLLBACK statements that have been attempted.
SQL Select Statements This indicates the number of SQL SELECT statements that were executed.
SQL Static Statements This indicates the number of static SQL statements that were attempted.
SQL UID Statements This indicates the number of SQL UPDATE, INSERT, and DELETE statements that were executed.
Column Description
DDL Statements This is the percentage of all executed statements that were SQL DDL Statements.
UID Statements This is the percentage of all executed statements that were SQL UID Statements.
Failed Statements This is the percentage of all executed statements that were SQL Failed Statements.
Select Statements This is the percentage of all executed statements that were SQL Select Statements.
Statistic Description
EMBARCADERO TECHNOLOGIES > EMBARCADERO PERFORMANCE CENTER 2.5 EXPERT GUIDE: SYBASE 143
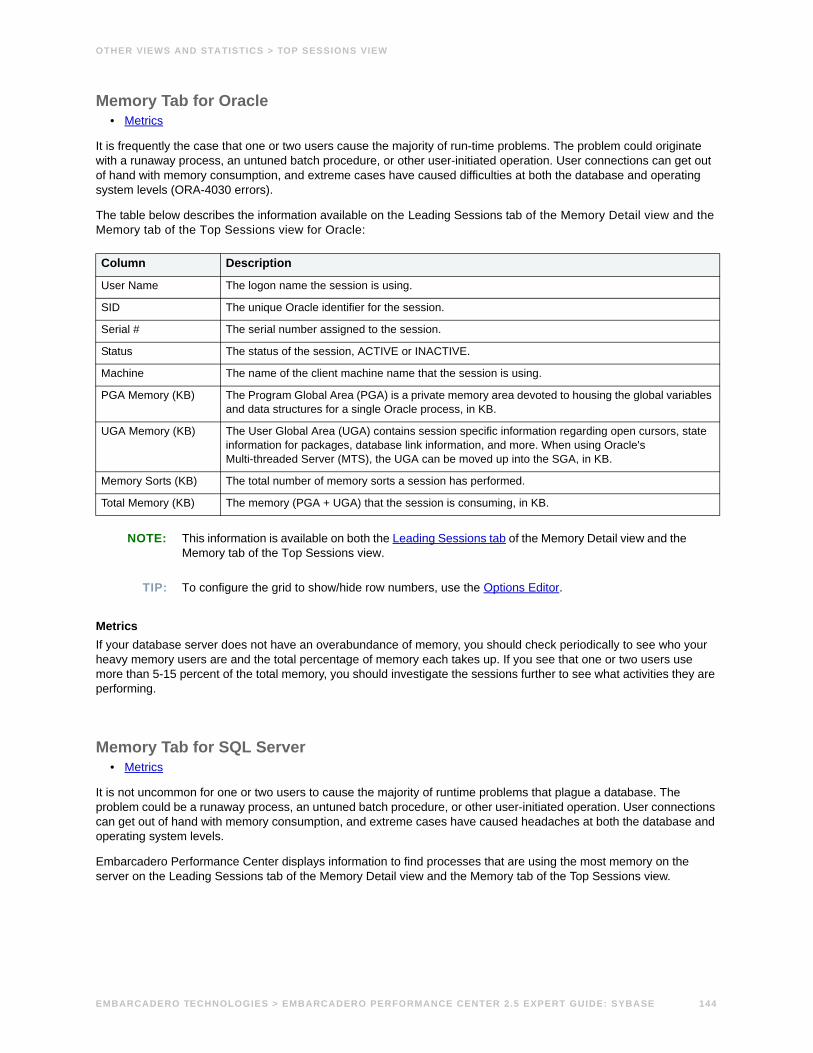
OTHER VIEWS AND STATISTICS > TOP SESSIONS VIEW
Memory Tab for Oracle• Metrics
It is frequently the case that one or two users cause the majority of run-time problems. The problem could originate with a runaway process, an untuned batch procedure, or other user-initiated operation. User connections can get out of hand with memory consumption, and extreme cases have caused difficulties at both the database and operating system levels (ORA-4030 errors).
The table below describes the information available on the Leading Sessions tab of the Memory Detail view and the Memory tab of the Top Sessions view for Oracle:
NOTE: This information is available on both the Leading Sessions tab of the Memory Detail view and the Memory tab of the Top Sessions view.
TIP: To configure the grid to show/hide row numbers, use the Options Editor.
MetricsIf your database server does not have an overabundance of memory, you should check periodically to see who your heavy memory users are and the total percentage of memory each takes up. If you see that one or two users use more than 5-15 percent of the total memory, you should investigate the sessions further to see what activities they are performing.
Memory Tab for SQL Server• Metrics
It is not uncommon for one or two users to cause the majority of runtime problems that plague a database. The problem could be a runaway process, an untuned batch procedure, or other user-initiated operation. User connections can get out of hand with memory consumption, and extreme cases have caused headaches at both the database and operating system levels.
Embarcadero Performance Center displays information to find processes that are using the most memory on the server on the Leading Sessions tab of the Memory Detail view and the Memory tab of the Top Sessions view.
Column Description
User Name The logon name the session is using.
SID The unique Oracle identifier for the session.
Serial # The serial number assigned to the session.
Status The status of the session, ACTIVE or INACTIVE.
Machine The name of the client machine name that the session is using.
PGA Memory (KB) The Program Global Area (PGA) is a private memory area devoted to housing the global variables and data structures for a single Oracle process, in KB.
UGA Memory (KB) The User Global Area (UGA) contains session specific information regarding open cursors, state information for packages, database link information, and more. When using Oracle's Multi-threaded Server (MTS), the UGA can be moved up into the SGA, in KB.
Memory Sorts (KB) The total number of memory sorts a session has performed.
Total Memory (KB) The memory (PGA + UGA) that the session is consuming, in KB.
EMBARCADERO TECHNOLOGIES > EMBARCADERO PERFORMANCE CENTER 2.5 EXPERT GUIDE: SYBASE 144
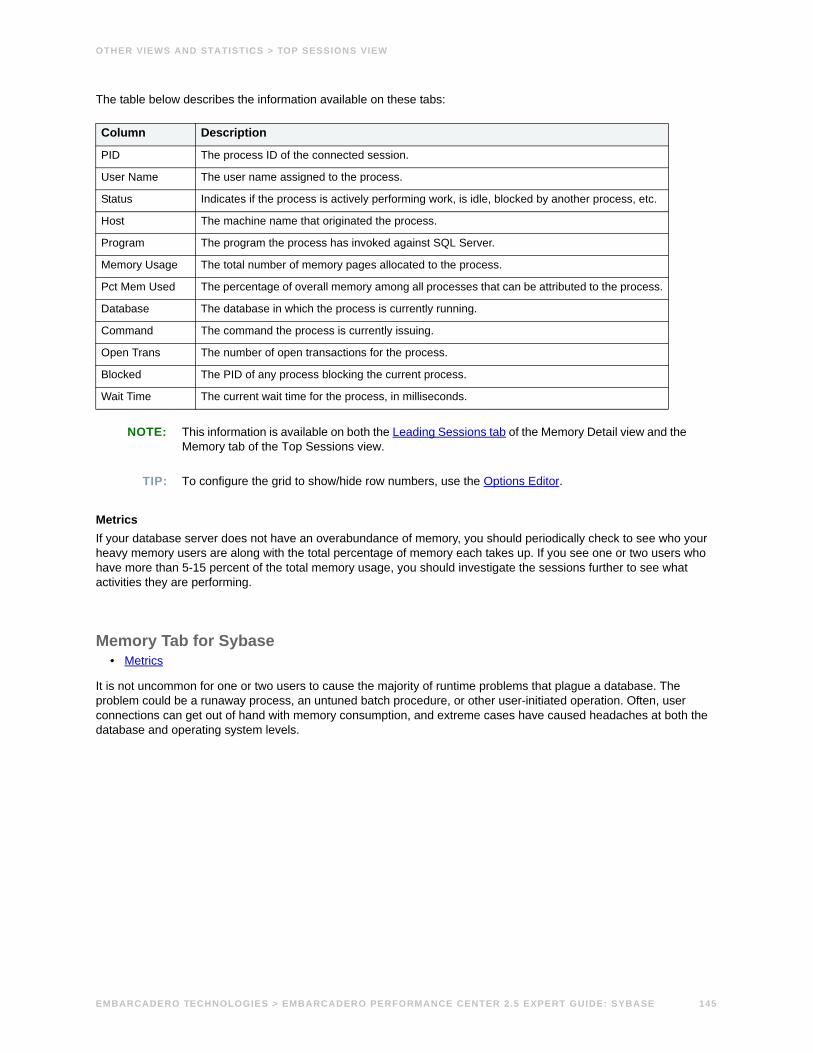
OTHER VIEWS AND STATISTICS > TOP SESSIONS VIEW
The table below describes the information available on these tabs:
NOTE: This information is available on both the Leading Sessions tab of the Memory Detail view and the Memory tab of the Top Sessions view.
TIP: To configure the grid to show/hide row numbers, use the Options Editor.
MetricsIf your database server does not have an overabundance of memory, you should periodically check to see who your heavy memory users are along with the total percentage of memory each takes up. If you see one or two users who have more than 5-15 percent of the total memory usage, you should investigate the sessions further to see what activities they are performing.
Memory Tab for Sybase• Metrics
It is not uncommon for one or two users to cause the majority of runtime problems that plague a database. The problem could be a runaway process, an untuned batch procedure, or other user-initiated operation. Often, user connections can get out of hand with memory consumption, and extreme cases have caused headaches at both the database and operating system levels.
Column Description
PID The process ID of the connected session.
User Name The user name assigned to the process.
Status Indicates if the process is actively performing work, is idle, blocked by another process, etc.
Host The machine name that originated the process.
Program The program the process has invoked against SQL Server.
Memory Usage The total number of memory pages allocated to the process.
Pct Mem Used The percentage of overall memory among all processes that can be attributed to the process.
Database The database in which the process is currently running.
Command The command the process is currently issuing.
Open Trans The number of open transactions for the process.
Blocked The PID of any process blocking the current process.
Wait Time The current wait time for the process, in milliseconds.
EMBARCADERO TECHNOLOGIES > EMBARCADERO PERFORMANCE CENTER 2.5 EXPERT GUIDE: SYBASE 145

OTHER VIEWS AND STATISTICS > TOP SESSIONS VIEW
This tab displays information to find processes that are using the most memory on the server. The table below describes the information available on the Leading Sessions tab of the Memory Detail view and the Memory tab of the Top Sessions view for Sybase:
TIP: To configure the grid to show/hide row numbers, use the Options Editor.
MetricsIf your database server does not have an overabundance of memory, you should periodically check to see who your heavy memory users are along with the total percentage of memory each takes up. If you see one or two users who have more than 5-15 percent of the total memory usage, you should investigate the sessions further to see what activities they are performing.
Memory Tab for DB2• Metrics
It is not uncommon for one or two users to cause the majority of runtime problems that plague a database. The problem could be a runaway process, an untuned batch procedure, or other user-initiated operation. Often, user connections can get out of hand with memory consumption, and extreme cases have caused headaches at both the database and operating system levels.
Column Description
PID The process ID.
User Name The user name assigned to the process.
FID The process ID of the worker process’ parent.
Status Indicates if the process is actively performing work, is idle, blocked by another process, etc.
Host The machine name that originated the process.
Program The executable the process is using against the server.
Memory Usage The memory currently used by the process.
Pct Mem Used The percentage of memory currently used by the process.
Database The database in which the process is running.
Command The command the process is currently issuing.
Transaction The name of any transaction.
Blocked The PID of any process blocking the current process.
Time Blocked The time that the process has been blocked, in seconds.
EMBARCADERO TECHNOLOGIES > EMBARCADERO PERFORMANCE CENTER 2.5 EXPERT GUIDE: SYBASE 146

OTHER VIEWS AND STATISTICS > TOP SESSIONS VIEW
This tab displays information to find processes that are using the most memory on the server. The table below describes the information DB2 on the Leading Sessions tab of the Memory Detail view and the Memory tab of the Top Sessions view for DB2:
TIP: To configure the grid to show/hide row numbers, use the Options Editor.
MetricsIf your database server does not have an overabundance of memory, you should periodically check to see who your heavy memory users are along with the total percentage of memory each takes up. If you see one or two users who have more than 5-15 percent of the total memory usage, you should investigate the sessions further to see what activities they are performing.
I/O TabThe information on the I/O tab of the Top Sessions view depends on the target DBMS:
• I/O Tab for DB2
• I/O Tab for SQL Server
• I/O Tab for Sybase
• I/O Tab for DB2
I/O Tab for Oracle• Metrics
When a system undergoes heavy I/O activity, all the user connections can contribute somewhat equally to the overall load. Frequently, however, one or two user connections are responsible for 75 percent or more of the I/O activity. It may be that a large batch load or other typical process is running, and that is perfectly okay for your system. Or, it may be a runaway process or rogue connection that you should track down and eliminate.
Column Description
Agent ID The application handle of the agent holding a lock for which this application is waiting.
Auth ID The authorization ID of the user who invoked the application that is being monitored.
OS User ID The operating system ID of the process.
Client PID The process ID of the client application that made the connection to the database.
Application The name of the application executable.
Status The current status of the application.
UOW Elapsed Time (sec) The elapsed execution time of the most recently completed unit of work.
Memory Overflows Total number of memory overflows.
Memory Used (KB) Total memory pool usage for the application.
EMBARCADERO TECHNOLOGIES > EMBARCADERO PERFORMANCE CENTER 2.5 EXPERT GUIDE: SYBASE 147

OTHER VIEWS AND STATISTICS > TOP SESSIONS VIEW
It is a good idea to periodically check the leading sessions in your system with respect to I/O and make sure all is well. You can use Embarcadero Performance Center to perform this function with the information available on this tab. The table below describes the information available on the Leading Sessions tab of the I/O Detail view and the I/O tab of the Top Sessions view for Oracle:
NOTE: This information is available on both the Leading Sessions tab of the I/O Detail view and the I/O tab of the Top Sessions view.
TIP: To configure the grid to show/hide row numbers, use the Options Editor.
MetricsPinpointing sessions with abnormally high I/O activity relative to other sessions in the system can aid in ferreting out accounts that are dragging down overall system performance. You should examine the activity of each session to determine the system workload and to see if you can reduce the workload or tune the system for better performance.
I/O Tab for SQL Server• Metrics
When a system undergoes heavy I/O activity, sometimes you find that all the user connections are contributing somewhat equally to the overall load. Frequently, however, one or two user connections are responsible for 75 percent or more of the I/O activity. It can be that a large batch load or other typical process is running that is perfectly okay for your system. Alternatively, it can be a runaway process or other rogue connection that you should track down and possibly eliminate.
Embarcadero Performance Center displays information to find processes that are using the most memory on the server on the Leading Sessions tab of the I/O Detail view and the I/O tab of the Top Sessions view.
Column Description
User Name The logon name the session is using.
SID The unique Oracle identifier for the session.
Serial # The serial number assigned to the session.
Status The status of the session, ACTIVE or INACTIVE.
Machine The name of the client machine name that the session is using.
Reads The number of physical reads.
Writes The number of physical writes.
Total I/O The total of all physical I/O operations for the session.
EMBARCADERO TECHNOLOGIES > EMBARCADERO PERFORMANCE CENTER 2.5 EXPERT GUIDE: SYBASE 148

OTHER VIEWS AND STATISTICS > TOP SESSIONS VIEW
The table below describes the information available on these tabs:
NOTE: This information is available on both the Leading Sessions tab of the I/O Detail view and the I/O tab of the Top Sessions view.
TIP: To configure the grid to show/hide row numbers, use the Options Editor.
MetricsFinding one more two users that are consuming more than 75 percent of the total I/O load can indicate a runaway or improper process. By drilling down into the I/O activity of all users, you can quickly see if this is the case.
I/O Tab for Sybase• Metrics
When a system undergoes heavy I/O activity, sometimes you find that all the user connections are contributing somewhat equally to the overall load. More often than not, however, one or two user connections are responsible for 75 percent or more of the I/O activity. It can be that a large batch load or other typical process is running that is perfectly okay for your system. Or it can be a runaway process or other rogue connection that needs to be tracked down and possibly eliminated.
Column Description
PID The process ID.
User Name The user name assigned to the process.
Status Indicates if the process is actively performing work, is idle, blocked by another process, etc.
Host The machine name that originated the process.
Program The executable the process is using against the server.
Physical I/O The current cumulative number of reads and writes issued by the process.
Pct I/O Used The percentage of overall I/O that can be attributed to the process.
Database The database in which the process is running.
Command The command the process is currently issuing.
Open Trans The number of open transactions for the process.
Blocked The PID of any process blocking the current process.
Wait Time The current wait time for the process, in milliseconds.
EMBARCADERO TECHNOLOGIES > EMBARCADERO PERFORMANCE CENTER 2.5 EXPERT GUIDE: SYBASE 149
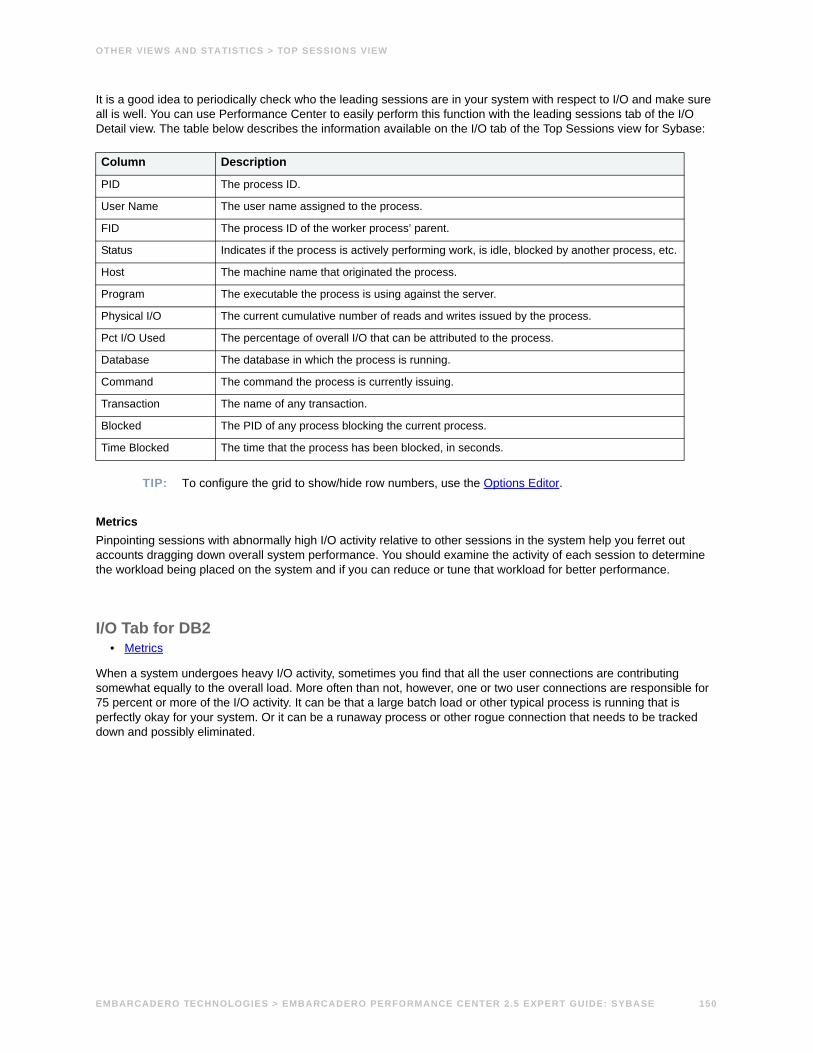
OTHER VIEWS AND STATISTICS > TOP SESSIONS VIEW
It is a good idea to periodically check who the leading sessions are in your system with respect to I/O and make sure all is well. You can use Performance Center to easily perform this function with the leading sessions tab of the I/O Detail view. The table below describes the information available on the I/O tab of the Top Sessions view for Sybase:
TIP: To configure the grid to show/hide row numbers, use the Options Editor.
MetricsPinpointing sessions with abnormally high I/O activity relative to other sessions in the system help you ferret out accounts dragging down overall system performance. You should examine the activity of each session to determine the workload being placed on the system and if you can reduce or tune that workload for better performance.
I/O Tab for DB2• Metrics
When a system undergoes heavy I/O activity, sometimes you find that all the user connections are contributing somewhat equally to the overall load. More often than not, however, one or two user connections are responsible for 75 percent or more of the I/O activity. It can be that a large batch load or other typical process is running that is perfectly okay for your system. Or it can be a runaway process or other rogue connection that needs to be tracked down and possibly eliminated.
Column Description
PID The process ID.
User Name The user name assigned to the process.
FID The process ID of the worker process’ parent.
Status Indicates if the process is actively performing work, is idle, blocked by another process, etc.
Host The machine name that originated the process.
Program The executable the process is using against the server.
Physical I/O The current cumulative number of reads and writes issued by the process.
Pct I/O Used The percentage of overall I/O that can be attributed to the process.
Database The database in which the process is running.
Command The command the process is currently issuing.
Transaction The name of any transaction.
Blocked The PID of any process blocking the current process.
Time Blocked The time that the process has been blocked, in seconds.
EMBARCADERO TECHNOLOGIES > EMBARCADERO PERFORMANCE CENTER 2.5 EXPERT GUIDE: SYBASE 150

OTHER VIEWS AND STATISTICS > TOP SESSIONS VIEW
It is a good idea to periodically check who the leading sessions are in your system with respect to I/O and make sure all is well. You can use Performance Center to easily perform this function with the leading sessions tab of the I/O Detail view. The table below describes the information available on the I/O tab of the Top Sessions view for DB2:
TIP: To configure the grid to show/hide row numbers, use the Options Editor.
MetricsPinpointing sessions with abnormally high I/O activity relative to other sessions in the system help you ferret out accounts dragging down overall system performance. You should examine the activity of each session to determine the workload being placed on the system and if you can reduce or tune that workload for better performance.
CPU TabThe information on the CPU tab of the Top Sessions view depends on the target DBMS:
• CPU Tab for Oracle
• CPU Tab for SQL Server
• CPU Tab for Sybase
• CPU Tab for DB2
Column Description
Agent ID The application handle of the agent holding a lock for which this application is waiting.
Auth ID The authorization ID of the user who invoked the application that is being monitored.
OS User ID The operating system ID of the process.
Client PID The process ID of the client application that made the connection to the database.
Application The name of the application executable.
Status The current status of the application.
UOW Elapsed Time (sec) The elapsed execution time of the most recently completed unit of work.
Buffered I/O Time (ms) The total time spent by application in performing buffered reads and writes.
Direct I/O Time (ms) The total time spent by application in performing non-buffered reads and writes.
Total I/O Time (ms) The total time spent by application in performing buffered and non-buffered reads and writes.
EMBARCADERO TECHNOLOGIES > EMBARCADERO PERFORMANCE CENTER 2.5 EXPERT GUIDE: SYBASE 151

OTHER VIEWS AND STATISTICS > TOP SESSIONS VIEW
CPU Tab for OracleThe table below describes the information available on the CPU tab of the Top Sessions view for Oracle:
TIP: To configure the grid to show/hide row numbers, use the Options Editor.
CPU Tab for SQL ServerThe table below describes the information available on the CPU tab of the Top Sessions view for SQL Server:
TIP: To configure the grid to show/hide row numbers, use the Options Editor.
CPU Tab for SybaseThe table below describes the information available on the CPU tab of the Top Sessions view for Sybase:
Column Description
User Name The logon name the session is using.
SID The unique Oracle identifier for the session.
Serial # The serial number assigned to the session.
Status The status of the session, ACTIVE or INACTIVE.
Machine The name of the client machine name that the session is using.
Program The executable the process is using against the server.
CPU The CPU used by the process when the call started.
Column Description
PID The process ID.
User Name The user name assigned to the process.
Status Indicates if the process is actively performing work, is idle, blocked by another process, etc.
Host The machine name that originated the process.
Program The executable the process is using against the server.
CPU The cumulative CPU time for the process.
Pct CPU Used The percentage of the CPU dedicated to this process.
Database The database in which the process is running.
Command The command the process is currently issuing.
Open Trans The number of open transactions for the process.
Blocked The PID of any process blocking the current process.
Wait Time The current wait time for the process, in milliseconds.
Column Description
PID The process ID.
User Name The user name assigned to the process.
FID The process ID of the worker process’ parent.
EMBARCADERO TECHNOLOGIES > EMBARCADERO PERFORMANCE CENTER 2.5 EXPERT GUIDE: SYBASE 152

OTHER VIEWS AND STATISTICS > TOP SQL VIEW
To configure the grid to show/hide row numbers, use the Options Editor.
CPU Tab for DB2The table below describes the information available on the CPU tab of the Top Sessions view for DB2:
To configure the grid to show/hide row numbers, use the Options Editor.
Top SQL View• Metrics
One or two bad queries can cause a lot of trouble for the remaining sessions in a database. It is important to find them before they get into a production system, but sometimes a few sneak through.
Status Indicates if the process is actively performing work, is idle, blocked by another process, etc.
Host The machine name that originated the process.
Program The executable the process is using against the server.
CPU The cumulative CPU time for the process in ticks.
Pct CPU Used The percentage of the CPU dedicated to this process.
Database The database in which the process is running.
Command The command the process is currently issuing.
Transaction The name of any transaction.
Blocked The PID of any process blocking the current process.
Time Blocked The time that the process has been blocked, in seconds.
Column Description
Agent ID The application handle of the agent holding a lock for which this application is waiting.
Auth ID The authorization ID of the user who invoked the application that is being monitored.
OS User ID The operating system ID of the process.
Client PID The process ID of the client application that made the connection to the database.
Application The name of the application executable.
Status The current status of the application.
UOW Elapsed Time (sec) The elapsed execution time of the most recently completed unit of work.
Agent ID The application handle of the agent holding a lock for which this application is waiting.
User CPU Time (sec) The total user CPU time used by the application agents.
System CPU Time (sec) The total system CPU time used by the application agents.
Total CPU Time (sec) The total user + system CPU time used by the application agents.
Column Description
EMBARCADERO TECHNOLOGIES > EMBARCADERO PERFORMANCE CENTER 2.5 EXPERT GUIDE: SYBASE 153
OTHER VIEWS AND STATISTICS > TOP SQL VIEW
By applying custom filters and performance-related thresholds, the Top SQL view locates inefficient SQL. By applying filters to certain I/O and statistical counters, you hope to isolate queries that far exceed their nearest competitors in the same area (like disk reads). When you find them, you should reduce the number of sorts a query performs. Or, for a query that returns only a few records, you should try to minimize the number of rows a query processes.
The Top SQL view displays requested SQL for SQL Server, Oracle, DB2, and Sybase datasources.
MetricsWhen you begin to look for inefficient SQL in a database, there are two primary questions you need to answer:
1 What has been the worst SQL that has historically been run in my database?
2 What is the worst SQL that’s running right now in my database?
When troubleshooting a slow system, you should be on the lookout for any query that shows an execution count that is significantly larger than any other query on the system. It may be that the query is in an inefficient Transact SQL loop, or other problematic programming construct. Only by bringing the query to the attention of the application developers will you know if the query is being mishandled from a programming standpoint.
EMBARCADERO TECHNOLOGIES > EMBARCADERO PERFORMANCE CENTER 2.5 EXPERT GUIDE: SYBASE 154

IndexSymbols% Privileged Time 92% User Time 92
AActive Connections
Sybase 18, 57Address Lock Contention 48AIX 84All Locks Tab
Oracle 75SQL Server 75Sybase 54, 76
All User Locks Tab 77Applications Tab 63Archive View 72Available Paged Memory 89Available Physical Memory 88Available Swap Memory 89Average Disk Queue 95Average Disk Queue Length 87
BBlocked 53Blocked Users
Sybase 42Blocking Lock Rate 14Blocking Locks Tab
Oracle 78SQL Server 79Sybase 55, 65, 80
Blocks Input/Sec 95Blocks Output/Sec 95Bottleneck Analysis
OS 85Buffer Size 97Bytes per I/O Operation 95Bytes Received 21Bytes Sent 21
CCache Activity Tab 29Cache Allocations 27Cache Bindings
Index Statistics 45Storage 46Table Statistics 44
Cache Detail Tab 38Cache Efficiency 97Cache Size 97Clean Buffer Grab Rate 14Clock Algorithm Scans 97Clustered Table Inserts 67Committed Transactions 18, 59Completed Disk I/Os 30Contention Detail View
Sybase 54Contention Health Index 73
Contention Performance Category ViewStatistics 46
Context Switches/Sec 93Copy Read Hits % 97CPU Events 92CPU Tab 91CPU Utilization 92Current Locks
Sybase 19, 51, 58
DData Cache Allocations 27Data Cache Hit Activity 22Data Cache Hit Rate 12Data Map Hits % 97Database Detail View
Sybase 42Database Low on Space 19Database Overview
Sybase 36Database Summary
Sybase 41Databases Performance Category View
Statistics 41Datasource Health Index 73Deadlock Rate 15, 50Deadlocks
Sybase 51Deferred Deletes 67Deferred Updates 67Delayed Disk I/Os 31Device Detail 99Device Detail Tab 38Device I/O Contention 16, 48Device Overview 37Device Summary 99Devices Tab 34Direct Cheap Updates 67Direct Deletes 67Direct Expensive Updates 67Direct in Place Updates 67Dirty Buffers Grabbed 23Dirty Read Requests 23Dirty Read Restarts 23Disk Analysis
OS 85Disk I/O Structures 49Disk I/O Time 95Disk Time 86Disk Transfers/Sec 95DML Detail Tab 67
EEngine Configuration Limit 50Engines Tab 34
FFree Disk Space 90
EMBARCADERO TECHNOLOGIES > EMBARCADERO PERFORMANCE CENTER 2.5 EXPERT GUIDE: SYBASE 134
INDEX >
GGroup Commit Sleeps 48
HHealth Index View 73Heap Table Inserts 67HIDD_OS_PC_TOPMEMPROC_ORA 90Home View Statistics
Sybase 11Contention Vital Signs 14I/O Vital Signs 16Memory Vital Signs 12Network Vital Signs 20Space Vital Signs 19Users Vital Signs 17
Hot Objects View 73Hot Code Tab 74Hot Tables Tab 73
HP-UX 84
II/O Detail View
Sybase 33I/O Details 94I/O Error Rate
Sybase 32I/O Errors 17I/O Performance Category View
Statistics 30I/O Tab 126Inactive Connections
Sybase 57Inbound Packet Errors 99Inbound Packets Discarded 99Index Demographics 44Index Scans Tab 35Index Statistics Tab 44INET Address 99Interrupts/Sec 92
KKey Resource Usage
OS 85
LLarge I/O Acquired 26Large I/O Denied 26Large I/O Hit Rate 13, 26Leading Sessions Tab
SybaseI/O 33Memory 28
Linux 84Load Average 86Load Averages 93Lock Contention
Sybase 52Locks Tab
Sybase 64
Locks View 74All Locks Tab 75All User Locks Tab 77Blocking Locks Tab 78
Locks View for DB2 81Log Overview
Sybase 36Logical Lock Contention 47Logs Low on Space
Sybase 20
MMDL Read Hits % 97Memory Analysis
OS 85Memory Available 97Memory Detail View
Sybase 28Memory Freed 97Memory Health Index 73Memory Performance Category View
Statistics 21Memory Tab 95, 123Modify Conflicts 48
NNetwork Contention Rate 16, 53, 70Network Delays 20, 54, 70Network Details 99Network Errors 69Network Performance Category View
Statistics 68Network Queue Length 88Network Requests 20, 54, 70New Pages Allocated 23Number of Logins 91Number of Processes 91
OObject Detail Tab 41Objects Accessed 101Objects Health Index 73Operating System Limit 50Operating System Statistics 84Operating System View 83Options Tab
Sybase 46OS Detail 91OS Drill Down 91OS Statistics 84OS View
Processor 86Processor Speed 86
Outbound Packet Errors 99Outbound Packets Discarded 99Outstanding Disk I/Os 31
PPacket Collisions 99Packet Discard 99Packet Discards 99Packet Errors 99Packets Received/Sec 99
EMBARCADERO TECHNOLOGIES > EMBARCADERO PERFORMANCE CENTER 2.5 EXPERT GUIDE: SYBASE 135
INDEX >
Packets Sent/Sec 99Page Activity Tab 29Page Faults/Sec 87Page Replacements 97Paged In 95Paged Memory Used 86Paged Out 95Pages Input/Sec 95Pages Output/Sec 95Paging Activity 95Partition 98Performance Analyst for Oracle Statistics
OS Page 84Available Paged Memory 89Available Physical Memory 88Available Swap Memory 89Average Disk Queue Length 87Disk Time 86Free Disk Space 90Load Average 86Network Output Queue Length 88Network Queue Length 88Number of Logins 91Number of Processes 91OS Detail
CPU Tab 91CPU Events Context
Switches/Sec 93CPU Events Interrupts/Sec 92CPU Utilization 92CPU Utilization % Privileged
Time 92CPU Utilization % User
Time 92Processor Queue Length 93
I/O Tab 94Memory Tab 95
Cache Efficiency 97Cache Efficiency Copy Read
Hits % 97Cache Efficiency Data Map
Hits % 97Cache Efficiency MDL Read
Hits % 97Cache Efficiency Pin Read Hits
% 98Paging Activity 95Paging Activity Pages
Input/Sec 95Paging Activity Pages
Output/Sec 95Network Tab 99
Processes Tab 93Space Tab 98
Page Faults/Sec 87Paged Memory Used 86Processor Queue Length 88Processor Time 85Swap Memory Used 87Top CPU Process 91Top I/O Process 91Top Memory Process 90Total Disk Space 90Total Paged Memory 89Total Physical Memory 89Total Swap Memory 89Used Disk Space 90
Pin Read Hits % 98Procedure Cache Activity 24Procedure Cache Allocations 27Procedure Cache Hit Rate 13Procedure Reads from Disk 25Procedure Removals 26Procedure Requests 25Procedure Writes to Disk 25Processes Tab 93
Sybase 63Processor Queue Length 93Processor Time 85
RReceived (KB/Sec) 99Requested Disk I/Os 30Rollback Segments Accessed 101Rows Deleted 60Rows Inserted 59Rows Updated 60Rows Updated (Data Locks Only) 60
SSegment Detail 45Segment Detail Tab 39Sent (KB/Sec) 99Server Configuration Limit 49Server I/O Busy Rate
Sybase 31Session Contention Tab 100Session Detail View
Oracle 99SQL Server 103Sybase 109
Session I/O Tab 100Session Leaders
SybaseCPU 62I/O 32, 61Memory 27, 61
Session Memory Tab 100Session Network Tab 102Session Objects Tab
Oracle 101Session SQL Tab 102Session Statistics Tab 102
EMBARCADERO TECHNOLOGIES > EMBARCADERO PERFORMANCE CENTER 2.5 EXPERT GUIDE: SYBASE 136

INDEX >
Solaris 84Space Detail View
Sybase 38Space Health Index 73Space Performance Category View
Statistics 36Space Tab 98Storage Tab 45Suspect Databases 42Suspect Objects 42Suspect Objects Tab 42Suspect Pages 42Swap Memory Used 87Sybase Expert Guide 10System Calls/Sec 93
TTable Demographics 43Table Statistics Tab 43Top CPU Process 91Top I/O Process 91Top Memory Process 90Top Sessions View 122
DB2CPU Tab 132I/O Tab 129Memory Tab 125
OracleCPU Tab 131I/O Tab 126Memory Tab 123
SQL ServerCPU Tab 131I/O Tab 127Memory Tab 123
SybaseCPU Tab 131I/O Tab 128Memory Tab 124
Total Bytes Received 69
Total Bytes Sent 69Total Connections
Sybase 18Total Disk Queue 95Total Disk Space 90Total Packets Received 69Total Packets Sent 69Total Paged Memory 89Total Physical Memory 89Total Rows Affected 61Total Server Reads
Sybase 17Total Server Writes
Sybase 17Total Swap Memory 89Transaction Log Allocations 31–32Transaction Log Writes 17, 31–32Transactions Tab 67Transfer Rate 95Transmission Queue Length 99Transmission Rate
Bytes 99Packets 99
Txn Log Writes 17
UULC Flushes 59Unix 84Used Disk Space 90Users Blocked
Sybase 58Users Detail View
Sybase 62Users Health Index 73Users Performance Category View
Statistics 57
WWindows 84
EMBARCADERO TECHNOLOGIES > EMBARCADERO PERFORMANCE CENTER 2.5 EXPERT GUIDE: SYBASE 137

INDEX >
EMBARCADERO TECHNOLOGIES > EMBARCADERO PERFORMANCE CENTER 2.5 EXPERT GUIDE: SYBASE 138