Embarcadero® DB Optimizer™ 1.5 SQL Profiler User...
31
Embarcadero® DB Optimizer™ 1.5 SQL Profiler User Guide
Transcript of Embarcadero® DB Optimizer™ 1.5 SQL Profiler User...

Embarcadero® DB Optimizer™ 1.5 SQL Profiler User Guide

Copyright © 1994-2009 Embarcadero Technologies, Inc.
Embarcadero Technologies, Inc. 100 California Street, 12th FloorSan Francisco, CA 94111 U.S.A.All rights reserved.
All brands and product names are trademarks or registered trademarks of their respective owners. This software/documentation contains proprietary information of Embarcadero Technologies, Inc.; it is provided under a license agreement containing restrictions on use and disclosure and is also protected by copyright law. Reverse engineering of the software is prohibited.
If this software/documentation is delivered to a U.S. Government Agency of the Department of Defense, then it is delivered with Restricted Rights and the following legend is applicable:
Restricted Rights Legend Use, duplication, or disclosure by the Government is subject to restrictions as set forth in subparagraph (c)(1)(ii) of DFARS 252.227-7013, Rights in Technical Data and Computer Software (October 1988).
If this software/documentation is delivered to a U.S. Government Agency not within the Department of Defense, then it is delivered with Restricted Rights, as defined in FAR 552.227-14, Rights in Data-General, including Alternate III (June 1987).
Information in this document is subject to change without notice. Revisions may be issued to advise of such changes and additions. Embarcadero Technologies, Inc. does not warrant that this documentation is error-free.

>
EMBARCADERO TECHNOLOGIES > EMBARCADERO® DB OPTIMIZER™ 1.5 SQL PROFILER USER GUIDE 1
Using Profiling . . . . . . . . . . . . . . . . . . . . . . . . . . . . . . . . . . . . . . . . . . . . . . . . . . . . . . . . . . . . . . . . . . . . . . . . . . . . . . . . 2
Understanding the Interface . . . . . . . . . . . . . . . . . . . . . . . . . . . . . . . . . . . . . . . . . . . . . . . . . . . . . . . . . . . . . . . . . . . 2
Running a Profiling Session . . . . . . . . . . . . . . . . . . . . . . . . . . . . . . . . . . . . . . . . . . . . . . . . . . . . . . . . . . . . . . . . . . . 4
Execute a Profiling Session . . . . . . . . . . . . . . . . . . . . . . . . . . . . . . . . . . . . . . . . . . . . . . . . . . . . . . . . . . . . . . . . 4
Working with Session Results. . . . . . . . . . . . . . . . . . . . . . . . . . . . . . . . . . . . . . . . . . . . . . . . . . . . . . . . . . . . . . . 6
Save Profiling Sessions . . . . . . . . . . . . . . . . . . . . . . . . . . . . . . . . . . . . . . . . . . . . . . . . . . . . . . . . . . . . . . . . . . 19
. . . . . . . . . . . . . . . . . . . . . . . . . . . . . . . . . . . . . . . . . . . . . . . . . . . . . . . . . . . . . . . . . . . . . . . . . . . . . . . . . . . . . 20
Import Statements to Tuning. . . . . . . . . . . . . . . . . . . . . . . . . . . . . . . . . . . . . . . . . . . . . . . . . . . . . . . . . . . . . . . 20
Using Other Profiling Commands . . . . . . . . . . . . . . . . . . . . . . . . . . . . . . . . . . . . . . . . . . . . . . . . . . . . . . . . . . . 20
Configuring Profiling . . . . . . . . . . . . . . . . . . . . . . . . . . . . . . . . . . . . . . . . . . . . . . . . . . . . . . . . . . . . . . . . . . . . . . . . 22
Configuring DBMS Properties and Permissions . . . . . . . . . . . . . . . . . . . . . . . . . . . . . . . . . . . . . . . . . . . . . . . . 22
Building Launch Configurations . . . . . . . . . . . . . . . . . . . . . . . . . . . . . . . . . . . . . . . . . . . . . . . . . . . . . . . . . . . . 25

USING PROFILING > UNDERSTANDING THE INTERFACE
Using ProfilingProfiling continuously samples the data source to build a statistical model of the load on the database. Profiling can be used to locate and diagnose problematic SQL code and event-based bottlenecks. Additionally, profiling enables you to investigate execution and wait time event details for individual stored routines. Results are presented in the profiling editor, which enables users to identify problem areas and subsequently drill down to individual, problematic SQL statements.
For details on working with profiling, see the following topics:
Understanding the Interface
Running a Profiling Session
Configuring Profiling
Understanding the InterfaceThe profiling interface is divided into three major parts:
EMBARCADERO TECHNOLOGIES > EMBARCADERO® DB OPTIMIZER™ 1.5 SQL PROFILER USER GUIDE 2

USING PROFILING > UNDERSTANDING THE INTERFACE
• The Load Graph is located on the top section of the editor and provides a display of the overall load on the system. The bars represent individual aspects of the enterprise, and the view can be used to find bottlenecks.
• Top Activity is located on the middle section of the editor and displays where the load originates. Specifically, the top SQL statements, top events that the database spends time in, as well as the top activity sessions.
• The Profiling Details View is located on the bottom section of the editor and displays detailed information on any item selected in the middle section. For example, a SQL statement, an Event, or a Session.
The graphical portion of the profiling editor presents the distribution of sessions executed over the length of the profiling process, and those that were waiting in DBMS-specific events. It provides a first and most important step in identifying problem areas. Results can be viewed in real-time.
EMBARCADERO TECHNOLOGIES > EMBARCADERO® DB OPTIMIZER™ 1.5 SQL PROFILER USER GUIDE 3

USING PROFILING > RUNNING A PROFILING SESSION
The Load Graph and Top Activity Section compose one view in the editor, while the Profiling Details view is a separate interface component that only activates when an item in the Top Activity Section is specified.
Note: It is recommended you use a 1280 x 1024 monitor resolution when viewing profiling information. Smaller resolution sizes can obscure details in the view.
Running a Profiling SessionProfiling provides the continuous monitoring of a data source and builds a statistical model based of database load based on the users state every second. The created profile can then be saved to file, and the data can be saved, analyzed, and optimized by importing statements into the tuning component and running a tuning job.
The following list provides the general workflow and overhead tasks, when attempting to monitor data sources and store query information.
1 Execute a Profiling Session
2 Working with Session Results
3 Save Profiling Sessions
4 Import Statements to Tuning
In addition to the workflow tasks outlined above, the profiling interface also enables a number of important functions to help in statement analysis and diagnosis. This additional, or extra, functionality can be found in Using Other Profiling Commands.
Furthermore, in some cases you will need to configure system variables and parameters in order to get the results you need from the application. See Configuring DBMS Properties and Permissions for more information on how to configure profiling and your registered data sources prior to running a session.
Execute a Profiling SessionProfiling is monitored and managed via profiling’s three major interface components: the Load Chart, Top Activity Section, and Profiling Details view.
EMBARCADERO TECHNOLOGIES > EMBARCADERO® DB OPTIMIZER™ 1.5 SQL PROFILER USER GUIDE 4

USING PROFILING > RUNNING A PROFILING SESSION
To execute a profiling session:
1 In Data Source Explorer, right click on the data source you want to profile and select Profile As from the menu, and then choose Data Source. The profiling session begins. Additionally, clicking the Profiling icon on the Toolbar automatically runs a profiling session for the last data source you selected.
Once a profiling session launches, it runs until you stop it. When a session has run for a length of time, you can then interpret and analyze the results. See Working with Session Results.
To stop a profiling session:
You can stop a profiing session at any time by clicking the Stop icon in the upper left-hand side of the screen.
EMBARCADERO TECHNOLOGIES > EMBARCADERO® DB OPTIMIZER™ 1.5 SQL PROFILER USER GUIDE 5
USING PROFILING > RUNNING A PROFILING SESSION
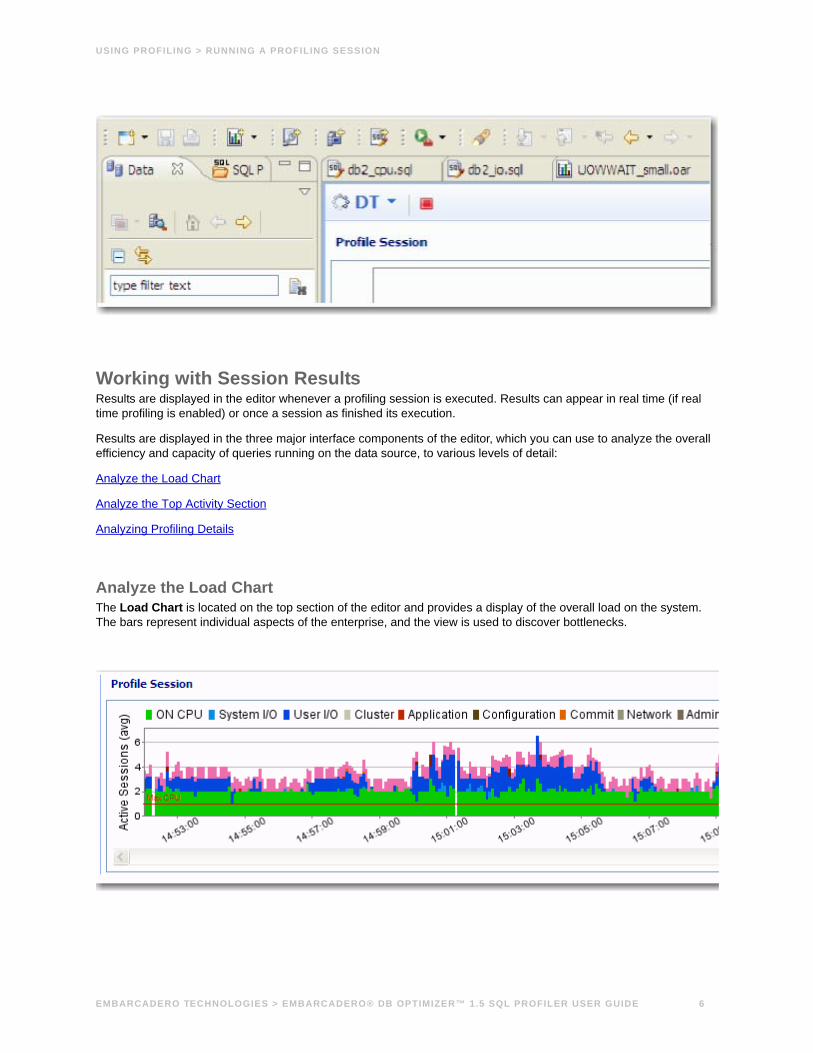
Working with Session ResultsResults are displayed in the editor whenever a profiling session is executed. Results can appear in real time (if real time profiling is enabled) or once a session as finished its execution.
Results are displayed in the three major interface components of the editor, which you can use to analyze the overall efficiency and capacity of queries running on the data source, to various levels of detail:
Analyze the Load Chart
Analyze the Top Activity Section
Analyzing Profiling Details
Analyze the Load ChartThe Load Chart is located on the top section of the editor and provides a display of the overall load on the system. The bars represent individual aspects of the enterprise, and the view is used to discover bottlenecks.
EMBARCADERO TECHNOLOGIES > EMBARCADERO® DB OPTIMIZER™ 1.5 SQL PROFILER USER GUIDE 6

USING PROFILING > RUNNING A PROFILING SESSION
The graph is designed as a high level entry point to profile session results. Subsequently, you can use the Top Activity and Details views to examine more detailed information on waiting and executing sessions over the length of the session. Alternatively, you can select one or more bars on the graph to populate the Top Activity section (and subsequently, the Details View) with information on a specific subset of the graph.
The Load Chart displays the distribution of waiting and executing sessions over the length of a profiling session.
• Time is displayed on the X axis. You can zoom in and zoom out on the graph via the icons in the upper right hand corner of the graph, once a profiling session is stopped.
• The Y axis shows the average number of sessions waiting or executing. Each supported platform has a specific set of wait event times.
• A chart legend displays a color and code scheme for executing and waiting session categories, in the upper right-hand corner of the view.
Analyze the Top Activity SectionThe Top Activity Section is located in the middle section of the editor and displays where the load originates. Specifically, the top SQL statements, top events that the database spends time in, as well as the top activity sessions.
The Top Activity Section is composed of a series of tabs that provide detailed statistics on individual SQL statements and sessions that were waiting or executing over the length of a profiling session.
• The SQL Tab provides more detailed information than provided on the Overview tab, in terms of executing SQL statements and procedures.
DBMS Wait Event Category
IBM DB2 Fetch, Cursor, Execution, Operation, Transaction, Connectivity, Lock, Other
Oracle On CPU, System I/O, User I/O, Cluster, Application, Configuration, Commit, Other
SQL Server CPU, Lock, Memory, Buffer, I/O, Other
Sybase CPU, Lock, Memory, I/O, Network, Other
EMBARCADERO TECHNOLOGIES > EMBARCADERO® DB OPTIMIZER™ 1.5 SQL PROFILER USER GUIDE 7

USING PROFILING > RUNNING A PROFILING SESSION
• The Events Tab displays information about wait events profiled by the execution process.
• The Sessions Tab displays information about sessions profiled by the execution process.
• The I/O Tab is Oracle-specific and will not appear in the Top Activity Section unless the data source being profiled is an Oracle platform. This tab displays information about the I/O profiled by the execution process.
When you select any item from the Top Activity tabs, details are displayed in the Profiling Details view. Depending on the nature of the Top Activity item that you selected, the tabs that compose the Profiling Details view will change to reflect that item’s specific session information.
Note: When right-clicking on a SQL statement in the Top Activity Section in Profiling, if the SQL statement is run by a different user than the user who is running DBO, than the User Mismatch dialog appears, with an example of the following message: “This query was executed by [SOE] and you are currently connected as [system]. We recommend you reconnect as [SOE] to tune the SQL. Would you like to continue anyway?” This message indicates that the statement is being tuned by a user other than the user who originally ran the query, and tables may be missing based on the different schemas. Click OK to run the query, or click Cancel and run tuning under the original user.
SQL TabThe Profile editor’s SQL tab shows a representation of all SQL statements that are executing or waiting to execute over the length of the profiling session or within the currently selected graph bars.
Statements can be grouped by type by right-clicking the view and selecting Organize > By Type. The following statement types are organized:
INSERT, SELECT, DELETE, and UPDATE
TIP: Statements are grouped when they differ only by their clause values. This enables the roll-up of SQL statements that only differ by a variable value. For example: select * from emp where empno=1; and select * from emp where empno=2. A ‘+’ symbol appears beside rollup statements. You can click the symbol to expand and view the different statement predicates.
Additionally, the SQL tab displays two other groupings:
Group Description
OTHER Includes all recognized statements other than INSERT, SELECT, UPDATE, and DELETE statements.
EMBARCADERO TECHNOLOGIES > EMBARCADERO® DB OPTIMIZER™ 1.5 SQL PROFILER USER GUIDE 8

USING PROFILING > RUNNING A PROFILING SESSION
All statements are displayed in a tree structure with the following statement components:
For example, all statements with common subjects are shown as a single entry with multiple children; one child for each unique predicate. Predicates are similarly broken down by remainders.
Note: Right-clicking in the SQL tab and selecting Organize By lets you choose between Statement Type grouping and None. The None option disables grouping by statement.
Statistics are provided at each level of the tree structure. This lets you evaluate costs and spot wait event problems not just at the level of entire SQL statements, but also at the level of statement components. For each subject, predicate or remainder entry, the following statistics are provided:
Other values displayed on this tab differ depending on the data source platform. For example, the tab displays the values SQL ID, Child Number, Parsing User ID, and Plan Hash Value when analyzing a data source.
Additionally, DB2 platforms have an additional tab named Execution Activity, which contains the following statistical rows: Rows Read, Rows Written, Fetch Count, Statement Sorts, Sort Time, and Sort Overflows.
Events TabThe Event tab displays information about wait events on the resources involved in the profiling process. This display is used to tune at the application or database configuration level. For example, if the top events are locks, then application logic needs to be examined. If top events are related to database configuration, then database setup should be investigated.
UNKNOWN Statements that are not recognized by the application.
Statement Component Description
Subject The DML statement type (and FROM clause, as appropriate).
Predicate The WHERE clause.
Remainder Any statement component following the WHERE clause.
Statistic Notes
Executions The number of active executions for the statement or statement component over the length of the profiling session or the selected graph bars.
Activity (%) A graphical representation of the distribution of execution and wait time for the statement or statement component.
SQL ID The ID value of the SQL statement. This statistic only appears on Oracle data sources.
Child Number The child number in the database. This statstic only appears on Oracle data sources.
Parsing User ID The ID of the user who parsed the statement. This statsitc only appears on Oracle data sources.
Plan Hash Value The execution value of the statement. This statistic only appears on Oracle data sources.
Group Description
EMBARCADERO TECHNOLOGIES > EMBARCADERO® DB OPTIMIZER™ 1.5 SQL PROFILER USER GUIDE 9

USING PROFILING > RUNNING A PROFILING SESSION
Sessions TabThe Sessions Tab provides information about individual sessions. This tab provides information about sessions that are very active or bottlenecked.
I/O Tab
The I/O Tab is specific to the Oracle data source platform, and displays information about Oracle I/O loads on the profiled data source.
EMBARCADERO TECHNOLOGIES > EMBARCADERO® DB OPTIMIZER™ 1.5 SQL PROFILER USER GUIDE 10

USING PROFILING > RUNNING A PROFILING SESSION
The following parameters are displayed on the I/O tab:
Analyzing Profiling DetailsThe Profiling Details view displays detailed information on any item selected in the Top Section View. For example, a SQL statement, an Event, or a Session.
Value Description
Object The name of the data source object affecting the Oracle I/O.
Type The object type. For example, table, partition, or index.
DB Activity (%) Use the color chart on the right-hand side of the I/O tab to view the I/O load on the data source during the profiling session.
Tablespace The name of the tablespace where the object resides.
File ID The unique ID value of the file from where specified object resides.
EMBARCADERO TECHNOLOGIES > EMBARCADERO® DB OPTIMIZER™ 1.5 SQL PROFILER USER GUIDE 11

USING PROFILING > RUNNING A PROFILING SESSION
Depending on the data source platform you have specified, the tabs that appear in the view will be different, in order to accommodate the parameter specifics of the statement you have selected.
Viewing Details on the SQL Tab
Viewing Details on the Sessions Tab
Viewing Details on the Events Tab
Viewing Details on the SQL TabIn the Top Activity Session, selecting a statement entry on the SQL tab displays information in the Details view. The graph portion and details on the event category tabs on the new editor pertain only to the selected statement. Additionally, new tabs become available:
• The SQL Text tab shows the full code of the SQL statement.
• The Events tab displays information about the events the selected statement is associated with.
• The Sessions tab displays information about the sessions that the selected statement is associated with. This tab is only displayed for Oracle data sources.
• The SQL Details tab displays execution details. This tab is only displayed for Oracle data sources.
SQL TextThe SQL Text tab displays the full code of the SQL statement.
EMBARCADERO TECHNOLOGIES > EMBARCADERO® DB OPTIMIZER™ 1.5 SQL PROFILER USER GUIDE 12

USING PROFILING > RUNNING A PROFILING SESSION
EventsThe Events tab provides details about the events that the statement is associated with.
SQL DetailsThe SQL Details tab provides information and the execution of the statement and other information related to how it is running. It is only applicable to Oracle data sources:
EMBARCADERO TECHNOLOGIES > EMBARCADERO® DB OPTIMIZER™ 1.5 SQL PROFILER USER GUIDE 13

USING PROFILING > RUNNING A PROFILING SESSION
SQL Details include:
SessionsThe Sessions tab provides information about any sessions the statement is associated with:
Session details include information on different parameters, depending on the platform. For example, on Oracle platforms, the following paramters are displayed: User Name, Program, SID, Serial #, Activity (%), Network Machine Name, and Session Type.
To select a SQL tab statement entry:• On the SQL tab, click on a statement with no child nodes or on a leaf node in the statement structure.
The new profiling editor page opens, as reflected by the breadcrumb trail at the top left of the editor. You can continue to drill down into the statement, as needed.
Parameters Description
SQL Identification Values The SQL ID valuie of the statement.
Optimizer and Outline Values Optimizer-specific values pertaining to the parsing user ID value and outline SID.
Parsing Statistics Information regarding memory, loads, and invalidation values.
Execution Statistics The execution statistics of the statement. This category includes disk reads, buffer gets, rows, and values that represent CPU and elapsed time.
EMBARCADERO TECHNOLOGIES > EMBARCADERO® DB OPTIMIZER™ 1.5 SQL PROFILER USER GUIDE 14
USING PROFILING > RUNNING A PROFILING SESSION
Viewing Details on the Sessions TabIn the Top Activities Section, selecting a statement entry on the Sessions tab displays information in the Details view. The graph portion and details on the event category tabs on the new editor pertain only to the selected statement. Additionally, new tabs become available.
Selecting an event type entry on an event category tab opens a new profiling editor page. The graph portion and details on the Sessions tab and event category tabs on the new editor page pertain only to the selected wait event and to SQL statements that waited in that event.
The Sessions tab shows system details about the selected session.
The SQL tab displays information about the SQL files that the selected session is associated with. This tab only appears on Oracle platforms.
The Events tab displays the time and parameter information about the selected session.
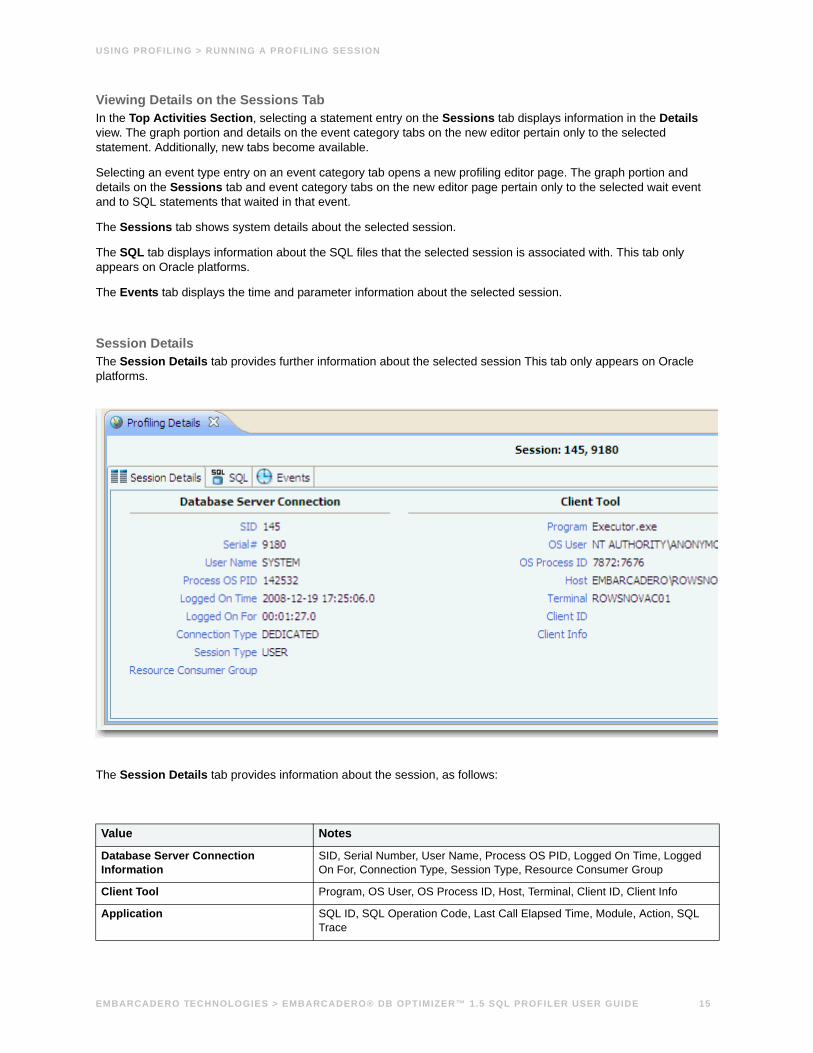
Session DetailsThe Session Details tab provides further information about the selected session This tab only appears on Oracle platforms.
The Session Details tab provides information about the session, as follows:
Value Notes
Database Server Connection Information
SID, Serial Number, User Name, Process OS PID, Logged On Time, Logged On For, Connection Type, Session Type, Resource Consumer Group
Client Tool Program, OS User, OS Process ID, Host, Terminal, Client ID, Client Info
Application SQL ID, SQL Operation Code, Last Call Elapsed Time, Module, Action, SQL Trace
EMBARCADERO TECHNOLOGIES > EMBARCADERO® DB OPTIMIZER™ 1.5 SQL PROFILER USER GUIDE 15

USING PROFILING > RUNNING A PROFILING SESSION
SQLThe SQL tab displays information about the statements associated with the session.
SQL statements are listed by the following parameters:
EventsThe Events tab provides details about the events that the session is associated with.
Value Notes
Statement Name The name of the statement.
Executions The number of times the statement was executed during the session.
Activity (%) A graphical representation of the distribution of execution and wait time for the statement or statement component.
SQL ID The SQL ID value of the statement.
Child Number The child number in the database.
Parsing User ID The ID of the user who parsed the statement.
Plan Hash Value The execution value of the statement.
EMBARCADERO TECHNOLOGIES > EMBARCADERO® DB OPTIMIZER™ 1.5 SQL PROFILER USER GUIDE 16

USING PROFILING > RUNNING A PROFILING SESSION
Events are listed by the following values:
Viewing Details on the Events TabIn the Top Activities Section, selecting a statement entry on the Event tab displays information in the Details view. The graph portion and details on the event category tabs on the new editor pertain only to the selected statement. Additionally, new tabs become available.
Selecting an event type entry on an event category tab opens a new profiling editor page. The graph portion and details on the Event tab and event category tabs on the new editor page pertain only to the selected wait event and to SQL statements that waited in that event.
The SQL tab shows the statements involved in the selected event.
The Sessions tab displays information about the sessions that the selected event is associated with.
SQLThe SQL tab displays information about the SQL statements involved in the selected event.
Value Notes
Event Name The name of the event.
Activity (%) A graphical representation of the distribution of execution and wait time for the statement or statement component.
EMBARCADERO TECHNOLOGIES > EMBARCADERO® DB OPTIMIZER™ 1.5 SQL PROFILER USER GUIDE 17

USING PROFILING > RUNNING A PROFILING SESSION
The SQL tab displays the following parameters:
SessionsThe Sessions tab displays the sessions and related information regarding those that were associated with the selected event.
Value Notes
Statement The name of the statement.
Executions The number of times the statement was executed.
Activity (%) A graphical representation of the distribution of execution and wait time for the statement or statement component.
SQL ID The ID value of the SQL statement.
Child Number The child number in the database.
Parsing User ID The ID of the user who parsed the statement.
Plan Hash Value The execution value of the statement.
EMBARCADERO TECHNOLOGIES > EMBARCADERO® DB OPTIMIZER™ 1.5 SQL PROFILER USER GUIDE 18

USING PROFILING > RUNNING A PROFILING SESSION
The following parameters are displayed on the Sessions tab:
Save Profiling SessionsA profiling session can be saved in the current workspace in an archive file with a .oar suffix and with a default file name of:
• The name of the data source if the session was not initiated from a named launch configuration
• The name of the launch configuration if the session was initiated from a named launch configuration
The time period of the saved session is the amount of data on the chart. The maximum amount of data on the chart is determined when profiling is started (1 hour default).
Value Notes
User Name The user name under which the session was run.
Program The name of the executable under which the session was run.
SID The SID value of the session.
Serial Number The serial number of the machine from which the session executed.
Activity (%) A graphical representation of the distribution of execution and wait time for the statement or statement component.
Machine The machine name and network location of the machine from which the session executed.
Session Type The type of session.
EMBARCADERO TECHNOLOGIES > EMBARCADERO® DB OPTIMIZER™ 1.5 SQL PROFILER USER GUIDE 19
USING PROFILING > RUNNING A PROFILING SESSION
This lets you open the archive at a later time for subsequent analysis. Use standard DB Optimizer file techniques to save, open, or close SQL Profiling archives.
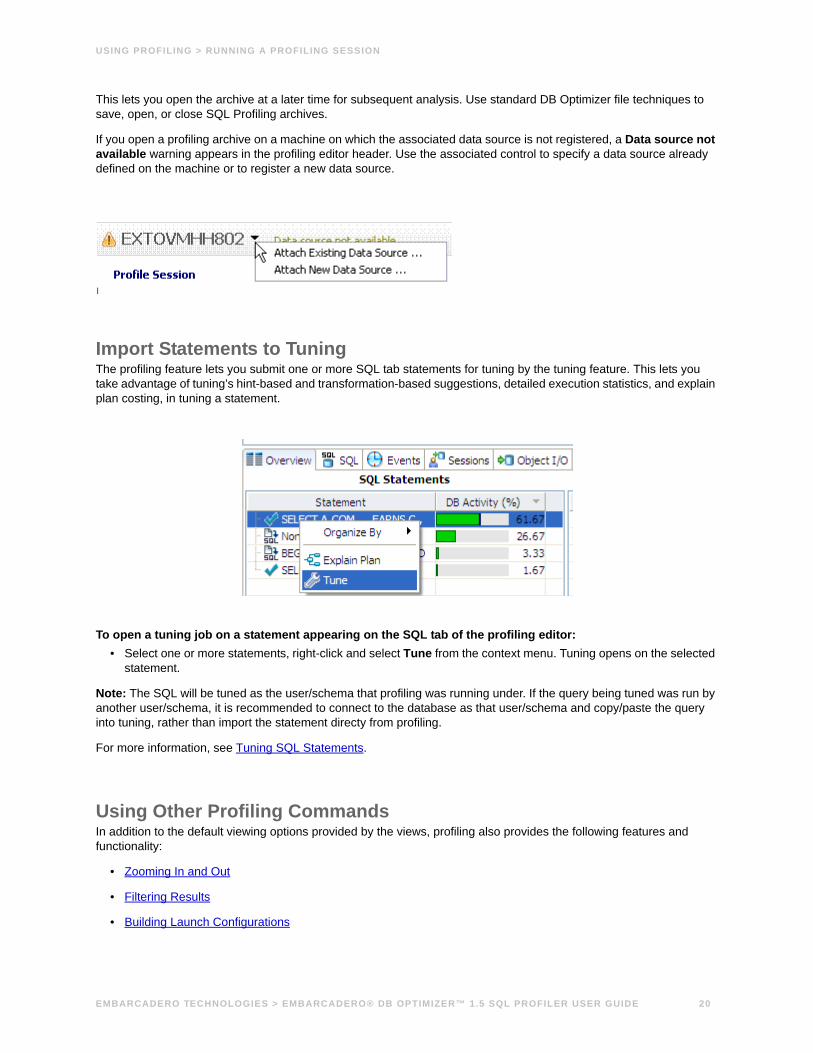
If you open a profiling archive on a machine on which the associated data source is not registered, a Data source not available warning appears in the profiling editor header. Use the associated control to specify a data source already defined on the machine or to register a new data source.
Import Statements to TuningThe profiling feature lets you submit one or more SQL tab statements for tuning by the tuning feature. This lets you take advantage of tuning’s hint-based and transformation-based suggestions, detailed execution statistics, and explain plan costing, in tuning a statement.
To open a tuning job on a statement appearing on the SQL tab of the profiling editor:• Select one or more statements, right-click and select Tune from the context menu. Tuning opens on the selected
statement.
Note: The SQL will be tuned as the user/schema that profiling was running under. If the query being tuned was run by another user/schema, it is recommended to connect to the database as that user/schema and copy/paste the query into tuning, rather than import the statement directy from profiling.
For more information, see Tuning SQL Statements.
Using Other Profiling CommandsIn addition to the default viewing options provided by the views, profiling also provides the following features and functionality:
• Zooming In and Out
• Filtering Results
• Building Launch Configurations
EMBARCADERO TECHNOLOGIES > EMBARCADERO® DB OPTIMIZER™ 1.5 SQL PROFILER USER GUIDE 20

USING PROFILING > RUNNING A PROFILING SESSION
Zooming In and Out
To zoom in or out on the Load Graph:• In the upper right-hand corner of the Load graph, click the Zoom In or Zoom Out icons, respectively.
Note: The Zoom In and Zoom Out commands are only available when a session has been stopped.
By default, the information contained on the Load Chart spans the entire length of the profiling session. You can select one or more bars of the graph to have the tabbed view populated with statistics for only the selected subset of the graph.
To display statistics for one or more bars on the graph, use one of the following methods:• Click-drag across one or more bars.
Filtering ResultsYou can display filtered subsets of the original profiling results set for each section of profiling based on DBMS platform type:
• IBM DB/2 for WIndows, Unix, and Linux - Creator ID, Cursor Name, Package Name, and Statement Type
• Microsoft SQL Server - Application Name, Command, Database Name, and Hostname
• Oracle - Action Hash, Module Hash, and Program
• Sybase - Application, Database ID, Host, IP Address, and Process priority
You filter results using the filter controls in the upper, right-hand part of the profiling editor.
Additionally, on Oracle platforms, you can filter results by user, or foreground, or background activity. Select All, User (Foreground), or Background to filter out the specified process activity, respectively.
EMBARCADERO TECHNOLOGIES > EMBARCADERO® DB OPTIMIZER™ 1.5 SQL PROFILER USER GUIDE 21

USING PROFILING > CONFIGURING PROFILING
To filter profile editor results:1 Use the Filter By menu to select a filter type. The second menu becomes active based on your selection in the
first menu.
2 Use the second menu to specify a value.
The profiling editor is updated to show only results associated with your choice.
TIP: Select -None- from the Filter by dropdown to restore the unfiltered results.
Configuring ProfilingConfiguring DBMS Properties and Permissions
Building Launch Configurations
Configuring DBMS Properties and PermissionsProfiling supports the following DBMS platforms:
• IBM DB/2 for WIndows, Unix, and Linux
• Microsoft SQL Server
• Oracle
• Sybase
Select a platform below for more information regarding how to set up a platform to utilize Optimizer:
• Configuring IBM DB/2 for Windows, Unix, and Linux
• Configuring Microsoft SQL Server
• Configuring Oracle
• Configuring Sybase
Configuring IBM DB/2 for Windows, Unix, and LinuxBy default, DB2 Monitor flags are set to OFF. As a result, when attempting to launch a Profile job on a DB2 data source, users may encounter the following message: “One or more errors have occured that prevent session profiling against this data source. Examine the details below and consult your data source administrator and/or the data source documentation to resolve the problem(s).”
You can resolve this error using one of two methods:
• Enabling DB2 Monitor Flags via Embarcadero DBArtisan
• Command Line Option
To resolve the error through DBArtisan:1 Ensure the following DB2 Monitor Flags are turned on in DB2:
• dft_mon_uow
• dft_mon_uow
EMBARCADERO TECHNOLOGIES > EMBARCADERO® DB OPTIMIZER™ 1.5 SQL PROFILER USER GUIDE 22

USING PROFILING > CONFIGURING PROFILING
• dft_mon_stmt
• dft_mon_timestamp
• dft_mon_lock
• dft_mon_bufpool
• dft_mon_table
You can set view and set Monitor Flags via DBArtisan. Ensure that the New Value field for each variable is set to Yes, as shown below.
2 Restart the DB2 data source to enable the changes, then launch DB Optimizer and begin profiling.
To resolve the error through the command line:This solution must be performed from DB2 CLP, on the DB2 server. If you attempt to perform these tasks through a client, an error message will result.
1 Navigate to START/PROGRAMS/IBM DB2/COMMAND LINE TOOLS/COMMAND LINE PROCESSOR
2 Turn the monitor switches on using the following commands:
db2 update dbm cfg using dft_mon_lock on dft_mon_bufpool on dft_mon_sort on dft_mon_stmt on dft_mon_table on dft_mon_uow ondb2stopdb2start
3 Ensure that the switches are turned on by connecting to the server with the following command:
Db2 connect to database username password password
The following screen provides an example of the input and output from the server:
EMBARCADERO TECHNOLOGIES > EMBARCADERO® DB OPTIMIZER™ 1.5 SQL PROFILER USER GUIDE 23

USING PROFILING > CONFIGURING PROFILING
Configuring Microsoft SQL ServerPerform the following tasks to ensure that SQL Server is compatible with Optimizer:
• If you are setting up SQL Server 2000 or 2005, ensure the current user is a member of sysadmin.
• If you are setting up later versions of SQL Server, the current user must meet one of the following requirements:
• Be a member of sysadmin, or have the VIEW SERVER STATE permission enabled.
• Be a member of sysadmin, or have the SELECT permission enabled.
On SQL Server 2000 only:You can enable profiling to capture more SQL by adding the following flag:
DBCC TRACEON(2861)
Trace flag 2861 instructs SQL Server to keep zero cost plans in cache, which SQL Server would typically not cache (such as simple ad-hoc queries, set statements, commit transaction, and others). In other words, the number of objects in the procedure cache increases when trace flag 2861 is turned on because the additional objects are so small, there is a slight increase in memory that is taken up by the procedure cache.
Ensure you restart the server for your changes to take affect.
Configuring OracleOracle users need access to V$ views. In order to configure Oracle to provide users with these privleges:
• If you are setting up Oracle 10 or later, ensure you are logged in as sys or system with the sysdba role, or the SELECT_CATALOG_ROLE has been granted to user_name.
• If you are setting up an earlier version of Oracle, ensure you are logged in as sys or system with the sysdba role.
Configuring SybasePerform the following tasks to ensure that Sybase is compatible with Optimizer:
EMBARCADERO TECHNOLOGIES > EMBARCADERO® DB OPTIMIZER™ 1.5 SQL PROFILER USER GUIDE 24

USING PROFILING > CONFIGURING PROFILING
• Ensure the following system configuration properties are activated:
• Enabling Monitoring (sp_configure “enable monitoring”, 1)
• Wait Event Timing (sp_configure “wait event timing”, 1)
• Max SQL Text Monitored (sp_configure “SQL batch capture”, 1)
• SQL Batch Capture (sp_configure “max SQL text monitored”, 4096)
Additionally, perform the following tasks, as necessary:
• If a user does not have mon_role enabled, the user will not be able to access Adaptive Server’s monitoring tables.
• If the monProcess table is missing, the user will not be able to view currently connected sessions.
• If the sysprocesses table is missing, the user will not be able to view information about Adaptive Server processes.
• If the monWaitEventInfo table is missing, the user will not be able to view information about wait events.
• If the monProcessSQLText table is missing, the user will not be able to view currently executing SQL statements.
Note: These packages should only be installed by the DBA.
Profiling enables you to create a set of launch configurations to store the basic properties for each profiling session that you run on a regular basis. A launch configuration enables you to start profiling sessions from a single menu command, rather than re-define configuration parameters each time you want to run one.
Building Launch ConfigurationsProfiling enables you to store parameters related to specific profiling sessions, in a launch configuration for stored routines. Multiple configurations can be created for each data source in your enterprise and saved with unique names that identify them in the application.
Note: On all supported platforms, support for stored routines includes functions and procedures. On Oracle, stored routine support also includes package functions and package procedures.
EMBARCADERO TECHNOLOGIES > EMBARCADERO® DB OPTIMIZER™ 1.5 SQL PROFILER USER GUIDE 25

USING PROFILING > CONFIGURING PROFILING
• Data Source indicates the name of the data source to which the profile applies.
• Time Interval Length indicates how long the session profiles the data source term, in the format of hours and minutes. This parameter also indicates the total width of the time load graph. The longer a profile is, the larger the saved file will be. It is not recommended to make the time interval length value beyond eight hours.
• The Show Data While Profile Session is in Progress check box enables “real time” profiling, which refreshes the data of the session as profiling runs. The Refresh Interval specifies how often profiling updates this data in seconds.
EMBARCADERO TECHNOLOGIES > EMBARCADERO® DB OPTIMIZER™ 1.5 SQL PROFILER USER GUIDE 26

USING PROFILING > CONFIGURING PROFILING
Note: Profiling can run sessions based on ad hoc parameters you designate before executing the profiling process. However, by building profile launch profiles, it is a much more efficient method of managing standard, frequent, or common profiling sessions.
To create a launch configuration:
1 Right-click on the data source you want to build a configuration for and select Profile As from the menu, then choose Open Profile Dialog. The Profile dialog appears.
2 Select the name of the data source and modify the parameters on the Profile tab, as needed.
EMBARCADERO TECHNOLOGIES > EMBARCADERO® DB OPTIMIZER™ 1.5 SQL PROFILER USER GUIDE 27
USING PROFILING > CONFIGURING PROFILING
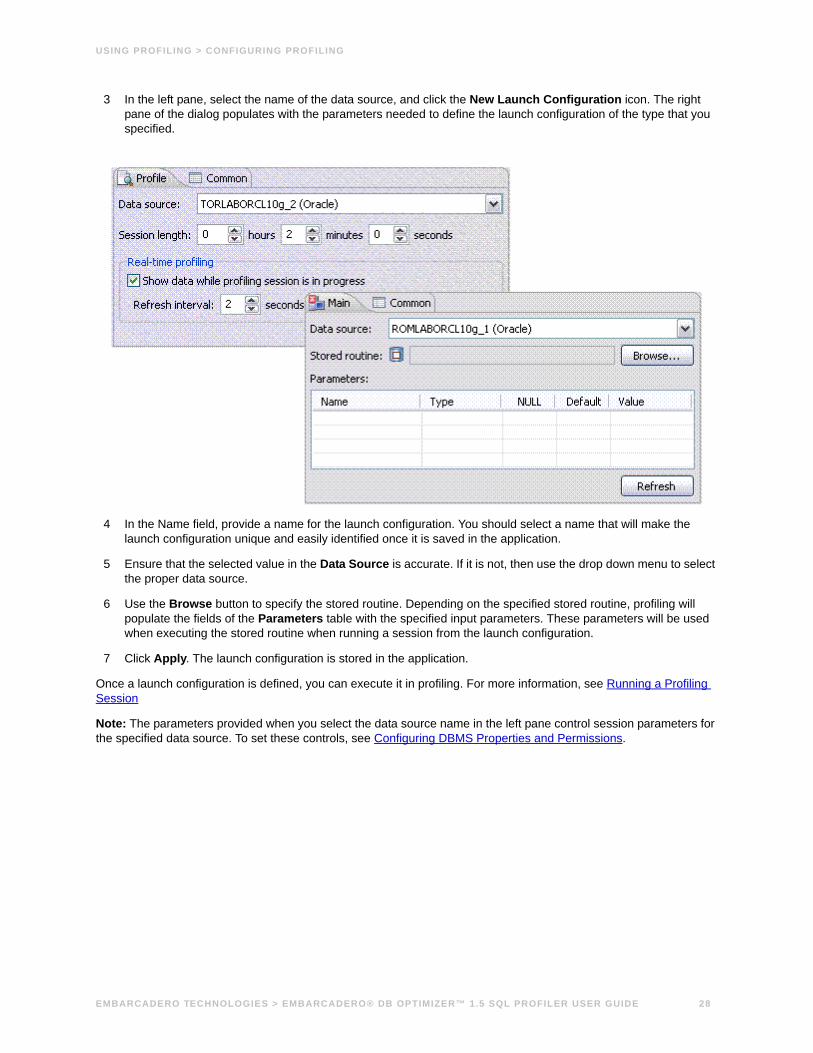
3 In the left pane, select the name of the data source, and click the New Launch Configuration icon. The right pane of the dialog populates with the parameters needed to define the launch configuration of the type that you specified.
4 In the Name field, provide a name for the launch configuration. You should select a name that will make the launch configuration unique and easily identified once it is saved in the application.
5 Ensure that the selected value in the Data Source is accurate. If it is not, then use the drop down menu to select the proper data source.
6 Use the Browse button to specify the stored routine. Depending on the specified stored routine, profiling will populate the fields of the Parameters table with the specified input parameters. These parameters will be used when executing the stored routine when running a session from the launch configuration.
7 Click Apply. The launch configuration is stored in the application.
Once a launch configuration is defined, you can execute it in profiling. For more information, see Running a Profiling Session
Note: The parameters provided when you select the data source name in the left pane control session parameters for the specified data source. To set these controls, see Configuring DBMS Properties and Permissions.
EMBARCADERO TECHNOLOGIES > EMBARCADERO® DB OPTIMIZER™ 1.5 SQL PROFILER USER GUIDE 28

>
EMBARCADERO TECHNOLOGIES > EMBARCADERO® DB OPTIMIZER™ 1.5 SQL PROFILER USER GUIDE 1
Aarchives, profiling
opening/saving 19
Ffiltering profile results 21
Ppermissions, SQL Profiler 22profiling sessions
configuring DBMS for 22filtering results 21opening/saving 19submitting tuning sessions from 20
Ttuning sessions
opening from profiling session 20


![Data Profiling Guide - start [Gerardnico] · PDF fileData Profiling Guide. Informatica PowerCenter Data Profiling Guide ... available at http:](https://static.fdocuments.us/doc/165x107/5aa4fb3a7f8b9ab4788c93d6/data-profiling-guide-start-gerardnico-profiling-guide-informatica-powercenter.jpg)