ELP 2T12 eng - copel.com · of Compagas, Elejor, UEG Araucária, Caiuá Transmissora, Costa Oeste...
24
1H12 Results Curitiba, Brazil, August 14, 2012 – Companhia Paranaense de Energia ‐ Copel (BM&FBOVESPA: CPLE3, CPLE5, CPLE6 / NYSE: ELP / LATIBEX: XCOP), a company that generates, transmits, distributes and sells power, announces its results for the 1 st half of 2012. Copel’s consolidated balance sheet presents, in addition to the figures of its wholly owned subsidiaries (Copel Geração e Transmissão, Copel Distribuição and Copel Telecomunicações), those of Compagas, Elejor, UEG Araucária, Caiuá Transmissora, Costa Oeste Transmissora, Integração Maranhense Transmissora, Marumbi Transmissora, Transmissora Sul Brasileira, Cutia Empreendimentos Eólicos and Dominó Holdings. The consolidated financial statements were prepared in accordance with International Financial Reporting Standards (IFRS) issued by the International Accounting Standards Board (IASB), and with accounting practices adopted in Brazil. Highlights Net Operating Revenue: R$ 4,056 million. Operating Income: R$ 700 million. Net Income: R$ 505 million. EPS (Earnings per Share): R$ 1.84. EBITDA (Earnings Before Interest, Taxes, Depreciation And Amortization): R$ 964 million. Return on Shareholders’ Equity: 4.2% in the period. Growth in Power Supply: 5.5% The Company’s shares and main indexes presented the following variations in the period: Price Var. % Points Var. % 06/29/2012 year 06/29/2012 year CPLE3 (common/ BM&FBovespa) R$ 38.40 16.3 CPLE6 (preferred B/ BM&FBovespa) R$ 44.20 13.6 ELP (ADS/ Nyse) US$ 21.68 3.3 DOW JONES 12,880 5.4 XCOP (preferred B/ Latibex) € 17.14 5.8 LATIBEX 2,712 (6.6) Ibovespa 54,355 (4.2) Ticker Index
Transcript of ELP 2T12 eng - copel.com · of Compagas, Elejor, UEG Araucária, Caiuá Transmissora, Costa Oeste...

1H12 Results
Curitiba, Brazil, August 14, 2012 – Companhia Paranaense de Energia ‐ Copel (BM&FBOVESPA:
CPLE3, CPLE5, CPLE6 / NYSE: ELP / LATIBEX: XCOP), a company that generates, transmits, distributes
and sells power, announces its results for the 1st half of 2012. Copel’s consolidated balance sheet presents, in addition to the figures of its wholly owned
subsidiaries (Copel Geração e Transmissão, Copel Distribuição and Copel Telecomunicações), those
of Compagas, Elejor, UEG Araucária, Caiuá Transmissora, Costa Oeste Transmissora, Integração
Maranhense Transmissora, Marumbi Transmissora, Transmissora Sul Brasileira, Cutia
Empreendimentos Eólicos and Dominó Holdings. The consolidated financial statements were
prepared in accordance with International Financial Reporting Standards (IFRS) issued by the
International Accounting Standards Board (IASB), and with accounting practices adopted in Brazil.
Highlights
Net Operating Revenue: R$ 4,056 million.
Operating Income: R$ 700 million.
Net Income: R$ 505 million.
EPS (Earnings per Share): R$ 1.84.
EBITDA (Earnings Before Interest, Taxes, Depreciation And Amortization): R$ 964 million.
Return on Shareholders’ Equity: 4.2% in the period.
Growth in Power Supply: 5.5%
The Company’s shares and main indexes presented the following variations in the period:
Price Var. % Points Var. %06/29/2012 year 06/29/2012 year
CPLE3 (common/ BM&FBovespa) R$ 38.40 16.3
CPLE6 (preferred B/ BM&FBovespa) R$ 44.20 13.6
ELP (ADS/ Nyse) US$ 21.68 3.3 DOW JONES 12,880 5.4
XCOP (preferred B/ Latibex) € 17.14 5.8 LATIBEX 2,712 (6.6)
Ibovespa 54,355 (4.2)
Ticker Index
2
Earnings Release – 1H12
LIST OF CONTENTS
1. General Information ________________________________________ 3 1.1 3rd Tariff Revision Cicle Effect ____________________________________________________________ 3
1.2 Electricity Purchased for Resale, Use of Transmission Grid and Regulatory Charges ______________________ 3
2. Income Statement __________________________________________ 4 2.1 Net Operating Revenue ________________________________________________________________ 4
2.2 Operating Costs and Expenses ____________________________________________________________ 5
2.3 EBITDA ____________________________________________________________________________ 7
2.4 Equity in Results of Investees ____________________________________________________________ 7
2.5 Financial Results _____________________________________________________________________ 7
2.6 Consolidated Net Income _______________________________________________________________ 7
3. Balance Sheet and Investment Program ________________________ 8 3.1 Assets _____________________________________________________________________________ 8
4. Shareholding Structure _____________________________________ 11
5. Consolidated Financial Statements ___________________________ 12 5.1 Assets ____________________________________________________________________________ 12
5.2 Liabilities __________________________________________________________________________ 13
5.3 Income Statement ___________________________________________________________________ 14
5.4 Cash Flow _________________________________________________________________________ 15
6. Financial Statements – Wholly‐Owned Subsidiaries ______________ 16 6.1 Assets ____________________________________________________________________________ 16
6.2 Liabilities __________________________________________________________________________ 17
6.3 Income Statement ___________________________________________________________________ 18
7. Power Market ____________________________________________ 19 7.2 Copel Distribuição’s Grid Market (TUSD) ___________________________________________________ 20
7.3 Energy Flow ________________________________________________________________________ 20
8. Supplementary Information _________________________________ 22 8.1 Tariffs ____________________________________________________________________________ 22
8.2 Main Operational and Financial Indicators __________________________________________________ 23
8.3 1H12 Results Conference Call ___________________________________________________________ 24

3
Earnings Release – 1H12
1. General Information
Copel’s net income totaled R$ 504.7 million in 1H12, down 21.4% from R$ 642.3 million in 1H11.
1.1 3rd Tariff Revision Cicle Effect
The reduction in net income is largely due to the 3rd cycle of the tariff revision, since the new regulatory remuneration base
was below the Company’s expectations due to the variation in the fair value of these assets and the non‐recognition of the
portion of investments made by Copel Distribuição between May 2008 and December 2011. The Management has filed an
administrative proceeding with Aneel requesting the recognition of this portion of investments in the asset base of the
current cycle.
In this context, Copel reduced the restatements estimated and not made in the cash flows from the portion of investments
not included in the regulatory remuneration base and are not being disputed wit Aneel, totalling R$ 152.4 million, which was
recognized in the 2Q12 results under financial expenses. Considering the effect of R$ 42.6 million arising from the change on
the useful life of energy assets proposed in Aneel Resolution 474/12, which too passed through 1Q12 results under financial
expenses, the financial assets of Copel Distribuição was reduced by R$ 195.0 million (R$ 128.7 million net of taxes) in 1H12.
1.2 Electricity Purchased for Resale, Use of Transmission Grid and Regulatory Charges (non‐manageable costs)
Another factor for the decline in net income was the rise in electricity purchased for resale, use of transmission grid and
regulatory charges. The highlight is the 25.0% increase in “electricity purchased for resale” expenses, which totaled
R$ 1,315.4 million and distributed as follows: R$ 888.8 million in CCEARs (R$ 769.7 million in 1H11), R$ 261.4 million in Itaipu
(R$ 214.2 million in 1H11), and R$ 124.0 million in CCEE (R$ 16.6 million in 1H11). The 14.0% increase in CCEAR purchases is
due to the inflation adjustment on the contracts, the market growth and the thermal dispatch (PLD) higher than the price of
thermal contracts). Purchase of energy from Itaipu increased on account of the weaker real. Finally, CCEE purchases
increased due to the sharp increase in PLD.
If the regulatory assets and liabilities were accounted for, the net effect of Compensation Account for Variations in Items
from “Portion A” (CVA) over Copel Distribuição’s results would be a positive R$ 136.9 million in 1H12 (compared to R$ 114.6
million negative in 1H11). For more details, see Note No. 35 of our ITRs.
4
Earnings Release – 1H12
2. Income Statement
2.1 Net Operating Revenue
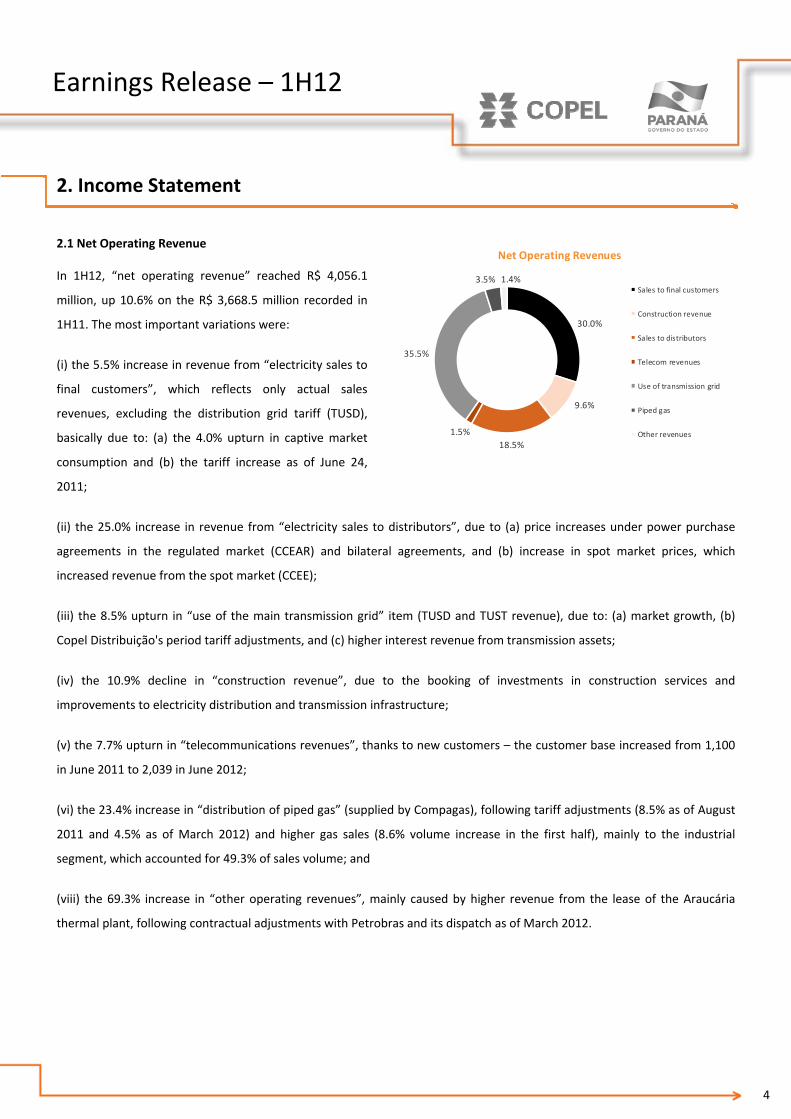
In 1H12, “net operating revenue” reached R$ 4,056.1
million, up 10.6% on the R$ 3,668.5 million recorded in
1H11. The most important variations were:
(i) the 5.5% increase in revenue from “electricity sales to
final customers”, which reflects only actual sales
revenues, excluding the distribution grid tariff (TUSD),
basically due to: (a) the 4.0% upturn in captive market
consumption and (b) the tariff increase as of June 24,
2011;
(ii) the 25.0% increase in revenue from “electricity sales to distributors”, due to (a) price increases under power purchase
agreements in the regulated market (CCEAR) and bilateral agreements, and (b) increase in spot market prices, which
increased revenue from the spot market (CCEE);
(iii) the 8.5% upturn in “use of the main transmission grid” item (TUSD and TUST revenue), due to: (a) market growth, (b)
Copel Distribuição's period tariff adjustments, and (c) higher interest revenue from transmission assets;
(iv) the 10.9% decline in “construction revenue”, due to the booking of investments in construction services and
improvements to electricity distribution and transmission infrastructure;
(v) the 7.7% upturn in “telecommunications revenues”, thanks to new customers – the customer base increased from 1,100
in June 2011 to 2,039 in June 2012;
(vi) the 23.4% increase in “distribution of piped gas” (supplied by Compagas), following tariff adjustments (8.5% as of August
2011 and 4.5% as of March 2012) and higher gas sales (8.6% volume increase in the first half), mainly to the industrial
segment, which accounted for 49.3% of sales volume; and
(viii) the 69.3% increase in “other operating revenues”, mainly caused by higher revenue from the lease of the Araucária
thermal plant, following contractual adjustments with Petrobras and its dispatch as of March 2012.
30.0%
9.6%
18.5%
1.5%
35.5%
3.5% 1.4%
Net Operating Revenues
Sales to final customers
Construction revenue
Sales to distributors
Telecom revenues
Use of transmission grid
Piped gas
Other revenues

5
Earnings Release – 1H12
R$ '000
2Q12 1Q12 2Q11 1H12 1H11 Var.%
(1) (2) (3) (4) (5) (4/5)
Electricity sales to final customers 609,906 608,182 583,534 1,218,088 1,154,709 5.5
Electricity sales to distributors 428,377 421,031 318,001 849,408 679,255 25.0
Use of main transmission grid (TUSD/ TUST) 685,898 749,078 662,336 1,434,976 1,322,129 8.5
Construction revenue 141,069 105,194 155,889 246,263 276,455 (10.9)
Telecommunications revenues 30,543 30,845 28,776 61,388 57,015 7.7
Distribution of piped gas 83,328 69,833 67,189 153,161 124,143 23.4
Other operating revenues 52,349 40,475 26,583 92,824 54,832 69.3
Net operating revenues 2,031,470 2,024,638 1,842,308 4,056,108 3,668,538 10.6
Income Statement
2.2 Operating Costs and Expenses
In the first half of 2012, operating costs and
expenses totaled R$ 3,368.7 million, a 16.7%
increase over the R$ 2,886.6 million recorded in
1H11. The main variations were:
(I) the 25.0% increase in “electricity purchased for
resale” on account of higher costs of energy
purchase from Itaipu, auctions (CCEAR) and the
spot market (CCEE);
R$'000
Electricity Purchased for Resale 2Q12 1Q12 2Q11 1H12 1H11 Var. %(1) (2) (3) (4) (5) (4/5)
Itaipu 140,855 120,520 104,070 261,375 214,186 22.0 CCEAR (Auction) 479,209 409,639 393,036 888,848 769,712 15.5 CCEE 74,155 49,840 (691) 123,995 16,621 646.0 Itiquira 33,246 33,560 25,955 66,806 62,758 6.5 Dona Francisca 16,433 16,443 15,110 32,876 31,015 6.0 Proinfa 32,167 33,235 25,836 65,402 51,497 27.0 (‐) Pis/Pasep and Cofins (64,192) (59,688) (55,791) (123,880) (93,443) 32.6
TOTAL 711,873 603,549 507,525 1,315,422 1,052,346 25.0
(ii) the 20.9% upturn in “charges for the use of the main transmission grid”, due to the start‐up of new assets in the system
and higher charges (reserve energy – EER and systems services ‐ESS);
(iii) in the first half of 2012, the “personnel and management” line totaled R$ 514.7 million, up 22.0% on the same period the
previous year. This result is driven by: (a) the 5.1% headcount increase due to the Copel Dis insourcing policy and the Aneel
37.2%
14.8%10.6%
16.5%
5.8%
8.7%
6.4%
Operating Costs and Expenses
Electricity purchased
Material and other
Charges for use of grid
Payroll and pension plan
Third‐party services
Depreciation
Construction cost

6
Earnings Release – 1H12
resolution 414/10 which determines the opening of customer service jobs in municipalities with more than 10,000
inhabitants; (b) the 7.4% wage increase as of October 2011, (c) revision of the career and compensation structure as of June
1st, 2011. There was also a provision of R$ 14.9 million related to the adhesion of 44 employees to the Succession and
Voluntary Redundancy Program – PSDV;
(iv) the balance of “pension and healthcare plans” reflects the accrual of liabilities pursuant to the 2012 actuarial report on
the Healthcare Plan, calculated according to the criteria set by CVM Resolution 600/2009, and the monthly installments of
the two plans. For further details, see Note 20 “post‐employment benefits" in our Standardized Financial Statements;
(v) the 14.3% decline in “material and supplies”, mainly reflecting lower purchases of material for the power system;
(vi) “raw material and supplies for electricity generation” include expenses with the acquisition of coal for the Figueira
thermal power plant;
(vii) the 48.9% upturn in “natural gas and supplies for the gas business", following the volume increase (8.6% up in 1H12),
higher prices for the natural gas acquired by Compagas to supply third parties, adjusted mainly due to the effects of the
recent depreciation of the real, and the adjustment of the oil basket, which determines the gas acquisition price;
(viii) a 13.5% increase in “third‐party services”, largely due to contractual adjustments and higher expenses with expansion
and with the Company assets maintenance (metering, bill delivery, tree pruning, telephony, data processing and
transmission, right of way cleaning and other services);
(ix) the variation in “provisions and reversals” was mainly caused by the provision of R$ 69.7 million related to the amounts
provisioned for litigation involving the Company, in accordance with legal counsel’s opinion. This effect was partially offset by
the reversal of R$ 37.1 million related to doubtful receivables from the energy sale from Mauá HPP based on management
decision on Aneel Order No. 1.611/12; and
(x) the 11.2% decline in "construction costs”, as a result of investments in power distribution and transmission;
(xi) the 19.2% decrease in “other operating costs and expenses” due to the lower hydro generation in the period, and due to
the transfer of transmission lines from the subsidiary Elejor to Copel Distribuição, accounted in 1H11.

7
Earnings Release – 1H12
R$ '000
2Q12 1Q12 2Q11 1H12 1H11 Var.%
(1) (2) (3) (4) (5) (4/5)
Electricity purchased for resale 711,873 603,549 507,525 1,315,422 1,052,346 25.0
Charges for the use of main transmission grid 193,183 172,317 148,222 365,500 302,406 20.9
Personnel and management 287,412 227,244 236,600 514,656 421,869 22.0
Pension and healthcare plans 40,100 39,832 32,251 79,932 63,703 25.5
Material and supplies 18,577 15,263 18,643 33,840 39,507 (14.3)
Raw material and supplies for electricity generation 5,628 5,070 6,735 10,698 13,368 (20.0)
Natural gas and supplies for the gas business 66,493 49,801 43,583 116,294 78,082 48.9
Third‐party services 108,455 94,641 95,143 203,096 178,979 13.5
Depreciation and amortization 135,393 141,326 135,887 276,719 269,885 2.5
Provisions and reversals 23,072 67,744 48,534 90,816 46,300 96.1
Construction cost 141,513 103,322 155,488 244,835 275,570 (11.2)
Other operating costs and expenses 56,431 60,448 84,916 116,879 144,565 (19.2)
TOTAL 1,788,130 1,580,557 1,513,527 3,368,687 2,886,580 16.7
Operating Costs and Expenses
2.3 EBITDA
Between January and June 2012, EBITDA (Earnings Before Interest, Taxes, Depreciation And Amortization) totaled R$ 964.1
million, down 8.3% from the R$ 1,051.8 million in the same period of the previous year.
2.4 Equity in Results of Investees
Equity in investees reflects the gains and losses on the investments in Copel's investees. In 1H12, this figure comprises
R$ 33.5 million from Dominó Holdings (Sanepar), R$ 4.2 million from Foz do Chopim Energética, R$ 3.7 million from Dona
Francisca Energética and loss of R$4.8 million from Sercomtel Telecom.
2.5 Financial Results
Financial revenues fell by 3.0%, to R$ 299.1 million, due to the lower cash balance and the reduction in the CDI during the
period, which implied lower return from financial investments, partially offset by higher interest for late payment on overdue
electricity bills.
Financial expenses totaled R$ 323.5 million in the period, 100.5% higher year on year, chiefly due to the appropriation of
R$ 195.0 million as a result of the remeasurement of the fair value of Copel Distribuição’s financial assets as a result of the
effects of the 3rd cycle of the tariff revision (R$ 152.4 million) and the new useful life estimates, pursuant to Aneel Resolution
474/12 (R$ 42.6 million).
2.6 Consolidated Net Income
Copel recorded net income of R$ 504.7 million in 1H12, down 21.4% from the amount registered in 1H11.

8
Earnings Release – 1H12
3. Balance Sheet and Investment Program
3.1 Assets
On June 30, 2012, Copel total assets amounted to R$ 19,538.9 million, up 2.2% on the figure recorded on December 31,
2011.
3.1.1 Cash, Cash Equivalents and Financial Investments
On June 30, 2012, the cash, cash equivalents and short‐term financial investments of Copel’s wholly‐owned subsidiaries and
controlled companies totaled R$ 1,132.1 million and were mostly invested in Bank Deposit Certificates (CDBs), government
bonds and repo transactions. The investments earned an average yield of 101% of the Interbank Deposit Certificate (CDI)
variation in the period.
3.1.2 CRC Transferred to the State of Paraná
Through the fourth addendum signed on January 21, 2005, the Company renegotiated the CRC balance on December 31,
2004 with the State of Paraná at R$ 1,197.4 million, in 244 monthly installments recalculated by the price amortization
system, updated by the IGP‐DI inflation index plus annual interest of 6.65%. The first installment was due on January 30,
2005, with subsequent and consecutive maturities. The current CRC balance is R$ 1,360.1 million.
The State of Paraná has been paying the renegotiated installments pursuant to the fourth addendum.
3.1.3 Accounts Receivable related to Concession
Based on the characteristics established in the electricity distribution and transmission concession contracts, management
understands that the conditions for the adoption of Technical Interpretation ICPC‐01 – Concession Agreements are met.
ICPC‐01 sets forth guidelines on the recognition of public service concessions.
3.1.4 Property, Plant and Equipment
The Company adopted the deemed cost method to determine the fair value of the fixed assets of generation and
telecommunications activities. These fixed assets are depreciated according to the straight‐line method based on the annual
rates established by Aneel, which are practiced and accepted by the market as adequate, limited to the term of concession,
when applicable.
The estimated useful life, residual values and depreciation are reviewed on the closing balance sheet date and the effect of
any changes in the estimates is prospectively recognized.
3.1.5 Intangible Assets
This line mostly comprises the intangible assets arising from Copel Distribuição’s concession agreements, consisting of
exploration rights of construction and electricity supply services, which will be recovered by billing customers.

9
Earnings Release – 1H12
3.2 Liabilities and Controller’s Shareholders’ Equity
Copel’s consolidated debt totaled R$2,233.4 million on June 30, 2012, representing a debt/equity ratio of 18.3% on the
controller’s shareholders’ equity.
The controller’s shareholders’ equity closed 1H12 at R$ 12,227.7 million, 3.4% higher than on December 31, 2011 and
equivalent to R$ 44.68 per share (book value per share).
3.2.1 Debt Profile
The breakdown of the balances of loans and financing is shown in the table below:
R$'000
Short‐term Long‐term Total
National Treasury 3,288 56,774 60,062
Eletrobras 6 8 14
Total 3,294 56,782 60,076
Eletrobras ‐ COPEL 53,004 202,399 255,403
FINEP 1,964 2,928 4,892
BNDES/ Banco do Brasil S/A ‐ Mauá 16,317 372,619 388,936
Banco do Brasil S/A and other 31,365 1,492,685 1,524,050
Total 102,650 2,070,631 2,173,281
TOTAL 105,944 2,127,413 2,233,357
Foreign Currency
Domestic Currency
Loan and financing maturities are presented below:
R$'000
Apr/13 ‐ Dec/13 2014 2015 2016 After 2016
Domestic Currency 102,650 176,756 739,241 571,194 252,334 331,106
Foreign Currency 3,294 1,356 1,360 ‐ ‐ 54,066
TOTAL 105,944 178,112 740,601 571,194 252,334 385,172
Short‐Term
Apr/12 ‐ Mar/13
Long‐Term
Copel’s consolidated net debt (loans and financing less cash) trends are shown below:
1,312
912
1,193
562
51
(215) (407)
541
1,101
‐0.5
0
0.5
1
1.5
2
(500)
(200)
100
400
700
1,000
1,300
2004 2005 2006 2007 2008 2009 2010 2011 1H12
times
R$ million
Net Debt Net Debt/EBITDA *
* Annualized EBITDA
10
Earnings Release – 1H12
3.2.2 Payables related to Concession – Use of Public Property (UBP)
It refers to the concession charges for the Use of Public Property (UBP) incurred since the execution of the project’s
concession agreement until the end of concession.
R$'000
Elejor Mauá Colíder Total
Current liabilities 44,041 1,220 ‐ 45,261
Noncurrent liabilities 359,268 12,599 14,165 386,032
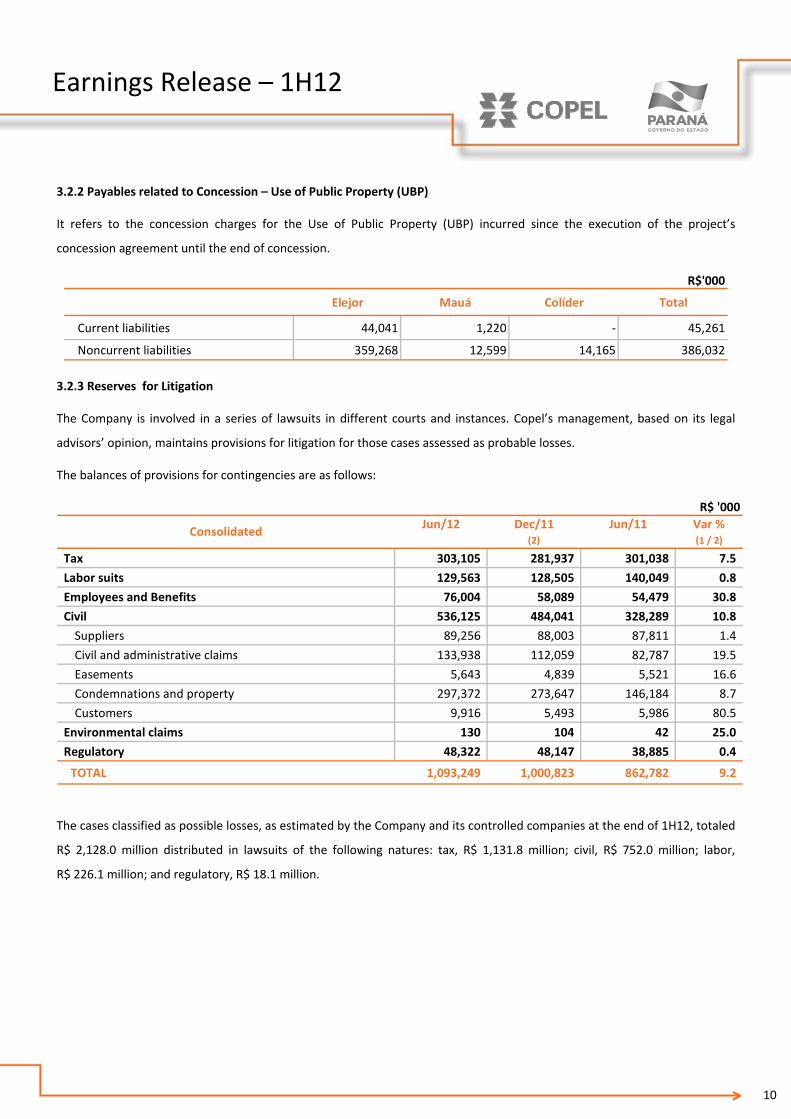
3.2.3 Reserves for Litigation
The Company is involved in a series of lawsuits in different courts and instances. Copel’s management, based on its legal
advisors’ opinion, maintains provisions for litigation for those cases assessed as probable losses.
The balances of provisions for contingencies are as follows:
Jun/12 Dec/11 Jun/11 Var %(2) (1 / 2)
Tax 303,105 281,937 301,038 7.5
Labor suits 129,563 128,505 140,049 0.8
Employees and Benefits 76,004 58,089 54,479 30.8
Civil 536,125 484,041 328,289 10.8
Suppliers 89,256 88,003 87,811 1.4
Civil and administrative claims 133,938 112,059 82,787 19.5
Easements 5,643 4,839 5,521 16.6
Condemnations and property 297,372 273,647 146,184 8.7
Customers 9,916 5,493 5,986 80.5
Environmental claims 130 104 42 25.0
Regulatory 48,322 48,147 38,885 0.4
TOTAL 1,093,249 1,000,823 862,782 9.2
R$ '000
Consolidated
The cases classified as possible losses, as estimated by the Company and its controlled companies at the end of 1H12, totaled
R$ 2,128.0 million distributed in lawsuits of the following natures: tax, R$ 1,131.8 million; civil, R$ 752.0 million; labor,
R$ 226.1 million; and regulatory, R$ 18.1 million.

11
Earnings Release – 1H12
3.3 Investment Program
Copel investments from January to June 2012 and the maximum investment forecast for 2012 are presented below:
Carried out Scheduled 1H12 2012
Generation and Transmission 462.4 1,069.9
HPP Mauá 54.1 89.1
HPP Colider 316.3 562.4
SHP Cavernoso II 33.4 50.6
Other 58.6 367.8
Distribution 285.5 1,105.0
Telecommunications 22.7 82.5
TOTAL 770.7 2,257.4
R$ million
Copel’s estimated investments in new businesses in 2012 (São Bento Energia, Cutia Empreendimentos Eólicos, Costa Oeste
Transmissora, Marumbi Transmissora, Transmissora Sul Brasileira, Caiuá Transmissora, Integração Maranhense Transmissora,
Matrinchã Transmissora de Energia and Guaraciaba Transmissora de Energia) total R$ 168.8 million.
4. Shareholding Structure
On June 30, 2012, paid‐up capital stock totaled R$ 6,910.0 million, composed of the following shares (with no par value) and
main shareholders:
Thousand shares
State of Paraná 85,029 58.6 ‐ ‐ 14 ‐ 85,043 31.1
BNDESPAR 38,299 26.4 ‐ ‐ 27,282 21.3 65,581 24.0
Eletrobras 1,531 1.1 ‐ ‐ ‐ ‐ 1,531 0.6
Free Floating 19,621 13.5 129 33.7 100,904 78.7 120,654 44.0
BM&FBovespa 19,505 13.4 129 33.7 60,226 47.0 79,860 29.1
NYSE 116 0.1 ‐ ‐ 40,595 31.7 40,711 14.9
LATIBEX ‐ ‐ ‐ ‐ 83 0.1 83 ‐
Other 551 0.4 255 66.3 40 ‐ 846 0.3
TOTAL 145,031 100.0 384 100.0 128,240 100.0 273,655 100.0
Shareholders Common % Preferred "A" % % Preferred "B" % TOTAL
58.6%
26.4%
1.1%
13.5%0.4%
Common
State of Paraná
BNDESPAR
Eletrobras
Free Floating
Other
21.2%
78.5%
0.3%
Preferred
BNDESPAR
Free Floating
Other
31.1%
24.0%0.6%
44.0%
0.3%
TOTAL
State of Paraná
BNDESPAR
Eletrobras
Free Floating
Other

12
Earnings Release – 1H12
5. Consolidated Financial Statements
5.1 Assets
(1) (2) (3) (1/2) (1/3)
CURRENT 3,412,108 3,702,013 4,257,507 (7.8) (19.9)
Cash and cash equivalents 673,765 1,049,125 1,676,318 (35.8) (59.8)
Financial investments 458,358 584,687 533,588 (21.6) (14.1)
Customers 1,490,924 1,368,366 1,414,535 9.0 5.4
Dividends receivable 8,342 17,906 7,859 (53.4) 6.1
CRC transferred to the State of Paraná 69,258 65,862 61,649 5.2 12.3
Receivables related to concession 99,077 80,626 66,563 22.9 48.8
Other receivables 198,905 161,313 185,253 23.3 7.4
Inventories 113,380 103,802 133,438 9.2 (15.0)
Income tax and social contribution 217,649 215,381 130,489 1.1 66.8
Other current taxes recoverable 69,349 50,357 36,611 37.7 89.4
Prepaid expenses 13,101 4,588 11,204 185.5 16.9
NONCURRENT 16,126,817 15,419,650 14,344,473 4.6 12.4
Long‐Term Assets 6,304,610 5,939,512 5,246,287 6.1 20.2
Financial investments 167,073 100,142 27,612 66.8 505.1
Customers 35,069 32,452 43,816 8.1 (20.0)
CRC transferred to the State of Paraná 1,290,803 1,280,598 1,288,387 0.8 0.2
Judicial deposits 551,825 430,817 399,405 28.1 38.2
Receivables related to concession 3,328,988 3,236,474 2,746,862 2.9 21.2
Other receivables 34,559 17,223 16,287 100.7 112.2
Income tax and social contribution 19,576 18,714 13,061 4.6 49.9
Other current taxes recoverable 76,066 77,912 77,481 (2.4) (1.8)
Deferred income tax and social contribution 800,651 745,180 633,376 7.4 26.4
Investments 578,514 549,158 501,714 5.3 15.3
Property, plant and equipment 7,480,411 7,209,123 6,856,267 3.8 9.1
Intangible assets 1,763,282 1,721,857 1,740,205 2.4 1.3
TOTAL 19,538,925 19,121,663 18,601,980 2.2 5.0
Var.%
R$'000
Assets Jun/12 Dec/11 Jun/11 Var.%

13
Earnings Release – 1H12
5.2 Liabilities
R$'000
Jun/12 Dec/11 Jun/11 Var.% Var.%
(1) (2) (3) (1/2) (1/3)
CURRENT 1,905,625 2,058,821 2,481,891 (7.4) (23.2)
Accrued payroll costs 212,636 224,095 196,634 (5.1) 8.1
Suppliers 769,417 747,453 638,825 2.9 20.4
Income tax and social contribution 140,932 151,790 190,164 (7.2) (25.9)
Other taxes payable 229,439 288,457 315,647 (20.5) (27.3)
Loans and financing 105,944 116,487 704,594 (9.1) (85.0)
Dividends payable 87,325 135,744 65,235 (35.7) 33.9
Post‐employment benefits 22,180 36,037 24,621 (38.5) (9.9)
Regulatory charges 62,743 70,511 80,474 (11.0) (22.0)
Research and development and energy efficiency 124,450 156,915 145,919 (20.7) (14.7)
Payables related to concession ‐ use of public property 45,261 44,656 41,375 1.4 9.4
Other accounts payable 105,298 86,676 78,403 21.5 34.3
NON‐CURRENT 5,149,732 4,993,314 4,235,722 3.1 21.6
Suppliers 84,839 108,462 127,488 (21.8) (33.5)
Tax l iabil ities ‐ 152 388 ‐ ‐
Deferred income tax and social contribution 875,794 927,910 901,688 (5.6) (2.9)
Loans and financing 2,127,413 2,057,985 1,461,767 3.4 45.5
Post‐employment benefits 457,444 432,838 403,691 5.7 13.3
Research and development and energy efficiency 124,746 94,649 119,428 31.8 4.5
Payables related to the concession ‐ use of public property 386,032 370,442 358,474 4.2 7.7
Other accounts payable 217 53 16 309.4 1256.3
Reserve for l itigation 1,093,247 1,000,823 862,782 9.2 26.7
SHAREHOLDERS' EQUITY 12,483,568 12,069,528 11,884,367 3.4 5.0
Attributed to controlling shareholders 12,227,708 11,826,694 11,637,035 3.4 5.1
Stock capital 6,910,000 6,910,000 6,910,000 ‐ ‐
Valuation adjustments 1,398,278 1,457,081 1,515,290 (4.0) (7.7)
Legal reserves 536,187 536,187 478,302 ‐ 12.1
Profit reserves 2,838,551 2,838,551 2,056,526 ‐ 38.0
Proposed additional dividends ‐ 84,875 ‐ ‐ ‐
Accrued earnings 544,692 ‐ 676,917 ‐ (19.5)
Attributed to minority shareholders 255,860 242,834 247,332 5.4 3.4
TOTAL 19,538,925 19,121,663 18,601,980 2.2 5.0
Liabilities
14
Earnings Release – 1H12
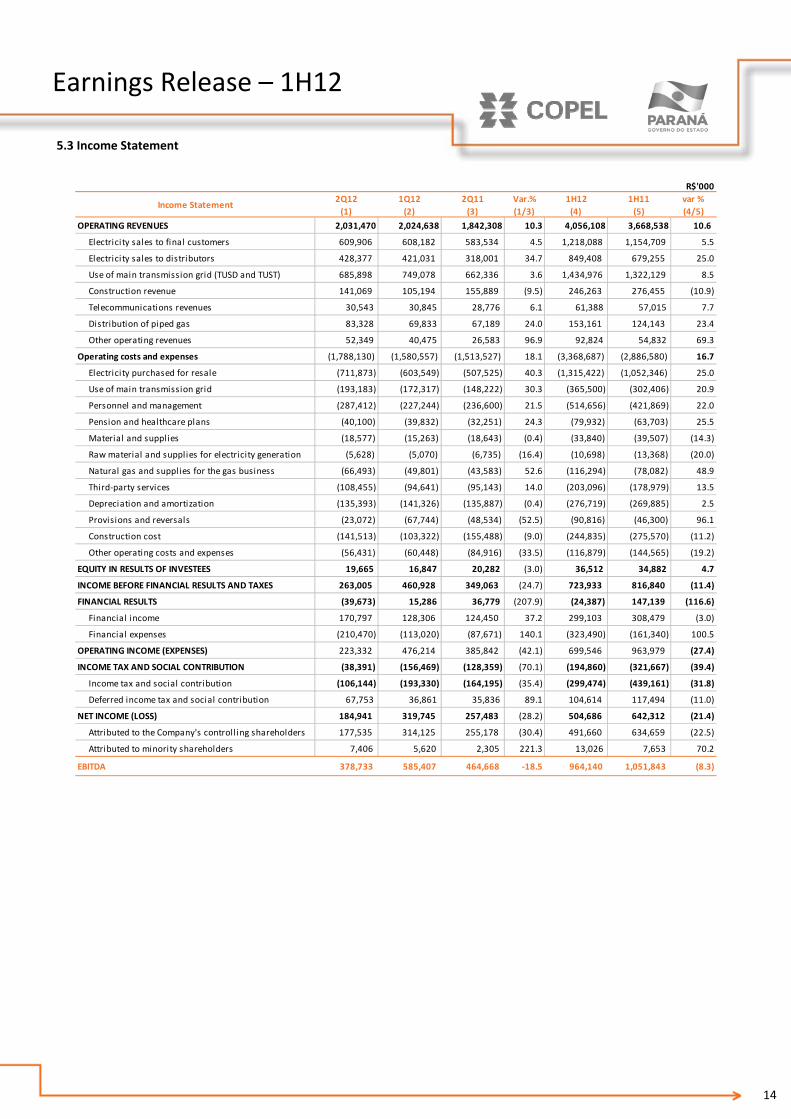
5.3 Income Statement
R$'000
2Q12 1Q12 2Q11 Var.% 1H12 1H11 var %
(1) (2) (3) (1/3) (4) (5) (4/5)
OPERATING REVENUES 2,031,470 2,024,638 1,842,308 10.3 4,056,108 3,668,538 10.6
Electricity sales to final customers 609,906 608,182 583,534 4.5 1,218,088 1,154,709 5.5
Electricity sales to distributors 428,377 421,031 318,001 34.7 849,408 679,255 25.0
Use of main transmission grid (TUSD and TUST) 685,898 749,078 662,336 3.6 1,434,976 1,322,129 8.5
Construction revenue 141,069 105,194 155,889 (9.5) 246,263 276,455 (10.9)
Telecommunications revenues 30,543 30,845 28,776 6.1 61,388 57,015 7.7
Distribution of piped gas 83,328 69,833 67,189 24.0 153,161 124,143 23.4
Other operating revenues 52,349 40,475 26,583 96.9 92,824 54,832 69.3
Operating costs and expenses (1,788,130) (1,580,557) (1,513,527) 18.1 (3,368,687) (2,886,580) 16.7
Electricity purchased for resale (711,873) (603,549) (507,525) 40.3 (1,315,422) (1,052,346) 25.0
Use of main transmission grid (193,183) (172,317) (148,222) 30.3 (365,500) (302,406) 20.9
Personnel and management (287,412) (227,244) (236,600) 21.5 (514,656) (421,869) 22.0
Pension and healthcare plans (40,100) (39,832) (32,251) 24.3 (79,932) (63,703) 25.5
Material and supplies (18,577) (15,263) (18,643) (0.4) (33,840) (39,507) (14.3)
Raw material and supplies for electricity generation (5,628) (5,070) (6,735) (16.4) (10,698) (13,368) (20.0)
Natural gas and supplies for the gas business (66,493) (49,801) (43,583) 52.6 (116,294) (78,082) 48.9
Third‐party services (108,455) (94,641) (95,143) 14.0 (203,096) (178,979) 13.5
Depreciation and amortization (135,393) (141,326) (135,887) (0.4) (276,719) (269,885) 2.5
Provisions and reversals (23,072) (67,744) (48,534) (52.5) (90,816) (46,300) 96.1
Construction cost (141,513) (103,322) (155,488) (9.0) (244,835) (275,570) (11.2)
Other operating costs and expenses (56,431) (60,448) (84,916) (33.5) (116,879) (144,565) (19.2)
EQUITY IN RESULTS OF INVESTEES 19,665 16,847 20,282 (3.0) 36,512 34,882 4.7
INCOME BEFORE FINANCIAL RESULTS AND TAXES 263,005 460,928 349,063 (24.7) 723,933 816,840 (11.4)
FINANCIAL RESULTS (39,673) 15,286 36,779 (207.9) (24,387) 147,139 (116.6)
Financial income 170,797 128,306 124,450 37.2 299,103 308,479 (3.0)
Financial expenses (210,470) (113,020) (87,671) 140.1 (323,490) (161,340) 100.5
OPERATING INCOME (EXPENSES) 223,332 476,214 385,842 (42.1) 699,546 963,979 (27.4)
INCOME TAX AND SOCIAL CONTRIBUTION (38,391) (156,469) (128,359) (70.1) (194,860) (321,667) (39.4)
Income tax and social contribution (106,144) (193,330) (164,195) (35.4) (299,474) (439,161) (31.8)
Deferred income tax and social contribution 67,753 36,861 35,836 89.1 104,614 117,494 (11.0)
NET INCOME (LOSS) 184,941 319,745 257,483 (28.2) 504,686 642,312 (21.4)
Attributed to the Company's controll ing shareholders 177,535 314,125 255,178 (30.4) 491,660 634,659 (22.5)
Attributed to minority shareholders 7,406 5,620 2,305 221.3 13,026 7,653 70.2
EBITDA 378,733 585,407 464,668 ‐18.5 964,140 1,051,843 (8.3)
Income Statement

15
Earnings Release – 1H12
5.4 Cash Flow
Consolidated Cash Flow 1H12 1H11
Cash flow from operating activities
Net income for the period 504,686 642,312
Adjustments to reconcile net income with the cash provided by operating activities 677,941 616,210 Depreciation 169,424 164,884 Amortization of intangible assets ‐ concession 105,987 103,911 Amortization of intangible assets ‐ other 944 725 Amortization of investiments ‐ concession 364 364 Unrealized monetary and exchange variations, net (1,617) 23,707 Accounts receivable tied to the concession fair value´s update 194,985 ‐ Remuneration of accounts receivable related to the concession (173,311) (146,513)
Equity in the results of investees (36,512) (34,882)
Income Tax and Social Contribution 299,474 439,161
Deferred Income Tax and Social Contribution (104,614) (117,494)
Provision for doubtful accounts (12,284) 15,277
Provision for tax credit losses (3,729) 15,773
Reserve for contingencies 106,829 15,250
Provisions for post‐employment benefits 85,694 67,347
Provision for research and development and energy efficiency 36,696 33,079
Loss on disposal of accounts receivables related to concession 3,807 12,569
Results on disposal of property, plant, and equipment 3,018 17,293
Results on disposal of intangible 2,786 5,759
Reduction (increase) of assets (97,324) (100,133)
Increase (reduction) of liabilities (647,603) (710,953)
Net cash generated by operating activities 437,700 447,436
Cash flow from investing activities
Financial investments 54,770 69,803
Additions to Cauiá – net effect of the cash acquired (30) ‐
Additions to Integração Maranhense ‐ net effect of the cash acquired (53) ‐
Additions to Matrinchã ‐ net effect of the cash acquired (313) ‐
Additions to Guaraciaba ‐ net effect of the cash acquired (169) ‐
Additions in investments (6,893) (111)
Additions to property, plant, and equipment: (442,202) (363,894)
Additions to intangible assets related to concessions (358,110) (321,894)
Additions to other intangible (2,654) (2,120)
Customer contributions 37,007 28,253
Net cash generated (used) by investing activities (718,647) (589,963)
Cash flow from financing activities
Payment of capital in affiliates by noncontrolling shareholders - (19,689)
Loans and financing obtained 55,915 197,262
Amortization of principal amounts of loans and financing (17,034) (22,631)
Dividends and interest on capital paid (133,294) (130,513) Net cash used by financing activities (94,413) 24,429 Increase (decrease) in cash and cash equivalents (375,360) (118,098)
Cash and cash equivalents at the beginning of the period 1,049,125 1,794,416Cash and cash equivalents at the end of the period 673,765 1,676,318
Variation in cash and cash equivalents (375,360) (118,098)
R$'000

16
Earnings Release – 1H12
6. Financial Statements – Wholly‐Owned Subsidiaries
6.1 Assets
R$'000
Assets GeT DIS TEL
CURRENT 931,612 2,013,280 47,662
Cash and cash equivalents 81,381 445,419 9,557
Financial investment 273,713 33,415 ‐
Customers 349,165 1,123,550 19,512
Dividends receivable ‐ ‐ ‐
CRC transferred to the State of Paraná ‐ 69,258 ‐
Accounts receivable related to the concession 98,996 ‐ ‐
Other receivables 94,604 96,660 2,277
Inventories 25,491 77,554 8,986
Income Tax and Social Contribution 2,570 94,472 4,129
Other current taxes recoverable 5,110 60,932 3,120
Prepaid expenses 582 12,020 81
NONCURRENT 8,084,267 5,673,862 322,691
Long‐Term Assets 1,382,071 4,383,872 18,062
Financial investment 94,447 72,626 ‐
Customers ‐ 34,980 89
CRC transferred to the State of Paraná ‐ 1,290,803 ‐
Judicial deposits 21,917 256,330 1,024
Receivables related to concession 1,081,394 2,243,893 ‐
Other receivables 5,566 3,220 ‐
Other current taxes recoverable 2,717 62,403 8,518
Deferred Income tax and social contribution 176,030 419,617 8,431
Investments 406,851 4,012 ‐
Property, Plant and Equipment 6,252,347 ‐ 287,809
Intangible Assets 42,998 1,285,978 16,820
TOTAL 9,015,879 7,687,142 370,353
GeT: Copel Geração e Transmissão, DIS: Copel Distribuição, TEL: Copel Telecomunicações

17
Earnings Release – 1H12
6.2 Liabilities
Liabilities GeT DIS TEL
CURRENT 927,807 1,645,596 26,511
Accrued payroll costs 52,831 141,786 13,240
Suppliers 182,412 577,370 7,962
Income Tax and Social Contribution 124,371 ‐ 774
Other taxes payable 16,401 201,331 3,447
Loans and financing 54,347 20,445 ‐
Dividends payable 435,840 457,063 ‐
Post‐employment benefits 5,966 15,444 770
Regulatory charges 6,044 56,699 ‐
Research and development and energy efficiency 13,973 108,672 ‐
Payables related to concession ‐ use of public property 1,220 ‐ ‐
Other accounts payable 34,402 66,786 318
NON‐CURRENT 1,970,949 2,359,526 65,063
Intercompany receivables ‐ 814,487 45,643
Suppliers 92,699 ‐ ‐
Deferred income tax and social contribution 821,356 16,870 ‐
Loans, and financing 473,733 739,933 ‐
Post‐employment benefits 124,656 312,608 18,975
Research and development and energy efficiency 40,545 84,201 ‐
Payables related to the concession ‐ use of public property 26,764 ‐ ‐
Reserve for litigation 391,196 391,427 445
SHAREHOLDERS' EQUITY 6,117,123 3,682,020 278,779
Attributed to controlling shareholders
Capital stock 3,505,994 2,624,841 194,755
Valuation adjustments 1,389,959 (7) ‐
Legal Reserves 212,108 135,294 5,306
Profit reserves 589,331 883,575 62,685
Accrued earnings (losses) 419,731 38,317 16,033
TOTAL 9,015,879 7,687,142 370,353
R$'000
GeT: Copel Geração e Transmissão, DIS: Copel Distribuição, TEL: Copel Telecomunicações

18
Earnings Release – 1H12
6.3 Income Statement
Income Statement GeT DIS TEL
Operating revenues 1,098,973 2,785,612 84,010
Electricity sales to final customers 60,962 1,158,533 ‐
Electricity sales to distributors 797,827 93,154 ‐
Use of main transmission grid (TUSD/TUST) 199,137 1,288,057 ‐
Construction revenue 22,059 211,202 ‐
Telecommunications ‐ ‐ 81,374
Other operating revenues 18,988 34,666 2,636
Operating costs and expenses (568,560) (2,722,964) (62,140)
Electricity purchase for resale (52,966) (1,409,526) ‐
Use of main transmission grid (104,062) (300,604) ‐
Personel and management (124,712) (344,837) (30,199)
Pension and healthcare plans (20,070) (55,028) (3,954)
Material and supplies (8,652) (23,201) (961)
Raw material and supplies for electricity generation (9,437) ‐ ‐
Third‐party services (44,059) (159,313) (8,476)
Depreciation and amortization (129,976) (94,900) (13,170)
Provisions and reversals 7,523 (83,900) (524)
Construction cost (20,670) (211,202) ‐
Other operating costs and expenses (61,479) (40,453) (4,856)
Equity in results of investees 6,467 ‐ ‐
Income before financial results and taxes 536,880 62,648 21,870
Financial Income (expenses) 14,211 (7,896) 1,683
Earnings before income taxes 551,091 54,752 23,553
Operating income (182,928) (82,016) (7,640)
Deferred income tax and social contribution (1,171) 65,581 120
Net Income 366,992 38,317 16,033
EBITDA 660,389 157,548 35,040
R$'000
GeT: Copel Geração e Transmissão, DIS: Copel Distribuição, TEL: Copel Telecomunicações

19
Earnings Release – 1H12
7. Power Market
Copel’s electricity sales to final customers, composed by sales from Copel Distribuição captive market and Copel Geração e
Transmissão free market increased 5.5% between January and June of 2012.The captive market consumed 11,671 GWh,
growing by 4.0%, while Copel’s GeT free market has grown 44.3%, reaching 648 GWh in the same period.
7.1 Captive Market
The industrial segment consumed 3,750 GWh, growing by 2.1% year to date. This result reflected (i) the higher industrial
production in the State of Paraná, especially in the edition and printing, oil refining and production of ethanol, wood and
food sectors, and (ii) the higher number of customers. At the end of June, this segment represented 32.1% of Copel’s captive
market consumption, with the company supplying power to 83,186 captive industrial customers.
The residential segment consumed 3,247 GWh, a growth of 4.6%, led by the higher credit and income growth. At the end of
June 2012, this segment represented 27.8% of Copel’s captive market consumption, with the company supplying power to
3,135,696 residential customers.
The commercial segment consumed 2,532 GWh, a growth of 4.3%, due to increasing sales from retailers in the concession
area. At the end of the period, this segment represented 21.7% of Copel’s captive market consumption, with the company
supplying power to 323,493 captive commercial customers.
The rural segment consumed 1,049 GWh, growing by 8.7%, mainly due to the higher agricultural output in the State of
Paraná. This segment represented 9.0% of Copel’s captive market consumption at the end of the period, with the company
supplying power to 376,473 rural customers.
Other segments (public agencies, public lighting, public services and own consumption) consumed 1,093 GWh, up 3.8% in the
period. These segments represented 9.4% of Copel’s captive market consumption, totaling 52,585 customers at the end of
the period.
The following table shows captive market trends by consumption segment:
2Q12 2Q11 Var. % 1H12 1H11 Var. %
(1) (2) (1/2) (3) (4) (3/4)
Industrial 1,915 1,909 0.3 3,750 3,674 2.1
Residential 1,593 1,550 2.8 3,247 3,103 4.6
Commercial 1,208 1,195 1.1 2,532 2,429 4.3
Rural 496 460 7.9 1,049 965 8.7
Other 547 532 2.8 1,093 1,052 3.8
Captive Segment Total 5,759 5,646 2.0 11,671 11,223 4.0
Segment
GWh

20
Earnings Release – 1H12
7.2 Copel Distribuição’s Grid Market (TUSD)
Copel Distribuição’s grid market, comprising the captive market, concessionaires and licensees (other utilities within the
State of Paraná) and all free customers within the Company’s concession area, grew 2.2%, as shown in the following table:
2Q12 2Q11 Var.% 1H12 1H11 Var.%
(1) (2) (1/2) (3) (4) (3/4)
Captive Market 5,759 5,646 2.0 11,671 11,223 4.0
Concession and permission holders 158 152 3.9 313 298 5.0
Free Customers (*) 767 787 (2.5) 1,420 1,591 (10.8)
Grid Market 6,684 6,585 1.5 13,404 13,112 2.2
* Total free customers supplied by COPEL GeT and other suppliers w ithin COPEL DIS’ concession area.
GWh
7.3 Energy Flow
Copel Consolidated
GWh
1H12 1H11 Var.%
Own Generation 8,326 12,693 (34.4)
Purchased energy 15,811 13,664 15.7
Itaipu 2,609 2,615 (0.2)
Auction – CCEAR 9,462 9,063 4.4
Itiquira 454 451 0.7
Dona Francisca 305 309 (1.3)
CCEE (MCP) 504 380 32.6
MRE 1,593 ‐ ‐
Proinfa 292 258 13.2
Elejor 592 588 0.7
Total Available Power 24,137 26,357 (8.4)
Captive Market 11,671 11,223 4.0
Concessionaires 313 298 5.0
Free Customers 648 449 44.3
Bilateral Agreements 548 529 3.6
Auction – CCEAR 7,461 7,629 (2.2)
CCEE (MCP) 62 194 (68.0)
MRE 1,705 4,235 (59.7)
Losses and differences 1,729 1,800 (3.9)
Basic network losses 498 622 (19.9)
Distribution losses 1,099 1,051 4.6
CG contract allocation 132 127 3.9 Amounts subject to changes after settlement by CCEE
CCEAR: Energy Purchase Agreements in the Regulated Market
MRE: Energy Reallocation Mechanism
CCEE (MCP): Electric Pow er Trade Chamber (Short-term market)
CG: Center of gravity of the Submarket (dif ference betw een billed and energy received from CG)

21
Earnings Release – 1H12
Copel Geração e Transmissão
GWh
1H12 1H11 Var. %
Own Generation 8,326 12,693 (34.4)
CCEE (MCP) 383 199 92.5
MRE 1,593 ‐ ‐
Dona Francisca 305 309 (1.3)
Total Available Power 10,607 13,201 (19.7)
Bilateral Agreements 548 529 3.6
CCEAR – COPEL Distribuição 662 657 0.8
CCEAR – Other 6,799 6,972 (2.5)
Free Customers 648 449 44.3
CCEE (MCP) 45 25 80.0
MRE 1,705 4,235 (59.7)
Losses and differences 200 334 (40.1)
Values subject to rounding adjustments.
Copel Distribuição
GWh
1H12 1H11 Var. %
Itaipu 2,609 2,615 (0.2)
CCEAR – COPEL Geração e Transmissão 662 657 0.8
CCEAR – Other 8,682 8,268 5.0
CCEAR ‐ Adjustment auction 118 138 (14.5)
CCEE (MCP) 121 181 (33.2)
Itiquira 454 451 0.7
Proinfa 292 258 13.2
Elejor S.A 592 588 0.7
Available Power 13,530 13,156 2.8
Captive market 11,671 11,223 4.0
Wholesale 313 298 5.0
CCEE (MCP) 17 169 (89.9)
Losses and differences 1,529 1,466 4.3
Basic network losses 298 288 3.4
Distribution losses 1,099 1,051 4.6
CG contract allocation 132 127 4.0
Values subject to rounding adjustments.

22
Earnings Release – 1H12
8. Supplementary Information
8.1 Tariffs
Average Energy Purchase Tariffs
R$/MWh
Average MW Jun/12 Mar/12 Jun/11 Var. % Var. %
(1) (2) (3) (1 / 2) (1 / 3)
Itaipu* 569 113.36 96.34 85.95 17.7 31.9
Auction – CCEAR 2005 – 2012 934 80.51 79.41 75.84 1.4 6.2
Auction – CCEAR 2006 – 2013 452 94.39 92.97 88.84 1.5 6.2
Auction – CCEAR 2007 – 2014 157 134.32 132.76 126.37 1.2 6.3
Auction – CCEAR 2008 – 2015 69 113.55 111.75 106.94 1.6 6.2
Auction – CCEAR 2010 – H30 66 151.52 149.78 142.72 1.2 6.2
Auction – CCEAR 2010 – T15** 64 161.10 159.24 151.74 1.2 6.2
Auction – CCEAR 2011 – H30 58 156.20 154.40 147.12 1.2 6.2
Auction – CCEAR 2011 – T15** 54 177.63 175.58 167.31 1.2 6.2
Auction – CCEAR 2012 – T15** 117 159.35 157.51 ‐ 1.2 ‐
Others Auctions*** 205 145.53 144.03 142.92 1.0 1.8
Bilaterals 239 163.80 160.12 158.30 2.3 3.5
Total / Tarifa Média de Compra 2,985 114.02 109.37 105.05 4.3 8.5
* Furnas transport charge not included.
Tariff
**Average auction price restated according to the IPCA inflation index. The price comprises in fact three components: a fixed component, a variable component,
and expenses at the Electric Energy Trading Chamber (CCEE). The cost of the latter two components is dependent upon the dispatch of facilities according to the
schedule set by the National System Operator (ONS).
*** Products average price.
Average Tariffs for Electricity Sales to Final Customers – without ICMS
R$/MWh
Tariff Jun/12 Mar/12 Jun/11Var. %(1/2)
Var. %(1/3)
Industrial* 207.23 211.24 219.64 (1.9) (5.7)
Residential 299.82 299.49 290.58 0.1 3.2
Commercial 269.56 263.58 264.06 2.3 2.1
Rural 177.51 177.02 172.97 0.3 2.6
Other 208.29 206.18 203.66 1.0 2.3
Retail distribution average rate 243.19 243.60 242.99 (0.2) 0.1
* Free customers not included
Average Tariffs for Electricity Sales to Distributors
R$/MWh
Average MW Jun/12 Mar/12 Jun/11 Var. % Var. %
(1) (2) (3) (1 / 2) (1 / 3)
Auction CCEAR 2005 ‐ 2012 859 80.79 79.28 76.06 1.9 6.2
Auction CCEAR 2006 ‐ 2013 328 95.44 93.14 89.99 2.5 6.1
Auction CCEAR 2007 ‐ 2014 76 106.04 104.24 99.72 1.7 6.3
Auction CCEAR 2008 ‐ 2015 74 112.91 110.46 106.31 2.2 6.2
Auction CCEAR 2009 ‐ 2016 218 128.40 126.37 120.67 1.6 6.4
Concession holders in the State of Paraná 71 134.80 132.46 135.27 1.8 (0.3)
Tariff

23
Earnings Release – 1H12
8.2 Main Operational and Financial Indicators
June 30, 2012
Generation Copel GeT power plants 19 (17 hydro, 1 thermal and 1 wind power plant)
Power plants in which Copel holds interest 6 (5 hydro and 1 thermal plant)
Copel GeT’s total installed capacity 4,552 MW
Installed capacity of Copel’s Corporate Partnerships(1) MW 606 MW
Copel GeT’s automated and remote‐controlled power plants 12
Copel’s corporate partnerships’ automated and remote‐controlled power plants 03
Transmission Transmission lines 2,023 km
Substations 31 (100% automated)
Installed capacity of substations 10,902 MVA
Distribution (up to 230 kV) Distribution networks and lines 185,510 km
Substations 356 (100% automated)
Installed capacity of substations 10,108 MVA
Number of municipalities served 396(2)
Number of localities served 1,114
Number of captive customers 4.0 million
DEC (outage duration per customer, in hours and hundredths of an hour) 4,91
FEC (outage frequency per customer) 3,92 times
Telecommunications Fiber optic cables – main ring (interurban) 8,391 km
Self‐sustained fiber optic cables (urban) 17,101 km
Number of municipalities served in Paraná 356
Number of municipalities served in Santa Catarina 2
Number of customers 2.039
Administration Number of employees (wholly‐owned subsidiaries) 9,540
Copel Geração e Transmissão 1,865
Copel Distribuição 7,181
Copel Telecomunicações 494
Consumers per employee 553
Financial Book value per share R$ 44.68 per share
EBITDA R$ 964.1 million
Current liquidity ratio 1,79
Note:
(1) Proportional to the interest.
(2) 3 partially served municipalities in the rural area.

24
Earnings Release – 1H12
8.3 1H12 Results Conference Call
Copel will hold its 1H12 results conference call
August 24, 2012 – 2:00 p.m. (US EST)
Telephone: (+1 516) 300‐1066
Code: Copel
A live webcast of the conference call will be available at www.copel.com/ir
Please connect 15 minutes before the call.
Investor Relations – Copel
Telephone: +55 (41) 3222‐2027
Fax: +55 (41) 3331‐2849
The information contained in this press release may contain forward‐looking statements that reflect the management’s current view and
estimates of future economic circumstances, industry conditions, company performance, and financial results. Any statements,
expectations, capabilities, plans and assumptions contained in this press release that do not describe historical facts such as statements
regarding the declaration or payment of dividends, the direction of future operations, the implementation of relevant operating and
financial strategies, the investment program, factors or trends affecting the Company’s financial condition, liquidity or results of operations
are forward‐looking statements within the meaning of the U.S. Private Securities Litigation Reform Act of 1995 and involve a number of
risks and uncertainties. There is no guarantee that these results will actually occur. The statements are based on many assumptions and
factors, including general economic and market conditions, industry conditions and operating factors. Any changes in such assumptions or
factors could cause actual results to differ materially from current expectations.