
Elizabeth K. Drake, Steve Aos, and Marna G. Miller
27
Victims and Offenders, 4:170–196, 2009 Copyright © Taylor & Francis Group, LLC ISSN: 1556-4886 print/1556-4991 online DOI: 10.1080/15564880802612615 170 UVAO 1556-4886 1556-4991 Victims and Offenders, Vol. 4, No. 1, November 2008: pp. 1–35 Victims and Offenders Evidence-Based Public Policy Options to Reduce Crime and Criminal Justice Costs: Implications in Washington State Public Policy Options E. K. Drake, S. Aos, and M. G. Miller Elizabeth K. Drake , Steve Aos , and Marna G. Miller Washington State Institute for Public Policy, Olympia, Washington, USA Abstract: In 2006, long-term forecasts indicated that Washington faced the need to construct several new prisons in the following two decades. Since new prisons are costly, the Washington legislature directed the Washington State Institute for Public Policy to project whether there are “evidence-based” options that can reduce the future need for prison beds, save money for state and local taxpayers, and contribute to lower crime rates. The institute conducted a systematic review of all research evidence that could be located to determine what works, if anything, to reduce crime. We found and analyzed 545 comparison-group evaluations of adult corrections, juvenile corrections, and prevention programs. We then estimated the benefits and costs of many of these evidence-based options and found that some evidence-based programs produce favorable returns on investment. This paper presents our findings and describes our meta-analytic and economic methods. Keywords: cost effectiveness, correctional intervention, evidence-based policy During the mid-1990s, the Washington legislature began to enact statutes to promote an “evidence-based” approach to several public policies. While the phrase “evidence-based” has not always been precisely defined in legislation, it has generally been constructed to describe a program or policy supported by outcome evaluations clearly demonstrating effectiveness. Additionally, to deter- mine if taxpayers receive an adequate return on investment, the legislature began to require cost-benefit analyses of certain state-funded programs and practices. Address correspondence to Elizabeth K. Drake, Washington Institute for Public Policy, PO Box 40999, Olympia, WA 98504. E-mail: [email protected]
Transcript of Elizabeth K. Drake, Steve Aos, and Marna G. Miller

Victims and Offenders, 4:170–196, 2009Copyright © Taylor & Francis Group, LLCISSN: 1556-4886 print/1556-4991 onlineDOI: 10.1080/15564880802612615
170
UVAO1556-48861556-4991Victims and Offenders, Vol. 4, No. 1, November 2008: pp. 1–35Victims and OffendersEvidence-Based Public Policy Options to Reduce Crime and Criminal Justice Costs: Implications in Washington StatePublic Policy OptionsE. K. Drake, S. Aos, and M. G. Miller
Elizabeth K. Drake, Steve Aos, and Marna G. Miller
Washington State Institute for Public Policy, Olympia, Washington, USA
Abstract: In 2006, long-term forecasts indicated that Washington faced the need toconstruct several new prisons in the following two decades. Since new prisons arecostly, the Washington legislature directed the Washington State Institute for PublicPolicy to project whether there are “evidence-based” options that can reduce the futureneed for prison beds, save money for state and local taxpayers, and contribute to lowercrime rates. The institute conducted a systematic review of all research evidence thatcould be located to determine what works, if anything, to reduce crime. We found andanalyzed 545 comparison-group evaluations of adult corrections, juvenile corrections,and prevention programs. We then estimated the benefits and costs of many of theseevidence-based options and found that some evidence-based programs produce favorablereturns on investment. This paper presents our findings and describes our meta-analyticand economic methods.
Keywords: cost effectiveness, correctional intervention, evidence-based policy
During the mid-1990s, the Washington legislature began to enact statutes topromote an “evidence-based” approach to several public policies. While thephrase “evidence-based” has not always been precisely defined in legislation,it has generally been constructed to describe a program or policy supported byoutcome evaluations clearly demonstrating effectiveness. Additionally, to deter-mine if taxpayers receive an adequate return on investment, the legislaturebegan to require cost-benefit analyses of certain state-funded programs andpractices.
Address correspondence to Elizabeth K. Drake, Washington Institute for Public Policy,PO Box 40999, Olympia, WA 98504. E-mail: [email protected]

Public Policy Options 171
Washington’s initial experiments with evidence-based and cost-beneficialpublic policies began in the state’s juvenile justice system. The legislature fundedseveral nationally known and well-researched programs designed to reducethe reoffending rates of juveniles. At the same time, the legislature eliminatedthe funding of a juvenile justice program when a careful evaluation revealed itwas failing to reduce juvenile crime. Following this initial successful ventureinto evidence-based public policy, Washington began to introduce the approachto other areas including child welfare, mental health, substance abuse, K–12education, and adult corrections.
In 2005, long-term forecasts indicated that Washington would need twonew prisons by 2020 and possibly another by 2030. That year’s legislaturedirected the institute to determine if evidence-based options existed that couldreduce the need for prison construction, save money for state and local taxpayers,and contribute to lower crime rates (Capital Budget, 2005). We conducted asystematic review of all the research evidence we could locate in adult corrections,juvenile corrections, and prevention programs and found that some evidence-based programs reduce crime while others do not; we also conducted an economicanalysis of many of the programs (Aos, Miller, & Drake, 2006).
Based on the findings, the 2007 legislature made significant investmentsby allotting $48 million in the biennial budget for the expanded use of evidence-based programs. Investments were made in many adult and juvenile justiceprograms, as well as in prevention programs—including drug treatment, educa-tion, vocational training, correctional industries, functional family therapy,multisystemic therapy, aggression replacement training, and early childhoodeducation. The state’s prison forecast was subsequently adjusted downward toreflect the resource decisions made by the 2007 legislature.
In this paper, we present the findings from our 2006 study, including somerevisions since its publication. This research is part of an ongoing effort toimprove Washington’s criminal justice system; the narrative presented here is asnapshot of the current analytical process. Due to space limitations, we focuson our statistical review of the evaluation literature and on our per-programeconomic analysis. We do not include our estimates of the aggregate impactsof evidence-based programs on forecasted prison populations or statewide crimerates.
We proceed in two steps. The first step addresses the question: What works?Specifically, do rigorous evaluations indicate that some adult corrections pro-grams, juvenile corrections programs, or prevention programs lower crime rates?To answer this fundamental question, we employ a systematic review of theresearch and use meta-analytic procedures to evaluate the evidence.
While the purpose of the first step is to determine if anything works tolower crime outcomes, in the second step we ask a follow-up question: Per dollarspent on a program, do the benefits of the program’s crime reduction exceedits costs? Since all programs cost money, this additional economic test seeks to

172 E. K. Drake, S. Aos, and M. G. Miller
determine whether the amount of crime reduction justifies the program’sexpenditures. A program may have demonstrated an ability to reduce crime but,if the program costs too much, it may not be a good investment—especiallywhen compared with alternatives including incarceration. We describe theeconomic model we have developed to predict how much money is spent orsaved in Washington when crime goes up or down.
META-ANALYTICAL PROCEDURES
To estimate the benefits and costs of different approaches to reduce and pre-vent crime, we conducted separate meta-analyses of the relationship betweenevaluated programs and crime. In this section, we describe our procedures forsearching for, including, and coding studies—along with the statistical methodswe used to estimate the weighted average effects of a program.
Search StrategyWe searched for all adult and juvenile corrections and prevention evaluation
studies conducted since 1970 that are written in English. We used three primarymeans to identify and locate these studies: (a) we consult the study lists ofother systematic and narrative reviews of the adult and juvenile correctionsand prevention research literature; (b) we examine the citations in the individualevaluations; and (c) we conduct independent literature searches of researchdatabases using search engines such as Google, Proquest, Ebsco, ERIC, andSAGE. We obtained and examined copies of all individual program evaluationstudies we could locate using these search procedures.
Many of these studies were published in peer-reviewed academic journals,while others were from government reports obtained from the agencies them-selves. It was important to include non–peer reviewed studies, because it hasbeen suggested that peer-reviewed publications may be biased to show positiveprogram effects (Lipsey & Wilson, 2001). Therefore, our meta-analysis includesall available studies we could locate regardless of published source.
Criteria for Inclusion and Exclusion of StudiesComparison group. The most important inclusion criterion in our systematic
review of the literature was that an evaluation must have a control or comparisongroup. We did not include studies with a single-group, pre-post research design inorder to avoid false inference on causality (Coalition for Evidence-Based Policy,2003). Random assignment studies were preferred for inclusion in our review,but we also included nonrandomly assigned control groups. We only includedquasiexperimental studies if sufficient information was provided to demon-strate reasonable comparability between the treatment and comparison groupson important pre-existing conditions such as age, gender, and prior criminal

Public Policy Options 173
history. Of the 545 individual studies in our review, about 4% involved effectsestimated from well-implemented random assignment studies.
Participant sampling procedures. We did not include a study in our meta-analytic review if the treatment group was made up solely of program completers.We adopted this rule to avoid unobserved self-selection factors that distin-guish a program completer from a program dropout; these unobserved factorsare likely to significantly bias estimated treatment effects (Lipsey, 2003).Some comparison group studies of program completers, however, containedinformation on program dropouts in addition to a comparison group. In thesesituations, we included the study if sufficient information was provided toallow us to reconstruct an intent-to-treat group that included both completersand noncompleters, or if the demonstrated rate of program noncompletion wasvery small (e.g., under 10%). In these cases, the study still needed to meet theother inclusion requirements listed here.
Outcomes. A crime-related outcome had to be reported in the study to beincluded in our review. Some studies presented several types of crime-relatedoutcomes. For example, studies frequently measured one or more of the fol-lowing outcomes: total arrests, total convictions, felony arrests, misdemeanorarrests, violent arrests, and so on. In these situations, we coded the broadestcrime outcome measure. Thus, most of the crime outcome measures that wecoded are total arrests and total convictions. When a study reported both totalarrests and total convictions, we calculated an effect size for each measureand then took a simple average of the two effect sizes.
Some studies included two types of measures for the same outcome: a dichot-omous outcome and a continuous (mean number) measure. In these situations,we coded an effect size for the dichotomous measure. Our rationale for thischoice was that in small or relatively small sample studies, continuous measuresof crime outcomes can be unduly influenced by a small number of outliers, whiledichotomous measures can reduce this problem (Farrington & Loeber, 2000).Of course, if a study only presented a continuous measure, we coded the con-tinuous measure.
When a study presented outcomes with varying follow-up periods, we gen-erally coded the effect size for the longest follow-up period. This allowed us togain the most insight into the long-run benefits and costs of various treatments.Occasionally, we did not use the longest follow-up period if it was clear that alonger reported follow-up period adversely affected the attrition rate of thetreatment and comparison group samples.
Miscellaneous coding criteria. Our unit of analysis was an independent testof a treatment at a particular site. Some studies reported outcomes for multiplesites; we included each site as an independent observation if a unique and inde-pendent comparison group was also used at each site.
Some studies presented two types of analyses: raw outcomes that were notadjusted for covariates such as age, gender, or criminal history; and those that

174 E. K. Drake, S. Aos, and M. G. Miller
had been adjusted with multivariate statistical methods. In these situations,we coded the multivariate outcomes.
Procedures for Calculating Effect SizesCalculations for dichotomous and continuous outcomes. Effect sizes measure
the degree to which a program has been shown to change an outcome for programparticipants relative to a comparison group. In order to be included in ourreview, a study had to provide the necessary information to calculate an effectsize. Several methods can be used by meta-analysts to calculate effect sizes.We used the standardized mean difference effect size for continuous measuresand the D-cox transformation as described in Sánchez-Meca, Chacón-Moscoso,and Marín-Martínez (2003, Equation 18) to approximate the mean differenceeffect size for dichotomous outcome variables.
In Equation 1, dcox is the estimated effect size, which is derived by divid-ing the log odds ratio by the constant 1.65. Pe represents the percentage out-come for the experimental or treatment group and Pc is the percentageoutcome for the control group.
For continuous outcome measures, we used the standardized mean differ-ence effect size statistic (Lipsey & Wilson, 2001, table B10, Equation 1).
In the second equation, ESm is the estimated standardized mean effectsize where Me is the mean outcome for the experimental group, Mc is the meanoutcome for the control group, SDe is the standard deviation of the mean outcomefor the experimental group, and SDc is the standard deviation of the meanoutcome for the control group.
Sometimes research studies reported the mean values needed to computeESm in Equation 2, but they failed to report the standard deviations. Often,however, the research reported information about statistical tests or confidenceintervals that could then allow the pooled standard deviation to be estimated.These procedures are further described in Lipsey and Wilson (2001).
Some studies had very small sample sizes, which have been shown toupwardly bias effect sizes—especially when samples are less than 20. Therefore,we followed Hedges (1981) and Lipsey and Wilson (2001, Equation 3.22) andreport the “Hedges correction factor,” which we used to adjust all mean difference
dP p
P pCox
e c
c e
=−−
⎛
⎝⎜⎞
⎠⎟ln
( )
( )/ .
1
11 65 (1)
ESM M
SD SDm
e c
e2
c
=−
+ 2
2
(2)

Public Policy Options 175
effect sizes (N is the total sample size of the combined treatment and comparisongroups).
Techniques Used to Combine the EvidenceOnce effect sizes were calculated for each program effect, the individual
measures were summed to produce a weighted average effect size for a pro-gram area. We calculated the inverse variance weight for each program effectand these weights were used to compute the average. These calculationsinvolved three steps. First, we calculated the standard error of each meaneffect size. For continuous outcomes, the standard error, SEm, was computedwith (Lipsey & Wilson, 2001, Equation 3.23)
In Equation 4, ne and nc are the number of participants in the experimen-tal and control groups and ES'm is from Equation 3.
For dichotomous outcomes, the standard error, SEdcox, was computed with(Sánchez-Meca et al., 2003, Equation 19)
In Equation 5, O1E and O1C represent the success frequencies of the exper-imental and control groups. O2E and O2C represent the failure frequencies ofthe experimental and control groups.
The second step in calculating the average effect size for a program areawas to compute the inverse variance weight, wm, for each mean effect sizewith (Lipsey & Wilson, 2001, Equation 3.24)
The weighted mean effect size for a group of studies was then computedwith (Lipsey & Wilson, 2001, p. 114)
EN
ES or dm m cox′ = −−
⎡⎣⎢
⎤⎦⎥
× [ ]S 13
4 9, , (3)
SEn nn n
ESn nm
e c
e c
m
e c=
++
+( )( )
’ 2
2(4)
SEO O O Od
E E C CCox
= + + +⎡
⎣⎢
⎤
⎦⎥0 367
1 1 1 1
1 2 1 2. (5)
wSE
mm
=1
2 (6)
ESw ES
w
m m
m=
′∑∑
( ) (7)

176 E. K. Drake, S. Aos, and M. G. Miller
Finally, confidence intervals around this mean were computed by first cal-culating the standard error of the mean with (Lipsey & Wilson, 2001, p. 114)
The lower, ESL, and upper, ESU, limits of the confidence interval were com-puted with (Lipsey & Wilson, 2001, p. 114)
In Equations 9 and 10, z(1-α) is the critical value for the z-distribution.
Techniques Used to Assess HeterogeneityComputing random effects weighted average effect sizes and confidence
intervals. Once the weighted mean effect size was calculated, we tested forhomogeneity. This provides a measure of the dispersion of the effect sizesaround their mean and is given by (Lipsey & Wilson, 2001, p. 116)
The Q-test is distributed as a chi-square with k-1 degrees of freedom(where k is the number of effect sizes). When the p-value on the Q-test indi-cates significance at values of p less than or equal to .05, a random effectsmodel was performed to calculate the weighted average effect size. This wasaccomplished by first calculating the random effects variance component, v(Lipsey & Wilson, 2001, p. 134).
This random variance factor was then added to the variance of each effectsize and all inverse variance weights were recomputed, as were the othermeta-analytic test statistics.
Adjustments to Effect SizesMethodological quality. Not all research is of equal quality and this greatly
influences the confidence that can be placed in interpreting the policy-relevant
SEwES
m=
∑1
(8)
ES ES z SEL ES= − −( ) ( )1 a (9)
ES ES z SEU ES= + −( ) ( )1 a (10)
Q w ESwES
w= − ∑
∑∑( )( )2
2
(11)
vQ k
w wsq w=
− −−∑ ∑ ∑
( )( )
1(12)

Public Policy Options 177
results of a study. Some studies are well-designed and implemented and theresults can be reasonably viewed as causal effects. Other studies are notdesigned as well and less confidence can be placed in the causal interpretationof any reported differences. Studies with inferior research designs cannot com-pletely control for sample selection bias or other unobserved threats to thevalidity of reported research results. This does not mean that results fromthese studies are of no value, but it does mean that less confidence can beplaced in any cause-and-effect conclusions drawn from the results.
To account for the differences in the quality of research designs, we used a5-point scale as a way to adjust the raw effect sizes. The scale is based closelyon the 5-point scale developed by researchers at the University of Maryland(Sherman et al., 1998, chap. 2). On the 5-point scale as interpreted by ourinstitute, each study was rated with the following numerical ratings.
A “5” was assigned to an evaluation with well-implemented randomassignment of subjects to a treatment group and a control group that does notreceive the treatment/program. A good random assignment study should alsoreport how well the random assignment actually occurred by reporting valuesfor pre-existing characteristics for the treatment and control groups.
A “4” was assigned to a study that employed a rigorous quasiexperimentalresearch design with a program and matched comparison group, controllingwith statistical methods for self-selection bias that might otherwise influenceoutcomes. These quasiexperimental methods might have included estimatesmade with a convincing instrumental variables or regression discontinuity mod-eling approach or other techniques such as a Heckman self-selection model(Rhodes et al., 2001). A value of 4 might also be assigned to an experimentalrandom assignment design that reported problems in implementation, perhapsbecause of significant attrition rates.
A “3” indicated a nonexperimental evaluation where the program andcomparison groups were reasonably well matched on pre-existing differencesin key variables. There must be evidence presented in the evaluation thatindicated few, if any, significant differences were observed in these salientpre-existing variables. Alternatively, if an evaluation employed sound multi-variate statistical techniques to control for pre-existing differences, and if theanalysis was successfully completed and reported, then a study with some differ-ences in pre-existing variables could qualify as a level 3.
A “2” involved a study with a program and matched comparison groupwhere the two groups lacked comparability on pre-existing variables and noattempt was made to control for these differences in the study. A “1” involvedan evaluation study where no comparison group was utilized.
In our meta-analytic review, we only considered evaluations that rate atleast a 3 on this 5-point scale. We did not use the results from program evalu-ations rated as a “1” on this scale, because they did not include a comparisongroup and thus provided no context to judge program effectiveness. We also

178 E. K. Drake, S. Aos, and M. G. Miller
regarded evaluations with a rating of “2” as highly problematic and, as aresult, did not consider their findings in our analyses.
An explicit adjustment factor was assigned to the results of individualeffect sizes based on the institute’s judgment concerning research design quality.The specific adjustments made for these studies were based on our knowledgeof research in particular fields. For example, in criminal justice program eval-uations, there is strong evidence that random assignment studies (i.e., level 5studies) have, on average, smaller absolute effect sizes than studies withweaker designs (Lipsey, 2003). We used the following default adjustments toaccount for studies of different research design quality. The effect size of alevel 3 study was discounted by 50 percent and the effect size of a level 4 studywas discounted by 25 percent, while the effect size of a level 5 study was notdiscounted. While these factors were subjective, we believed not making someadjustments for studies with varying research design quality would severelyoverestimate the true causal effect of the average program.
Researcher involvement in the program’s design and implementation. Thepurpose of the institute’s work is to identify and evaluate programs that canmake cost-beneficial improvements to Washington’s actual service deliverysystem. There is some evidence that programs closely controlled by researchersor program developers have better results than those that operate in “realworld” administrative structures (Lipsey, 2003; Petrosino & Soydan, 2005).For example, in our evaluation of a real-world implementation of a research-based juvenile justice program in Washington, we found that the actual resultswere considerably lower than the results obtained when the intervention wasconducted by the originators of the program (Barnoski, 2004). Therefore, wemade an adjustment to effect sizes to reflect this distinction. As a generalparameter, the institute discounted effect sizes by 50 percent for all studiesdeemed not to be “real world” trials.
COST-BENEFIT PROCEDURES
Once we conducted the meta-analyses to determine if a program reduces crime ata statistically significant level, we then monetized the benefits to taxpayers andcrime victims of future crimes avoided, and estimated the costs of a program ver-sus the costs of not participating in the program. We then compared the benefitsto the costs in order to determine the bottom-line economics of a program.
Criminal Justice System and Crime Victim CostsIn the institute’s cost-benefit model, we estimated the costs of criminal
justice system resources that are paid by taxpayers for each significant part ofthe publicly financed system in Washington. The costs of police and sheriffs,superior courts and county prosecutors, local juvenile detention services, local

Public Policy Options 179
adult jails, state juvenile rehabilitation, and state adult corrections were esti-mated separately in the analysis. Operating costs were estimated for each ofthese criminal justice system components, and annualized capital costs wereestimated for the capital-intensive sectors.
The model used estimates of marginal operating and capital costs of thecriminal justice system. In a few cases average cost figures were used whenmarginal cost estimates could not be reasonably estimated. Marginal criminaljustice costs were defined as those costs that change over the period of severalyears as a result of changes in workload measures. For example, when oneprisoner is added to the state adult corrections system, certain variable foodand service costs increase immediately, but new corrections staff are not hiredthe next day. Over the course of a governmental budget cycle, however, newcorrections staff are likely to be hired to handle the larger average daily popu-lation of the prison. In the institute’s analysis, these “longer-run” marginalcosts have been estimated—rather than immediate, short-run marginal costs.Costs and the equations used to estimate per-unit marginal operating costscan be found in Aos, Lieb, Mayfield, Miller, and Pennucci (2004).
In addition to costs paid by taxpayers, many of the costs of crime are borneby victims. Some victims lose their lives; others suffer direct, out-of-pocketpersonal or property losses. Psychological consequences also occur to crimevictims, including feeling less secure in society. The magnitude of victim costsis very difficult—and in some cases impossible—to quantify.
National studies, however, have taken significant steps in estimatingcrime victim costs. One U.S. Department of Justice study by Miller, Cohen,and Wiersema (1996) divides crime victim costs into two types: (a) monetarycosts, which include medical and mental health care expenses, property damageand losses, and the reduction in future earnings incurred by crime victims; and(b) quality of life cost estimates, which place a dollar value on the pain and suffer-ing of crime victims. In that study, the quality of life victim costs were computedfrom jury awards for pain, suffering, and lost quality of life; for murders, thevictim quality of life value was estimated from the amount people spend toreduce risks of death. In the institute’s analysis, victim costs from the Milleret al. study were used as estimates of per-unit victim costs in Washington.
Crime Distributions for Offender PopulationsIn order to estimate the long-run effectiveness of programs, we combined
the effect sizes discussed earlier with other information on offender popula-tions in Washington. We computed recidivism parameters for various offenderpopulations using the institute’s criminal records database. Recidivism wasdefined as any offense committed after release to the community, or after initialplacement in the community, that results in a conviction in Washington. Thisincluded convictions in juvenile and adult court.

180 E. K. Drake, S. Aos, and M. G. Miller
We collected recidivism data on five general populations of offenders whobecame at-risk in the community during calendar year 1990. We selected 1990because that year allowed a 13-year follow-up period to observe subsequentconvictions. A one-year adjudication period was included in the follow-up to allowfor court processing of any offenses toward the end of the 13-year follow-up. Theserecidivism data included the probability of any reoffense, the timing of reoffensesover the 13-year period, the volume of reoffenses, and the type of reoffenses.
For adult offenders, we observed the 13-year recidivism patterns for thoseoffenders released from Washington Department of Corrections (DOC) facilitiesin 1990, and those offenders sentenced directly to DOC community supervisionin 1990. For juvenile offenders, we observed the 13-year recidivism patternsfor those offenders released from Washington State Juvenile RehabilitationAdministration (JRA) facilities in 1990, those offenders sentenced to diversionthrough local-sanctioning courts in 1990, and those offenders sentenced todetention/probation through local-sanctioning courts in 1990.
These five populations were further broken down by the offender’s most seri-ous current offense category. That is, we computed recidivism information forpopulations based on the most serious offense for which they were convicted priorto the 13-year follow-up period. These categories included drug, property, sex, vio-lent (nonsex), drug and property, violent (sex), misdemeanors, and total felonyand misdemeanor offenses. Thus, we calculated separate crime distributions for40 populations (five offender populations multiplied by eight offense categories).
Next, we calculated probability density distributions for each of the 40populations using lognormal, gamma, or weibull distributions, which indicatedwhen convictions were likely to happen over the 13-year follow-up period.
From the recidivism data, we also calculated the total number of adjudica-tions and offenses a person had during the follow-up period. Recidivism adju-dications and offenses were broken down into the following offense categories:murder, sex, robbery, assault, property, drug, and misdemeanor. Using thisinformation, we then determined the average number of adjudications a personhad through the criminal justice system. In addition, we calculated the averagenumber of offenses per adjudication. Finally, we computed the average timebetween sentences over the follow-up period.
For prevention programs, we similarly estimated long-run crime distribu-tions for nonoffender populations by calculating the probability of obtaining aconviction over the life-course. We selected the 1973 birth cohort because thisgave us the longest follow-up period (32 years) possible with Washington criminalrecords data.
Criminal Justice System EffectsRelative risk. In order to calculate the benefits of evidence-based programs,
first we calculated the degree to which a program was estimated to affect crime,

Public Policy Options 181
notated as relativerisky. This variable indicated the change in the relative riskof being convicted for a crime in year y as a function of the estimated effectsize for a program and the base crime probability for the offender population.Relativerisky is computed as
In Equation 13, using the D-cox transformation we computed the esti-mated change in outcome of the treatment group as a function of the effectsize, ES, and the long-run recidivism rate for the relevant population, Crimeprob.ES represents the institute-adjusted effect size for each evidence-basedoption, as computed from the meta-analyses described in the previous sec-tion. The variable decayrate is a parameter that allowed us to model expo-nential rates of decay (or growth) in the effect size over time. We put thisfeature in the model because most of the evaluations included in our reviewanalyzed crime outcomes with relatively short follow-up periods, often one ortwo years. In our model, however, we estimated long-run crime curves usinga 13-year follow-up period. Since we applied short-term effect sizes to makelong-term estimates of the effect a program had on crime outcomes, we madethe assumption that the effectiveness of a program decays over time. In themodel, we estimated this decay rate as 2.5% per follow-up year, a rate whichlowered the effect size by about 25% at the end of the 13-year follow-upperiod.
Crimes committed. After calculating the degree to which a program affectsthe relative risk for being convicted of a crime, we estimated the impact ofthis crime change on the criminal justice system. We estimated the effect thatan evidence-based option is expected to have on the number of crimes a per-son commits in each year of the follow-up period, Crimey in Equation 14. Wecomputed this by summing for each subsequent adjudication, A, the productof the probability of being convicted for a crime, Crimeprob; the relative riskof being convicted after applying the effect of the program in year y, Rela-tiveRisky; the probability density distribution that indicated when recidivismwas likely to occur over the 13-year follow-up period, Crimedist; the averagenumber of offenses per adjudication over the course of the follow-up period,Offperadj; and the estimate of the average number of victimizations per adju-dication, Vicperadj. In the model, we attributed only 20% of the estimatedtotal crimes committed to those who are convicted of a crime. Each of theadjudications, a, is distributed over the 13-year follow-up period with a spacingparameter, s.
relativeRisk
e CrimeprobCrimeprob Crime
y = +(ES * 1.65) *
1 - pprob eCrimeprob
decayrate y
* (ES * 1.65) −
⎛
⎝
⎜⎜⎜⎜
⎞
⎠
⎟⎟⎟⎟
+
1
1* ( )
(13)

182 E. K. Drake, S. Aos, and M. G. Miller
Adjudications in the system. In Equation 15, we estimated the impact thatevidence-based options have on the number of times a person enters the criminaljustice system for a conviction, Adj, in the long-term follow-up. Not all of theseadjudications, of course, occur immediately. We estimated the number of adju-dications in year y by summing the product of the probability of being convictedfor a crime, Crimeprob, for each subsequent adjudication, A; by the relative riskof being convicted after applying the effect of the program in year y, RelativeRisky;and by the probability density distribution that indicates when recidivism is likelyto occur over the 13-year follow-up period, Crimedist. Each of the adjudications, a,is distributed over the 13-year follow-up period with a spacing parameter, s.
Average daily prison population. In Equation 16, we estimated the effectthat evidence-based programs have on the prison population, ADPy, in year yof the long-term follow-up. We followed similar procedures as outlined in theprevious two equations. We summed the number of adjudications after multi-plying the probability of a crime occurring, Crimeprob; the relative risk afterapplying the effect size of the program, RelativeRisk; and the probabilitydistribution of when the crime is likely to occur, Crimedist. Each of the adjudi-cations, a, is distributed over the 13-year follow-up period with a spacingparameter, s.
The ADP equation also contains a term indicating the average length ofstay in prison per adjudication, PLOSa. In Washington, a sentencing grid isused to determine the length of a sentence, which is based upon the severity ofthe crime and the offender’s criminal history (Sentencing Reform Act, 1981).For each type of offender population, we calculated PLOS by multiplying theprobability that a certain type of offense would occur by the probability that aconviction would result in a prison sentence for each offense type and by theaverage length of stay for that offense in Washington. In order to estimate theeffect of subsequent adjudications on sentence length, we accounted for increas-ing sentence length by computing the average extra sentence length for eachsubsequent adjudication.
Crime Crimeprob relativeRisk Crimedist
Of
y y a sa
A
= ∗ ∗
∗
− +=
∑ ( ( )*1 11
ffperadj Vicperadj∗ )
(14)
Adj Crimeprob relativeRisk Crimedisty y a sa
A
= ∗ ∗ − +=
∑ ( )( )*1 11
(15)
ADP Crimeprob relativeRisk Crimedist PLOSy y a s aa
= ∗ ∗ ∗− +=
( )( )*1 11
AA
∑ (16)

Public Policy Options 183
Avoided costs. We computed the expected cash flows of avoided costs foreach option with the following equations:
The Taxbeny equation calculated the expected streams of annual benefitsthat accrued to taxpayers as a result of reduced crimimal justice costs. TheTotalbeny equation added the benefits that accrued to crime victims (who arenot victimized when crime does not happen) to the taxpayer benefits to producean annual stream of total benefits.
In these two equations, there are four marginal cost terms: Prison$, Stateadj$,Localadj$, and Victim$. These terms described how mariginal operating andcapital costs change when the average daily prison population goes up ordown by one unit; how other state and local criminal justice operating andcapital costs change when convictions go up or down by one unit; and howvictim costs of crime change when crime goes up or down by one unit. The pro-cedures to calculate these four marginal cost terms can be found in Aos et al.(2004).
The net present value of the annual stream of benefits and costs was com-puted with Equation 19. For each year y in the 13-year follow-up period,annual benefits and costs were discounted to present value with an overallreal discount rate, DiscountRate.
FINDINGS
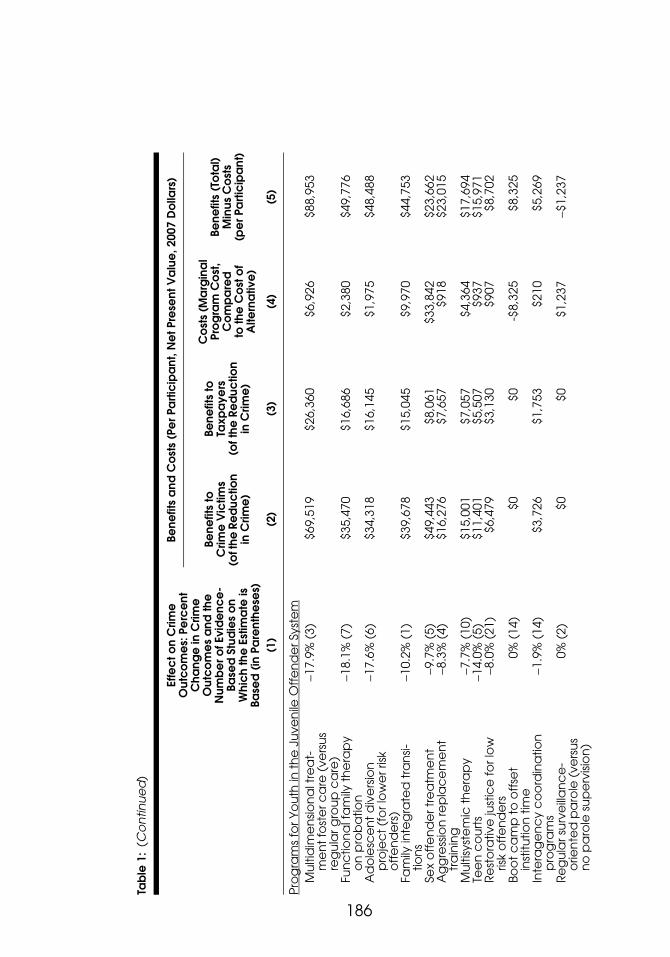
What Reduces Crime?Table 1 summarizes the findings from our current systematic review of
the evaluation research literature. We find that a number of adult and juvenilejustice and prevention programs demonstrate statistically significant reductionsin crime outcomes. We also find that some programs do not achieve a statisticallysignificant reduction in recidivism. Thus, the overall lesson from our evidence-based review is that public policy makers need to be smart investors: someprograms work, some programs do not, and careful analysis is needed to informpolicy decisions.
Taxben ADP ison$ Adj Stateadj$ Localadj$y y y= ∗ + ∗ +Pr ( ) (17)
Totalben Taxben Crime Victim$y y y= + ∗ (18)
NPVTotalBen Cost
DiscountRatey y
yy
Y
=−
+=∑
( )( )11
(19)

184
Tab
le 1
:R
ed
uc
ing
crim
e w
ith e
vid
en
ce
-ba
sed
op
tion
s: W
ha
t w
ork
s a
nd
an
aly
sis o
f be
ne
fits
an
d c
ost
s.
Effe
ct o
n C
rime
O
utc
om
es:
Pe
rce
nt
Cha
nge
in C
rime
O
utc
om
es
and
the
N
umb
er o
f Evi
de
nce
-Ba
sed
Stu
die
s o
n W
hic
h th
e E
stim
ate
is
Base
d (
in P
are
nthe
ses)
Bene
fits
and
Co
sts
(Pe
r Pa
rtic
ipa
nt, N
et P
rese
nt V
alu
e, 2
007
Do
llars
)
Bene
fits
to
Crim
e V
ictim
s (o
f the
Re
duc
tion
in C
rime
)
Bene
fits
to
Taxp
aye
rs
(of t
he R
ed
uctio
nin
Crim
e)
Co
sts
(Ma
rgin
al
Pro
gra
m C
ost
, C
om
pa
red
to
the
Co
st o
f A
ltern
ativ
e)
Bene
fits
(To
tal)
Min
us C
ost
s (p
er P
arti
cip
ant
)
(1)
(2)
(3)
(4)
(5)
Pro
gra
ms
for P
eo
ple
in t
he
Ad
ult
Off
en
de
r Sys
tem
Vo
ca
tion
al e
du
ca
tion
in
pris
on
−9.8
% (
4)$1
4,50
4$7
,419
$1,2
10$2
0,71
4
Inte
nsiv
e s
up
erv
isio
n:
tre
atm
en
t-o
rien
ted
p
rog
ram
s
−17.
9% (
11)
$16,
239
$10,
235
$7,3
56$1
9,11
8
Wa
shin
gto
n’s
Da
ng
ero
usl
y M
en
tally
Ill O
ffe
nd
er
pro
gra
m
−20.
7% (
1)$3
0,73
2$1
5,72
0$2
7,61
7$1
8,83
6
Ge
ne
ral e
du
ca
tion
in
pris
on
(b
asic
ed
uc
atio
n
or p
ost
sec
on
da
ry)
−8.3
% (
17)
$12,
319
$6,3
02$9
85$1
7,63
6
Co
gn
itive
-be
ha
vio
ral
the
rap
y in
pris
on
o
r co
mm
un
ity
−6.9
% (
25)
$10,
234
$5,2
35$1
07$1
5,36
1
Co
rre
ctio
na
l in
du
strie
s in
pris
on
−6.4
% (
4)$9
,518
$4,8
69$4
27$1
3,96
1
Dru
g t
rea
tme
nt
in p
riso
n
(th
era
pe
utic
co
mm
un
i-tie
s o
r ou
tpa
tien
t)
−6.4
% (
21)
$9,4
98$4
,859
$1,6
42$1
2,71
5

185
Dru
g t
rea
tme
nt
in c
om
mu
nity
−8.3
% (
6)$7
,471
$4,9
72$5
88$1
1,85
6
Ad
ult
dru
g c
ou
rts
−8.7
% (
57)
$7,7
98$5
,190
$4,4
74$8
,514
Emp
loym
en
t a
nd
job
tr
ain
ing
in t
he
co
mm
un
ity−4
.6%
(16
)$4
,147
$2,6
14$4
09$6
,351
Sex
off
en
de
r tre
atm
en
t in
p
riso
n w
ith a
fte
rca
re−9
.6%
(6)
$12,
901
$4,0
44$1
2,88
1$4
,064
Wa
shin
gto
n’s
Wo
rk R
ele
ase
fr
om
pris
on
−1.3
% (
1)$1
,835
$1,0
69$6
15$2
,288
Ele
ctr
on
ic m
on
itorin
g
to o
ffse
t ja
il tim
e0%
(12
)$0
$0−$
926
$926
Inte
nsiv
e s
up
erv
isio
n:
surv
eill
an
ce
-orie
nte
d
pro
gra
ms
0% (
23)
$0$0
$3,8
69−$
3,86
9
Ad
ult
bo
ot
ca
mp
s0%
(22
)$0
$0n
/en
/eD
om
est
ic v
iole
nc
e
ed
uc
atio
n/c
og
niti
ve-
be
ha
vio
ral t
rea
tme
nt
0% (
9)$0
$0n
/en
/e
Dru
g t
rea
tme
nt
in ja
il0%
(8)
$0$0
n/e
n/e
Jail
div
ers
ion
fo
r me
nta
lly il
l o
ffe
nd
ers
+5.
3% (
11)
−$4,
831
−$3,
045
n/e
n/e
Life
ski
lls e
du
ca
tion
p
rog
ram
s fo
r ad
ults
0% (
4)$0
$0n
/en
/e
Re
sto
rativ
e ju
stic
e
pro
gra
ms
for l
ow
er r
isk
ad
ult
off
en
de
rs
0% (
6)$0
$0n
/en
/e
(Co
ntin
ue
d)
186
Tab
le 1
:(C
on
tinu
ed
)
Effe
ct o
n C
rime
O
utc
om
es:
Pe
rce
nt
Cha
nge
in C
rime
O
utc
om
es
and
the
N
umb
er o
f Evi
de
nce
-Ba
sed
Stu
die
s o
n W
hic
h th
e E
stim
ate
is
Base
d (
in P
are
nthe
ses)
Bene
fits
and
Co
sts
(Pe
r Pa
rtic
ipa
nt, N
et P
rese
nt V
alu
e, 2
007
Do
llars
)
Bene
fits
to
Crim
e V
ictim
s (o
f the
Re
duc
tion
in C
rime
)
Bene
fits
to
Taxp
aye
rs
(of t
he R
ed
uctio
nin
Crim
e)
Co
sts
(Ma
rgin
al
Pro
gra
m C
ost
, C
om
pa
red
to
the
Co
st o
f A
ltern
ativ
e)
Bene
fits
(To
tal)
Min
us C
ost
s (p
er P
arti
cip
ant
)
(1)
(2)
(3)
(4)
(5)
Pro
gra
ms
for Y
ou
th in
th
e J
uve
nile
Off
en
de
r Sys
tem
Mu
ltid
ime
nsio
na
l tre
at-
me
nt
fost
er c
are
(ve
rsu
s re
gu
lar g
rou
p c
are
)
−17.
9% (
3)$6
9,51
9$2
6,36
0$6
,926
$88,
953
Fun
ctio
na
l fa
mily
th
era
py
on
pro
ba
tion
−18.
1% (
7)$3
5,47
0$1
6,68
6$2
,380
$49,
776
Ad
ole
sce
nt
div
ers
ion
p
roje
ct
(fo
r lo
we
r risk
o
ffe
nd
ers
)
−17.
6% (
6)$3
4,31
8$1
6,14
5$1
,975
$48,
488
Fam
ily in
teg
rate
d t
ran
si-tio
ns
−10.
2% (
1)$3
9,67
8$1
5,04
5$9
,970
$44,
753
Sex
off
en
de
r tre
atm
en
t−9
.7%
(5)
$49,
443
$8,0
61$3
3,84
2$2
3,66
2A
gg
ress
ion
rep
lac
em
en
t tr
ain
ing
−8.3
% (
4)$1
6,27
6$7
,657
$918
$23,
015
Mu
ltisy
ste
mic
th
era
py
−7.7
% (
10)
$15,
001
$7,0
57$4
,364
$17,
694
Tee
n c
ou
rts
−14.
0% (
5)$1
1,40
1$5
,507
$937
$15,
971
Re
sto
rativ
e ju
stic
e fo
r lo
w
risk
off
en
de
rs−8
.0%
(21
)$6
,479
$3,1
30$9
07$8
,702
Boo
t c
am
p t
o o
ffse
t in
stitu
tion
tim
e0%
(14
)$0
$0-$
8,32
5$8
,325
Inte
rag
en
cy
co
ord
ina
tion
p
rog
ram
s−1
.9%
(14
)$3
,726
$1,7
53$2
10$5
,269
Re
gu
lar s
urv
eill
an
ce
-o
rien
ted
pa
role
(ve
rsu
s n
o p
aro
le s
up
erv
isio
n)
0% (
2)$0
$0$1
,237
−$1,
237

187
Inte
nsiv
e p
rob
atio
n s
up
erv
i-sio
n p
rog
ram
s0%
(3)
$0$0
$1,6
50−$
1,65
0
Wild
ern
ess
ch
alle
ng
e0%
(9)
$0$0
$3,1
85−$
3,18
5In
ten
sive
pa
role
su
pe
rvisi
on
0% (
10)
$0$0
$6,6
70−$
6,67
0Sc
are
d s
tra
igh
t+
6.1%
(10
)−$
11,8
40−$
5,57
0$6
0−$
17,4
70Be
ha
vio
r mo
difi
ca
tion
−7.6
% (
4)$2
9,44
3$1
1,16
4n
/en
/eC
og
niti
ve-b
eh
avi
ora
l tr
ea
tme
nt
−2.6
% (
8)$5
,007
$2,3
56n
/en
/e
Co
un
selin
g/p
syc
ho
the
rap
y−1
6.6%
(6)
$32,
528
$15,
303
n/e
n/e
Co
urt
su
pe
rvisi
on
ve
rsu
s sim
ple
rele
ase
with
ou
t se
rvic
es
0% (
8)$0
$0n
/en
/e
Div
ers
ion
pro
gra
ms
with
se
r-vi
ce
s (v
ers
us
simp
le
rele
ase
)
0% (
7)$0
$0n
/en
/e
Div
ers
ion
pro
gra
ms
with
se
rvic
es
(ve
rsu
s re
gu
lar
juve
nile
co
urt
)
−3.1
% (
20)
$2,5
53$1
,233
n/e
n/e
Edu
ca
tion
pro
gra
ms
−19.
4% (
3)$7
5,72
2$2
8,71
3n
/en
/eG
uid
ed
gro
up
inte
rac
tion
0% (
4)$0
$0n
/en
/eIn
ten
sive
pro
ba
tion
(a
s a
ltern
ativ
e t
o in
ca
rce
ra-
tion
)
0% (
5)$0
$0n
/en
/e
Life
ski
lls e
du
ca
tion
pro
-g
ram
s−2
.5%
(3)
$9,5
85$3
,635
n/e
n/e
Oth
er f
am
ily-b
ase
d t
he
r-a
py
pro
gra
ms
−13.
3% (
12)
$26,
047
$12,
254
n/e
n/e
Tea
m c
hild
−9.7
% (
2)$7
,860
$3,7
97n
/en
/eP
reve
ntio
n P
rog
ram
s (C
rime
Re
du
ctio
n E
ffe
cts
On
ly)
Pre
-K e
du
ca
tion
fo
r lo
w-in
co
me
3-
an
d 4
-ye
ar-
old
s
−16.
6% (
8)$9
,882
$5,5
79$6
12$1
4,84
8
Nu
rse
fa
mily
pa
rtn
ers
hip
: c
hild
ren
−15.
7% (
1)$8
,515
$4,8
08$7
56$1
2,56
7
Nu
rse
fa
mily
pa
rtn
ers
hip
: m
oth
ers
−38.
2% (
1)$8
,093
$5,6
76$5
,580
$8,1
89
Gu
idin
g g
oo
d c
ho
ice
s−7
.2%
(1)
$959
$1,6
27n
/en
/eH
igh
sc
ho
ol g
rad
ua
tion
−21.
1% (
1)$3
,647
$5,9
15n
/en
/e
(Co
ntin
ue
d)

188
Tab
le 1
:(C
on
tinu
ed
)
Effe
ct o
n C
rime
O
utc
om
es:
Pe
rce
nt
Cha
nge
in C
rime
O
utc
om
es
and
the
N
umb
er o
f Evi
de
nce
-Ba
sed
Stu
die
s o
n W
hic
h th
e E
stim
ate
is
Base
d (
in P
are
nthe
ses)
Bene
fits
and
Co
sts
(Pe
r Pa
rtic
ipa
nt, N
et P
rese
nt V
alu
e, 2
007
Do
llars
)
Bene
fits
to
Crim
e V
ictim
s (o
f the
Re
duc
tion
in C
rime
)
Bene
fits
to
Taxp
aye
rs
(of t
he R
ed
uctio
nin
Crim
e)
Co
sts
(Ma
rgin
al
Pro
gra
m C
ost
, C
om
pa
red
to
the
Co
st o
f A
ltern
ativ
e)
Bene
fits
(To
tal)
Min
us C
ost
s (p
er P
arti
cip
ant
)
(1)
(2)
(3)
(4)
(5)
Pare
nt-
ch
ild in
tera
ctio
n
the
rap
y−5
.1%
(1)
$1,7
93$9
94n
/en
/e
Sea
ttle
soc
ial d
eve
lop
me
nt
pro
jec
t−1
5.7%
(1)
$2,2
70$3
,652
n/e
n/e
Pro
gra
m T
ype
s in
Ne
ed
of A
dd
itio
na
l Re
sea
rch
an
d D
eve
lop
me
nt
Befo
re W
e C
an
Co
nc
lud
e T
he
y D
o o
r Do
No
t R
ed
uc
e C
rime
O
utc
om
es:
Pro
gra
ms
Ne
ed
ing
Mo
re R
ese
arc
h fo
r Pe
op
le in
th
e A
du
lt O
ffe
nd
er S
yste
mC
om
me
nt
Ca
se m
an
ag
em
en
t in
th
e
co
mm
un
ity f
or d
rug
o
ffe
nd
ers
0% (
13)
Fin
din
gs
are
mix
ed
fo
r th
is b
roa
d g
rou
pin
g o
f pro
gra
ms.
CO
SA (
faith
-ba
sed
su
pe
rvisi
on
of s
ex
off
en
de
rs)
−35.
3% (
1)To
o f
ew
eva
lua
tion
s to
da
te.
Da
y fin
es
(co
mp
are
d t
o
sta
nd
ard
pro
ba
tion
)0%
(1)
Too
fe
w e
valu
atio
ns
to d
ate
.
Do
me
stic
vio
len
ce
co
urt
s0%
(2)
Too
fe
w e
valu
atio
ns
to d
ate
.Fa
ith-b
ase
d p
rog
ram
s0%
(5)
Too
fe
w e
valu
atio
ns
to d
ate
.In
ten
sive
su
pe
rvisi
on
o
f se
x o
ffe
nd
ers
in
th
e c
om
mu
nity
0% (
4)Fi
nd
ing
s a
re m
ixe
d f
or t
his
bro
ad
gro
up
ing
of p
rog
ram
s.
Me
dic
al t
rea
tme
nt
of s
ex
off
en
de
rs−2
2.0%
(1)
Too
fe
w e
valu
atio
ns
to d
ate
.

189
Mix
ed
tre
atm
en
t o
f se
x o
ffe
nd
ers
in t
he
c
om
mu
nity
0% (
2)To
o f
ew
eva
lua
tion
s to
da
te.
Re
gu
lar p
aro
le s
up
erv
isio
n
vers
us
no
pa
role
su
pe
rvisi
on
0% (
1)To
o f
ew
eva
lua
tion
s to
da
te.
The
rap
eu
tic c
om
mu
nity
p
rog
ram
s fo
r me
nta
lly il
l o
ffe
nd
ers
−21.
8% (
2)To
o f
ew
eva
lua
tion
s to
da
te.
Wo
rk re
lea
se p
rog
ram
s,
oth
er
−4.4
% (
4)To
o f
ew
rec
en
t e
valu
atio
ns.
Pro
gra
ms
Ne
ed
ing
Mo
re R
ese
arc
h f
or Y
ou
th in
th
e J
uve
nile
Off
en
de
r Sys
tem
Cu
rfe
ws
0% (
1)To
o f
ew
eva
lua
tion
s to
da
te.
Da
y re
po
rtin
g0%
(2)
Too
fe
w e
valu
atio
ns
to d
ate
.D
iale
ctic
al b
eh
avi
or
the
rap
y0%
(1)
Too
fe
w e
valu
atio
ns
to d
ate
.
Dru
g c
ou
rts
0% (
15)
Fin
din
gs
are
mix
ed
fo
r th
is b
roa
d g
rou
pin
g o
f pro
gra
ms.
Inc
rea
sed
dru
g t
est
ing
(o
n p
aro
le)
vers
us
min
ima
l dru
g t
est
ing
0% (
1)To
o f
ew
eva
lua
tion
s to
da
te.
Job
s p
rog
ram
s0%
(3)
Too
fe
w re
ce
nt
eva
lua
tion
s.M
en
torin
g0%
(1)
Too
fe
w e
valu
atio
ns
to d
ate
.Th
era
pe
utic
co
mm
un
itie
s0%
(1)
Too
fe
w e
valu
atio
ns
to d
ate
.
“n/e
” m
ea
ns
no
t e
stim
ate
d a
t th
is t
ime
; pre
ven
tion
pro
gra
m c
ost
s a
re p
art
ial p
rog
ram
co
sts,
pro
rate
d t
o m
atc
h c
rime
ou
tco
me
s.

190 E. K. Drake, S. Aos, and M. G. Miller
We reviewed and meta-analyzed the findings of 545 comparison-groupevaluations of adult corrections, juvenile corrections, and prevention programs.Each of these evaluations included at least one relevant crime outcome thatwe were able to analyze. It is important to note that evaluations of preventionprograms typically measure several other outcomes in addition to crime, suchas measures of education, substance abuse, and child abuse. In Table 1, however,we show only the results of crime effects for studies that measured crime out-comes. In an earlier institute report, we analyzed the degree to which a widearray of evidence-based prevention programs affected noncrime outcomes (Aoset al., 2004).
To make this information useful for policy making in Washington, we cat-egorized each of these 545 evaluations into relevant subject areas. For example,we found 57 evaluations of adult drug courts, and we analyzed these studiesas a group. This categorization process illustrates a key characteristic of ourstudy. For each category of programs we analyze, our results reflect the evidence-based effect we expect for the “average” program. As shown in Table 1, our resultsindicate that the average adult drug court reduces the recidivism rate of par-ticipants by 8.7%. Some drug courts, of course, achieve better results than this,some worse. On average, however, we find that the typical drug court can beexpected to achieve this result.
At the bottom of Table 1, we also list a number of programs for which theresearch evidence, in our judgment, is inconclusive at this time. Some of theseprograms have only one or two rigorous (often small sample) evaluations thatdo not allow us to draw general conclusions. Other programs have more evalu-ations but the program category is too diverse or too general to allow meaningfulconclusions to be drawn at this time. Subsequent research on these types of pro-grams is warranted.
In column 1 of Table 1, we show the expected percentage change in crimeoutcomes for the program categories we review. This figure indicates the averageamount of change in crime outcomes—compared to no treatment or treatment asusual—that can be achieved by a typical program in each category of programs. Anegative value indicates the magnitude of a statistically significant reductionin crime. A zero percent change means that, based on our review of the evidence,a typical program does not achieve a statistically significant change in crimeoutcomes. A few well-researched programs have a positive sign indicating thatcrime is increased with the program, not decreased. In addition to reportingthe effect of the programs on crime outcomes, column 1 also reports the numberof studies on which the estimate is based.
As an example of the information provided in Table 1, we analyzed thefindings from 25 well-researched studies of cognitive-behavioral programs foradult offenders in prison and community settings. We find that, on average,these programs can be expected to reduce recidivism rates by 6.9%. Thesefindings are consistent with Landenberger and Lipsey (2005). To put this in

Public Policy Options 191
perspective, our analysis indicates that, without a cognitive-behavioral program,about 63% of offenders will recidivate with a new felony or misdemeanor con-viction after a 13-year follow-up. If these same offenders had participated inthe evidence-based cognitive-behavioral treatment program, then we expecttheir recidivism probability would drop four points to 59%—a 6.9% reductionin recidivism rates.
Table 1 shows there are many programs in the adult criminal justice system,in addition to cognitive-behavioral programs, that are effective at reducingcrime, such as vocational education in prison, drug treatment, correctional indus-tries, and employment and work programs. Other programs such as intensivesupervision, however, are only found to be effective when coupled with treatment-oriented programs—intensive supervision alone is not found to be effective.
As noted, most of the categories we report in Table 1 are for general typesof policy-relevant programs, such as drug treatment in prison or adult basiceducation in prison. We also categorize and report, however, the results of sev-eral very specific programs, such as a program for juvenile offenders named“functional family therapy.”
The functional family therapy (FFT) program follows a specific trainingmanual and approach. These types of programs are more capable of beingreproduced in the field when appropriate quality control is assured. Several ofthese programs have been listed as “Blueprint” programs by the Center forthe Study and Prevention of Violence at the University of Colorado (Center forthe Study and Prevention of Violence, n.d.).
The FFT program, which has been implemented in Washington, involvesan FFT-trained therapist working for about three months with a youth in thejuvenile justice system and his or her family. The goal is to increase the likeli-hood that the youth will stay out of future trouble. We located and meta-analyzedseven rigorous evaluations of this program—one conducted in Washington—and found that the average FFT program with quality control can be expectedto reduce a juvenile’s recidivism rate by 18.1%. Our analysis indicates that,without the program, a youth has a 70% chance of recidivating for another felonyor misdemeanor conviction after a 13-year follow-up. If the youth participatesin FFT, then we would expect the recidivism rate to drop to 57%—an 18.1%reduction.
In addition to FFT, many other juvenile justice programs are also shownto be effective at reducing crime and often produce a greater reduction inrecidivism than adult programs. Such programs include the adolescent diver-sion project for lower risk offenders, multidimensional treatment foster care,and multisystemic therapy.
A third example is a prevention program called nurse family partnership(NFP), another program that has been implemented in Washington. This pro-gram provides intensive visitation by nurses to low-income, at-risk womenbearing their first child; the nurses continue to visit the home for two years

192 E. K. Drake, S. Aos, and M. G. Miller
after birth. Thus far, there is evidence that NFP reduces the crime outcomesof the mothers and, many years later, the children born to the mothers. Bothof these effects are included in our analysis of the program. Our analysis ofthe NFP studies indicates that the program has a large effect on the futurecriminality of the mothers who participate in the program, reducing crimeoutcomes by 38.2%. NFP also reduces the future crime levels of the youth by15.7% compared with similar youth who did not participate in the NFP program.
What Are the Costs and Benefits?While our first research question deals with what works, our second question
concerns economics. We find that there are economically attractive evidence-based options in three areas: adult corrections programs, juvenile correctionsprograms, and prevention. Per dollar of spending, several of the successfulprograms produce favorable returns on investment. Public policies incorporatingthese options can yield positive outcomes for Washington.
Table 1 also contains our estimates of the benefits and costs of many of theprogram categories we analyze. Within three broad groupings—programs foradult offenders, programs for juvenile offenders, and prevention programs—we rank many of the options by our assessment of each program’s “bottomline” economics for reducing crime.
For programs that have an evidence-based ability to affect crime, we esti-mate benefits from two perspectives: taxpayers’ and crime victims’. For example,if a program is able to achieve statistically significant reductions in recidivismrates, then taxpayers will spend less money on the criminal justice system.Similarly, if a program produces less crime, then there will be fewer crime victims.The estimates shown in columns 2 and 3 of Table 1 display our estimates ofvictim and taxpayer benefits, respectively. Of course, a program category thatdoes not achieve a statistically significant reduction in crime outcomes willnot produce any benefits associated with reduced crime.
In column 4 we show our estimates of the costs per participant for many ofthe programs. At this time, we have not estimated the costs for every programcategory listed on Table 1; thus, we do not produce full cost-benefit results forall programs in the table.
Finally, in column 5 of Table 1, we show our “bottom line” estimate of thenet gain (or loss). These figures are the net present values of the long-run benefitsof crime reduction minus the net up-front costs of the program. This providesour overall measure of what each type of program can be expected to achieveper program participant.
An examination of column 5 provides an important finding from our analysis.While there are many adult corrections programs that provide a favorable returnto taxpayers, there are some programs for juvenile offenders that produce espe-cially attractive long-run economic returns.
Public Policy Options 193
To continue the three examples already discussed, we find that the averagecognitive-behavioral program costs about $107 per offender to administer. Theseprograms are typically run in groups of 10 to 15 offenders and involve 40 to60 hours of therapeutic time. We estimate that the 6.9% reduction in recidi-vism rates generates about $15,469 in life-cycle benefits (a present-valuedsum) associated with the crime reduction. Thus, the net value of the averageevidence-based cognitive-behavioral program for adult offenders is $15,361 peroffender.
For the functional family therapy example, we find that the program costs,on average, $2,380 per juvenile participant. The costs are higher because it is aone-on-one program between a FFT therapist and the youth and his or herfamily. The 18.1% reduction in recidivism rates that we expect FFT to achievegenerates about $52,156 in life-cycle benefits, measured in terms of the tax-payer and crime victim costs that are avoided because of the reduced long-runlevel of criminal activity of the youth. Thus, the net present value of this juvenilejustice program is expected to be $49,776 per youth.
For the NFP program, we find that the crime reduction associated withthe mothers produces $8,189 in benefits while the crime reduction linked tothe children produces $12,567 in benefits. Together, the benefits total $20,756 perparticipant in NFP. We estimate the total cost of the NFP program to be$6,336 per family for crime-related outcomes. For our current study of crimeoutcomes, we prorate the NFP total program cost per participant by the ratioof crime benefits to total benefits estimated from our earlier study of preventionprograms. In addition to crime outcomes, the NFP program has been shown toreduce child abuse and neglect and increase educational test scores (Aos et al.,2004).
As mentioned, we find that some programs show no evidence that theyreduce crime outcomes. This does not mean, however, that these programs arenot economically viable options. An example of this type of program is elec-tronic monitoring for adult offenders. As indicated in Table 1, we locatedtwelve studies of electronic monitoring and find that the average electronicmonitoring program does not have a statistically significant effect on recidi-vism rates. As future evaluations are completed, this result may change; butcurrently we report no crime reduction benefits in columns 2 and 3. We doexpect, however, that the average electronic monitoring program is typicallyused in Washington to offset the costs of more expensive resources to processthe sanctions of the current offense. That is, we find that an average electronicmonitoring program costs about $1,301 per offender. The alternative to elec-tronic monitoring, however, is most often increased use of jail time, and weestimate this to cost $2,227 per offender. The cost shown on column 4 (-$926)is our estimate of the difference in these up-front costs. The bottom line isreported in column 5 and provides evidence that electronic monitoring can bea cost-beneficial resource. Thus, although there is no current evidence that

194 E. K. Drake, S. Aos, and M. G. Miller
electronic monitoring reduces recidivism rates, it can be a cost-effective resourcewhen it is used to offset the costs of a more expensive criminal justice systemresource such as jail time.
CONCLUSIONS
Public policy makers in Washington have learned a number of lessons fromtheir experience with evidence-based initiatives. First, it is possible toundertake a careful review of evidence-based options and then use theresults to inform public policy decisions in a “real-world” setting. This initia-tive began in Washington in the mid-1990s when legislation was enacted inthe juvenile justice system with the goal of reducing crime through research-based programs. After a review of the national literature, the institute (inconjunction with the state’s juvenile courts) identified particular research-based programs to be implemented in Washington, which were subsequentlyfunded by the legislature. Evaluations of these programs indicated theyreduce crime and are cost-beneficial to Washington when implemented withfidelity. In the years after this initial successful endeavor, the Washingtonlegislature introduced the evidence-based approach to other policy areas includ-ing child welfare, mental health, substance abuse, K–12 education, andadult corrections. In 2006, the institute conducted a meta-analytic reviewof the criminal justice and prevention literature and found that evidence-based options exist to reduce the need for future prison construction whilesaving taxpayers’ money and contributing to lower crime rates. Based uponthese findings, significant investments were made in Washington by allocat-ing $48 million in the biennial budget for expanded use of evidence-basedprograms.
Policy makers in Washington have also learned that estimating the eco-nomics of an evidence-based program is as important as determining whetheror not a program works. A program may be found to reduce crime, but its costsmay exceed benefits. Legislators routinely face budget constraints and, as aresult, an economic analysis of options can improve decisions on how to allo-cate scarce resources. Thus, while determining whether a program reducescrime remains the necessary first condition for rational public policy making,an economic analysis constitutes the necessary additional condition for identi-fying viable and fiscally prudent options.
Our analysis of evidence-based and economically sound options for correctionsindicates that there are ways to provide more cost-effective use of taxpayers’monies. Serious crime is costly to victims and taxpayers; our economic analy-sis for Washington indicates that evidence-based—and reasonably priced—programs that achieve even relatively small reductions in crime can produceattractive returns on investment.

Public Policy Options 195
NOTES
1. The Washington State Institute for Public Policy conducts nonpartisan research atthe direction of the state’s legislature, and findings are used to help inform public policymakers.
2. The institute maintains a criminal records database, which is a synthesis of criminalcharge information, for all individuals in Washington.
3. Citations used in the meta-analysis are found at http://www.wsipp.wa.gov/rptfiles/CrimeCitations.pdf.
4. Additional information on the programs shown in Table 1 can be obtained from theinstitute.
5. We use a two-tailed test in order to determine statistical significance and we setthe p value at less than or equal to .10 to designate statistical and policy-relevantsignificance.
REFERENCES
Aos, S., Lieb, R., Mayfield, J., Miller, M., & Pennucci, A. (2004). Benefits and costs of pre-vention and early intervention programs for youth: Technical appendix (DocumentNo. 04–07–3901). Olympia, WA: Washington State Institute for Public Policy.
Aos, S., Miller, M., & Drake, E. (2006). Evidence-based public policy options to reducefuture prison construction, criminal justice costs, and crime rates (Document 06–10–1201). Olympia, WA: Washington State Institute for Public Policy.
Barnoski, R. (2004). Outcome evaluation of Washington State’s research-based programsfor juvenile offenders (Document No. 04–01–1201). Olympia, WA: Washington StateInstitute for Public Policy.
Capital Budget, Rev. Code of Wash. § 488–708 (2005).
Center for the Study and Prevention of Violence. (n.d.). Blueprints for violence prevention.Retrieved March 11, 2008, from http://www.colorado.edu/cspv/blueprints
Coalition for Evidence-Based Policy. (2003). Identifying and implementing educationalpractices supported by rigorous evidence: A user friendly guide. Washington, DC:The Council for Excellence in Government, Author.
Farrington, D., & Loeber, R. (2000). Some benefits of dichotomization in psychiatricand criminological research. Criminal Behaviour and Mental Health, 10, 100–122.
Hedges, L. V. (1981). Distribution theory for Glass’s estimator of effect size and relatedestimators. Journal of Educational Statistics, 6, 107–128.
Landenberger, N. A., & Lipsey, M. W. (2005). The positive effects of cognitive-behavioralprograms for offenders: A meta-analysis of factors associated with effective treatment.Journal of Experimental Criminology, 1, 451–476.
Lipsey, M. W. (2003). Those confounded moderators in meta-analysis: Good, bad, andugly. The Annals of the American Academy of Political and Social Science, 587(1),69–81.
Lipsey, M. W., & Wilson, D. B. (2001). Practical meta-analysis. Thousand Oaks, CA:Sage Publications.
Miller, T. R., Cohen, M. A., & Wiersema, B. (1996). Victim costs and consequences: Anew look (Document No. NCJ155282). Washington, DC: National Institute ofJustice.

196 E. K. Drake, S. Aos, and M. G. Miller
Petrosino, A., & Soydan, H. (2005). The impact of program developers as evaluatorson criminal recidivism: Results from meta-analyses of experimental and quasi-experimental research. Journal of Experimental Criminology, 1(4), 435–450.
Rhodes, W., Pelissier, B., Gaes, G., Saylor, W., Camp, S., & Wallace, S. (2001). Alternativesolutions to the problem of selection bias in an analysis of federal residential drugtreatment programs. Evaluation Review, 25(3), 331–369.
Sánchez-Meca, J., Chacón-Moscoso, S., & Marín-Martínez, F. (2003). Effect-size indicesfor dichotomized outcomes in meta-analysis. Psychological Methods, 8(4), 448–467.
Sentencing Reform Act, 9 Rev. Code of Wash. Chap. 94A-1981.
Sherman, L., Gottfredson, D., MacKenzie, D., Eck, J., Reuter, P., & Bushway, S.(1998). Preventing crime: What works, what doesn’t, what’s promising: A report tothe United States Congress. College Park: University of Maryland at College Park,Department of Criminology and Criminal Justice.