Elizabeth Arden Presentation
19
Samantha Ritcher
description
Seminar 510 - Elizabeth Arden Presentation
Transcript of Elizabeth Arden Presentation

Samantha Ritcher

Florence Nightingale Graham
1910 – 1st shop on 5th Avenue, NYC
1915 – International Expansion
◦ 120 countries now
Healthy products
◦ Fragrance, Skin Care & Make-Up
By 1930’s – Red Door Salons
Upscale by celebrities
◦ Queen Mary, Queen Elizabeth II,
Marilyn Monroe, Jacqueline Kennedy
History & Brief Description

Goal: Anti-aging, lift & firm, balance skin tone & hydration
Category: Serums, creams, cleansers, toners, eye care, lip care, night treatments and moisturizers
Collections: Ceramide, Prevage, Visible Difference, and 8-Hour Cream◦ Variety Gift Sets
18% Sales◦ $226,408
of $1,238,273
Skin Care

Face: Foundation, powder, concealer, blush and bronzer
Eyes: Eye shadow, mascara, eye liner, and brows
Lips: Lipsticks, lip glosses and lip pencils
Brushes, Tools & Gift Sets
6% of Sales◦ $69,996
of $1,238,273
Cosmetics

Scents: Sophisticated, Elegant, Romantic, Energized, Fresh, Confident and Glamorous
Type: Perfume, Sprays, Bath & Shower
Collections: Red Door, Green Tea, Mediterranean, Blue Grass, 5th Avenue, Pretty and others◦ Variety Gift Sets
76% of sales◦ $941,869
of $1,238,273
Fragrances

May 2012 - Ed Hardy, True Religion and BCBGMAXAZRIA fragrance brands from New Wave Fragrances
September 2012 - $12 million investment in Red Door Spa Holdings
Recent Acquisitions & Financial Investments
June 2012 –Justin Bieber and Nicki Minaj fragrance brands from Give Back Brands

Brand Portfolio
Celebrity Fragrances Designer Fragrances Britney Spears Elizabeth Taylor Justin Bieber Mariah Carey Nicki Minaj Taylor Swift Usher
Juicy Couture Alfred Sung BCBGMAXAZRIA Ed Hardy Geoffrey Beene Halston John Varvatos, Kate Spade Lucky Brand Rocawear True Religion
Lifestyle Fragrances
Curve Giorgio Beverly Hills P.S. Fine Cologne

Elizabeth Arden Boutiques, Department Stores:
◦ , Dillard’s, Saks, Belk, and Nordstrom
Specialty Stores:◦ Ulta &
Retail Stores:◦ (13% of Net Sales)◦ Kohl’s, Walgreens, and CVS
International Retailers E-commerce site at www.elizabetharden.com Ship to distribution centers & direct-to-store
Sales & Distribution

Develop consumer loyalty for Red Door Spa’s & Elizabeth Arden
Global repositioning of the Elizabeth Arden brand
Expanding the market penetration in international markets
Continuing to expand the fragrance category at mass retail customers in North America
Growth for existing brands, new licensing opportunities and acquisitions, and new product innovation
Business and Growth Strategy
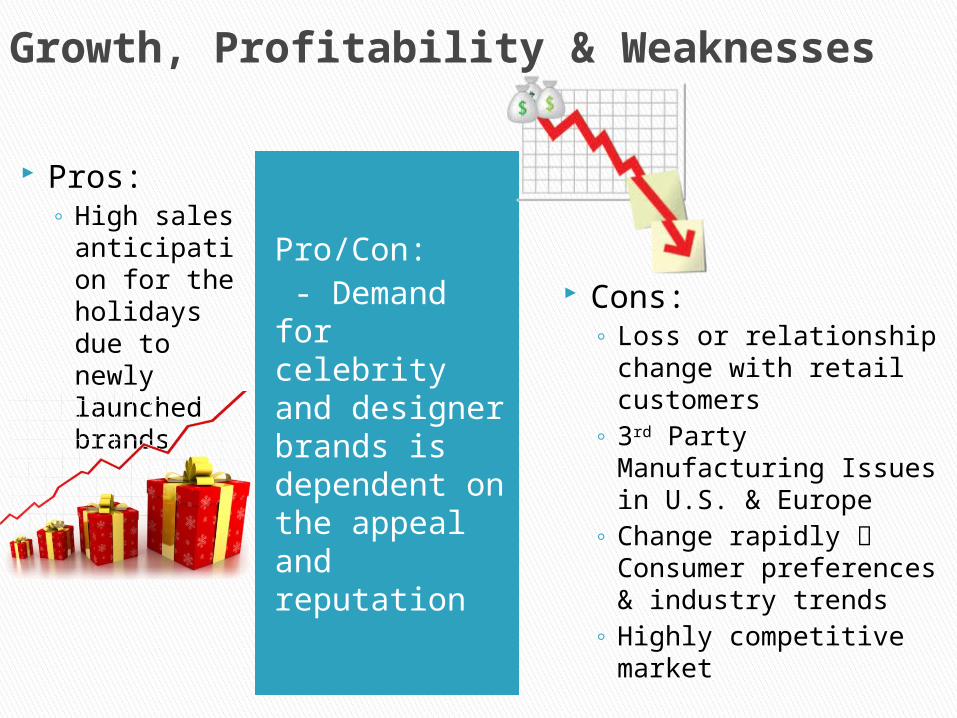
Growth, Profitability & Weaknesses
Pro/Con: - Demand for celebrity and designer brands is dependent on the appeal and reputation
Pros:◦ High sales
anticipation for the holidays due to newly launched brands
Cons:◦ Loss or relationship
change with retail customers
◦ 3rd Party Manufacturing Issues in U.S. & Europe
◦ Change rapidly Consumer preferences & industry trends
◦ Highly competitive market
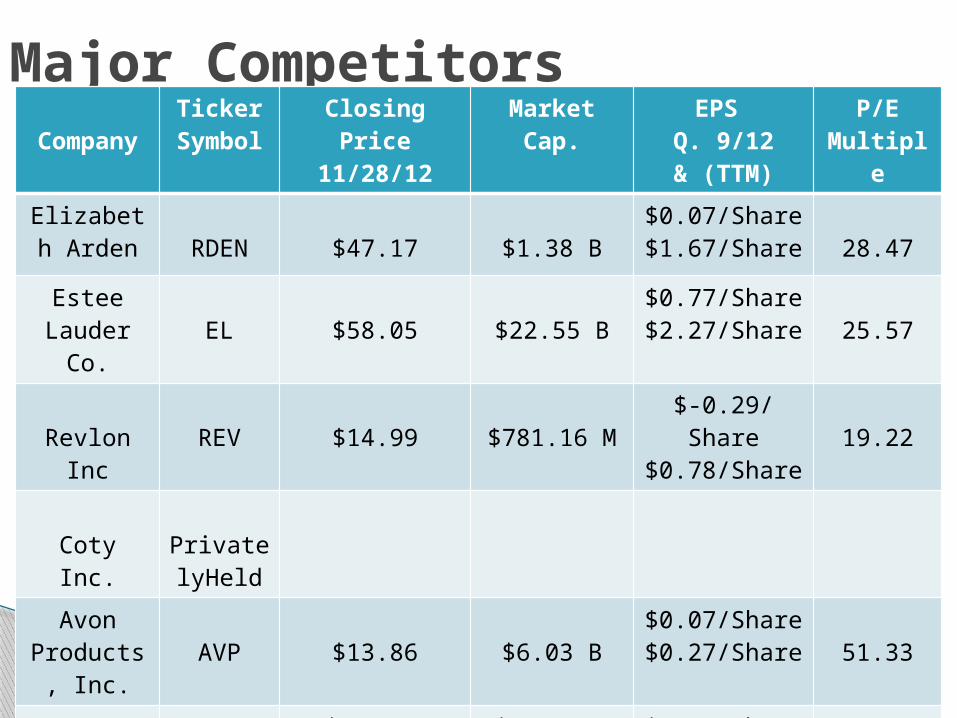
Major CompetitorsCompan
y
Ticker Symbol
Closing Price
11/28/12
Market Cap.
EPS Q. 9/12& (TTM)
P/EMultipl
e
Elizabeth Arden RDEN $47.17 $1.38 B
$0.07/Share$1.67/Share 28.47
Estee Lauder
Co.EL $58.05 $22.55 B
$0.77/Share$2.27/Share 25.57
Revlon Inc REV $14.99 $781.16 M$-0.29/Share$0.78/Share 19.22
Coty Inc. PrivatelyHeld
Avon Products,
Inc.AVP $13.86 $6.03 B
$0.07/Share$0.27/Share 51.33
L’Oreal OR$104.75
Euros$136.57 USD
$62.62 B E$81.64B US
$4.41/Share TTM 23.75

North America: 67% of Net Sales◦ 58% in the U.S. in 2012
International: 33% of Net Sales◦ Sales in 120 Countries◦ Growth in Brazil, the Middle East, Russia, UK and Germany
37% of sales from E-Commerce Site
Major Markets
Unite
d Ki
ngdo
m
Canad
a
Aust
ralia
Sout
h Af
rica
Spai
n
China
$71.7
$45.1$40.2
$25.5$17.7
$14.6
Largest Foreign Countries for Net Sales 2010-2012

Stock Price Over a 1 Year Period
Closing Price 11/28/2011: $34.02
Closing Price 11/28/2012: $47.17

Debt-to-equity = Debt = 464,000 Equity 489,644 = 94.7%
Current Ratio = Current Assets = 823,163 Current Liabilities 483,005
= 1.70 times
Key Financial Ratios

Annual Yield = Dividend = 0 = 0% Market Price 47.55
Earnings Per Share = Net income after taxes Common shares
outstanding
For the quarter ending September 2012: 2,184 = $0.07
29,417TTM (from website)= $1.67
Key Financial Ratios

Net Profit Margin= Net Income After Taxes Sales For the quarter ending September 2012 : 2,184 = 0.63% 344,541
TTM (from website) = 3.94%
Key Financial Ratios
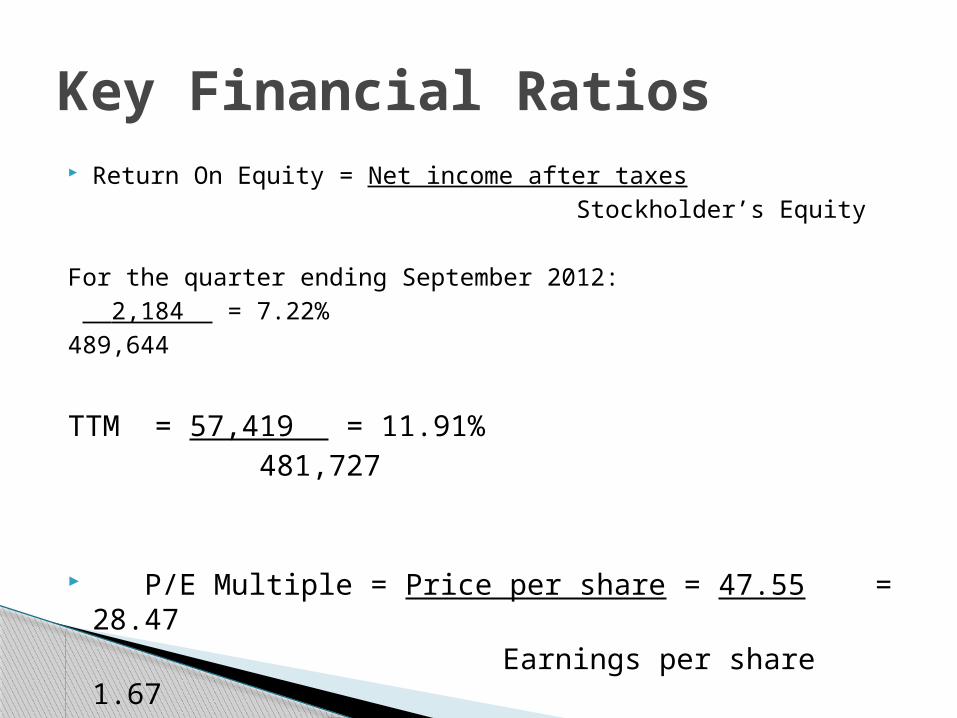
Return On Equity = Net income after taxes Stockholder’s Equity
For the quarter ending September 2012: 2,184 = 7.22% 489,644
TTM = 57,419 = 11.91% 481,727
P/E Multiple = Price per share = 47.55 = 28.47
Earnings per share 1.67
Key Financial Ratios

Book Value per Share = Total Shareholder Equity – Preferred Equity Total Outstanding Shares
For the quarter ending September 2012 : 489,644 = $16.65 29,417
Gross Profit Margin = Revenue - COGS Revenue
For the quarter ending September 2012 344,541 – 197,142 = 42.78%
344,541
Key Financial Ratios

Plans for 2013:◦ Launch new line of Visible Difference and Prevage skin
care products◦ Launch new line of celebrity and Red Door Fragrances
Strengths – Wide variety, items that make you feel healthy and beautiful, growing portfolio labels
Financials ARE growing – Stock Price: ◦ High of 2010: $24.00◦ High of 2011: $37.94◦ High of 2012: $40.19◦ High so far of 2013 Fiscal Financials: $47.55
2013 Anticipation: Net Sales Increase 15% over Fiscal 2012
Constantly growing and expanding via brands and geographically
Assessment & Future Outlook