Elite Patterns for ETFs&Stocks Free Chapter
22
Transcript of Elite Patterns for ETFs&Stocks Free Chapter


Elite Patterns for ETFs & Stocks:
Intraday Trading Strategies for High Profit
by DISFA Global
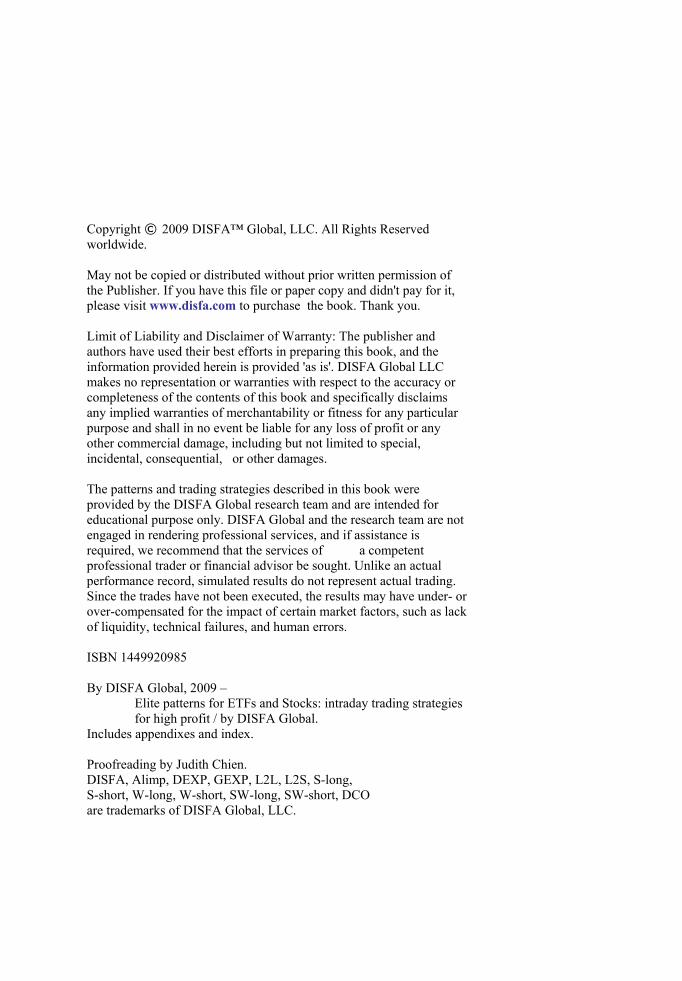
Copyright © 2009 DISFA™ Global, LLC. All Rights Reserved worldwide. May not be copied or distributed without prior written permission of the Publisher. If you have this file or paper copy and didn't pay for it, please visit www.disfa.com to purchase the book. Thank you. Limit of Liability and Disclaimer of Warranty: The publisher and authors have used their best efforts in preparing this book, and the information provided herein is provided 'as is'. DISFA Global LLC makes no representation or warranties with respect to the accuracy or completeness of the contents of this book and specifically disclaims any implied warranties of merchantability or fitness for any particular purpose and shall in no event be liable for any loss of profit or any other commercial damage, including but not limited to special, incidental, consequential, or other damages. The patterns and trading strategies described in this book were provided by the DISFA Global research team and are intended for educational purpose only. DISFA Global and the research team are not engaged in rendering professional services, and if assistance is required, we recommend that the services of a competent professional trader or financial advisor be sought. Unlike an actual performance record, simulated results do not represent actual trading. Since the trades have not been executed, the results may have under- or over-compensated for the impact of certain market factors, such as lack of liquidity, technical failures, and human errors. ISBN 1449920985 By DISFA Global, 2009 –
Elite patterns for ETFs and Stocks: intraday trading strategies for high profit / by DISFA Global.
Includes appendixes and index. Proofreading by Judith Chien. DISFA, Alimp, DEXP, GEXP, L2L, L2S, S-long, S-short, W-long, W-short, SW-long, SW-short, DCO are trademarks of DISFA Global, LLC.

iii
CONTENT
ACKNOWLEDGMENTS v
INTRODUCTION 1
Chapter 1 Fast reversal after exponential price drop 3
Chapter 2 Fast reversal after exponential price increase 15
Chapter 3 Price reversal after two equal waves down 27
Chapter 4 Price reversal after two equal waves up 41
Chapter 5 Fast reversal after two exponential waves down 55
Chapter 6 Fast reversal after two exponential waves up 67
Chapter 7 Two equal waves down with money flow confirmation 81
iv CONTENT
Chapter 8 Two equal waves up with money flow confirmation 95
Chapter 9 Strong trend detection 111
Chapter 10 Down trend detection 123
Chapter 11 Fast reversal after morning gap down 135
Chapter 12 Combinatorial Development of Robust Trading Systems 147
Appendix A. Detailed statistics of patterns on ETFs 154
Appendix B. Summary statistics of patterns 176
INDEX 179
v
ACKNOWLEDGMENTS
More than sixty researchers and software developers made contributions to this book. The team behind this work has many years of experience in advanced pattern discovery and recognition. Experts who hold Ph.D.’s in Artificial Intelligence, Pattern Recognition, Mathematical Cybernetics, and Computational Statistics designed the architecture for DISFA™ pattern engine and Alimp™ software for automated creation of robust trading systems. Teams of programmers and quality assurance engineers developed fast algorithms for pattern recognition, adaptive money management, capital protection and robotic trading. These software systems and algorithms were used by the writers to run an indepth research project focusing on elite patterns for ETF’s and stocks. The contributions of the teams and each team member were critically important; this is why there are no traditional authors. The entire DISFA Global team authored this book.

1
INTRODUCTION
This book has two objectives: to describe highly profitable intraday patterns for ETFs, leveraged ETFs and stocks, and to provide detailed statistics for each pattern. Seven years ago we started a research project to answer the following question: which patterns provide the best profit opportunities? There are many good books written about chart patterns, and we did not want to publish one more book about known patterns. Instead we focused only on elite patterns, which provide the highest profit potential in short-term trading for ETFs, leveraged ETFs and stocks. To find the best patterns, a special intelligent pattern engine, called DISFA™, was created to automate the recognition and analysis of the most profitable patterns. Instead of analyzing traditional patterns, researchers used raw data, i.e. one-minute price and volume data, to discover elite patterns. The elite patterns engine allowed us to analyze more than 12 million intraday sessions for ETFs, leveraged ETFs and stocks. As a result, the following groups of highly profitable patterns were chosen for detailed analysis: fast exponential reversals, morning reversals, strong trends and several patterns based on equal waves. The book addresses two groups of readers: traders and trading systems developers. By studying the pattern descriptions and illustrations of historical price charts, traders will be able to learn how to recognize elite patterns. Statistical data, such as the probability of the price reaching a certain target, and the average price increase/decrease for each pattern, help the trader decide which pattern fits his/her personal trading style. The trading system developer will find important information about the statistical quality of patterns together with lists of basic factors and parameters that define a particular type of pattern. Elite patterns were analyzed for the most liquid ETFs, leveraged ETFs and stocks. To deliver high quality research, each group of financial instruments was analyzed separately. The patterns for ETFs and stocks may look similar,

INTRODUCTION 2
but their parameters may differ greatly. This is why each pattern description includes separate statistics for ETFs, leveraged ETFs and stocks. Each chapter of this book represents one pattern and may be read independently. Every chapter contains the following information about the pattern:
- pattern description; - statistics for stocks with comments; - pattern identification factors for stocks; - recommendations for trading the pattern; - statistics for ETFs with comments; - pattern identification factors for ETFs; - statistics for leveraged ETFs with comments; - pattern identification factors for leveraged ETFs; - conclusion.
The final chapter describes the main concept of the Alimp™ software system, which uses combinatorial intelligence to automatically create and test millions of trading systems based on elite patterns. Each chapter of the book uses detailed illustrations to help present the concept of elite patterns. Statistics for stocks, ETFs and leveraged ETFs helps estimate the quality of the pattern for every group of instruments. Pattern identification factors provide rules and parameters in order to recognize the pattern during a trading session. Recommendations for trading this pattern include analysis of meta information such as market sentiment and stock strength/weakness. The chapters of this book can be read in any order. An abundance of visual information is provided to make understanding easier. For more information about elite patterns, the DISFA engine and the Alimp software system visit www.disfa.com.

55
Chapter 5. Fast reversal after two exponential waves down
Pattern code: W-long™
This elite pattern is a combination of two structures: two equal waves down and an exponential drop of price.
Pattern description
The price declines quickly by two equal waves; the second wave forms an exponential curve (Fig. 5.1). A reversal after two waves and an exponential drop has the best statistics among all patterns.
Fig. 5.1 AGO: Assured Guaranty LTD. Stock experienced fast rally of 9.6% after W-long reversal pattern confirmed by volume spike.

Chapter 5. W-long 56
Statistics for stocks
Statistics for the W-long pattern was calculated on stocks of three exchanges: NASDAQ, NYSE and AMEX, using a one-minute intraday price and volume data for the 2003-2008 period. To determine the potential profit of the pattern (intraday price increase after signal), the following rules were used: entry price – low of next one-minute bar after W-long pattern was detected; ideal exit price – intraday high after reversal started (Fig. 5.2).
Fig. 5.2 HIG: Hartford Financial Services. Price formed two waves, with exponential shape of second wave. Entry price – low of next bar after signal; ideal exit price – high of price bounce. Stock reversed and made 4.4% rally in 40 minutes.
To estimate the statistical quality of the W-long pattern for stocks, four parameters were calculated: average price increase after signal; probability of price increase greater than 1%, 2% and 3%; probability of reaching Fibonacci lines 23.6% and 38.2% from low after signal; probability of reaching 2% stop (Table 5.1). Fibonacci lines are calculated by using the intraday high before price decline and the low after signal (Fig. 5.3).

Fast reversal after two exponential waves down
57
Description ValueAverage potential profit 4.49%
Probability1% 0.872% 0.743% 0.60
Fib 23.6% 0.79Fib 38.2% 0.64
Probability of reaching 2% stop 0.06
TABLE 5.1 Statistics of W-long pattern on stocks
Probability of potential profit greater than
Probability of reaching Fibonacci lines from low after signal
Comments
This is a really elite pattern. A price reversal after two exponential waves has an excellent average price increase of 4.49% and a high probability of growing by 1%-3% and reaching Fibonacci lines of 23.6% and 38.2%.
Fig. 5.3 FUQI: Fuqi International, Inc. Price formed two exponential waves. After reversal stock reached third Fibonacci line 50% in 30 min. Profit potential was 4.7%.
Chapter 5. W-long 58
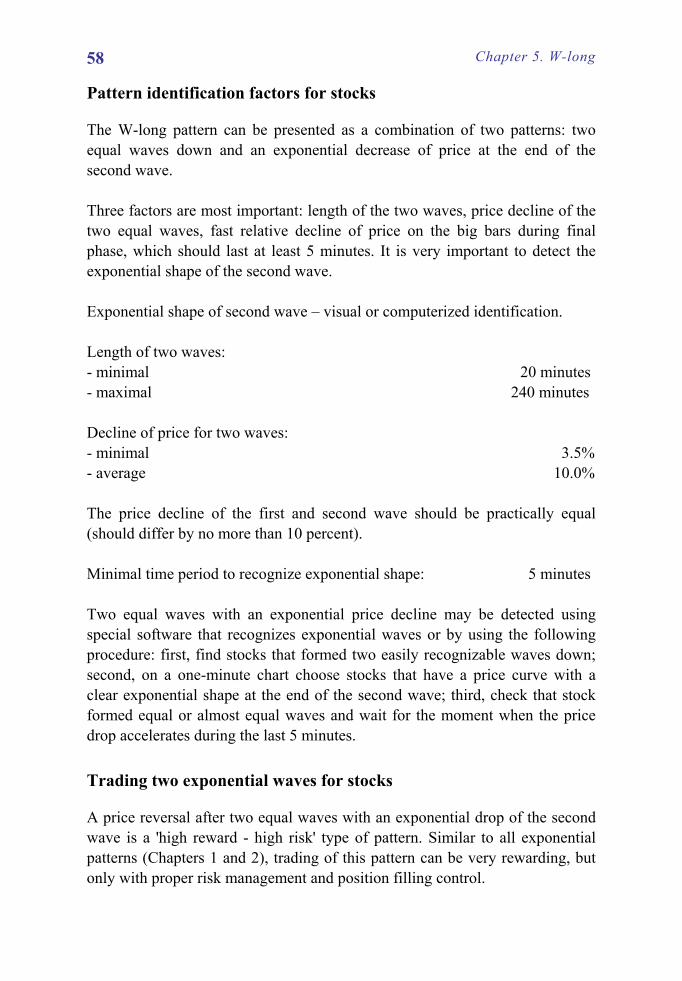
Pattern identification factors for stocks
The W-long pattern can be presented as a combination of two patterns: two equal waves down and an exponential decrease of price at the end of the second wave. Three factors are most important: length of the two waves, price decline of the two equal waves, fast relative decline of price on the big bars during final phase, which should last at least 5 minutes. It is very important to detect the exponential shape of the second wave. Exponential shape of second wave – visual or computerized identification. Length of two waves: - minimal 20 minutes - maximal 240 minutes Decline of price for two waves: - minimal 3.5% - average 10.0% The price decline of the first and second wave should be practically equal (should differ by no more than 10 percent). Minimal time period to recognize exponential shape: 5 minutes Two equal waves with an exponential price decline may be detected using special software that recognizes exponential waves or by using the following procedure: first, find stocks that formed two easily recognizable waves down; second, on a one-minute chart choose stocks that have a price curve with a clear exponential shape at the end of the second wave; third, check that stock formed equal or almost equal waves and wait for the moment when the price drop accelerates during the last 5 minutes.
Trading two exponential waves for stocks
A price reversal after two equal waves with an exponential drop of the second wave is a 'high reward - high risk' type of pattern. Similar to all exponential patterns (Chapters 1 and 2), trading of this pattern can be very rewarding, but only with proper risk management and position filling control.

Fast reversal after two exponential waves down
59
The risk may be reduced by waiting for price reversal confirmation, based on money flow. The one-minute OIH chart (Fig 5.4) shows that in a couple of minutes after detection of the W-long pattern active buyers stepped in, creating a big spike in volume: the green volume bar is much greater than the previous red bar. Two exponential waves may be confirmed by geometry: inverse head and shoulders, double and round bottoms and others; together with money flow, the confirmation of geometrical patterns greatly increases the probability of realizing a high profit. The W-long pattern is a combination of the L2L- and DEXP-patterns; hence trading strategies from the corresponding chapters (Chapters 1 and 3) can be applied.
Fig. 5.4 OIH: Oil Service HOLDRs (ETF). ETF experienced fast rally after exponential reversal pattern was confirmed by volume spike.
It is important to remember that while the exponential waves pattern has the highest average potential profit, it is also pretty rare. If such a pattern is detected, then a good strategy is to fill the position by small portions and wait for high profit.

Chapter 5. W-long 60
Statistics for ETFs
ETFs also experience a fast reversal after the W-long pattern, although the average rally is lower compared to stocks due to the nature of ETFs (the price of an ETF is formed as a weighted average of the underlying stocks' price). Statistical results for the 14 most liquid ETFs are shown below (Table 5.2). Statistics for the W-long pattern was calculated using a one-minute intraday price and volume data for the 2003-June 2009 period.
ETFRTH Retail HOLDRs 2.25%SPY SPDR S&P 500 2.18%IVV iShares S&P 500 Index 2.15%QQQQ PowerShares QQQ Trust, Series 1 2.13%XLF Financial Select Sector SPDR 2.12%XLE Energy Select Sector SPDR 2.11%EWY iShares MSCI South Korea Index 2.09%MDY MidCap SPDRs 1.97%DIA Diamonds Trust, Series 1 1.94%XLK Technology Select Sector SPDR 1.69%IWM iShares Russell 2000 Index 1.66%IWO iShares Russell 2000 Growth Index 1.55%OIH Oil Service HOLDRs 1.50%IWN iShares Russell 2000 Value Index 1.26%
Full name Average potential profitTABLE 5.2 ETFs list
To estimate the statistical quality of the W-long pattern for ETFs, four parameters were calculated: average price increase after signal (potential profit); probability of price increase greater than 0.5% and 0.8%; probability of reaching Fibonacci lines 23.6% and 38.2% from low after signal; probability of reaching 1% stop (Table 5.3). The rules for potential profit calculation for ETFs and stocks are the same (Fig. 5.2).

Fast reversal after two exponential waves down
61
Description ValueAverage potential profit 1.90%
Probability0.5% 0.840.8% 0.70
Fib 23.6% 0.76Fib 38.2% 0.47
Probability of reaching 1% stop 0.16
TABLE 5.3 Statistics of W-long pattern on ETFs
Probability of potential profit greater than
Probability of reaching Fibonacci lines from low after signal
Comments
The average price increase (potential profit) for ETFs after the W-long pattern is 1.9%, which is lower than the 4.49% average for stocks. But ETFs have their advantage: greater liquidity and a much lower risk of a big unexpected price move on rumors or news. Top performer: RTH with an average rally of 2.25% after an exponential drop on the second wave vs. 1.9% for the entire group (Table 5.2). Detailed statistics for each ETF can be found in the appendix (Table A.9). The recent introduction of leveraged ETFs leads to much higher average price increase; see statistics later in this chapter.
Pattern identification factors for ETFs
Similar to stocks, this pattern is a combination of two equal waves with a fast exponential decrease at the end of the second wave (Fig. 5.5). Four factors are most important: length of the two waves, price decline of the two equal waves, fast relative decline of price on the big bars during final phase (which should last at least 5 minutes) and time of day when pattern is formed. Exponential shape of second wave – visual or computerized identification.
Length of two waves: - minimal 40 minutes - maximal 270 minutes
Price decline of two equal waves: - average 4.5% - minimal 2.5%

Chapter 5. W-long 62
The price decline of the first and second wave should differ by no more than 10 percent. For signals in the last 1.5 hours before the close, there is not enough time for the ETF price to bounce with good profit.
Fig. 5.5 XLE: Energy Select Sector SPDR. After forming exponential pattern, XLE increased by 5.73%.
Statistics for leveraged ETFs
Leveraged ETFs provide 200% or 300% of an underlying index or sector's move intraday. A rapid increase in average volume shows that these instruments became very popular for intraday trading. For example, the average day volume of SKF - ProShares UltraShort Financials is 48 million, SSO - ProShares Ultra S&P 500 is 53 million, FAS - Direxion Daily Financial Bull 3X Shares is 48 million, as of June 1, 2009. Statistical results for the 23 most liquid 2x and 3x leveraged ETFs are shown below (Table 5.4). Statistics on leveraged ETFs for the W-long pattern was calculated using a one-minute intraday price and volume data from the moment of their introduction till June 2009. It is important to note that 2x leveraged ETFs were introduced in 2006-2007, while 3x leveraged ETFs were introduced only at the end of 2008.

Fast reversal after two exponential waves down
63
Table 5.4 includes the most liquid leveraged ETFs, long and short, which were used for the research.
2x ETFDDM ProShares Ultra Dow30 4.06%SRS ProShares UltraShort Real Estate 3.98%SKF ProShares UltraShort Financials 3.62%SSO ProShares Ultra S&P500 3.29%MVV Ultra MidCap400 ProShares 2.96%QLD ProShares Ultra QQQ 2.83%EEV UltraShort MSCI Emerging Markets ProShares 2.75%DUG ProShares UltraShort Oil & Gas 2.66%DXD ProShares UltraShort Dow30 2.52%SDS ProShares UltraShort S&P500 2.51%DIG ProShares Ultra Oil & Gas 2.51%QID ProShares UltraShort QQQ 2.45%UWM Ultra Russell2000 ProShares 2.40%TWM ProShares UltraShort Russell2000 2.20%MZZ UltraShort MidCap400 ProShares 2.17%3x ETFFAS Direxion Daily Financial Bull 3X Shares 3.52%FAZ Direxion Daily Financial Bear 3X Shares 3.52%ERX Direxion Daily Energy Bull 3X Shares 3.13%TNA Direxion Daily Small Cap Bull 3X Shares 2.83%ERY Direxion Daily Energy Bear 3X Shares 2.71%BGU Direxion Daily Large Cap Bull 3X Shares 2.69%BGZ Direxion Daily Large Cap Bear 3X Shares 2.59%TZA Direxion Daily Small Cap Bear 3X Shares 2.34%
Full name Average potential profit
Full name Average potential profit
TABLE 5.4 Leveraged ETFs list
To estimate the statistical quality of the W-long pattern for leveraged ETFs, four parameters were calculated: average price increase after signal (potential profit); probability of price increase greater than 1% and 1.5%; probability of reaching Fibonacci lines 23.6% and 38.2% from low after signal; probability of reaching 1.5% stop (Table 5.5). The rules for potential profit calculation for leveraged ETFs and stocks are the same (Fig. 5.2).
Chapter 5. W-long 64
Description ValueAverage potential profit 2.92%
Probability1.0% 0.731.5% 0.62
Fib 23.6% 0.73Fib 38.2% 0.51
Probability of reaching 1.5% stop 0.14
Probability of reaching Fibonacci lines from low after signal
TABLE 5.5 Statistics of W-long pattern on leveraged ETFs
Probability of potential profit greater than
Comments
The average potential profit for leveraged ETFs is 2.92%, which is much higher than the 1.9% average for the underlying ETFs.
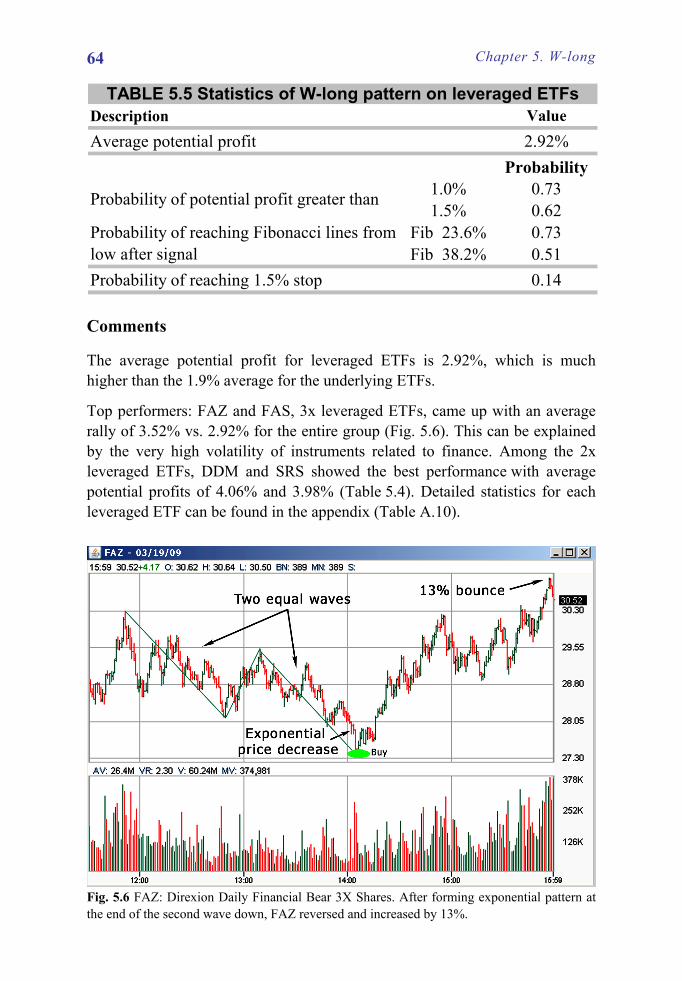
Top performers: FAZ and FAS, 3x leveraged ETFs, came up with an average rally of 3.52% vs. 2.92% for the entire group (Fig. 5.6). This can be explained by the very high volatility of instruments related to finance. Among the 2x leveraged ETFs, DDM and SRS showed the best performance with average potential profits of 4.06% and 3.98% (Table 5.4). Detailed statistics for each leveraged ETF can be found in the appendix (Table A.10).
Fig. 5.6 FAZ: Direxion Daily Financial Bear 3X Shares. After forming exponential pattern at the end of the second wave down, FAZ reversed and increased by 13%.
Fast reversal after two exponential waves down
65
Pattern identification factors for leveraged ETFs
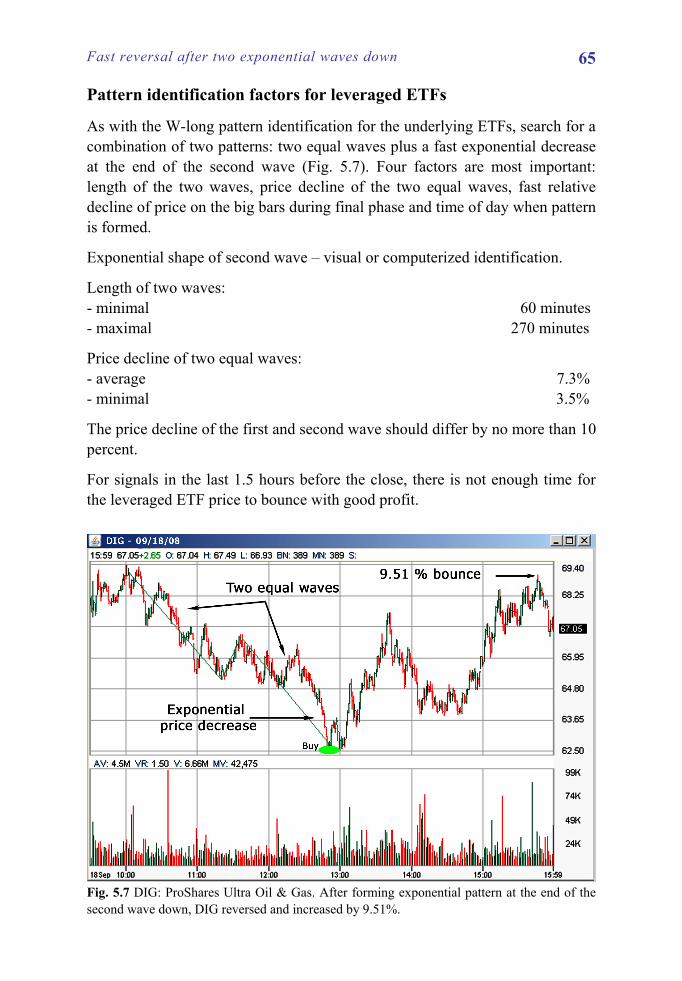
As with the W-long pattern identification for the underlying ETFs, search for a combination of two patterns: two equal waves plus a fast exponential decrease at the end of the second wave (Fig. 5.7). Four factors are most important: length of the two waves, price decline of the two equal waves, fast relative decline of price on the big bars during final phase and time of day when pattern is formed.
Exponential shape of second wave – visual or computerized identification.
Length of two waves: - minimal 60 minutes - maximal 270 minutes
Price decline of two equal waves: - average 7.3% - minimal 3.5%
The price decline of the first and second wave should differ by no more than 10 percent.
For signals in the last 1.5 hours before the close, there is not enough time for the leveraged ETF price to bounce with good profit.
Fig. 5.7 DIG: ProShares Ultra Oil & Gas. After forming exponential pattern at the end of the second wave down, DIG reversed and increased by 9.51%.
Chapter 5. W-long 66
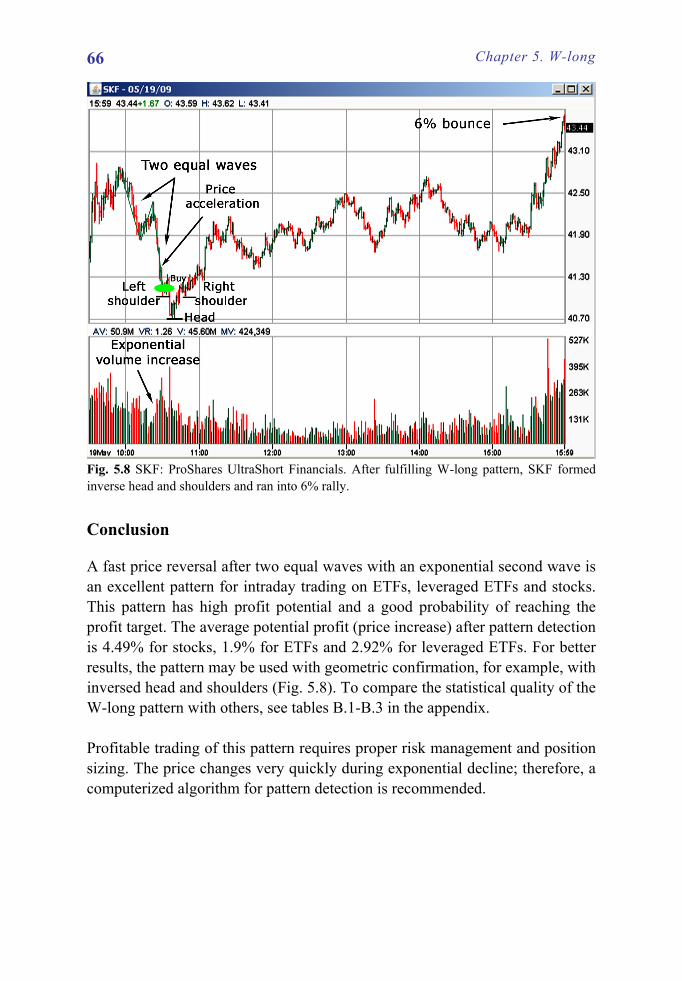
Fig. 5.8 SKF: ProShares UltraShort Financials. After fulfilling W-long pattern, SKF formed inverse head and shoulders and ran into 6% rally.
Conclusion
A fast price reversal after two equal waves with an exponential second wave is an excellent pattern for intraday trading on ETFs, leveraged ETFs and stocks. This pattern has high profit potential and a good probability of reaching the profit target. The average potential profit (price increase) after pattern detection is 4.49% for stocks, 1.9% for ETFs and 2.92% for leveraged ETFs. For better results, the pattern may be used with geometric confirmation, for example, with inversed head and shoulders (Fig. 5.8). To compare the statistical quality of the W-long pattern with others, see tables B.1-B.3 in the appendix. Profitable trading of this pattern requires proper risk management and position sizing. The price changes very quickly during exponential decline; therefore, a computerized algorithm for pattern detection is recommended.

To learn all Elite Patterns please order full version of DISFA Coach software.