Elevated Careers Demo - Recruiting Technology
32
RECRUITING WEBINARS DEMO Match for Cultural Fit & Elevate Your Workplace Elevated Careers by eHarmony Advisors | [email protected] | [email protected] www.elevatedcareers.com
-
Upload
recruitingdailycom-llc -
Category
Recruiting & HR
-
view
134 -
download
0
Transcript of Elevated Careers Demo - Recruiting Technology
RECRUITING WEBINARS
DEMO
Match for Cultural Fit & Elevate Your Workplace
Elevated Careers by eHarmony Advisors | [email protected] | [email protected] www.elevatedcareers.com
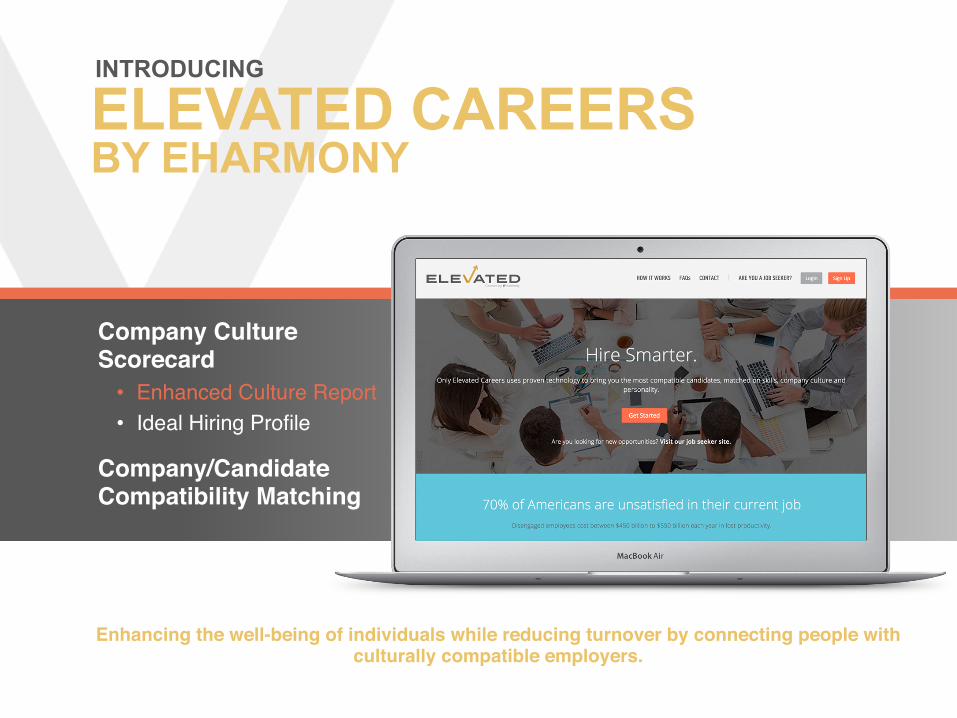
ELEVATED CAREERS BY EHARMONY
Company Culture Scorecard• Enhanced Culture Report• Ideal Hiring Profile
Company/Candidate Compatibility Matching
INTRODUCING
Enhancing the well-being of individuals while reducing turnover by connecting people with culturally compatible employers.
CONFIDENTIAL
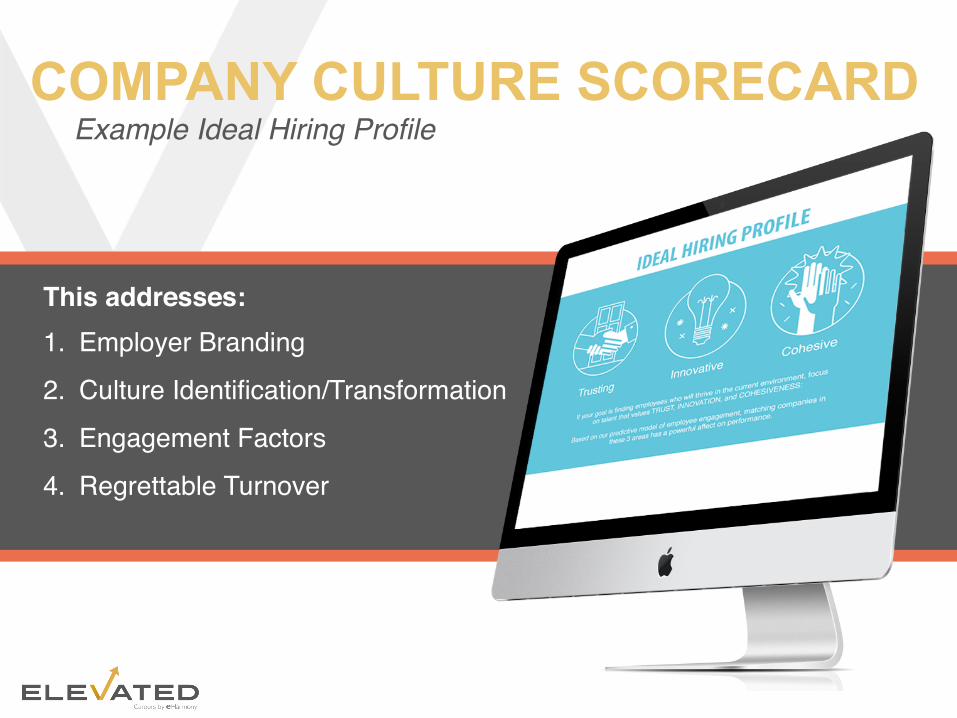
COMPANY CULTURE SCORECARD Example Ideal Hiring Profile
This addresses: 1. Employer Branding
2. Culture Identification/Transformation
3. Engagement Factors
4. Regrettable Turnover
ELEVATED ENGAGEMENT for YOUR COMPANY May 20, 2016
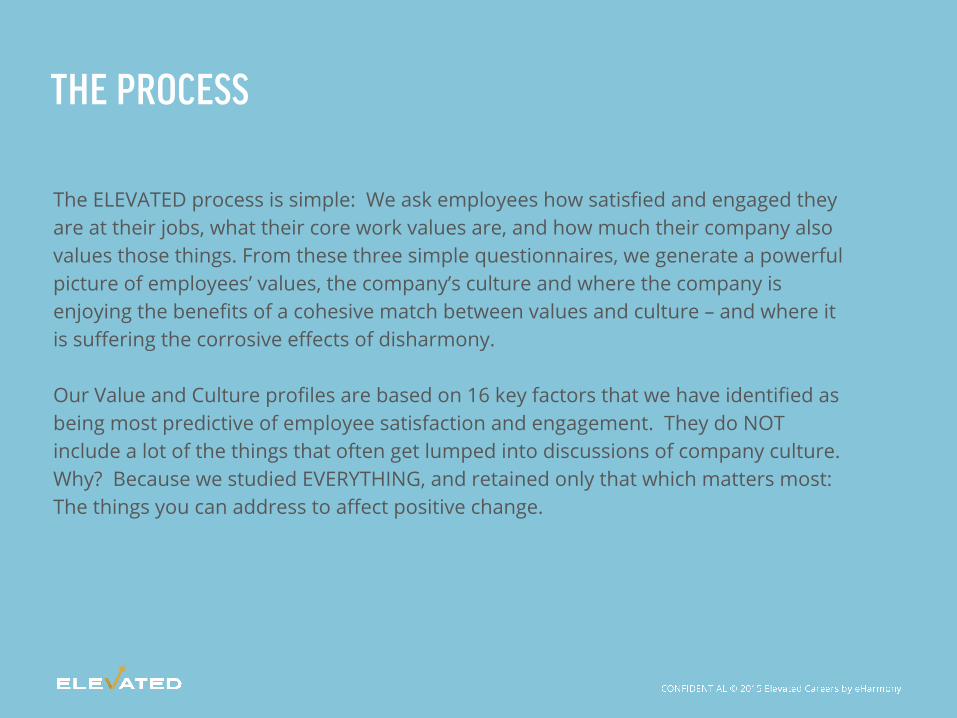
THE PROCESS
The ELEVATED process is simple: We ask employees how satisfied and engaged they are at their jobs, what their core work values are, and how much their company also values those things. From these three simple questionnaires, we generate a powerful picture of employees’ values, the company’s culture and where the company is enjoying the benefits of a cohesive match between values and culture – and where it is suffering the corrosive effects of disharmony. Our Value and Culture profiles are based on 16 key factors that we have identified as being most predictive of employee satisfaction and engagement. They do NOT include a lot of the things that often get lumped into discussions of company culture. Why? Because we studied EVERYTHING, and retained only that which matters most: The things you can address to affect positive change.
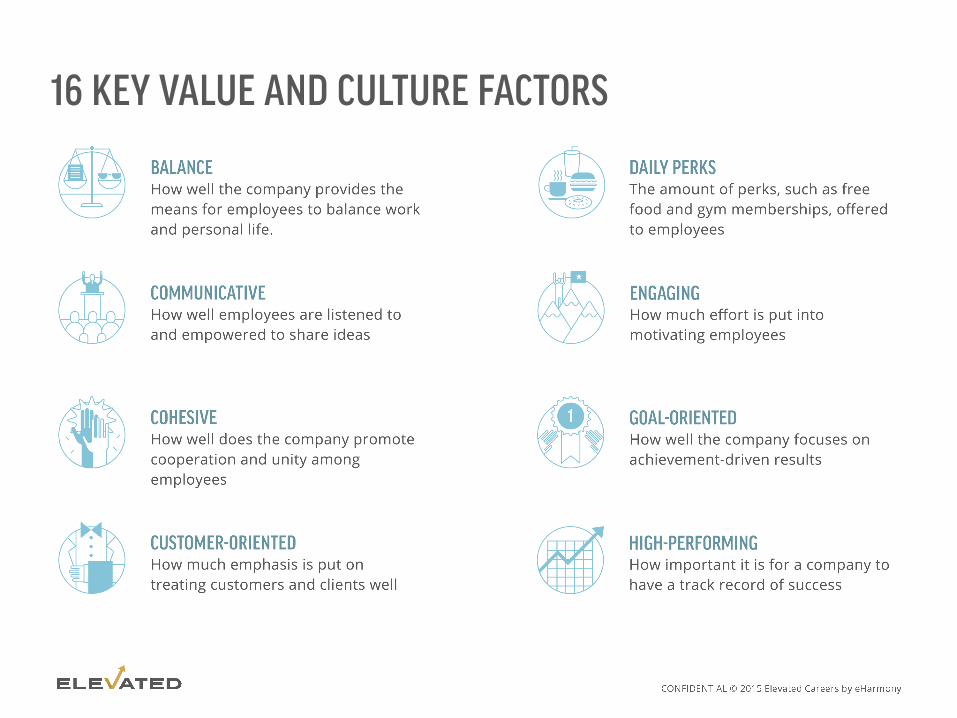
16 KEY VALUE AND CULTURE FACTORS
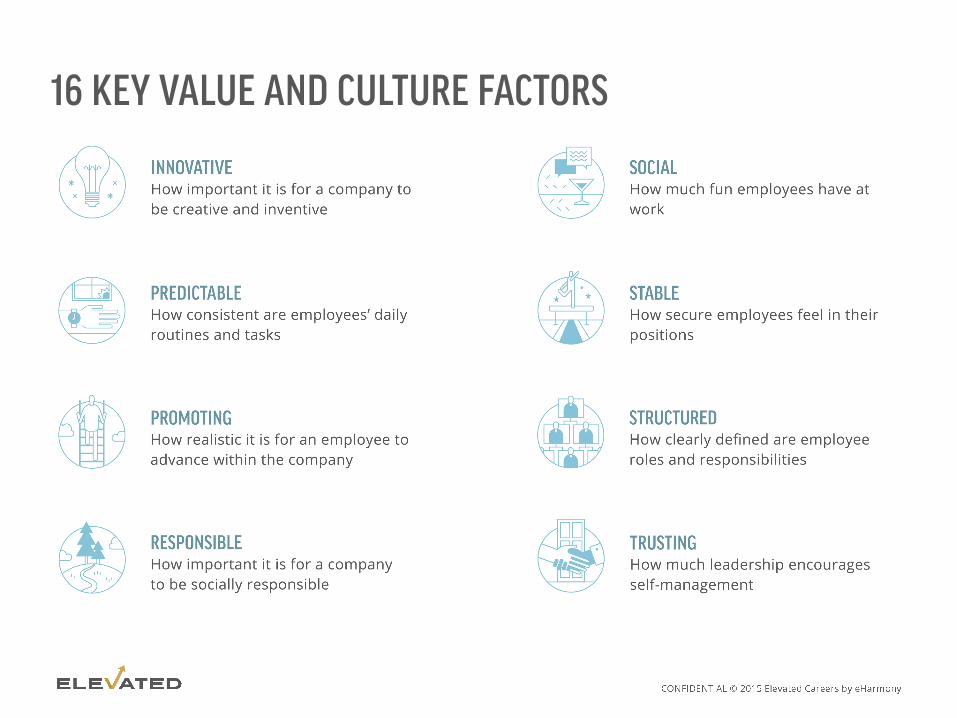
16 KEY VALUE AND CULTURE FACTORS
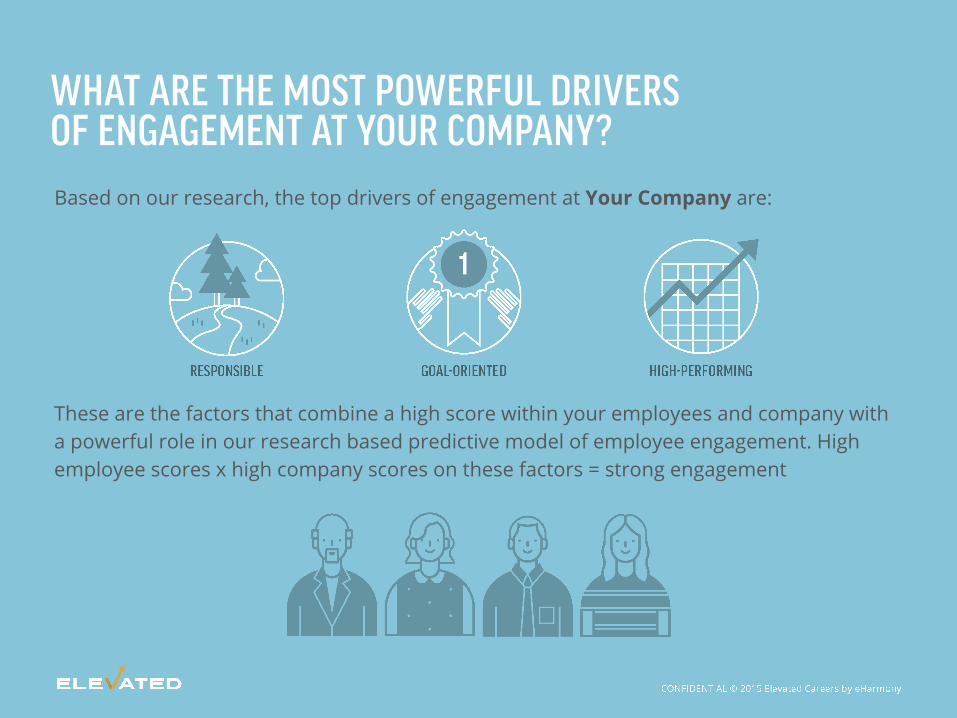
WHAT ARE THE MOST POWERFUL DRIVERS OF ENGAGEMENT AT YOUR COMPANY?
These are the factors that combine a high score within your employees and company with a powerful role in our research based predictive model of employee engagement. High employee scores x high company scores on these factors = strong engagement
Based on our research, the top drivers of engagement at Your Company are:
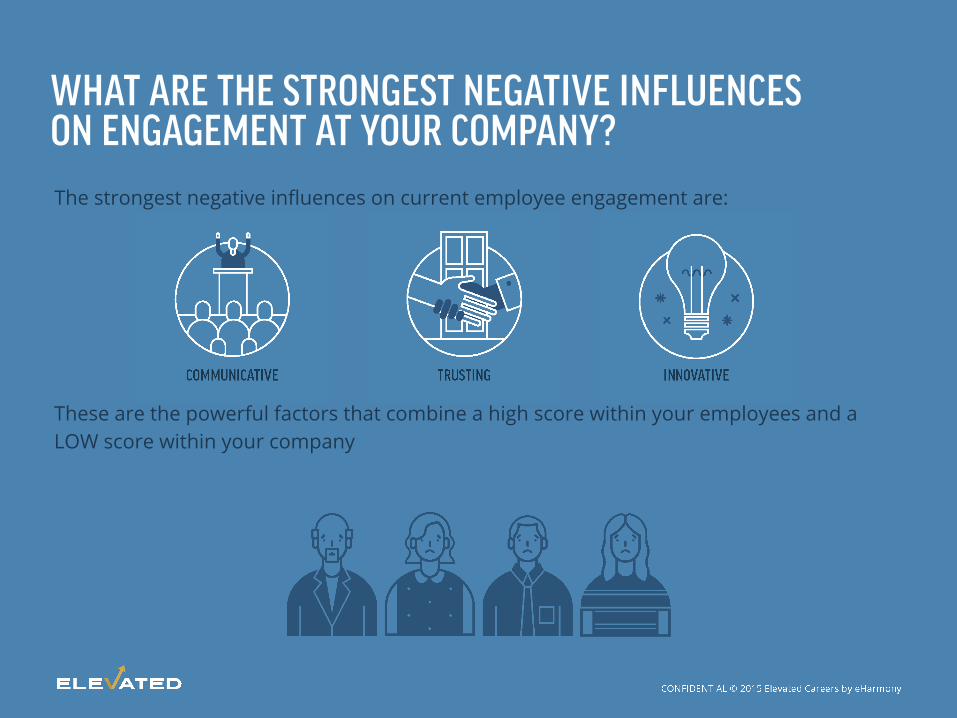
WHAT ARE THE STRONGEST NEGATIVE INFLUENCES ON ENGAGEMENT AT YOUR COMPANY? The strongest negative influences on current employee engagement are:
These are the powerful factors that combine a high score within your employees and a LOW score within your company
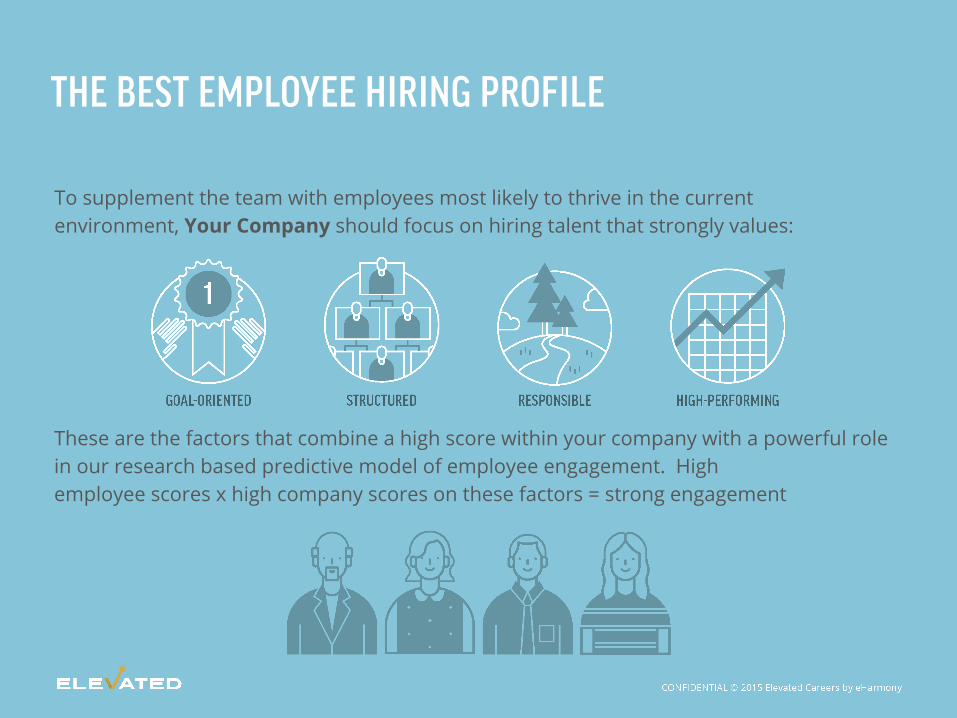
To supplement the team with employees most likely to thrive in the current environment, Your Company should focus on hiring talent that strongly values:
These are the factors that combine a high score within your company with a powerful role in our research based predictive model of employee engagement. High employee scores x high company scores on these factors = strong engagement
THE BEST EMPLOYEE HIRING PROFILE
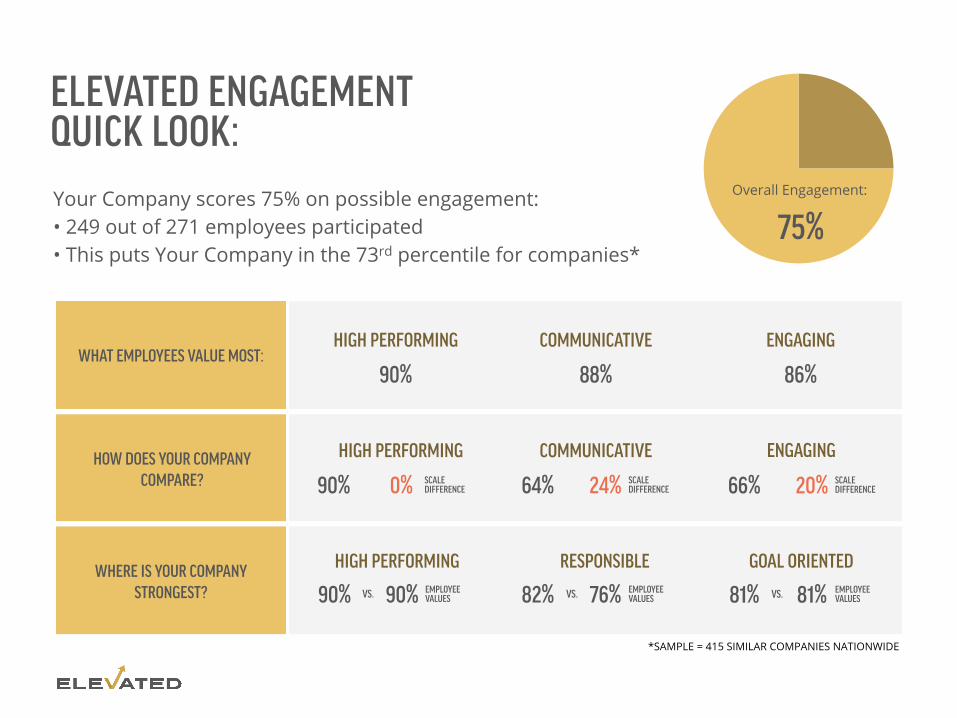
ELEVATED ENGAGEMENT QUICK LOOK:
Overall Engagement:
75%
WHAT EMPLOYEES VALUE MOST:
HOW DOES YOUR COMPANY COMPARE?
WHERE IS YOUR COMPANY STRONGEST?
HIGH PERFORMING
90%
COMMUNICATIVE
88%
ENGAGING
86%
HIGH PERFORMING COMMUNICATIVE ENGAGING
90% 0% SCALE DIFFERENCE 64% 24% SCALE
DIFFERENCE 66% 20% SCALE DIFFERENCE
HIGH PERFORMING RESPONSIBLE GOAL ORIENTED
90% 90% EMPLOYEE VALUES 82% 76% EMPLOYEE
VALUES 81% 81% EMPLOYEE VALUES VS. VS. VS.
*SAMPLE = 415 SIMILAR COMPANIES NATIONWIDE
Your Company scores 75% on possible engagement: • 249 out of 271 employees participated • This puts Your Company in the 73rd percentile for companies*
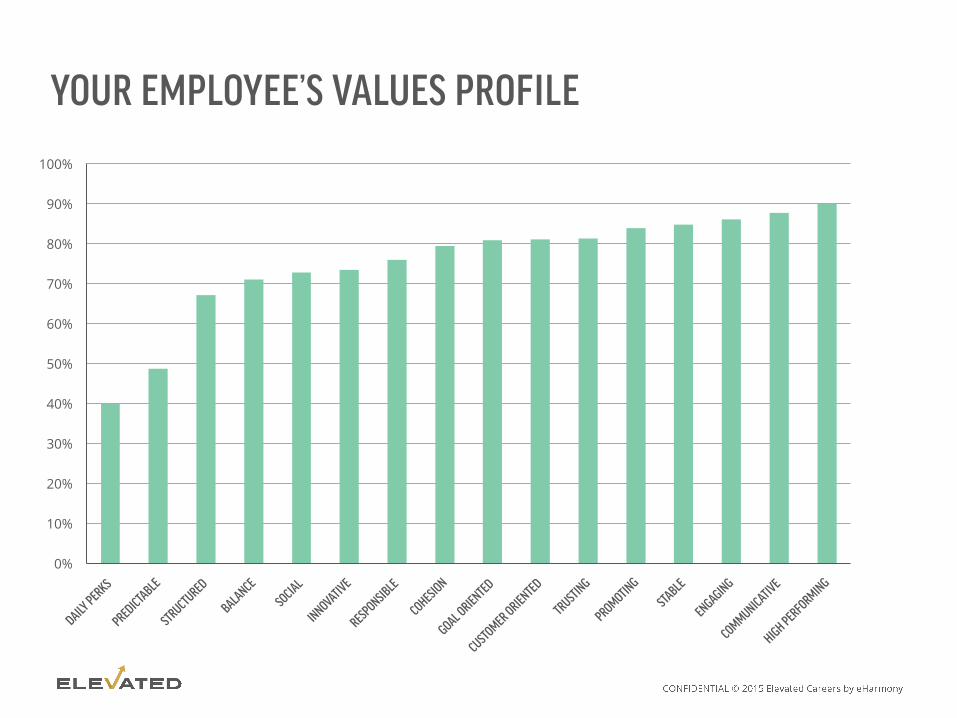
YOUR EMPLOYEE’S VALUES PROFILE
0%
10%
20%
30%
40%
50%
60%
70%
80%
90%
100%
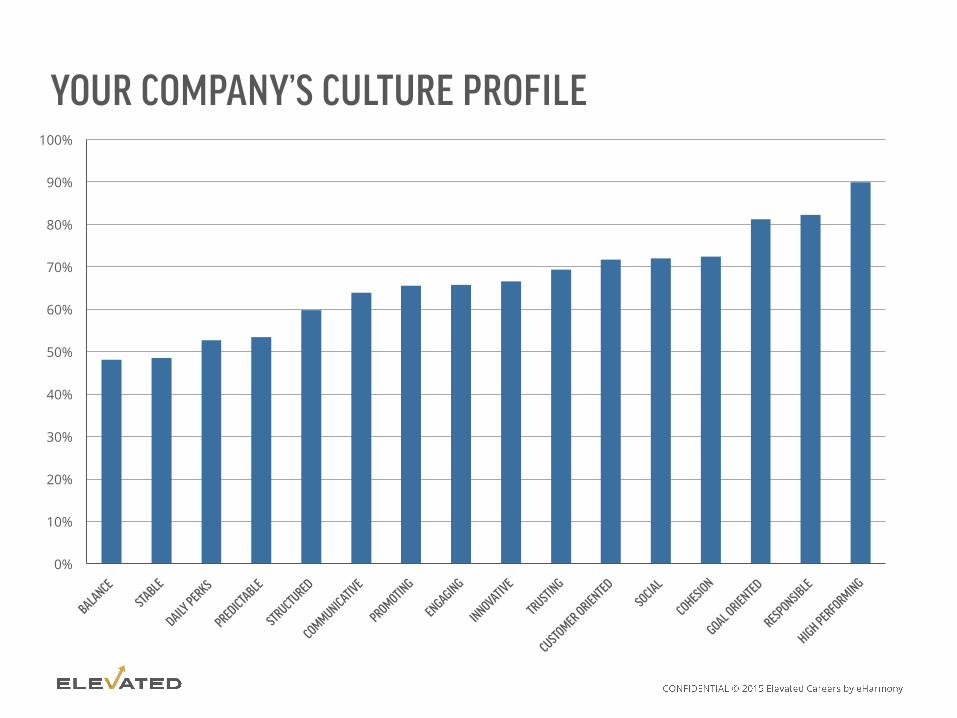
YOUR COMPANY’S CULTURE PROFILE
0%
10%
20%
30%
40%
50%
60%
70%
80%
90%
100%
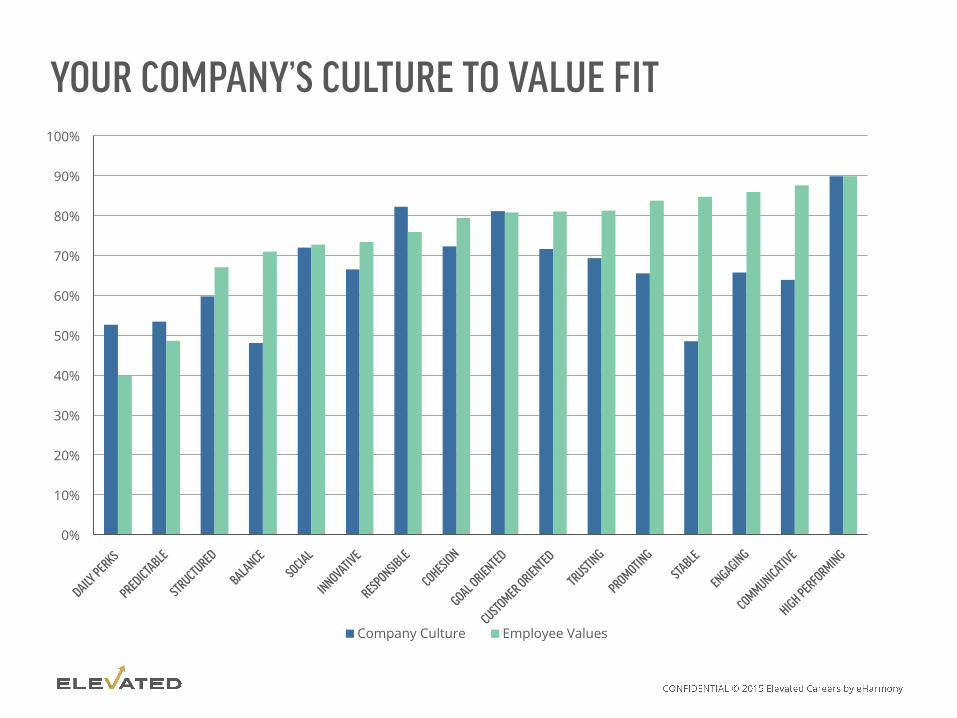
YOUR COMPANY’S CULTURE TO VALUE FIT
0%
10%
20%
30%
40%
50%
60%
70%
80%
90%
100%
Company Culture Employee Values
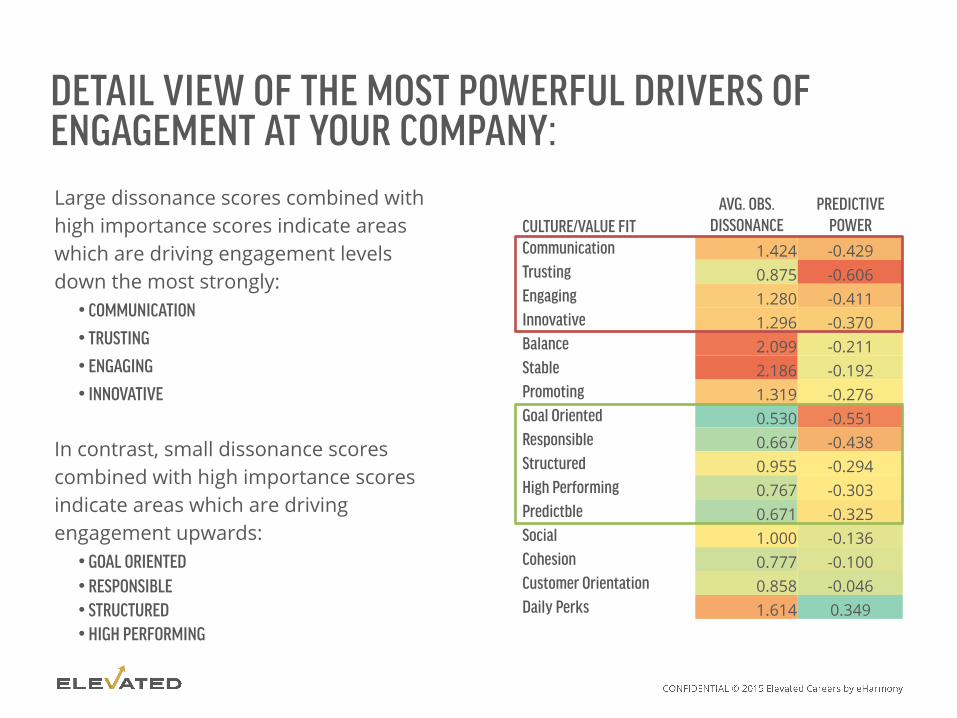
DETAIL VIEW OF THE MOST POWERFUL DRIVERS OF ENGAGEMENT AT YOUR COMPANY: Large dissonance scores combined with high importance scores indicate areas which are driving engagement levels down the most strongly: • COMMUNICATION
• TRUSTING
• ENGAGING
• INNOVATIVE
In contrast, small dissonance scores combined with high importance scores indicate areas which are driving engagement upwards: • GOAL ORIENTED • RESPONSIBLE • STRUCTURED • HIGH PERFORMING
CULTURE/VALUE FIT AVG. OBS.
DISSONANCE PREDICTIVE
POWER Communication 1.424 -0.429 Trusting 0.875 -0.606 Engaging 1.280 -0.411 Innovative 1.296 -0.370 Balance 2.099 -0.211 Stable 2.186 -0.192 Promoting 1.319 -0.276 Goal Oriented 0.530 -0.551 Responsible 0.667 -0.438 Structured 0.955 -0.294 High Performing 0.767 -0.303 Predictble 0.671 -0.325 Social 1.000 -0.136 Cohesion 0.777 -0.100 Customer Orientation 0.858 -0.046 Daily Perks 1.614 0.349

OVERALL PREDICTED BENEFITS: 25% REDUCTIONS* IN DISSONANCE
*Assuming independence. See notes for correlations between factors
CULTURE/VALUE FIT AVG. OBS.
DISSONANCE Weight CALIBRATION PREDICTIVE
POWER CURRENT PRED VAL 25% IMP CUR PRED % 25% IMP % DELTA %
Trusting 0.875 -7.658 57.52 -0.606 50.82 54.17 74.7% 80.7% 6.0% Communication 1.424 -4.472 57.19 -0.429 50.82 54.00 74.7% 80.4% 5.7% Engaging 1.280 -4.870 57.05 -0.411 50.82 53.94 74.7% 80.2% 5.6% Innovative 1.296 -4.787 57.02 -0.370 50.82 53.92 74.7% 80.2% 5.5% Goal Oriented 0.530 -11.324 56.82 -0.551 50.82 53.82 74.7% 80.0% 5.4% Responsible 0.667 -7.597 55.88 -0.438 50.82 53.35 74.7% 79.2% 4.5% Predictble 0.671 -5.622 54.59 -0.325 50.82 52.70 74.7% 78.0% 3.4% Structured 0.955 -3.839 54.48 -0.294 50.82 52.65 74.7% 77.9% 3.3% Stable 2.186 -1.607 54.33 -0.192 50.82 52.57 74.7% 77.8% 3.1% High Performing 0.767 -4.416 54.21 -0.303 50.82 52.51 74.7% 77.7% 3.0% Promoting 1.319 -2.533 54.16 -0.276 50.82 52.49 74.7% 77.7% 3.0% Balance 2.099 -1.574 54.12 -0.211 50.82 52.47 74.7% 77.6% 2.9% Social 1.000 -2.152 52.97 -0.136 50.82 51.89 74.7% 76.6% 1.9% Cohesion 0.777 -1.792 52.21 -0.100 50.82 51.51 74.7% 75.9% 1.2% Customer Orientation 0.858 -0.841 51.54 -0.046 50.82 51.18 74.7% 75.3% 0.6% Daily Perks 1.614 3.545 45.10 0.349 50.82 47.96 74.7% 69.6% -5.1%
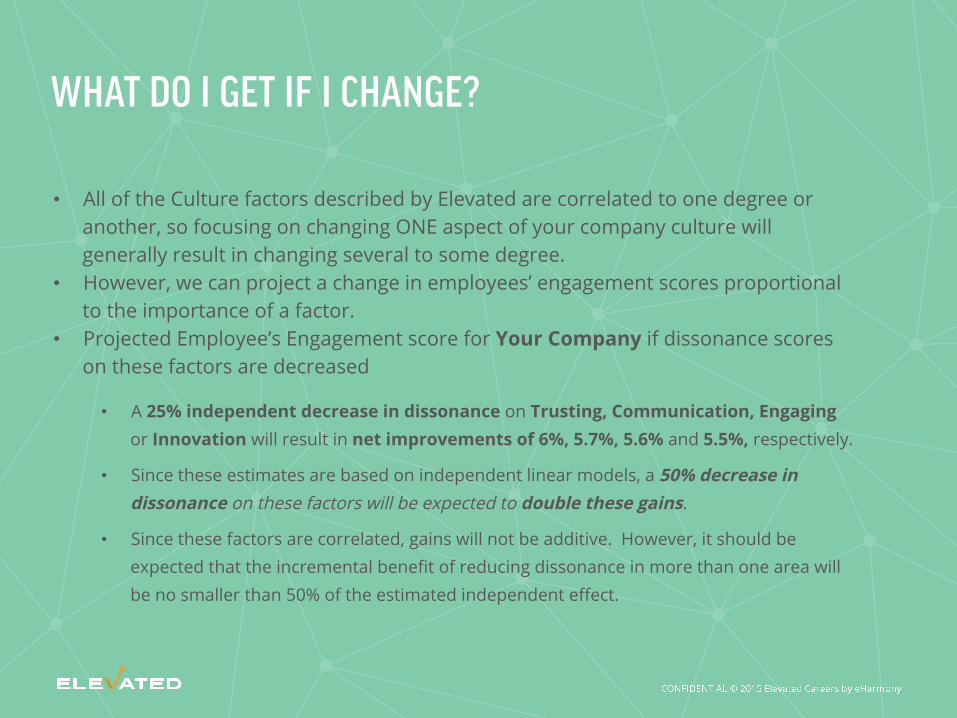
WHAT DO I GET IF I CHANGE?
• All of the Culture factors described by Elevated are correlated to one degree or another, so focusing on changing ONE aspect of your company culture will generally result in changing several to some degree.
• However, we can project a change in employees’ engagement scores proportional to the importance of a factor.
• Projected Employee’s Engagement score for Your Company if dissonance scores on these factors are decreased
• A 25% independent decrease in dissonance on Trusting, Communication, Engaging or Innovation will result in net improvements of 6%, 5.7%, 5.6% and 5.5%, respectively.
• Since these estimates are based on independent linear models, a 50% decrease in dissonance on these factors will be expected to double these gains.
• Since these factors are correlated, gains will not be additive. However, it should be expected that the incremental benefit of reducing dissonance in more than one area will be no smaller than 50% of the estimated independent effect.
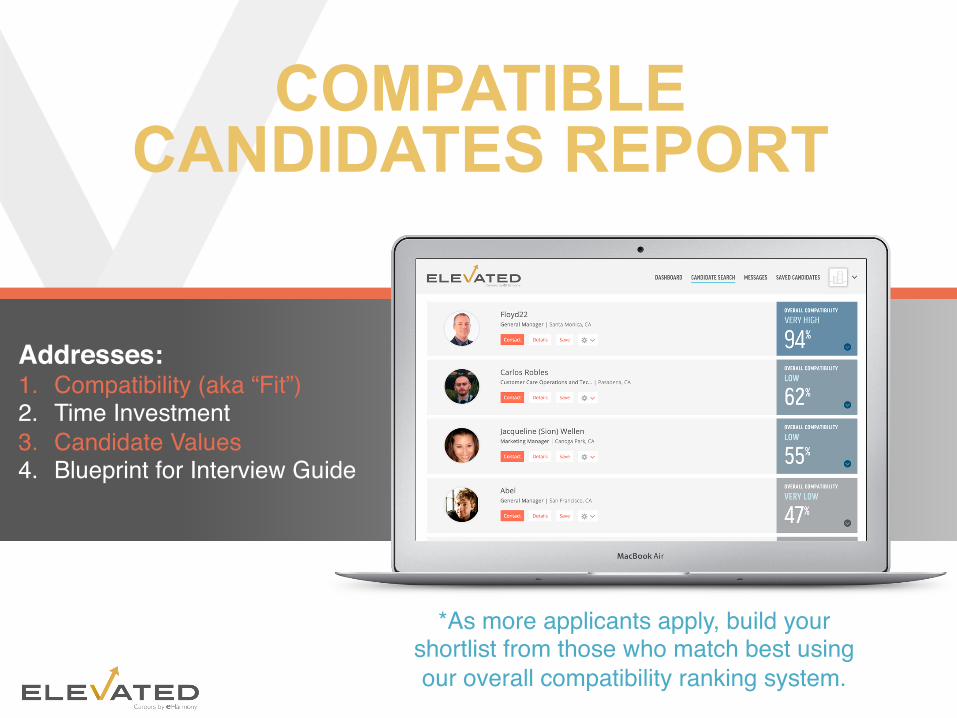
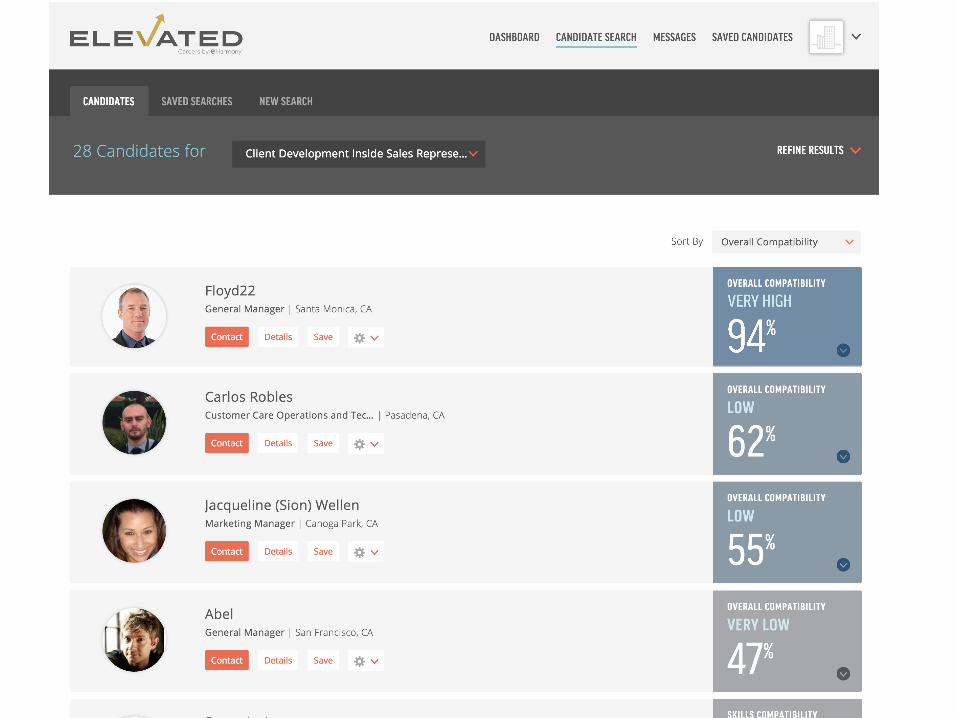
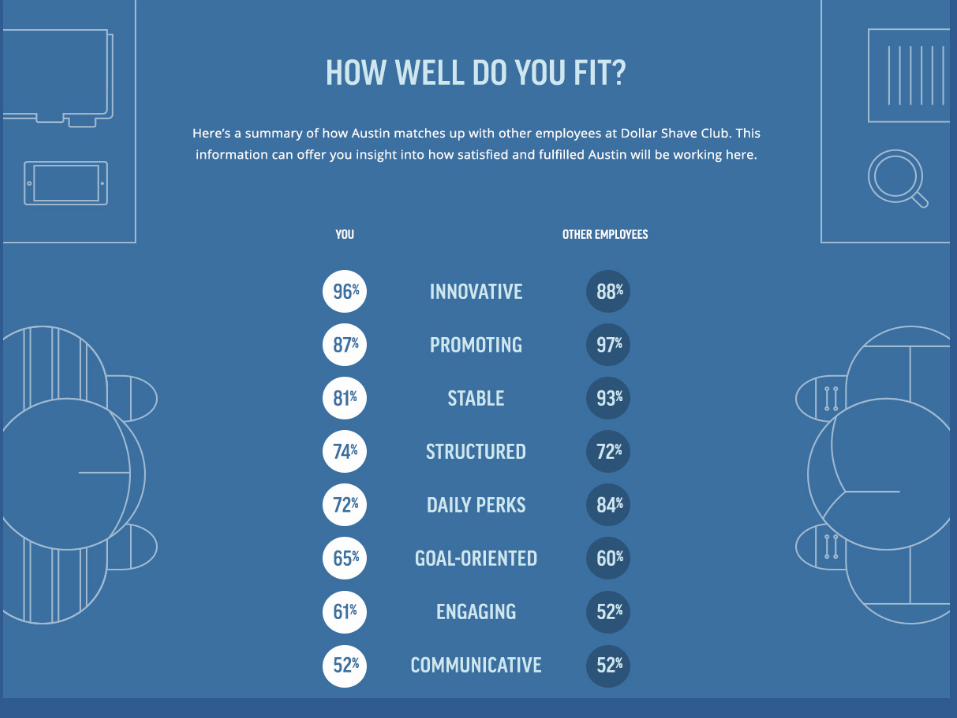
COMPATIBLE CANDIDATES REPORT
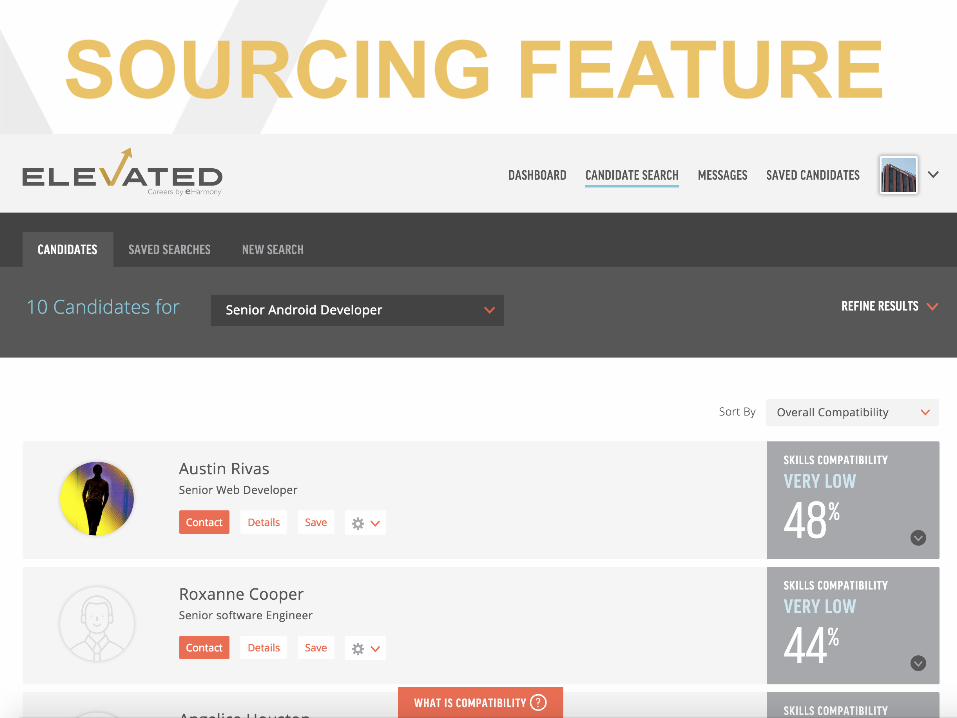
*As more applicants apply, build your shortlist from those who match best using our overall compatibility ranking system.
Addresses: 1. Compatibility (aka “Fit”)2. Time Investment3. Candidate Values4. Blueprint for Interview Guide
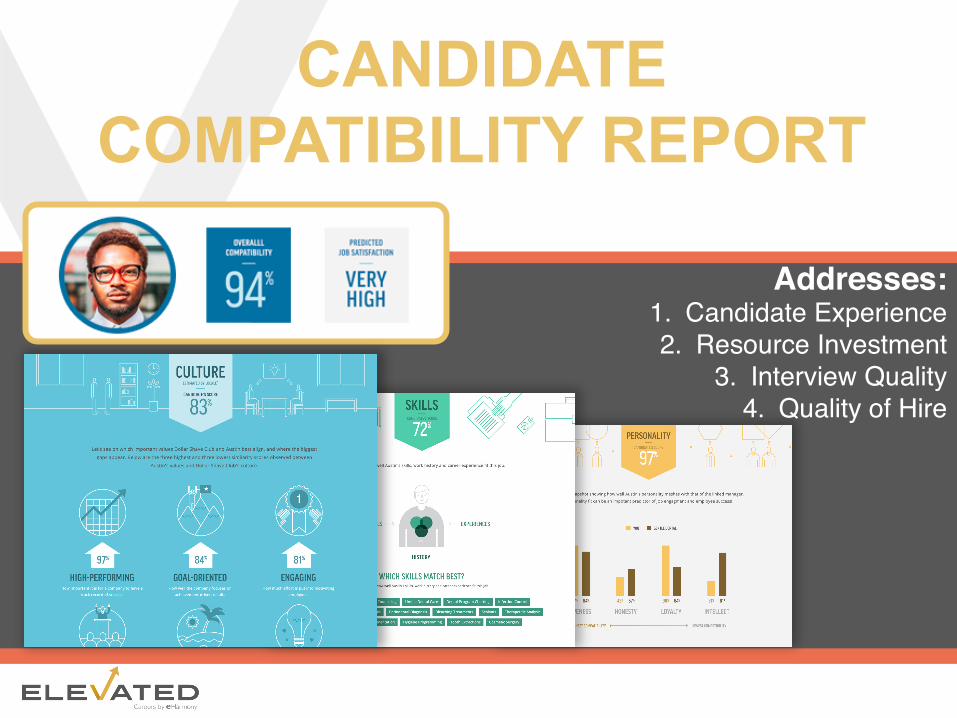
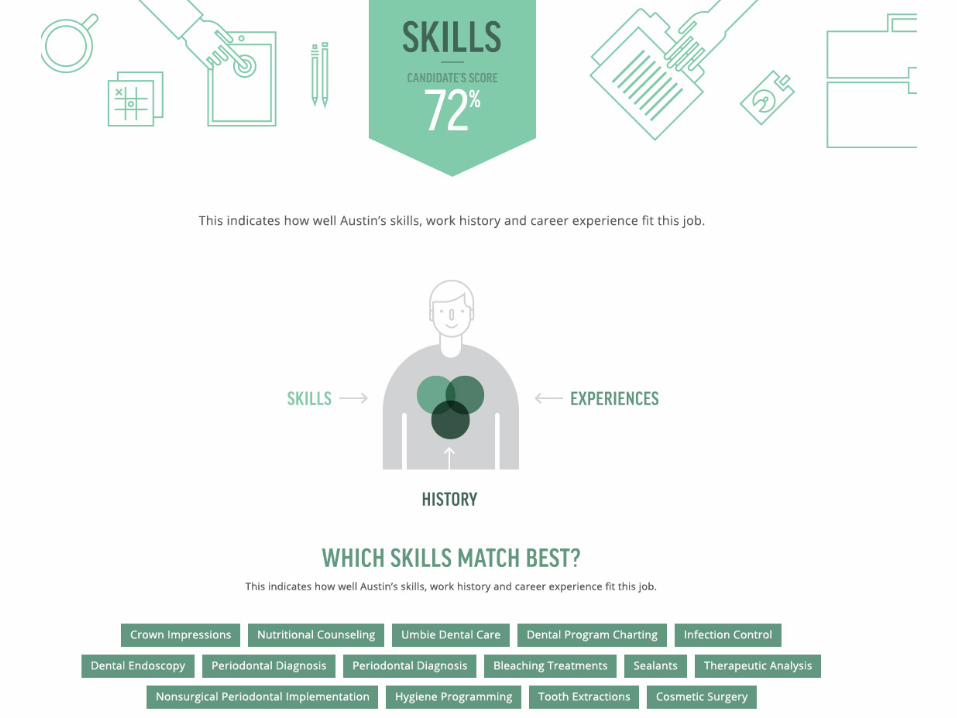
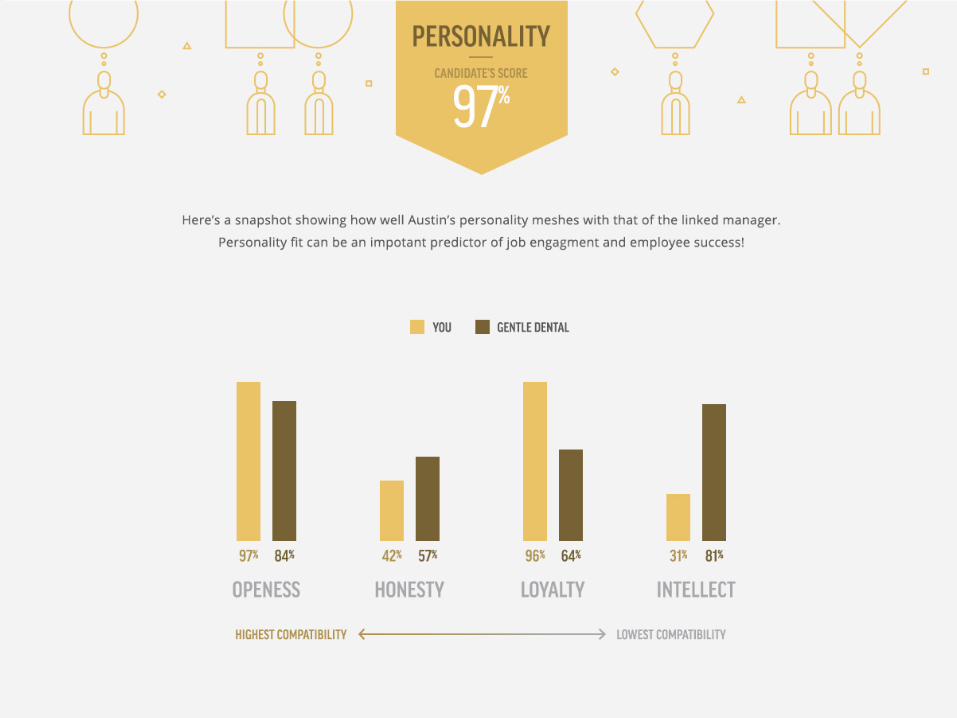
CANDIDATE COMPATIBILITY REPORT
Addresses: 1. Candidate Experience2. Resource Investment
3. Interview Quality4. Quality of Hire
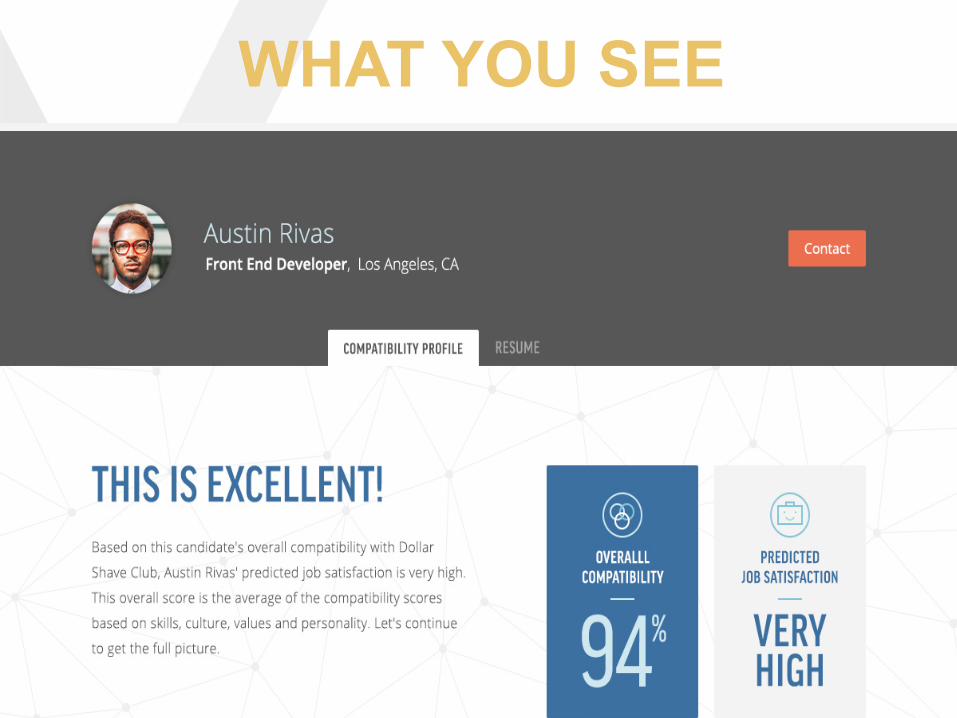
WHAT YOU SEE
CONFIDENTIAL
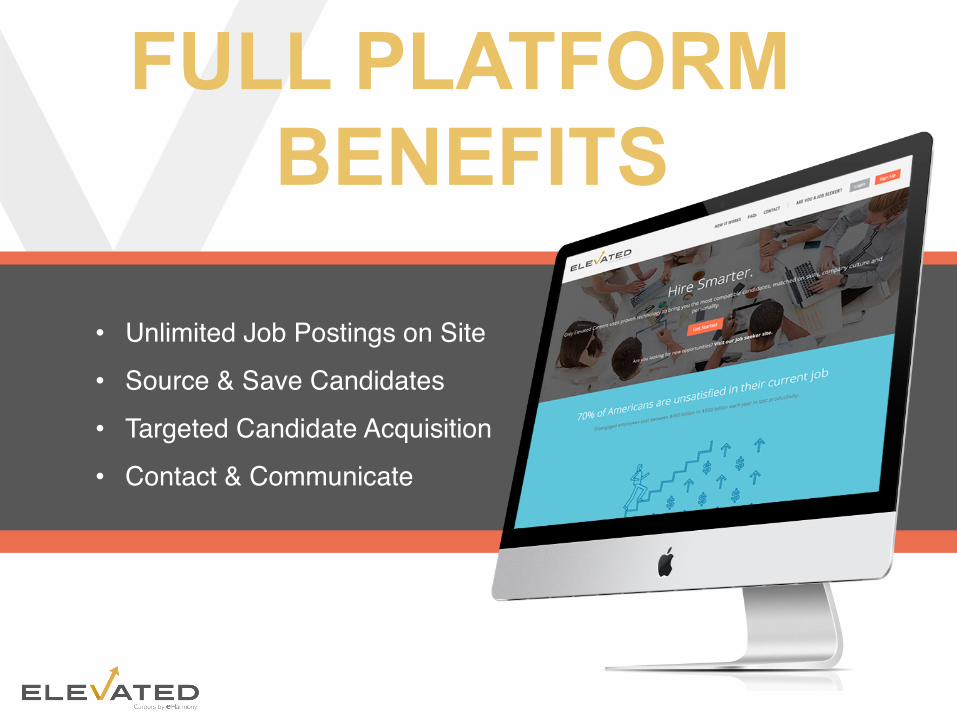
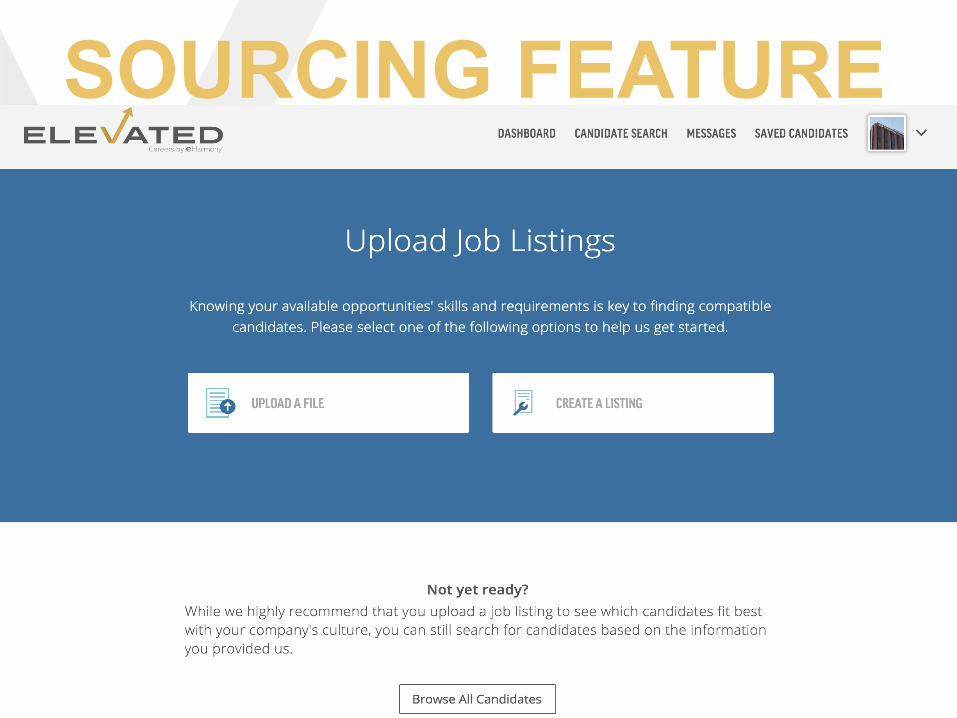
FULL PLATFORM BENEFITS
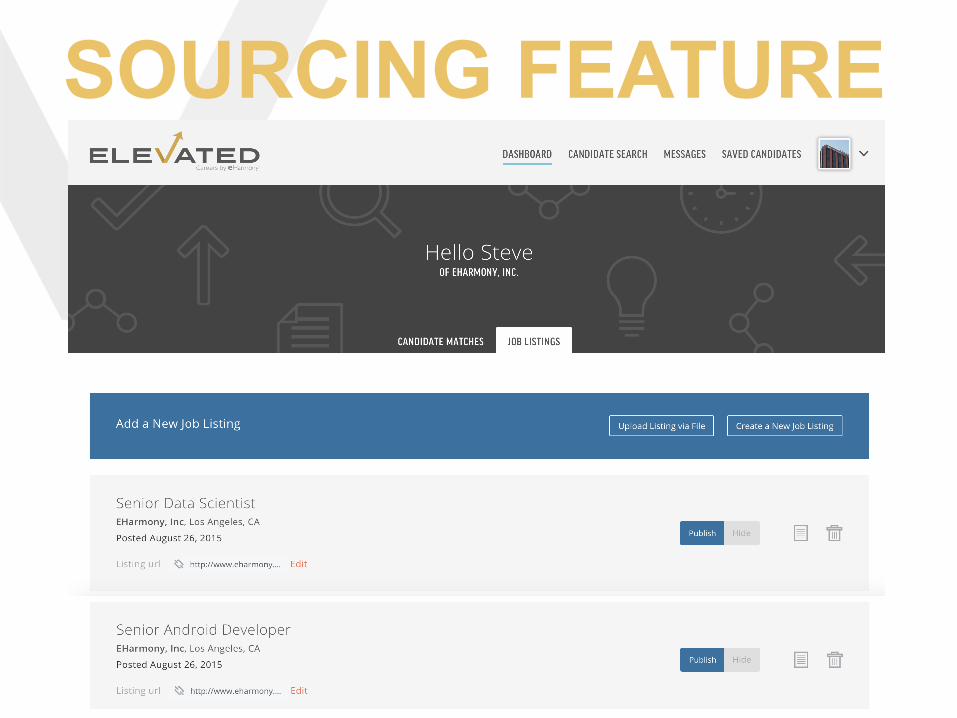
• Unlimited Job Postings on Site
• Source & Save Candidates
• Targeted Candidate Acquisition
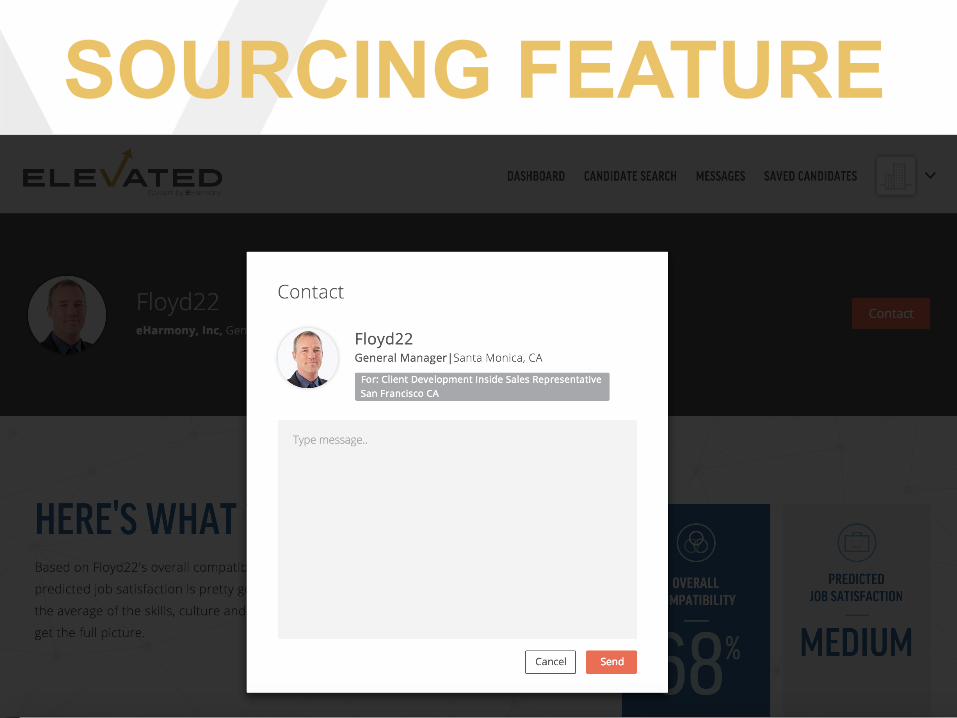
• Contact & Communicate
CONFIDENTIAL
SOURCING FEATURE
CONFIDENTIAL
SOURCING FEATURE
CONFIDENTIAL
SOURCING FEATURE
CONFIDENTIAL
SOURCING FEATURE
CONFIDENTIAL
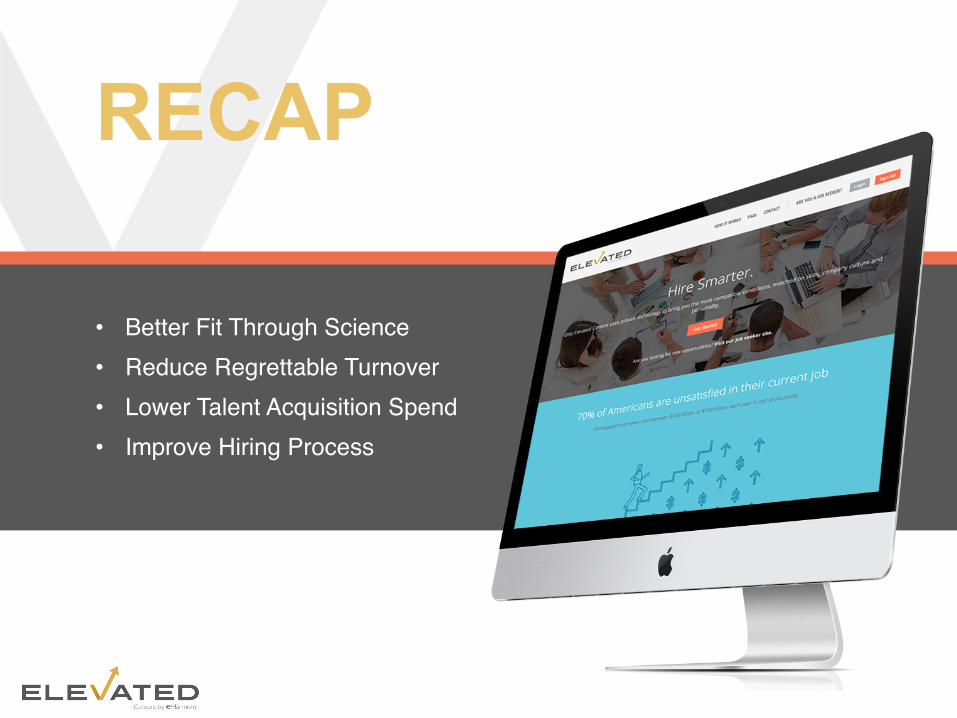
RECAP
• Better Fit Through Science• Reduce Regrettable Turnover• Lower Talent Acquisition Spend• Improve Hiring Process