Elena Safirova, Kenneth Gillingham, Winston … HOT Lanes a Hot Deal? The Potential Consequences of...
16
Are HOT Lanes a Hot Deal? The Potential Consequences of Converting HOV to HOT Lanes in Northern Virginia Elena Safirova, Kenneth Gillingham, Winston Harrington, and Peter Nelson May 2003 • Urban Complexities Issue Brief 03-03 Resources for the Future 1616 P Street, NW Washington, D.C. 20036 Telephone: 202–328–5000 Fax: 202–939–3460 Internet: http://www.rff.org © 2003 Resources for the Future. All rights reserved. No portion of this paper may be reproduced without permission of the authors. Issue Briefs are short reports designed to provide topical, timely information and analysis to a broad nontechnical audience.
Transcript of Elena Safirova, Kenneth Gillingham, Winston … HOT Lanes a Hot Deal? The Potential Consequences of...

Are HOT Lanes a Hot Deal? The Potential Consequences of Converting HOV to HOT Lanes in Northern Virginia
Elena Safirova, Kenneth Gillingham, Winston Harrington, and Peter Nelson
May 2003 • Urban Complexities Issue Brief 03-03
Resources for the Future 1616 P Street, NW Washington, D.C. 20036 Telephone: 202–328–5000 Fax: 202–939–3460 Internet: http://www.rff.org
© 2003 Resources for the Future. All rights reserved. No portion of this paper may be reproduced without permission of the authors.
Issue Briefs are short reports designed to provide topical, timely information and analysis to a broad nontechnical audience.

1
Are HOT Lanes a Hot Deal? The Potential Consequences of Converting HOV to HOT Lanes in Northern Virginia
Elena Safirova, Kenneth Gillingham, Winston Harrington, Peter Nelson∗
Introduction
The Washington, D.C., metro area has seen a rapid increase in traffic congestion in the past two decades. According to the Texas Transportation Institute, the average annual delay per road traveler during peak commuting time in the area has increased from 24 hours to 84 hours between 1982 and 2000.1 Given projections that the population of the Washington metro area will grow by 32.4% between 2000 and 2025,2 the situation is not likely to improve.
Unlike many other metro areas, the D.C. region has been reluctant to solve its congestion problems by adding new roads. Now the transportation system faces new budget crunches and needs additional funding just to maintain the existing roads.3
Given the current fiscal situation, many perceive that the revenue-raising potential of any transportation policy should be a primary criterion of its viability. Additionally, policies that promise to increase the efficiency of the existing transportation network have become more attractive, even if they have only modest revenue-raising potential. This issue brief analyzes the effects of converting several of the area’s high-occupancy vehicle (HOV) lanes to high-occupancy/toll (HOT) lanes. HOT lanes are HOV lanes that can be used by single drivers, provided they pay a fee. The state of Virginia is seeking $1 million in federal funds to study the viability of converting HOV lanes in northern Virginia to HOT lanes.4 The region’s Transportation Planning Board has endorsed Virginia’s application, indicating that public opposition to HOT lanes in the region could be waning. Also, HOT networks were recently
∗Safirova is a fellow, Gillingham is a research assistant, Harrington is a senior fellow, and Nelson is a research associate at Resources for the Future. 1 TTI Urban Mobility Report 2002. 2 National Capital Region Transportation Planning Board. 3 Recently the Transportation Planning Board estimated that it needs an additional $1.74 billion a year to meet expansion and rehabilitation needs. 4 Shaver 2003.

Resources for the Future Safirova, Gillingham, Harrington, Nelson
2
proposed as a policy solution on a national level.5 In our policy simulation, we closely follow the policy scenario proposed for the Virginia study.
The rise of HOV lanes
The high-occupancy vehicle lane concept originated in 1963 as a rapid transit busway—a dedicated bus lane—rather than as a lane for passenger cars. The initial goal was to combine the flexibility of a low-cost bus system with the advantages of a high-speed rail transit service. Buses would operate on exclusive rights-of-way on the trunk-line portion of the route and distribute passengers along arterials to businesses and residential areas.6 Opened in September 1969, the reversible two-lane busway in the median of the Shirley Highway (I-95 in Northern Virginia) became the first facility in the interstate highway system to be reserved for buses.7 Although ridership increased steadily in the following years, the bus lane’s capacity was still underutilized. Consequently, planners decided in 1981 to open the lanes to vanpools and carpools carrying more than four people. Since that time, more than 2,000 HOV lane-miles have been constructed nationally, and about the same amount is currently under construction.
Over the years, HOV lanes have acquired avid supporters, and a whole new literature has emerged to analyze their effects. In the HOV literature, the primary objectives of HOV priority lanes are threefold: 1) to provide a cost-effective means of moving greater volumes of persons at higher levels of service than conventional highways by reserving lanes for multi-person vehicles—buses, vanpools, and carpools; 2) to promote ride sharing by setting aside HOV lanes; and 3) to reduce trip times for HOVs during rush hour.
The theory underlying HOV priority treatment is that the potential time savings gained by bypassing congested general-purpose lanes can promote ride sharing and use of public transit, indirectly relieving traffic density on adjacent general-purpose lanes. When HOV lanes function
5 In a recent report by the Reason Foundation, R. Poole and C.K. Orski have introduced a “HOT network” idea. Existing and planned HOV lanes would be converted into an interconnected network of priced express lanes. A part of the proposal is to also use the HOT lanes for bus rapid transit. Poole and Orski say that the revenue from tolls would cover 40–90% of new lane construction costs and believe the policy would be politically acceptable on equity grounds. 6 Fuhs 1992. 7 Kain et al. 1992.

Resources for the Future Safirova, Gillingham, Harrington, Nelson
3
properly, they are supposed to have a favorable impact on air quality and energy consumption, as well as lower vehicle operating costs.
Are HOV lanes efficient?
The major issue concerning the efficiency of HOV lanes is how often they function properly. Joy Dahlgren’s research has shown that HOV lanes operate efficiently within a relatively narrow window.8 On one hand, the number of HOV drivers should be high enough to avoid underutilization of the reserved lane. If there are too few HOV drivers, traffic flows could be improved by converting the HOV lane to a general-purpose lane. On the other hand, the number of vehicles using the HOV lanes should stay below a certain limit, since overcrowding of the HOV lane erodes potential timesavings and decreases the incentive for ride sharing. Ultimately, HOV priority treatment may be a flawed strategy because it is ineffective in lessening overall travel delays beyond a self-limiting threshold, leading to chronic underutilization of HOV lanes. This chronic underutilization tends to be a consequence of the “lumpiness” of HOV lanes: HOV lanes must be allocated a whole number of lanes (e.g. 1 lane, 2 lanes, etc) and must be reserved for particular numbers of passengers per car (e.g., HOV-2, HOV-3), but to be efficient, the number of potential carpoolers may call for an intermediate degree of HOV restrictions. Thus, it is often not possible to redistribute road capacity optimally, usually resulting in too much capacity devoted to HOV lanes.
In the cases of extreme underutilization, the public has sought elimination of HOV lanes. For example, in 1998 in New Jersey, 31 miles of HOV lanes on I-287 and I-80 were converted to general-purpose lanes. In 1999 in Virginia, the General Assembly voted to lift HOV restrictions on the local interstates in the Hampton Roads area.
At the same time, the overall propensity to carpool has been steadily declining at the national level. Only 12.6% of work trips were made in multi-occupant vehicles in 2000,9 compared with 19.7% in 1980.10 Given this decrease, it is not clear whether HOV lanes can encourage ride sharing enough to escape underutilization in the long run.
8 Dahlgren 1994, 1995. 9 Census Transportation Planning Package 2000. 10 U.S. Census.

Resources for the Future Safirova, Gillingham, Harrington, Nelson
4
Are HOT lanes better?
The high-occupancy/toll (HOT) lane concept was first articulated in 1993 by Gordon J. Fielding and Daniel B. Klein.11 HOT lanes are reserved for both high-occupancy vehicles (usually without charge) and single drivers who pay a fee. As a traffic demand management measure, the biggest advantage of a HOT lane over an HOV lane is that it provides a self-regulating mechanism: when congestion in regular lanes is high, solo drivers find it more desirable to pay a toll to use the freely moving lane. In theory, the toll could fluctuate throughout the day to keep the traffic in the HOT lane flowing smoothly at all times.
Thus, a HOT lane is essentially a hybrid of two concepts, congestion pricing and HOV lanes. Congestion pricing has been long advocated by economists as an efficient way to ration limited space on congested roads. By deciding to drive on a congested highway, each road user is inherently imposing external costs on other road users, since the speed of all vehicles on the highway declines with each additional vehicle. A congestion toll requires motorists to take account of those costs. Despite their efficiency, however, congestion tolls tend to excite fierce opposition.12 HOT lanes, on the other hand, are an application of a concept called “value pricing”—a system of optional fees paid by drivers to gain access to alternative road facilities providing superior service.13 Since road users still have the option to travel for free in general-purpose lanes, the public tends to regard this policy more favorably.
Proponents of HOT lanes cite several benefits. First, they provide a premium service for a fee to those travelers who have a special need and are willing to pay the fee. Second, they reduce traffic congestion in the general-purpose lanes by diverting some solo drivers to the HOT lanes. Third, by making better use of underutilized carpool lanes, they keep HOV lanes at a higher utilization rate, thereby alleviating political pressure to decommission them. Finally, they generate revenue for transportation improvements.
Nevertheless, opposition to converting HOV lanes to HOT lanes can be vehement. The most significant argument is that HOT lanes are elitist “Lexus lanes” that disproportionately
11 Fielding and Klein 1993. 12 Harrington et al. 1998. 13 “Value pricing” was first introduced by the California Private Transportation Company, the operator of the SR-91 express lanes project.

Resources for the Future Safirova, Gillingham, Harrington, Nelson
5
benefit wealthy drivers. Another issue is that the increased use of the reserved lanes would lengthen trip times for current HOV lane users, leaving them worse off than before.
The Washington, D.C., metro area in particular has a well-established group of HOV lane users who would likely lose from a HOT lane policy. They are known as “slug line” users, or casual carpoolers.14 The most active slug lines are in the I-95/I-395 corridor, where many solo drivers pick up strangers (“slugs”) at agreed-upon spots to satisfy the requirement for using the HOV lane. A HOT lane policy has the obvious effect of increasing traffic on the former HOV lanes, negatively affecting all travelers who continue to carpool. But more importantly to the “slugs,” if a HOT lane policy is implemented, some drivers who currently pick up slugs would decide to pay the toll and drive alone. Slug lines require a dependable supply of drivers to operate smoothly. Therefore, a HOT lane policy may pose a threat to slug lines by reducing the speeds on the HOT lanes and by reducing the number of drivers willing to pick up slugs, possibly leading to a complete deterioration of the slug line system.15
Recent HOT lane experiences
HOT lanes have been implemented so far on I-15 in San Diego, State Route 91 in Southern California, and I-10 (Katy Freeway) in Houston. On I-15, the HOT lane had been an underperforming HOV lane; on SR-91 and I-10, HOT lanes were newly built in the medians of highly congested freeways. The I-10 HOT lane is slightly different from the California projects because it does not allow solo drivers at all: HOV-2 can use it for a fee and HOV-3 or higher can use it for free. In all three cases, fees are collected electronically, and on I-15 and SR-91, the tolls vary depending on the level of congestion.
Studies of these HOT lanes show that they tend to improve traffic flow in the restricted lanes as well as in the free lanes. In addition, there has been a somewhat unexpected effect on carpoolers. Common sense suggests that fewer carpoolers will remain in the new HOT lane as the additional traffic decreases the average speed. Surprisingly, empirical data on the I-15 express lanes suggest that tolls may simultaneously encourage ride sharing.16 The reason is an
14 http://www.slug-lines.com. Accessed March 11, 2003. 15 Although formal modeling of slug lines is beyond the scope of this issue brief, it is important to note this effect. 16 See SANDAG (1999) and Kim (2000).

Resources for the Future Safirova, Gillingham, Harrington, Nelson
6
insurance effect: commuters are more likely to maintain carpools when they can be assured of the regular travel schedule even when their carpool partner is unavailable.17
Equity implications of HOT lanes have been analyzed so far based on single-corridor HOT lanes in California and therefore could be of limited value to more comprehensive projects in other areas. Those studies indicate that although, on average, people of higher income tend to use HOT lanes more often than people of lower income, the latter do use toll lanes when saving time is really important. The classic example is a working parent picking up a child from daycare. In addition, a significant number of people with high incomes report that they use the HOT lanes infrequently or never. But the typical commuter on the SR-91 corridor is a professional from a relatively high-income, multi-vehicle household. Consequently, although a case can be made that HOT lanes simultaneously amplify inequity as well as increase service to low-income households, the comparative importance of those effects has not yet been quantified. For example, a report on the SR-91 express lane states, “Because of the particular demographic makeup of the SR-91 commuter population, it is impossible, based on this corridor, to draw national policy conclusions about the equity implications of widespread deployment of value pricing.”18
The proponents of HOT lanes contend that even if users of HOT lanes tend to be wealthier, the proceeds from toll collection can be used to mitigate any inequities. For example, the revenues could be directed to finance public transit, which tends to be used more by poorer households. However, to properly design a mitigation scheme, one first needs to establish the gains and losses and determine exactly how population strata are affected.
In addition to considering the effect of a HOT lane policy on the well-being of people of different incomes who travel the highway, policymakers should examine network effects—the consequences for those whose travel choices are affected even if they don’t use the highway itself—when estimating aggregate costs and benefits of a new policy.
17 This argument does not apply to casual carpools. See discussion of how Washington, D.C.-area slugs are affected, above. 18 Sullivan 1998, 73.

Resources for the Future Safirova, Gillingham, Harrington, Nelson
7
Model simulation of a Northern Virginia HOT lane policy
To better understand the aggregate effects of a HOT lane policy, we simulate a comprehensive HOT lane policy in Northern Virginia using the Washington-START model. This model was developed by Resources for the Future using MVA Consultancy’s START modeling suite. Among the advantages of Washington-START are a detailed treatment of transportation demand and the grounding of transportation decisions in an economic framework that can be used to assess the overall effects of a policy on well being of area residents.19
For this policy simulation, we assume the conversion of each existing HOV lane in Northern Virginia to a HOT lane that imposes a toll of 20 cents per mile on single-occupancy vehicles. These existing HOV lanes are on I-95 in Prince William and Fairfax counties, I-395 in Northern Virginia, I-66 outside the beltway, all east-bound lanes of I-66 in the morning inside the beltway and all west-bound lanes of I-66 in the afternoon inside the beltway, and State Route 267 in Fairfax and Loudon counties. These highways are highlighted on the map of the START modeling region.
We estimate that this HOT lane policy in Northern Virginia would raise $40 million per year20 in government revenue21 and have the following significant effects on travelers’ behavior:
• Congestion is reduced on general lanes adjacent to HOT lanes. During rush hour, significant numbers of single-occupancy vehicle (SOV) drivers switch from the
19 See Nelson et al. (2003) and Safirova et al. (2003) for a more comprehensive description of the Washington-START model. 20 We have not subtracted the costs of toll collection, which would lower net revenue. A policy evaluation of electronic toll collection in the Los Angeles has assumed these costs to be 15% of collected tolls (Wilbur Smith and Associates 1997).
21 For comparison, the $40 million would fall far short (less than 7%) of the $641 million in yearly funding the Northern Virginia 2020 plan requests for local transportation improvements (Northern Virginia Transportation Alliance 2002).

Resources for the Future Safirova, Gillingham, Harrington, Nelson
8
congested general-purpose lanes to the HOT lanes. This improves the average speeds on the general lanes, reducing total trip times. For instance, a driver using only the general lanes of I-66 and side roads in the morning between the northwestern part of Fairfax County and downtown D.C. will save on average nearly four minutes a day, or 17 hours annually. Other congested routes in Northern Virginia show similar improvements. Although these changes in mean trip times may not seem like much per day, they may indicate more significant changes, such as a reduction in the time spent in stop-and-go conditions.
• Congestion is slightly increased on the new HOT lanes. Some SOV drivers switch from the regular lanes to the new HOT lanes, and some former HOV drivers decide to stop carpooling and pay the toll. The number of SOV drivers on the HOT lanes significantly increases, from an average of 17% SOV drivers now violating the HOV restriction on all HOV lanes in Northern Virginia to an average of 38% SOV drivers using new HOT lanes. The increased traffic lowers speeds and increases trip times for those who continue to use the reserved lanes. For example, a driver using the HOT lanes of I-66 to travel from the northwestern part of Fairfax County to downtown D.C. will see an increase in trip time of just over 2 minutes a day, or 8.7 hours per year. The HOT lanes don’t sacrifice as much speed as the general lanes gain because current HOV lanes are not at capacity, while current general lanes are above capacity. Also, because there are many more users of the general lanes, the total minutes gained is much greater than the total minutes lost.
• Drivers return to highways from side roads, taking slightly shorter trips. When HOV restrictions are in place, some SOV drivers escape to side roads to avoid congestion or as the only alternative to I-66 inside the beltway. Some of those SOV drivers decide to use the new HOT lane, achieving a more direct route to their destination. Therefore, the total vehicle miles traveled falls as some drivers switch from the side roads to the somewhat less congested highways. Daily vehicle miles traveled falls by 350,000, or about 0.2%.
• There is a small increase in the total number of trips taken. Some drivers who were deterred from taking trips by the congestion will decide to travel because of the reduced congestion under the HOT lane policy. Approximately 2,000 more trips per day will be taken in the D.C. metro region. This is less than 0.1% of the total daily trips in the area, but nearly all of those new trips take place in Northern Virginia. In the vicinity of the new HOT lanes, the increase in trips may be more noticeable.

Resources for the Future Safirova, Gillingham, Harrington, Nelson
9
Additionally, most of these new trips occur during the peak hours, partially contributing to a total increase in rush-hour trips of just over 41,000 in the entire D.C. metro region.
• There is a mode shift from carpooling to solo driving. Because the HOT lanes offer better travel opportunities to solo drivers, single-occupancy trips throughout the region increase by 44,073 trips, or by 0.42% of total SOV trips. Correspondingly, carpool trips throughout the region decrease by 36,000 trips, or 0.35% of total HOV trips.
• Wealthier households are more responsive to the HOT lane policy. All income groups make more trips in response to the policy, but wealthier households tend to make more trips than others. In the D.C. metro area, SOV trips by the highest income quartile increase by 0.5%; SOV trips by the lowest income quartile increase by 0.4%; the other two income groups fall in between. This small difference doesn’t capture the localized effects on each new HOT lane. For instance, there is an increase in SOV travelers from the wealthiest quartile who drive from the northwestern portion of Fairfax County to work in downtown D.C., from just under 60 HOV violators when the lanes were HOV to 1,850 paying SOV drivers on the new HOT lanes (an increase of more than 3,000%). In contrast, only 5 similar travelers in the poorest quartile elect to use the new HOT lanes.
• Poorer households benefit from the less-congested regular lanes and side roads. As drivers switch to the HOT lanes, the general-purpose lanes become less congested. This encourages some drivers from the lower income quartiles to take trips that they would not otherwise have taken. For instance, there is an increase in travelers from the poorest quartile who drive from the northwestern portion of Fairfax County to work in downtown D.C., from 340 before the HOT lane policy was implemented to 405 (an increase of 16%). Similar effects occur on side roads as the less congested highways become more attractive.
Costs and benefits of the HOT lane policy
The results of the model simulation provide a mixed picture of the effects of a 20-cent-per-mile HOT lane policy in Northern Virginia. Clearly, some people benefit from the policy and others lose. An advantage of the Washington-START model is that it permits the analysis of the
Resources for the Future Safirova, Gillingham, Harrington, Nelson
10
social welfare effects of policies, enabling a comprehensive examination of the costs and benefits of a policy consistent with economic theory.
Among the winners are SOV drivers who switch to the new HOT lane from the more congested general-purpose lanes. They incur the cost of the toll but receive the benefit of reduced trip times. Similarly, new SOV drivers who formerly carpooled to drive in the HOV lane also pay the cost of the toll but receive the benefit of the increased flexibility and convenience of driving alone. All drivers on the less congested general-purpose lanes and side roads benefit from the reduced trip times without paying a toll.
In contrast, HOV lane users who continue to use the HOT lane will avoid the toll but face increased trip times because of the new traffic in their lane. Also, certain areas may experience more traffic that increases the trip times for local drivers.
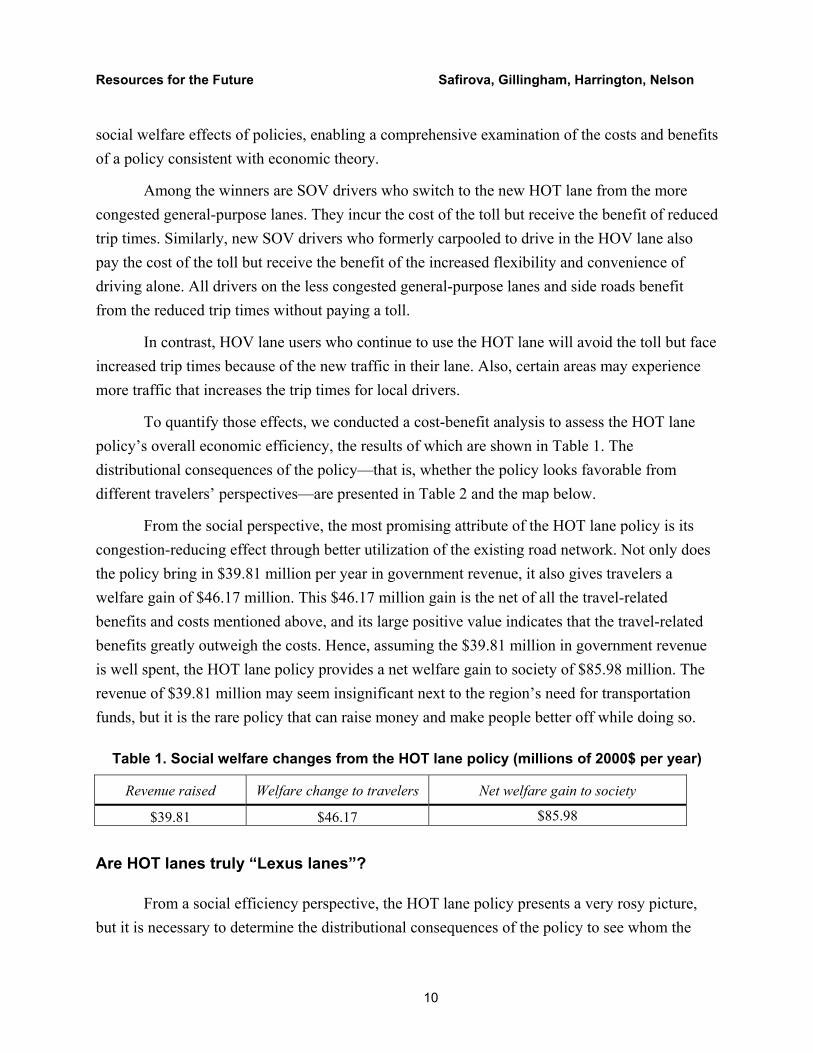
To quantify those effects, we conducted a cost-benefit analysis to assess the HOT lane policy’s overall economic efficiency, the results of which are shown in Table 1. The distributional consequences of the policy—that is, whether the policy looks favorable from different travelers’ perspectives—are presented in Table 2 and the map below.
From the social perspective, the most promising attribute of the HOT lane policy is its congestion-reducing effect through better utilization of the existing road network. Not only does the policy bring in $39.81 million per year in government revenue, it also gives travelers a welfare gain of $46.17 million. This $46.17 million gain is the net of all the travel-related benefits and costs mentioned above, and its large positive value indicates that the travel-related benefits greatly outweigh the costs. Hence, assuming the $39.81 million in government revenue is well spent, the HOT lane policy provides a net welfare gain to society of $85.98 million. The revenue of $39.81 million may seem insignificant next to the region’s need for transportation funds, but it is the rare policy that can raise money and make people better off while doing so.
Table 1. Social welfare changes from the HOT lane policy (millions of 2000$ per year)
Revenue raised Welfare change to travelers Net welfare gain to society
$39.81 $46.17 $85.98
Are HOT lanes truly “Lexus lanes”?
From a social efficiency perspective, the HOT lane policy presents a very rosy picture, but it is necessary to determine the distributional consequences of the policy to see whom the

Resources for the Future Safirova, Gillingham, Harrington, Nelson
11
winners and losers would be. Much of the criticism of HOT lanes is based on the premise that HOT lanes benefit only the wealthy, to the detriment of the poor. A better understanding of the distributional consequences the policy could help policymakers design ancillary compensation schemes to more equitably distribute the gains from the policy.
From an individual driver’s perspective, money paid to the government for tolls is a cost that may or may not eventually benefit that traveler, depending on how the money is spent. Prior to the spending of the funds, then, travelers see the amount paid as a cost. However, they directly receive the travel-related welfare benefits (or costs), such as changes in congestion levels from the policy. Hence, the welfare change they experience, again prior to the spending of the revenue, is the sum of the negative toll cost and the travel-related benefits (or costs). Using this framework, Table 2 presents the burden of the toll and the welfare changes from the policy for different income quartiles.
Table 2. Welfare changes by income group (millions of 2000$ per year)
Quartile Amount paid by travelers and percentage of total
Travel-related welfare benefits
Welfare gain to travelers
1 $ 1.92 4.8% $ 3.05 $ 1.13 2 4.45 11.2% 7.89 3.43 3 12.33 31.0% 23.62 11.29 4 21.11 53.0% 51.42 30.32
Total 39.81 100% 85.98 46.17
The amount paid in tolls by the different income groups reflects the composition of the SOV drivers on the HOT lane. Although some drivers from the lowest quartile do drive alone in the HOT lanes and pay the toll, only 4.8% of the toll revenue is collected from that income group, indicating that few poor drivers actually pay the toll. But 53% of the toll is paid by the highest quartile, indicating that most SOV drivers in the HOT lanes are wealthier drivers who are willing to pay for reduced congestion.
Because the wealthiest households are more likely to use the HOT lane and pay the toll, they also are the primary recipients of the benefits from the reduced congestion. In fact, the wealthiest quartile receives travel-related benefits more than 17 times greater than the poorest quartile. Even after accounting for the cost of paying the toll, the wealthiest quartile still receives a total welfare gain ($30.32 million) far greater than that of the poorest quartile ($1.13 million).
Although those results provide evidence that HOT lanes do act as Lexus lanes, it is important to note that all income groups benefit from the policy. Travelers from all quartiles

Resources for the Future Safirova, Gillingham, Harrington, Nelson
12
drive in the general-purpose lanes and side roads and benefit from the decreased congestion there, even though the benefits accrue disproportionately to the wealthy.
Some might argue that this result demonstrates the importance of more equitable distribution of the policy benefits. Recall, however, that the HOT lane policy generates only $39.81 million a year. Clearly, if the equitable distribution of the benefits is a public policy goal, other funds must be used to close the gap. But even if other funds are not available and the government toll revenue is spent elsewhere, this policy would still improve the welfare of all income groups, so there are no losers when the welfare effects of the policy are disaggregated by income group.
Who loses from a HOT lane policy?
Although there are no losers from a HOT lane policy when costs and benefits are examined by income quartile, some groups lose when the welfare effects are examined along different classifications. Current users of the HOV lanes in Northern Virginia who continue to carpool in the HOT lanes will see slight increases in their trip times, and slugs may have more difficulty finding rides if some drivers who used to pick them up to qualify for the HOV lane decide they would rather pay the HOT lane toll rather than ride with strangers.
Moreover, not everyone in the D.C. metro area receives a benefit from the HOT lane policy in Northern Virginia. Not surprisingly, the benefits are concentrated where the policy is implemented—those regions that contain many travelers who use the stretches of highway with HOT lanes.
Travelers living elsewhere tend to see a negative welfare change. For our HOT lane policy, the geographic regions that would see this loss in welfare include our entire modeling region in Maryland and all of the District of Columbia outside downtown D.C. These regions suffer from spillover effects of the HOT lane policy. For example, the policy makes rush-hour travel for Virginia travelers more bearable, leading to an increase in
Resources for the Future Safirova, Gillingham, Harrington, Nelson
13
traffic flow into the inner core that affects all those who travel there.
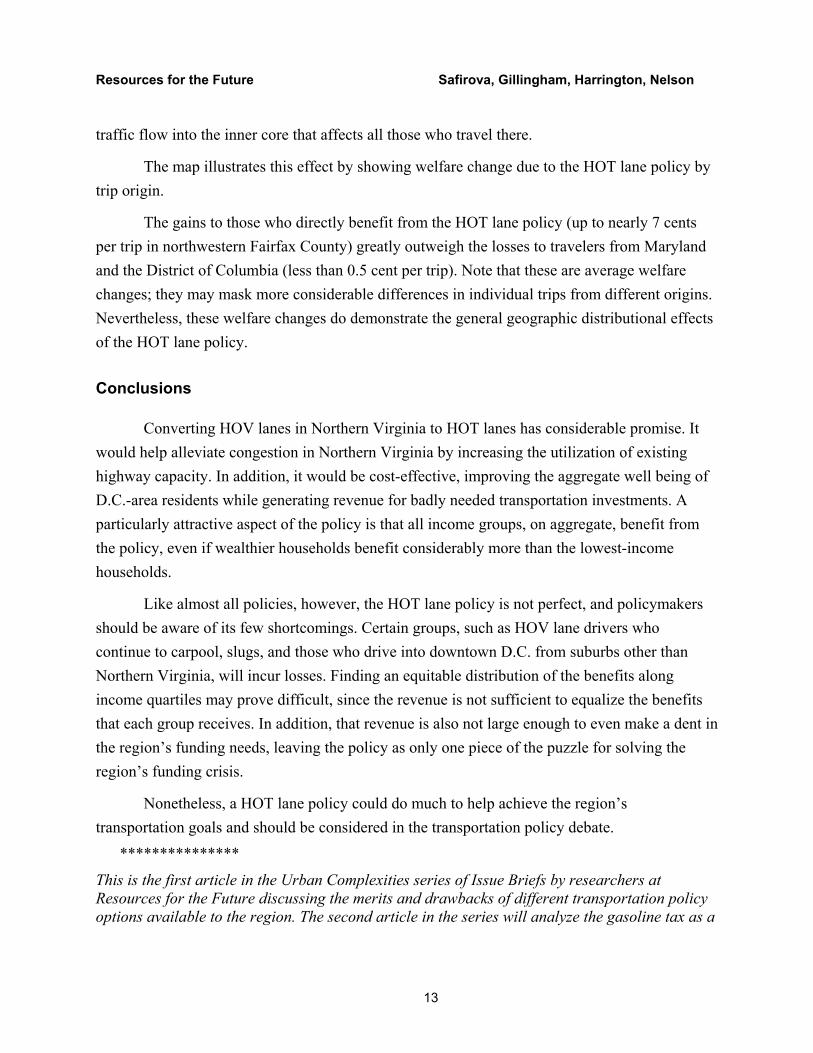
The map illustrates this effect by showing welfare change due to the HOT lane policy by trip origin.
The gains to those who directly benefit from the HOT lane policy (up to nearly 7 cents per trip in northwestern Fairfax County) greatly outweigh the losses to travelers from Maryland and the District of Columbia (less than 0.5 cent per trip). Note that these are average welfare changes; they may mask more considerable differences in individual trips from different origins. Nevertheless, these welfare changes do demonstrate the general geographic distributional effects of the HOT lane policy.
Conclusions
Converting HOV lanes in Northern Virginia to HOT lanes has considerable promise. It would help alleviate congestion in Northern Virginia by increasing the utilization of existing highway capacity. In addition, it would be cost-effective, improving the aggregate well being of D.C.-area residents while generating revenue for badly needed transportation investments. A particularly attractive aspect of the policy is that all income groups, on aggregate, benefit from the policy, even if wealthier households benefit considerably more than the lowest-income households.
Like almost all policies, however, the HOT lane policy is not perfect, and policymakers should be aware of its few shortcomings. Certain groups, such as HOV lane drivers who continue to carpool, slugs, and those who drive into downtown D.C. from suburbs other than Northern Virginia, will incur losses. Finding an equitable distribution of the benefits along income quartiles may prove difficult, since the revenue is not sufficient to equalize the benefits that each group receives. In addition, that revenue is also not large enough to even make a dent in the region’s funding needs, leaving the policy as only one piece of the puzzle for solving the region’s funding crisis.
Nonetheless, a HOT lane policy could do much to help achieve the region’s transportation goals and should be considered in the transportation policy debate.
***************
This is the first article in the Urban Complexities series of Issue Briefs by researchers at Resources for the Future discussing the merits and drawbacks of different transportation policy options available to the region. The second article in the series will analyze the gasoline tax as a

Resources for the Future Safirova, Gillingham, Harrington, Nelson
14
method of raising revenue for funding transportation. Subsequent issue briefs will focus on possible effects of parking taxation and cordon-type tolls.
References
Census Transportation Planning Package. 2000. http://www.transportation.org/ctpp/home/US/us.htm. Accessed February 27, 2003.
Dahlgren, J. 1994, An Analysis of Effectiveness of High Occupancy Vehicle Lanes. Ph.D. dissertation, University of California–Berkeley, Institute of Transportation Studies.
———. 1995. Are HOV Lanes Really Better? Access (spring).
Fielding, G.J., and D.B. Klein. 1993. High Occupancy/Toll Lanes: Phasing in Congestion Pricing a Lane at a Time. Policy study 170. Los Angeles: Reason Foundation.
Fuhs, C.A. 1990. High Occupancy Vehicle Facilities: A Planning, Operation and Design Manual. New York: Parsons Brinkerhoff, Quade and Douglas, Inc.
Harrington, W., A. Krupnick, and A. Alberini. 1998. Overcoming Public Aversion to Congestion Pricing. RFF Discussion Paper 98-27. Washington, D.C.
Kain, J., R. Gittell, S. Daniel, T. Sumerville, and L. Zhi. 1992. Increasing the Productivity of the Nation’s Urban Transportation Infrastructure: Measures to Increase Transit Use and Carpooling, Washington, DC: U.S. Department of Transportation.
National Capital Region Transportation Planning Board. 2001. 2000 Update to the Financially Constrained Long-Range Transportation Plan for the National Capital Region. Publication 22603. Washington, DC: Metropolitan Washington Council of Governments.
Nelson, P., K. Gillingham, and E. Safirova. Forthcoming. Revving Up the Tax Engine: Gas Taxes and the DC Metro Area’s Transportation Dilemma. Urban Complexities Issue Brief. Washington, DC: Resources for the Future.
Northern Virginia Transportation Alliance. 2002. Transportation Funding. http://www.nvta.org/transfunding.html. Accessed February 2003.
Poole, R., and C.K. Orski. 2000. HOT Lanes: A Better Way to Attack Urban Highway Congestion. Regulation 23(1). Washington, DC: Cato Institute.
———. 2003. HOT Networks: A New Plan for Congestion Relief and Better Transit. Policy study 305. Los Angeles: Reason Foundation.

Resources for the Future Safirova, Gillingham, Harrington, Nelson
15
SANDAG. 1999. Report to California Legislature: San Diego’s Interstate 15 Congestion Pricing & Transit Development Demonstration Program. San Diego Association of Governments.
Safirova, E., K. Gillingham, I. Parry, P. Nelson, W. Harrington, and D. Mason. 2003. Welfare and Distributional Effects of HOT Lanes and Other Road Pricing Policies in Metropolitan Washington, DC. In Road Pricing: Theory and Practice, edited by Georgina Santos. Elsevier Publishing
Schrank, D., and T. Lomax. 2002. The 2002 Urban Mobility Report. College Station, TX: Texas A&M University, Texas Transportation Institute.
Shaver, K. 2003. Virginia Willing to Study Toll Lane Potential. Washington Post, January 16, B01
Sullivan, E. 1998. Evaluating the Impacts of the SR91 Variable Toll Express Lane Facility. Final report for State of California Department of Transportation, Sacramento.
U.S. Census. http://www.census.gov/statab/USA98/dd-lf.txt. Accessed February 27, 2003.
Wilbur Smith Associates. 1997. Development of a Regionally Preferred Transportation Pricing Program for Southern California: Travel and Emissions Modeling Report. Report prepared for the Southern California Association of Governments and REACH Task Force.