Elements of Money Stock Determination - St. Louis Fed - Federal
10
IRECENT DISCUSSION of the role of money in stabilization policy has culminated in two central issues. The first involves the strength and reliability of the relation between changes in money and changes in total spending. If this relation is sufficiently strong and reliable, changes in the money stock can be used as an indicator of the influence of monetary stabilization actions on the economy.i The second issue centers on whether or not the monetary author- ities can determine the growth of the money stock with sufficient precision, if it is deemed desirable to do so. This article is concerned primarily with the second issue—determination of the money stock. 2 A frame- work describing the factors which influence the monetary authorities’ ability to determine the money stock is presented, and the behavior of these factors in recent years is illustrated. In addition, examples of ways in which these factors influence the money stock are discussed. Factors Influencing the Money Stock The following sections present essential elements and concepts which are used to construct a “money supply model” for the U.S. economy. First, the necessary information regarding institutional aspects of the U.S. banking system are summarized. Then, iLeonall C. Andersen and Jerry L. Jordan, “Monetary and Fiscal Actions A Test of Their Relative Importance in Economic Stabilization,” this Review, November 1968, 2 Private demand deposits plus currency in the hands of the public. the main elements of the model — the monetary base, the member bank reserve-to-deposit ratio, the cur- rency to demand deposit ratio, the tune deposit to- demand deposit ratio, and the U S Government deposit to demand deposit ratio — are discussed in” ci ( “W %S itt t~Of O~’ ( S Bunking S,jsti n Students of money and banking are taught that if commercial bank reserve requirements are less than 100 per cent, the reserves of the banking system can support a “multiple” of deposits. In fact it is ofte:~ said that under a fractional reserve system the bank- ing system “creates” deposits. The familiar textbook exposition tells us that the amount of deposits (D) in the system is equal to the reciprocal of the reserve requirement ratio (r) times the amount of reserves (II): D = ‘H. r Thus if the banking system has $100 of reserves, and the reserve requirement ratio is 20 per cent (.2), deposits will be $100/.2 or $500. If the banks acquire an additional $1 in reserves (for instance from the Federal Reserve), deposits will increase by $5. There are many simplifying assumptions under- lying this elementary deposit-expansion relation. First, it is assumed that all bank deposits are subject to the same reserve requirement. Second, all banks are subject to the same regulations; in other words, all banks are members of the Federal Reserve System, and the Federal Reserve does not differentiate among classes of banks. Third, banks do not hold excess EDIToR’s Non: This article Is intended for those persons who wish to study in some detail how the volume of money in the U. S. economy is determined. Examples of ways the money stock is influenced by factors other than actions of the monetary authority are illustrated in two ways—changes in components of the “monetary multiplier” and changes in entries in “T-Accounts” or commercial bank balance sheets. Elements of Money Stock Determination By JERRY L. JORDAN Page 10
Transcript of Elements of Money Stock Determination - St. Louis Fed - Federal

IRECENT DISCUSSION of the role of money instabilization policy has culminated in two centralissues. The first involves the strength and reliabilityof the relation between changes in money andchanges in total spending. If this relation is sufficientlystrong and reliable, changes in the money stock canbe used as an indicator of the influence of monetarystabilization actions on the economy.i The secondissue centers on whether or not the monetary author-ities can determine the growth of the money stockwith sufficient precision, if it is deemed desirable todo so.
This article is concerned primarily with the secondissue—determination of the money stock.2 A frame-work describing the factors which influence themonetary authorities’ ability to determine the moneystock is presented, and the behavior of these factorsin recent years is illustrated. In addition, examplesof ways in which these factors influence the moneystock are discussed.
Factors Influencing the Money Stock
The following sections present essential elementsand concepts which are used to construct a “moneysupply model” for the U.S. economy. First, thenecessary information regarding institutional aspectsof the U.S. banking system are summarized. Then,
iLeonall C. Andersen and Jerry L. Jordan, “Monetary andFiscal Actions A Test of Their Relative Importance inEconomic Stabilization,” this Review, November 1968,
2Private demand deposits plus currency in the hands of thepublic.
the main elements of the model — the monetary base,the member bank reserve-to-deposit ratio, the cur-rency to demand deposit ratio, the tune deposit to-demand deposit ratio, and the U S Governmentdeposit to demand deposit ratio — are discussed
in” ci ( “W %S itt t~Of O~’ ( S BunkingS,jsti n
Students of money and banking are taught that ifcommercial bank reserve requirements are less than100 per cent, the reserves of the banking system cansupport a “multiple” of deposits. In fact it is ofte:~said that under a fractional reserve system the bank-ing system “creates” deposits. The familiar textbookexposition tells us that the amount of deposits (D) inthe system is equal to the reciprocal of the reserverequirement ratio (r) times the amount of reserves(II):
D = ‘H.r
Thus if the banking system has $100 of reserves,and the reserve requirement ratio is 20 per cent (.2),deposits will be $100/.2 or $500. If the banks acquirean additional $1 in reserves (for instance from theFederal Reserve), deposits will increase by $5.
There are many simplifying assumptions under-lying this elementary deposit-expansion relation. First,it is assumed that all bank deposits are subject to thesame reserve requirement. Second, all banks aresubject to the same regulations; in other words, allbanks are members of the Federal Reserve System,and the Federal Reserve does not differentiate amongclasses of banks. Third, banks do not hold excess
EDIToR’s Non:
This article Is intended for those persons who wish to study in some detail how the volume of moneyin the U. S. economy is determined. Examples of ways the money stock is influenced by factors other thanactions of the monetary authority are illustrated in two ways—changes in components of the “monetarymultiplier” and changes in entries in “T-Accounts” or commercial bank balance sheets.
Elements of Money Stock DeterminationBy JERRY L. JORDAN
Page 10

FEDERAL RESERVE BANK OF ST. LOUIS OCTOBER 1969
reserves; they are always “loaned up”. And finally,there is no “cash drain”. The public desires to holda fixed quantity of currency, and their desires forcurrency are not influenced by the existence of moreor less deposits.
Since the above assumptions are not true, theaccuracy with which a monetary analyst can estimatehow many deposits will be “created” by an additionof $1 in reserves to the banking system, depends onhis ability to determine:
(1) how the deposits will be distributed betweenmember and nonmember banks;
(2) how the deposits will be distributed betweenreserve city and country banks, which aresubject to different reserve requirements;
(3) how the deposits wifi be distributed amongprivate demand deposits, Government demanddeposits, and the sub-classes of time deposits,all of which are subject to different reserverequirements;
(4) how the change in deposits will affect banks’desired ratio of excess reserves to total depos-its; and
(5) how a change in deposits will affect thepublic’s desired ratio of currency to demanddeposits.
These questions can be answered best within thecontext of a “money supply model” which is con-
structed to include the institutional realities of theU.S. banking system, and which does not require thespecial assumptions of the simple deposit expansionequation. A thoroughly developed and tested moneysupply model has been advanced by ProfessorsBrunner and Meltzer.3 The following sections presentthe general form and essential features of this model.
The Monetan; Base
A useful concept for monetary analysis is providedby the “monetary base” or “high-powered money”.4
The monetary base is defined as the net monetaryliabilities of the Government (U.S. Treasury andFederal Reserve System) held by the public (eom-mercial banks and nonbank public). More specifically,the monetary base is derived from a consolidatedbalance sheet of the Treasury and Federal Reserve“monetary” accounts. This consolidated monetary basebalance sheet is illustrated in Table I, and monthlydata for the monetary base (B) are shown in Chart I.
The growth of the monetary base, that is, “basemoney,” is determined primarily by Federal Reserve
iKarl Brunner and Allan Meltzer, “Liquidity Traps for Money,Bank Credit, and Interest Rates,” Journal of Political Economy,Vol. 76, Jannary/Februaiy 1968. Also see Albert E. Burger,An Analysis of the Erunner-Meltzer Non-Linear MoneySupply Hypothesis, Working Paper No. 7, Federal ReserveBank of St. Louis, May 1969.
4For further discussion of this concept, see Leonall C.Andersen and Jerry L. Jordan, “The Monetary Base: Explana-tion and Analytical Use,” this Review, August 1968,
‘UMonetary Base’ Rat,o $ ole
Ratio cole M,,th ,efl et 505 ‘ B hone of Dollar~,~honsof Dollar , ,i,,~, ____________
Sc85
—5
0” - - - — ~— —----——-- —- ——-- —---——4------------------- —
::~~
~
so
—J
1950 1951 1Q52 19 3 1954 195$ 1954 1957 1958 1959 1960 1961 1962 1963 964 965 1946 1967 1968 1969‘Use ,,e,.eqbo,,e,e,,,r,,be,h, ‘cc,, d,,,cyh btl, eke’ ,rmb bekA4 ,‘m,’t, sm4detee sq.,, eeedt,(en4,petem,,e,s,
Detee,, ,,p e I,t epeq. p
Page 11

FEDERAL RESERVE BANK OF ST. LOUIS OCTOBER 1969
currency held by the nonbankpublic plus reserves of all com-mercial banks, shown in TableII below.
(.•‘sesof itteserces
RRm = Rd + Rt,
Table IIUSES OF MONETARY BASE
(July 1969 billions of dollars)
Currency in Circulation $51.3 Currency Held by theNonbank Pubiic $45.1
Member Bank Depositc ciFederal Reserve 22.3 corn,norcial Bank Raservec 28.5
U’,e, of the Base $73.6 Uses of the Bose $73.6
NUlL. N..’ —‘a—’’’ :.fl~’u:,I r—,,i:1.’— qaL’,I, .; I’ .1
Table I
MONETARY BASEtiuly 1969 bsllrons of doflarsl
Consolidtited Treasuryand Federo) Re*rve Monetary Accoqnts
Sources of the base Use of the base
Federal Pee rye Credit. Membe Ponk Deposits at As noted above, analysis ofHold ngs of Starr tree $543 Federal Reserve $223 the U S n - t stem isDuscourits and Advances 1 2 Cur ocy it, Circulotrort 51 -~ . mo e ary sy~ioot 27 complicated by the existence ofOther Federal Reserve A ets 27 both member and nonmember
Gold Stock 104Treosu ~ Cu reuscy Outstondiru9 67 banks, different classes of mem-
T’~~St~rerol Reserve 1) ber banks, different reserve re-Fpre~nDeposits at Federal Reserve I quirements on different types of
~t SitS 2 deposits (private demand, Coy-SOI~C~of the Sos $738 Uses of the Bose $7 o ernment demand, and time),R erve Adlustut,ent
09 Re e~ ~ ~ ~ and graduated reserve require-
Monetary Base $773 Monetary Ease $77.5ments for different amounts ofdeposits. It is thus necessary to
NP~i3taa n nail j e&Mnsbeban a a t e4 it e iucc ii S b n ni total ci ptii allocate the uses of bank re-
I C a ~ not 1, wit pa serves among the different typestsL I d and L,ioa 7 Mn B oand xi
‘tb B - of deposits. This is illustrated byour lIt ii B n I~ ~, nan ijcserv Ba C eth~
1od Edit S an equation showing total bank
Ear a reserves (B) in terms of theiruses:
holdings of U.S. Government securities, the dominant R = RR~,+ ERR, + VC,,,
asset or source component of the base.5 In recent where RRm required reserves of member banks,
decades changes in other sources either have been ERm = excess reserves of member banks,VC,, = vault cash of nonmember hunks.small or have been offset by changes in secuntyholdings. A change in the Treasury’s gold holdings In turn, required reserves of member banks areis potentially an important source of increase or decomposed as:decrease in the base. However, since March 1968the size of the gold stock has been changing only bysmall increments. In the postwar period the influence where Rd =
of changes in the gold stock were generally offset by Ru
compensating changes in Federal Reserve holdingsof U.S. Government securities. In turn, required reserves behind demand deposits
at member banks are the sum of the amount ofThe liabilities or uses of the monetary base, or net
reserves required behind demand deposits over andmonetary liabilities of the Federal Reserve and Treas—
under $5 million at each reserve city and countryury, are shown in Table I to be currency in circula-tion plus member bank deposits at the FederalReserve. Part of the currency in circulation is held bythe public, part is held as legal reserves by memberbanks, and another part is held as desired contingencyreserves by nomnember commercial banks. In orderto relate the uses of the base to the money stock, theuses are regrouped from the uses side of Table I as
required reserves behind demand de-posits at member banks,required reserves behind time depositsat mcmher banks.
1For a discussion of the statistical relation among sourcecomponents of the base, see Michael W. Keran and Christo-pher Babh, “An Explanation of Federal Reserve Actions(1933-68),” this Review, July 1969.
Page 12
FEDERAL RESERVE BANK OF ST. LOUIS OCTOBER 1969
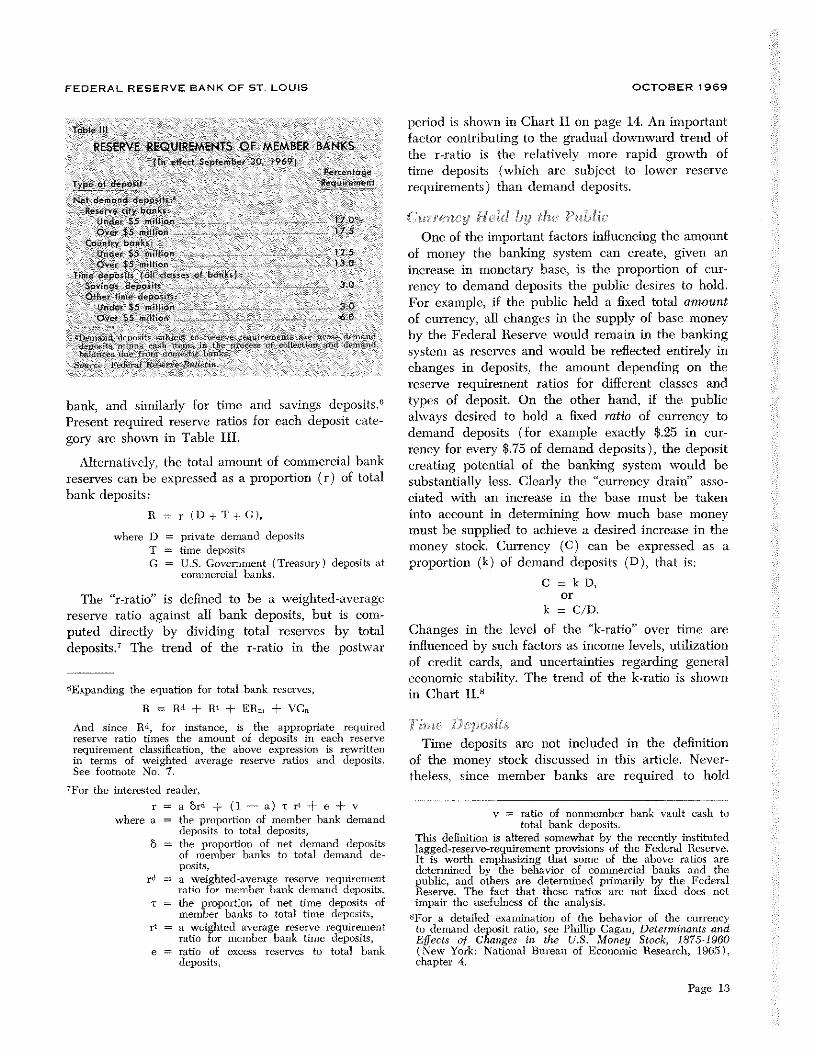
bank, and similarly for time and savings deposits.°Present required reserve ratios for each deposit cate-gory are shown in Table III.
the total amount of commercial bankexpressed as a proportion (r) of total
R = r (D+T+C),
where D = private demand depositsT = time depositsC = U.S. Govemment (Treasnry) deposits at
commercial banks,
The “r-ratio” is defined to be a weighted-averagereserve ratio against all bank deposits, but is com-puted directly by dividing total reserves by totaldeposits.7 The trend of the r-ratio in the postwar
6Expanding the equation for total batik reserves,
R = Rd + R’ + ER,,, + VCn
And since lId, for instance, is the appropriate requiredreserve ratio times the amount of deposits in each reserverequirement classification, the above expression is rewrittenin terms of weighted average reserve ratios and deposits.See footnote No. 7.
TFor the interested reader,
r = a hrd + (1 a) r r’ + e + vwhere a = the proportion of member bank demand
deposits to total deposits,B = the proportion of net demand deposits
of member banks to total demand de-posits,
ra = a weighted-average reserve requirementratio for member bank demand deposits,
-r = the proportion of net time deposits ofmember banks to total time deposits,
r = a weighted average reserve requirementratio for member bank time deposits,
e = ratio of excess reserves to total bankdeposits,
period is shown in Chart II on page 14. An importantfactor contributing to the gradual downward trend ofthe r-ratio is the relatively more rapid growth oftime deposits (which are subject to lower reserverequirements) than demand deposits.
(7urrenci, ,:h.ild. by The: Pr ri-I.e
One of the important factors influencing the amountof money the banking system can create, given anincrease in monetary base, is the proportion of cur-rency to demand deposits the public desires to hold.For example, if the public held a fixed total amountof currency, all changes in the supply of base moneyby the Federal Reserve would remain in the bankingsystem as reserves and would be reflected entirely inchanges in deposits, the amount depending on thereserve requirement ratios for different classes andtypes of deposit. On the other hand, if the publicalways desired to hold a fixed ratio of cunency todemand deposits (for example exactly $.25 in cur-rency for every $75 of demand deposits), the depositcreating potential of the banking system would besubstantially less. Clearly the “currency drain” asso-ciated with an increase in the base must be takeninto account in determining how much base moneymust be supplied to achieve a desired increase in themoney stock. Currency (C) can be expressed as aproportion (k) of demand deposits (D), that is:
C = k D,or
k = C/D,
Changes in the level of the “k-ratio” over time areinfluenced by such factors as income levels, utilizationof credit cards, and uncertainties regarding generaleconomic stability. The trend of the k-ratio is shownin Chart II.~
hine Deposits
Time deposits are not included in the definitionof the money stock discussed in this article. Never-theless, since member banks are required to hold
Table Ill
RESERVE REQUIREMENTS OF MEMBER BANKSIn L’.Fcrt Septemb,,r 30. 9691
Parc L’ r,toTypt’ of deposit Rcq’..rt:rrient
Not dernono di posisRn ser’,e dy bor,ks,
Urde, $5 million 17 0OV~r $5 million 175
Court,y bonuslJnder $5 nil~‘on 12 5Ovur $5 million 13 C
I me ocpontm
s I al rlonstu of ba,,’ns~Sovinun depos’ts 3.0O”,n-r tin,: deposi’u
jndtr $5 m’Wor’ 3 0
o ic, $5 mThon 6 0
I., i. :‘_‘i~’’’’.—.i’ , . I .,‘‘ ‘i’, ‘‘,.._ir’’’i,’—. L, ,~,‘‘~‘iil’—’’’’—— Ir 1 .‘‘~c.i’.’ ‘‘‘ar,
“—‘l.O.
-i I{.—,,’,!’’’’’
Alternatively,reserves can bebank deposits:
v = ratio of nonmember bank vault cash tototal bank deposits.
This definition is altered somewhat by the recently institutedlagged-reserve-requirement provisions of the Federal Reserve.It is worth emphasizing that some of the above ratios aredetermined by the behavior of commnercial banks and thepublic, and others are determined primarily by the FederalReserve. The fact that these ratios are not fixed does notimpair the usefulness of the analysis.
5For a detailed examination of the behavior of the currencyto demand deposit ratio, see PhIllip Cagan, Determinants andEffects of Changes in the U.S. Money Stock, 1875-1960(New York: National Bureau of Economic Research, 1985),chapter 4.
Page 13

FEDERAL RESERVE BANK OF ST. LOUIS OCTOBER 1969
t-~
~cI-aIiu
I SCALE
~c,.
Monetary Multiplier Ratiosrole __________ ______________ k stole
14 300
Ii
12 , ‘7;
mm0 250
9
8 role7 tate
6 - ISO
.5 —- - 125
__________- - - - mooq-,atiu 0~
— 0, . — 07521, [\ )‘--~ —- - , r~,\ia’\ ‘V”—~’s — 050
I’ ,~ ,%/Q’ \.a. n~E~,,p,JSA/ ‘N— , F ‘~ - — 025
0950 1951 1952 1953 1954 1955 t956 1957 958 1959 960 961 1962 1963 964 965 1966 197 1968 1969
t,i&~dispI, ,E, S
.~ I
--~
~:
reserves behind time deposits, information regarding Similarily, the decisions by individuals and businessesthe public’s desired holdings of time to demand de- to deposit their funds in banks are influenced by theposits is necessary in order to determine how much interest rates available from alternative earning assetsthe stock of money will change following a change such as savings and loan shares, mutual savings bankin the stock of monetary base. deposits, bonds, stocks, commercial paper, and direct
Reserve requirements are much lower against lime Tabs IV
deposits than against demand deposits as shown in MAXIMUM INTEREST RATES PAYABLE ONTable III consequently a given amount of reserves TIME AND SAVINGS DEPOSITSwould allow more time deposits to be supported than (Effe bye April 19, i96a~demand deposits. Time deposits (T) can be expressed Per cent
rype of Deposit per aruiemas a proportion (t) of demand deposmts (D), that is: 50Y1n95 deposits ., .,. 400 —
T = t D, other time depo itor Mat ipis niatu it)’
90.daysormore - 500= T/D, La $ thee 90 days (3089 days) , , 400
The trend of the “t-ratio” is shown in Chart II. ~ maturity: - - S 00
$100 000 or morerThe factors mfluencmg the t-ratio are more com- 3o’59 da~ , , , 5.50
pIer to analyze than those affecting the k-ratio. 60 89 days , - ‘ , ,,,, 5 7590 179 days , ., ‘ - &00Commercial banks are permitted to pay interest on tao day and over 625
time deposits up to ceiling rates set by the FederalReserve and the Federal Deposit Insurance Corpora- ~jb’
t~t~~1
:”y~no;: ~ ~ t O~b ~ s~ça~ut
tion (see Table IV). Consequently, the growth of ~ ntt:~e~$7~~tr w itt a 0 Ce of -z bdr w 1.
time deposits over time is influenced by competitionamong banks for individual and business savings
investments m real assets.-1 If the mterest returnswithin the limits permitted by the legal interest rate‘1’ - from these other assets are sufliciently high that thecci ings. interest rate ceilings on time deposits prevent banks
The interest rates which banks are willing to offer from effectively competing for the public’s savings,on thne deposits (below the ceilings) are determinedprimarily by opportunties that are available for prof- 9
Jerr’ L. Jor~lan, The Market for Deposit-Type FinancialAssets, Working Paper No. 8, Federal Reserve Bank of St.
itable mvestment of the funds m loans or securities. Louis, March 1969.
Page 14

FEDERAL RESERVE BANK OF ST. LOUIS OCTOBER 1969
then time deposits may not grow (or may even de-dine) and all increases in commercial bank reservescan he used to support demand deposits. This pointwill be discussed in more detail below.
The Monetan, Multiplier
All of the essential elements for determination ofthe money stock have now been discussed. The defini-tional relations are as follows:
U,S. Cover-macnt Deposits (1) h-I = D + C
Commercial banks are required to hold the sameproportion of reserves against Federal Governmentdemand deposits as against private demand deposits.
(2) B = R + C(3) Rr(D+T+C)(4) C = k D
(5) T = DTherefore, even though Government deposits are (6) C = g Dnot included in the definition of the money stock,changes in the amount of Government deposits ~
By substituting (3) and (4) into (2) we get:
fluence the amount of private deposits the banking (7) B = r (D + T + C) + kDsystem can support with a given amount of basemoney or reserves. Government deposits (C) can beexpressed as a proportion (g) of private demanddeposits (D),thatis:
C = g D,
that is, we express the monetary base solely in termsof the various deposits. Substituting (5) and (6) into(7), we get:
(8) Br(D±tD±gD)±kD,
or that is, we express the base solely in terms of privateg = G/D. demand deposits to reduce the number of variables.
The amount of Government deposits in commer- Simplifying, we write (8) as:cial banks is determined by the flow of Treasury (8’) B = [r (1 + t + g) + k] n
receipts (primarily from taxes) relative to Treasuryexpenditures, and by the Treasury’s discretion aboutwhat proportion of its balances to keep with com-mercial banks rather than at the Federal Reserve.Thus, short-run fluctuations in the “g-ratio” are pri-marily the result of actions by the U.S. Treasury. TheFederal Reserve must assess, from past experience
from which, by simple manipulation, we can expressdeposits in terms of the base as follows:
(9) D = 1 B.r (1 + t ± g) + k
Since we want to find D plus C, we use (4) and (9)
to redefine C in terms of the base:
and information available from the Treasury, whatwill happen to Treasury balances in an impending
(10) C = k ‘ B.r (1 + t + g) ± k
period in order to determine the influence of changesin Treasury balances on the money stock. The monthlypattern of the g-ratio is shown in Chart II.
Substituting (9) and (10) into (1) gives:, 1 + k
(1 ) M B,r (1 + t + g) ± k
Monetary Multiplier280 ‘—‘~- —- 280
2.50 - —~~- -~--25O
4 — _____ — —2451950 9 1952 195 1954 1955 1956 1 57 1958 195 1960 96 1962 1963 1964 1965 1966 1967 1968 1969Ar, ‘I p
Page 15

FEDERAL RESERVE BANK OF ST. LOUIS
or the money stock defined in terms of the monetarybase.iO We can denote the quotient as:
1+km = r (1 + t + g) + k
where m is called the “monetary multiplier.””
The factors that can cause changes in the monetarymultiplier are all of -the factors which influence thecurrency (k), time deposit (t), Government deposit(g), and reserve (r) ratios, that is, the “behavioralparameters”. The observed monthly values of theseratios in the past twenty years are shown in Chart II,and the monthly values for the monetary multiplier(m) are shown in Chart III. Quite obviously, if themonetary multiplier were perfectly constant, at say2.5, then every $1 increase in the monetary basewould result in a $2.50 increase in the money stock.On the other hand, if -the monetary multiplier weresubject to substantial unpredictable variation, theFederal Reserve would have difficulty in determiningthe money stock by controlling the base.
Since the monetary multiplier is not constant, theFederal Reserve must predict the value of the multi-plier for the impending month in order to know howmuch to increase the monetary base to achieve adesired level of the money stock. Techniques forpredicting the monetary multiplier go beyond thescope of this paper~’2 However, examples of howchanges in time deposits and Government depositsinfluence the stock of money will be discussed.
The Influence of Two Factors
on the Money Stock
The following sections present examples of theways changes in the growth of time deposits andU.S. Government deposits influence the money crea-tion process. The effects are illustrated both bychanges in the ratios in the monetary multiplier andwith the use of commercial bank balance sheet“T-Accounts.”
10Since the monetary base is adjusted for the effect ofchanges in reserve requirements, a corresponding adjnst-ment is made to the reserve ratio( r),
“The reader should be able to demonstrate that if money isdefined to include time deposits (Mi = D + C ± T),then
1÷k÷ta1
2= 771 ± t ± g) ± k
iiFor one straight-forward approach, see Lyle Kalish, A Studyof Money Stock Control, Working Paper No. 11, FederalReserve Bank of St. Louis, July 1969.
Page 16
OCTOBER 1969
(;ho:-nees in 1-inni Deposits
The growth of time deposits relative to demanddeposits is determined by many factors, includingthose which influence the interest rates offered bycommercial banks on such deposits and those whichinfluence the quantity of time deposits demanded bythe public at each interest rate. Both the banks’ sup-ply of time deposits and the public’s demand forthem are a function of relative costs and returns ofalternative sources of funds and earning assets. Thus,accuracy of predictions of the t-ratio (time depositsto demand deposits) for a future period is influencedby the ability of the forecasters to anticipate thbanks’ and public’s behavior. Experience has shownthat changes in this ratio tend to be dominated byrather long-run trends, with exceptions occurring atthose times when interest rate ceilings imposed bythe monetary authorities prevent banks from effec-tively competing for deposits. It is these special casesthat will be discussed.
When market interest rates rise above the ceilingrates banks are permitted to offer on time deposits,some individuals and businesses who might otherwisehold time deposit. cli eide to buy bonds or other
Short-Term Money Market Rateskatie Scale Ratio StoleofYields ofYieIds
- 9
6 t - ‘ --~ --a1 —
3 —-- - -—-— 3
2 21942 1963 1964 196$ 1964 1967 1968 1969
I Market ynitdn co,,erted I em d reunite bend q,i’elentbeA’erege new i tie rote n Si rnanttt 5 1,11 ole ofdepa iFotSICO 000° star Ootoore
eusmotedby the Feds elSe e aBonkefSt Lou free,guide ‘ole. published‘niheBondBuyero,d are ,.taatl4 eve age ofWed, sdaytie
3 Rot and pa ‘ in mountsci $100,000 or more ‘not nn~1,90 II?Soy.
Lete.tdoto p oned S pte,nber
8
7
Re elation O:Maximem
-
~‘
‘,_J -
4~1fl~iiñIhomnie,~lPaper I~ft,
h Treasgi
4~i~
6-Mel
A)fly
I

FEDERAL RESERVE BANK OF ST, LOUIS OCTOBER 1969
earning assets instead. This effect has been most pro-nounced on the banks’ class of time deposits called“large negotiable certificates of deposit” (CD’s). Todepositors, these are highly liquid assets which areconsidered by the purchasers to be close substitutesfor Treasury bills and commercial paper.” On atleast four occasions since 1965 the yields on thesesubstitute assets have risen above the rates bankswere permitted to offer on CD’s, causing the growthof CD’s to slow sharply or even become negative.
To illustrate the effect on the money stock of arise in market inte-rest rates above Regulation Q ceil-ings, assume that the growth of time deposits ceases,and banks hold the same total amount of time de-posits while demand deposits continue to grow. Inthe money supply model this is reflected in a declinein the t-ratio (time deposits divided by demand de-posits), and since the t-ratio appears in the denomi-nator of the multiplier, the multiplier would get largeras the t-ratio gets smaller.
For example, assume the following initial valuesfor the monetary base and the parameters of themultiplier:
B = $75 billiont = 1,3g = .04k= .3r .1
1+kSinceM = — Br(1±t+g)+k
we can solve to find M = $182.6 billion.
Now suppose that in the course of several monthsthe base increases by $1 billion, but -time deposits donot grow at all as a result of the high market rates ofinterest relative to Regulation Q ceilings. If all of theratios in the multiplier (including the t-ratio) hadremained unchanged in this period, the money stockwould have increased by about $2.4 billion to $185billion. But, since time deposits did not change whiledemand deposits continued to grow, the t-ratio wouldfall, to 1.28 for example, which causes the multiplierto increase (still assuming the other behavioral para-meters remain the same).14
The reader should be careful not to interpret thisgreater increase in money (especially demand de-posits) to mean that the banks can extend more
tajordan, Deposit-Type Financial Assets, chapter 4.
‘41n practice, as the t-ratio falls from 1.3 to 1.28, demanddeposits grow and time deposits do not, and thct averagereserve requirement ratio (r) will rise. This will slightlyattenuate the increase in the multiplier and the money stock.
credit than otherwise. Since the reserve requirementson demand deposits are greater than on time deposits,the $1 billion increase in monetary base would havesupported a greater amount of total deposits (dc-mand plus time) if time deposits grew proportionallyto demand deposits, rather than only demand de-posits increasing. With the assumed initial values forthe parameters of the multiplier and the postulated$1 billion increase in the monetary base, money plustime deposits would have increased by almost $4.8billion, almost twice as much as money.
To interpret the effects of this increase in moneyon the economy, it is necessary to analyze the in-crease in the supply of money compared to the de-mand for money to hold, and the supplies of anddemands for other assets. We postulated above thatmarket interest rates rose above the ceiling ratesbanks are permitted to pay on time deposits (cx-peeially CD’s). In such a situation the volume ofCD’s (quantity supplied) is any amount depositorswish at the ceiling rates. Since the yields on goodsubstitutes become more attractive than CD’s, thedemand for CD’s declines, resulting in a decline inthe outstanding volume of CD’s or a slowing in thegrowth rate. In other words, a change in the relativeyields on substitute assets causes a shift in the demandfor CD’s (negative), which causes a decline in thevolume.
D-Ls-i-nte-rnred-iat-ion
We noted above that total deposits of banks maydecline as a result of this “disintermediation” of timedeposits. This means that banks must contract theirassets, either loans or security holdings, as depositsdecline. An understanding of the actions of banks inthe face of a deposit drain and actions of those whowithdraw their deposits is important information inassessing the effects of the disintermediation causedby the interest rate ceilings.
To illustrate two possible effects of disintermedia-tion, we will use highly simplified examples and T-accounts (commercial bank balance sheets). AccountI shows the banking system in its initial conditionhaving total reserves (TR) = $25, required reserves(RR) = $25 and excess reserves (ER) = 0, secu-rity holds (5) = $100 and loans outstanding (L)= $175. Bank liabilities are demand deposits (DD)= $100 and time deposits (TD) = $200. We haveassumed that reserve requirements against demanddeposits are 15 per cent and reserve requirementsagainst time deposits are 5 per cent.
Page 17

FEDERAL RESERVE BANK OF ST. LOUIS
Account II shows the effect of a corporation re-ducing its holdings of time deposits by $20 and buy-ing $20 in securities from the banks, because of thehigher return available on the latter. The immediateeffect is that the ownership of the securities ischanged — the corporation directly holds the securi-ties instead of having a deposit in a bank whichowns the securities, hence the term “disintermedia-tion” — and the banks are left with $1 of excess re-serves. The banking system can create loans (or buysome securities), based on the dollar of excess re-serves, and increase demand deposits by a multipleof $1. In this simplified example, the effect of disin-termediation resulting from relatively low interestrate ceilings is potentially expansionary on total loans,even though total deposits decrease.
For the second example, a bank, in its usual roleas an intermediary, sells CD’s to a corporation whichwishes to invest short-term funds, With the proceedsof the sale of the CD’s, the bank lends to anothercorporation (less the amount the hank must hold asrequired reserves, of course). Another simplified ex-ample of the potential effects of disintermediation onthe banking system and total credit is illustrated inAccount III. For exposition, assume that the one-bank holding companies of commercial banks estab-lish subsidiaries for the purpose of buying and sellingcommercial paper.
For our example, assume the first corporation doesnot wish to renew $20 of its CD holdings when theyreach maturity, but rather, because of generally ris-ing short-term market interest rates, seeks a yield
Page 18
OCTOBER 1969
AccOUNT IllBanking System
- Assess - - Liobiflties
TR $25 DD - - - $100
~RR $24? TO 1801ER lc
S 100
L 155
Total $280 Total $280
ACCOUNT IVSubsidiary of One-Bank Holding Company
- Assets Liabilities
commercial Paper
commercial Paper held $20 oLtutonding
greater than the bank is permitted to pay. Our hypo-thetical subsidiary of the one-bank holding companycan offer to sell its own commercial paper (LO.U.’to the first corporation at competitive market interestrates (Account IV).
We assume the corporation buys the subsidiary’scommercial paper. As a result of their reduced de-posits the banks are forced to contract assets propor-tionately (as a first step in a partial analysis). Insteadof selling securities, as in our previous example, thebanks can contract loans outstanding by $20, a.~shown in Account III (as compared to Account I).The subsidiary can in turn use the proceeds of itssale of commercial paper to purchase the paper ofanother corporation which seeks to borrow short-termmoney, possibly a corporation which was having dif-ficulty getting a bank loan since bank assets andliabilities were contracting.
We find that the initial effect of the disintermedia-tion is that the total of bank loans plus commercialpaper debts of borrowing corporations is the same asthe initial amount of bank loans outstanding, andthat the total of time deposits plus commercial paperassets of lending corporations is the same as the initialamount of time deposits at banks. However, we alsofind that banks have acquired an additional $1 ofexcess reserves which they can lend and therebyincrease demand deposits.
In summary, both of the examples of the disinter-mediation of time deposi-ts caused by the intereslrate ceilings show that the same initial amount ofreserves in the banking system can, under certaincircumstances, support a larger amount of demanddeposits (and therefore money stock). In other

FEDERAL RESERVE BANK OF ST. LOUIS OCTOBER 1969
words, if the disintermediation means only that somefunds flow through channels which are not subject toreserve requirements and interest rate ceilings, theeffects of the relatively low interest rate ceilings oncommercial bank time deposits are potentially expan-sionary on total loans,
U,S. Government Deposits and Money
As previously discussed, the monetary base sum-marizes all of the actions of the Federal Reservewhich influence the money stock. However, the Treas-ury cannot be overlooked as an agency which caninfluence the money stock over at least short periods.In the money supply model, the influence of changesin the amount of Government deposits is reflected inmovements in the g-ratio (Government deposits di-vided by private demand deposits) in the monetarymultiplier.
In recent years the Government’s balances at com-mercial banks have fluctuated from $3 billion to $9billion within a few months time. Private demanddeposits averaged about $150 billion in mid-1969.The g-ratio is therefore quite small, ranging fromabout .02 to about .06, but frequently doubles or fallsby half over the course of a month or two.
Similar to the effect of changes in the t-ratio, in-creases in the g-ratio result in a fall in the multipliersince the ratio appears in the denominator. Usingagain the initial values we assumed for the base andmultiplier, we have:
1+.3 -. - -
M = .1(1 + 1.3 + .04)+.3 $75 billion = $182.6 billion
where .04 is the value of the g-ratio. These valuesimply that demand deposits (D) are about $140.5billion and Government deposits (G) are $5.6 billion,Now suppose that individuals and businesses paytaxes of $1 billion by writing checks which drawdown (D) to 8139.5 billion, and Government bal-ances rise to $6.6 billion. Assuming no change in timedeposits or currency held by the public and no changein the base, we would find that the g-ratio rises to047 (and the k- and t-ratios rise slightly) to give us:
1+302 . . -
M = .1 (1 + 1.309 + .o47 ±,3o2’~~~bilhon $181.6 billion
A similar example of the effects on the moneystock of an increase in Government deposits at com-mercial banks which is associated with a change intime deposits (people pay taxes by reducing theirsavings or holdings of CD’s) would be somewhatmore complicated. In the above example, taxes were
paid out of demand deposits, and the reserve ratio(r) was not changed, which implies that the dis-tribution of the increment in Government depositsamong reserve city, country and nonmember bankswas the same as the distribution of the $1 billionreduction in private demand deposits.
When taxes are paid out of time deposits, the r-ratio rises, since reserve requirements against Gov-ernment deposits are approximately three times thereserve requirements against time deposits. Thesemovements are very small, and any accompanyingreduction in the excess reserve ratio would attenuatethe effect. Nonetheless, the effect on money is a com-bination of small changes in the k-, r-, t-, and g-ratios.
Summary
The behavioral parameters of the money supplyframework presented here are the currency (k), re-serve (r), time deposit (t), and Government deposit
(g) ratios. The changes in these ratios reflect theactions of the Treasury, banks, and nonbank publicwhich influence the money stock. The k-ratio is de-termined by the public’s preferences for currencyversus demand deposits; the t-ratio reflects the inter-action of the banks’ supply of and the public’s de-mand for time deposits as compared to the supply ofand demand for demand deposits; and the g-ratio isdominated by changes in Government balances atcommercial banks. The r-ratio is the least volatile ofthe behavioral parameters, although it is influencedby the banks’ desired holdings of excess reserves andthe distribution of total deposits among all the sub-classes of deposits in the various classes of banks,which are subject to a large array of reserverequirements.
The main policy actions of the monetary authori-ties — open market operations, changes in reserve re-quirements, and administration of the discount win-dow — are summarized by the monetary base. Thegrowth of the base summarizes the influence of themonetary authorities’ defensive and dynamic actionson the growth of the money stock, regardless of theintent of these actions. The degree of accuracy thatcan be achieved by the monetary authorities in con-trolling the money stock is a function of their abilityto determine the monetary base, and to predict thenet influence of the public’s and banks’ behavior assummarized by changes in the money supplymultiplier.
This article is available as Reprint No. 46.
Page 19