Gday Australia, we are ProWriter Jordan Truchan Jessica Dillman Luke Lorenzetti Nakia Watson.

School Performance Plan for George Washington Elementary School 1 of 69
SY 2012-2013
School Performance PlanElementary Schools
022George Washington Elementary School
Amanda P. Rice, PrincipalTammie McIntire-Miller, Executive Director
Catherine Van Allen, Network Facilitator
PLEASE REFER TO THE SCHOOL PERFORMANCE PLAN IMPLEMENTATION GUIDE FORSTEP-BY-STEP INSTRUCTIONS, ADDITIONAL GUIDANCE, AND ITEM DEFINITIONS.

School Performance Plan for George Washington Elementary School 2 of 69
Your School’s Instructional Leadership Team
Name Position
Amanda P. Rice Principal
Nakia Jones Math Lead/5th grade teacher
Nicole Dictorick Literacy Lead
Deborah Jones 2nd grade Teacher /Advanced Learner Lead
Burnetta Simmons PK teacher team Leader/PK Early Childhood
Tamara Oliver Special Educator Resource teacherTeam Leader/Special Educator
Maisha Dorsey 5th grade teacher Extended Day Leader
Key Points of Contact at Your School
Position Name Email Contact
Professional Development Point of Contact/Monitor Nakia Jones [email protected]
New Teacher Mentor Coordinator Deborah Jones [email protected]
School Family Council Representative Nakia Jones [email protected]
Family and Community Engagement Representative Charlotte Watson [email protected]

School Performance Plan for George Washington Elementary School 3 of 69
Reflect on SY 2011-2012 School Performance Plan
Guidance: Complete these questions by reflecting with your Instructional Leadership Team, Executive Director and Network Facilitator prior to Step 1. Record your answers below.
1. What progress did you make toward meeting your SPP SY 2011-12 goals?According to Benchmark data, overall for Reading, Benchmark A to B there was 33.6% gain, Benchmark B to C 1.2% increase. Math Benchmark A to B there was a 18.5% increase and a 5.3% decrease from B to C.In summary, there was an overall increase in testing scores in the area of Reading due to teachers creating Action Plans that addressed deficiencies with individual students and with developing cooperative learning strategies for each class.
2. Were your strategies fully implemented, partially implemented, not implemented at all? Why?Yes our strategies were partially implemented because we did ongoing monitoring and conducted monthly professional development to ensure that all staff members were on task.
3. What evidence of actual impact did you see on instructional practice and/or student learning?Overall, our benchmark scores increased from A to B by 33.6%. Students are able to work cooperatively and complete project based learning assignments as directed by teachers. Students experiencing difficulties are receiving one on one assitance from teachers while other students work cooperatively.
Grade 4 is our greatest concern because benchmark scores decreased from A to B and increased by 6% from B to C.
4. What practices are in place that we are unable to link to increased student achievement?Mentoring Program (Pretty Ypung Thangs Girls Club and George Washington Gents with a concentration on the importance of academics), Basketball,Cheerleading, Robotics and STEP classes ( must attend the afterschool tutoring to attend), Paths to Pax, PBIS ( behaviorial management programs), , Perfectly Punctual ( Attendance), Afterschool Clubs, Fresh Fruit Program (Nutrition); Breakfast in the classroom (Nutrition).
5. If your school participated in the 2011-12 School Effectiveness Review (SER) process, how will that feedback influence your strategic planning for 2012-13?N/A

School Performance Plan for George Washington Elementary School 4 of 69
Step 1: Collect and Chart Data
Effect Data: Outcomes or Results
• State Test Data (MSA, HSA)• Stanford 10• District Benchmarks and End of Course Assessments• Formative Assessments (teacher developed assessments)• Diagnostic Assessments (RISE, STEP, DIBBELS, NWEA)• Attendance• Discipline/Suspension Data• Student Work (i.e. writing samples)• Grades & GPA• School Effectiveness Review (if applicable)• Climate Survey
ACCESS DATA LINK & THE RAPID RESPONSE TOOL DIRECTLY BY VISITING: https://ebs.bcps.k12.md.us/bcpss.html

School Performance Plan for George Washington Elementary School 5 of 69
School Demographics
08-09 09-10 10-11 11-12 12-13
Total Enrollment 247 251 244 273
% of Students by Subgroup
• African-American 218 86.9
• American Indian/Alaskan Native 0 0.0
• Asian/Pacific Islander 0 0.0
• Hispanic 0 1.1
• White 22 8.6
• Free and Reduced Meals (FARM) >95% 96.3
• English Language Learners (ELL) 0.7
• Students with Disabilities (SWD) >93% 13.1
% Mobility
% of Highly Qualified Teachers 84.6 94
% of Teachers with Less than Five Years of Experience 50%
Principal’s Years of Experience 1 2 3 15
Principal’s Tenure at the School 1 2 3 3
School Improvement Status No No No No
Attendance Data
08-09 09-10 10-11 11-12 12-13
All 96.6 96.34 94.26
% habitually truant > 20 days
% chronically absent < 5 days
School Performance Plan for George Washington Elementary School 6 of 69
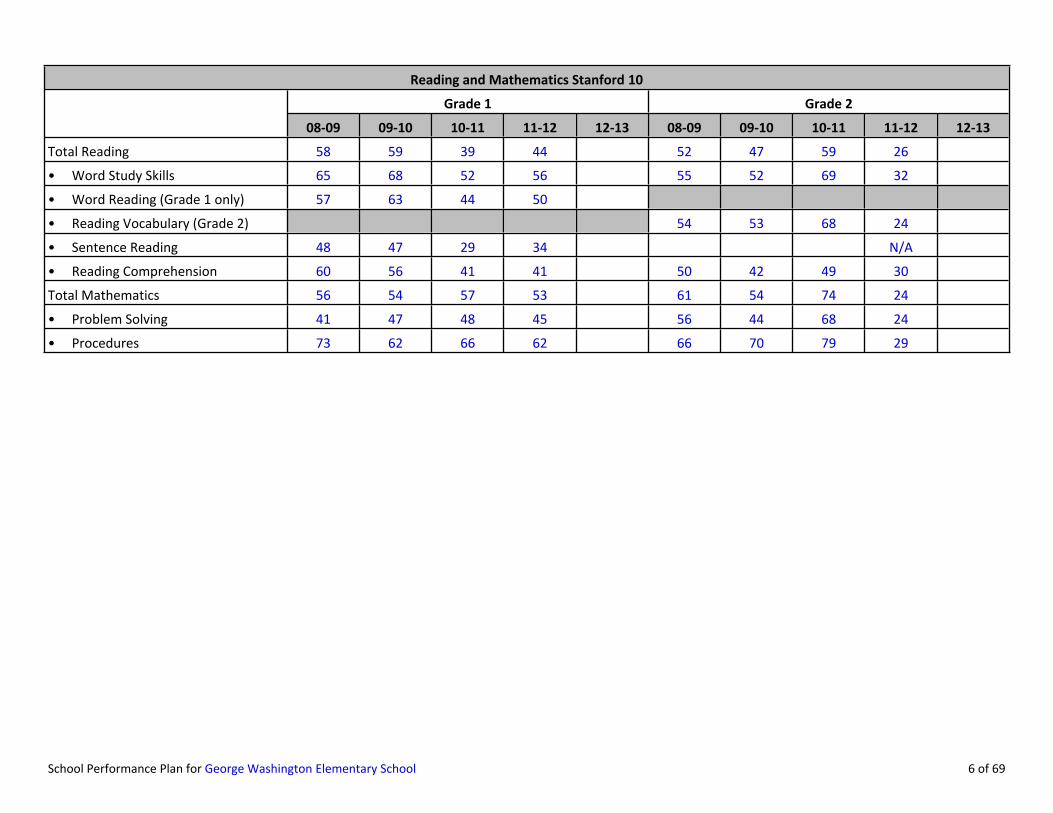
Reading and Mathematics Stanford 10
Grade 1 Grade 2
08-09 09-10 10-11 11-12 12-13 08-09 09-10 10-11 11-12 12-13
Total Reading 58 59 39 44 52 47 59 26
• Word Study Skills 65 68 52 56 55 52 69 32
• Word Reading (Grade 1 only) 57 63 44 50
• Reading Vocabulary (Grade 2) 54 53 68 24
• Sentence Reading 48 47 29 34 N/A
• Reading Comprehension 60 56 41 41 50 42 49 30
Total Mathematics 56 54 57 53 61 54 74 24
• Problem Solving 41 47 48 45 56 44 68 24
• Procedures 73 62 66 62 66 70 79 29

School Performance Plan for George Washington Elementary School 7 of 69
MSA Reading (% Proficient and Advanced)
Grade Grade 3 Grade 4 Grade 5
Year 08-09 09-10 10-11 11-12 12-13 08-09 09-10 10-11 11-12 12-13 08-09 09-10 10-11 11-12 12-13
All 72.2 65.8 76.7 74.4 70.4 67.6 72.2 71.9 71.8 70.4 76.9 81.6
Subgroups
Asian/Pacific Islander
African-American 72.2 66.7 76.9 74.3 69.6 66.7 71 69 68.6 69.6 77.1 81.8
American Indian/Alaskan Native
White 60 100 * 75 100 80 * 100 75 75 *
Hispanic NA 100
FARM 71.9 64.9 76.7 73.7 70.4 65.6 70.6 71.9 69.4 73.1 76.3 80.6
SWD 100.0 60.0 85.7 25.0 25.0 60.0 66.7 100.0 66.7

School Performance Plan for George Washington Elementary School 8 of 69
MSA Math (% Proficient and Advanced)
Grade Grade 3 Grade 4 Grade 5
Year 08-09 09-10 10-11 11-12 12-13 08-09 09-10 10-11 11-12 12-13 08-09 09-10 10-11 11-12 12-13
All 83.3 84.6 66.7 84.6 81.5 91.2 80.6 84.4 66.7 77.8 74.4 81.6
Subgroups
Asian/Pacific Islander
African-American 83.3 85.3 65.4 82.9 82.6 90.9 80.6 82.8 65.7 78.3 82.4 81.8
American Indian/Alaskan Native
White 80 66.7 * 75 100 80 * 66.7 75 25 *
Hispanic 100 100
FARM 84.4 84.2 66.7 84.2 81.5 90.6 79.4 84.4 63.9 80.8 75.7 80.6
SWD 50.0 80.0 85.7 25.0 25.0 60.0 33.3 50.0 50.0

School Performance Plan for George Washington Elementary School 9 of 69
MSA Science (% Proficient and Advanced)
Grade Grade 5
Year 08-09 09-10 10-11 11-12 12-13
All 17.9 37.9 33.3 23.7
Subgroups
Asian/Pacific Islander
African-American 17.1 33.3 35.3 24.2
American Indian/Alaskan Native
White 33.3 60 20
Hispanic
FARM 13.9 37 31.6 20
SWD 16.7 14.3

School Performance Plan for George Washington Elementary School 10 of 69
Charting Additional Effect Data Points
Guidance: Additional Effect Data should be charted in the Charting Additional Effect Data table below.
Gather and organize data in order to gain insights about teaching, learning, and leadership practices. Consider charting data that is disaggregated and triangulated.
Data PointWhat do the data tell you about trends in student achievement
and other aspects of your school performance?

School Performance Plan for George Washington Elementary School 11 of 69
Data PointWhat do the data tell you about trends in student achievement
and other aspects of your school performance?
Reading Grade 3 Overall - 86.1Highest percent proficient : Female 96%Lowest percent proficient: Male 71%Special Education: 50.0%
Reading Grade 4 Overall - 43.8%Highest percent proficient : Female 44%Lowest percent proficient: Male 41%Special Education: 42.9%
Reading Grade 5 Overall - 72.7%Highest percentage proficient: Male 75%Lowest percent proficient: Female 69.2%Special Education: 25.0%----------
Reading Benchmark Comparison
Data analysis shows that third grade reading scores decreased between Benchmark B and C by 3.5% due to the increase length and skills on benchmark C (the mock MSA). My data tells me that George Washington 3rd graders out performed the District by 29% and Network 02 by 27.2% in Reading Benchmark C.District: 57.1Network 2: 58.9George Washington: 86.1
Data analysis shows that fourth grade reading scores increased between Benchmark B and C by 13.8%My data tells me that Network 2 out performed George Washington's 4th graders by 18.9% and the District outperformed them by 9.7% on Reading Benchmark C.District: 53.5%Network 2: 62.7%George Washington: 43.8%
Data analysis shows that fifth grade reading scores increased between Benchmark B and C by 12.1%My data tells me that George Washington out performed the District by 14.5%and Network 2 by 6.8% on Reading Benchmark C.District: 58.2%Network 2: 65.9%George Washington: 72.7%

School Performance Plan for George Washington Elementary School 12 of 69
Data PointWhat do the data tell you about trends in student achievement
and other aspects of your school performance?
From the data above, we can see that females in grade 3 are generally more proficient in testing for Language Arts, scoring 25% higher than the males.
From the data above, we can see that females in grade 4 are generally more proficient in testing for Language Arts, scoring 03% higher than the males.
From the data above, we can see that males in grade 5 are generally more proficient in testing for Language Arts, scoring 5.8% higher than the females.
----------
Data analysis shows that overall in grades 3, 4, and 5 the females scored higher than the males according to Benchmark C data.
Grade 3, Benchmark C Language Arts:
StrengthsContext Clues and Main Idea 94%Inferences 94%Poetry 89.5%
WeaknessStory Elements 50%Text Features 11%
----------
From the data we can see that our area of improvement for 3rd grade will be story elements (50%) and text features (11%), and we will maintain our strengths through explicit teaching. Students did not refer to the text to accurately answer the story elements questions. Also, the text features questions on the benchmarks were misinterpreted.

School Performance Plan for George Washington Elementary School 13 of 69
Data PointWhat do the data tell you about trends in student achievement
and other aspects of your school performance?
Grade 4, Benchmark C, Language Arts
StrengthsContext Clues 100%Main Idea 81.5%
WeaknessDirectly Stated 58%Setting and Mood 54%
----------
From the data we can see that our area of improvement for 4th grade will be directly stated (58%) and setting/mood (54%), and we will maintain our strengths through explicit teaching.
Grade 5, Benchmark C, Language Arts:
StrengthsAuthor's Purpose 100%Text Features 83%
WeaknessFigurative Language 56%Text Structures 33%----------
From the data we can see that our area of improvement for 5th grade will be figurative language (56%) and text structures (33%) and we will maintain our strengths through explicit teaching. Along with explicit teaching, teacher will teach multiple text structures at one time so students can compare and contrast them.
School Performance Plan for George Washington Elementary School 14 of 69
Data PointWhat do the data tell you about trends in student achievement
and other aspects of your school performance?
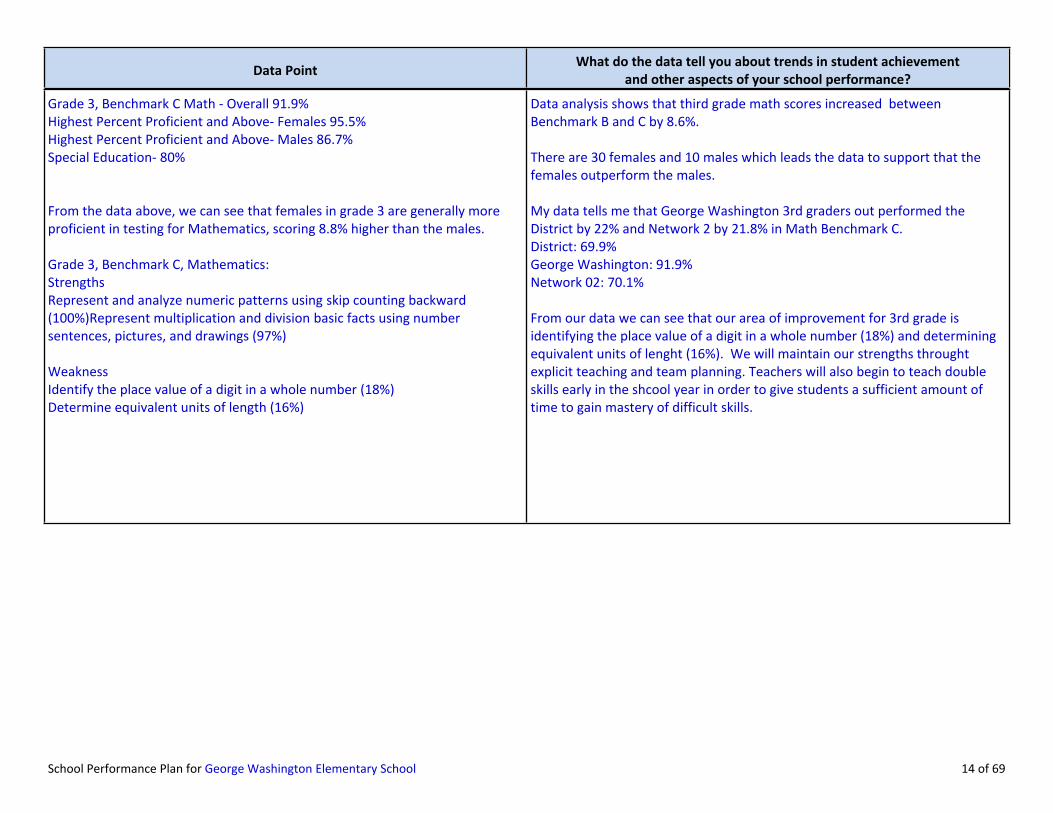
Grade 3, Benchmark C Math - Overall 91.9%Highest Percent Proficient and Above- Females 95.5%Highest Percent Proficient and Above- Males 86.7%Special Education- 80%
From the data above, we can see that females in grade 3 are generally more proficient in testing for Mathematics, scoring 8.8% higher than the males.
Grade 3, Benchmark C, Mathematics:StrengthsRepresent and analyze numeric patterns using skip counting backward (100%)Represent multiplication and division basic facts using number sentences, pictures, and drawings (97%)
WeaknessIdentify the place value of a digit in a whole number (18%)Determine equivalent units of length (16%)
----------
Data analysis shows that third grade math scores increased between Benchmark B and C by 8.6%.
There are 30 females and 10 males which leads the data to support that the females outperform the males.
My data tells me that George Washington 3rd graders out performed the District by 22% and Network 2 by 21.8% in Math Benchmark C.District: 69.9%George Washington: 91.9%Network 02: 70.1%
From our data we can see that our area of improvement for 3rd grade is identifying the place value of a digit in a whole number (18%) and determining equivalent units of lenght (16%). We will maintain our strengths throught explicit teaching and team planning. Teachers will also begin to teach double skills early in the shcool year in order to give students a sufficient amount of time to gain mastery of difficult skills.

School Performance Plan for George Washington Elementary School 15 of 69
Data PointWhat do the data tell you about trends in student achievement
and other aspects of your school performance?
Grade 4, Benchmark C Math - Overall 56.3%Highest Percent Proficient and Above- Male 62.5%Highest Percent Proficient and Above- Female 50.0%Special Education- 28.6%
From the data above, we can see that Males in grade 4 are generally more proficient in testing for Mathematics, scoring 12.5% higher than the females.
Grade 4, Benchmark C, Mathematics:StengthsGenerate a rule for the next level of the growing pattern (97%)Read, write, and represent proper fractions of a set which has the same number of items as the denominator using symbols, words, and models (97%)
WeaknessDetermine area (15%)Interpret line graphs (9%)
----------
Data analysis shows that fourth grade math scores increased between Benchmark B and C by 9.6%
My data tells me that overall George Washington 4th graders out performed the District by 7% and Network 2 by 9% in Math Benchmark C.District: 55.6%George Washington: 56.3%Network 02: 55.4%
From the data we can see that our area of improvement for 4th grade is determining area (15%) and interpreting line graphs(9%). We will maintain our strengths through explicit teaching and team planning and doubling up on skills to be taught.

School Performance Plan for George Washington Elementary School 16 of 69
Data PointWhat do the data tell you about trends in student achievement
and other aspects of your school performance?
Grade 5, Benchmark C Math - Overall 64.7%Highest Percent Proficient and Above- Female 69.2%Highest Percent Proficient and Above- Males 61.9%Special Education- 25%
From the data above we can see that the Females in grade 5 are generally more proficient in testing for Mathematics, scoring 7.3% higher than the males
Grade 5, Benchmark C, Mathematics:StrengthsIdentify and determine equivalent forms of proper fractions (95%)Read, write, and represent fractions or mixed numbers using symbols, models, and words (92%)
WeaknessIdentify and describe the results of translations, reflections, and rotations of geometric figures (16%)Identify and classify pyramids and prisms by the base (11%)
----------
Data analysis shows that fifth grade math scores decreased between Benchmark B and C by 19.7%. More new skills were introduced between Benchmark B and C. This shows a need to double up on skills early in the school year.
Special education population is 5 students. 1 student passed Math Benchmark C.
Data analysis shows that overall George Washington 5th graders out performed the District by 10.4% and Network 2 by 5.7% in Math Benchmark C.District: 54.3%George Washington: 64.7%Network 02: 59.0%
From the data we can see that our area of improvement for 5th grade is identifying and describing the results of translations, reflections, and rotations of geometric figures (16%) and Identifying and classifying pyramids and prisms by the base (11%). We will maintain our strengths through explicit teaching and team planning.
School Performance Plan for George Washington Elementary School 17 of 69
Data PointWhat do the data tell you about trends in student achievement
and other aspects of your school performance?
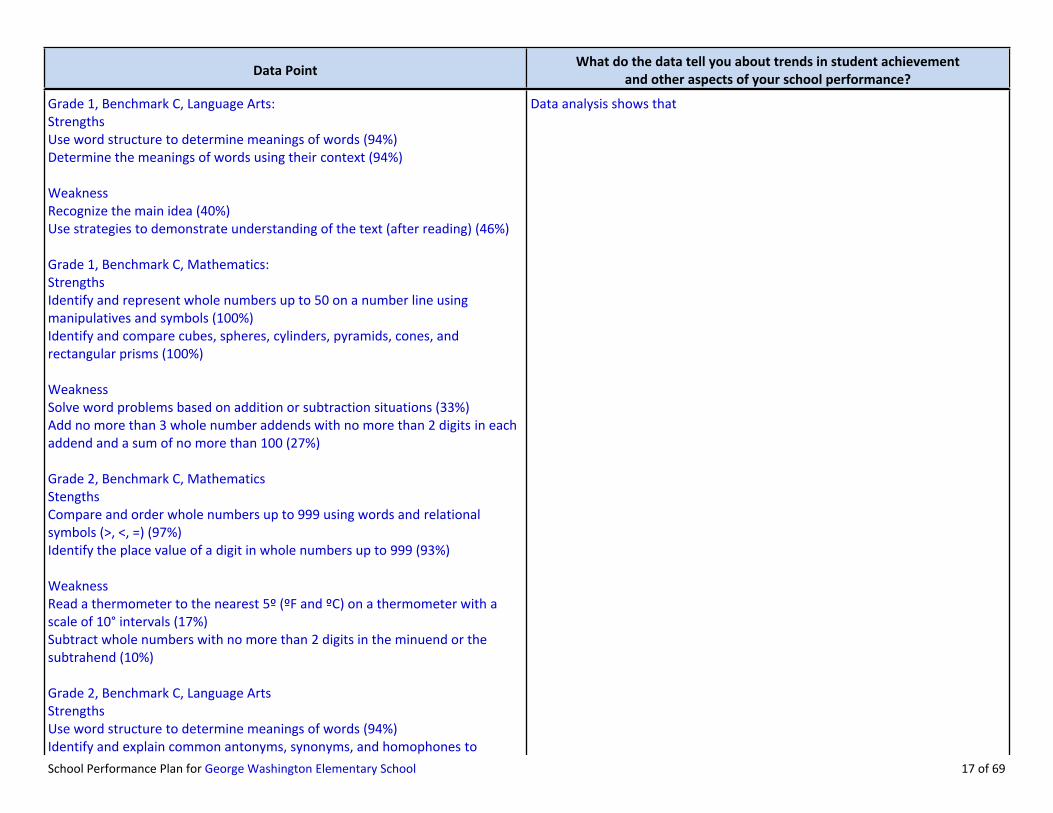
Grade 1, Benchmark C, Language Arts:StrengthsUse word structure to determine meanings of words (94%)Determine the meanings of words using their context (94%)
WeaknessRecognize the main idea (40%)Use strategies to demonstrate understanding of the text (after reading) (46%)
Grade 1, Benchmark C, Mathematics:StrengthsIdentify and represent whole numbers up to 50 on a number line using manipulatives and symbols (100%)Identify and compare cubes, spheres, cylinders, pyramids, cones, and rectangular prisms (100%)
WeaknessSolve word problems based on addition or subtraction situations (33%)Add no more than 3 whole number addends with no more than 2 digits in each addend and a sum of no more than 100 (27%)
Grade 2, Benchmark C, MathematicsStengthsCompare and order whole numbers up to 999 using words and relational symbols (>, <, =) (97%)Identify the place value of a digit in whole numbers up to 999 (93%)
WeaknessRead a thermometer to the nearest 5º (ºF and ºC) on a thermometer with a scale of 10° intervals (17%)Subtract whole numbers with no more than 2 digits in the minuend or the subtrahend (10%)
Grade 2, Benchmark C, Language ArtsStrengthsUse word structure to determine meanings of words (94%)Identify and explain common antonyms, synonyms, and homophones to increase vocabulary skills (90%)
WeaknessRecognize cause/effect relationships (10%)Recognize sequential and chronological order (10%)
Grade KGrade Pre KComparing Measures on mClass Reading Text, Reading and COmprehension (TRC)
Comparing Classes on mClass Reading by Teachers and Grade Levels at BOYGrade K BOY:MOY:Grade 1 BOY:Grade 2 BOY:Grade 3:Grade 4Grade 5:
----------
Data analysis shows that

School Performance Plan for George Washington Elementary School 18 of 69
Data PointWhat do the data tell you about trends in student achievement
and other aspects of your school performance?
Teacher Effectiveness Data: Impact on InstructionSchool Profile: 7 new teachers (less than 3 years); 1 non-tenured teacherTeacher Attendance: 85%Collobrative Planning/Long-range planning: Partially ImplementedData Analysis: Partially ImplementedExplicit Instruction: Little EvidenceDifferention of Instruction: Little EvidenceCooperative Learning: Little EvidenceDistrict Professional Development: 100 % attendance; 70 % transfer of knowledge and skillsClassroom Climate: PATHS/PAX and PBIS utilized school wide, GreatKids Program with Officer CovingtonRigor; Engagement, Intervention: Partially ImplementedInstructional Framework: Developing----------
Data analysis shows:
Para professional had chronic absenteism.
Based upon formal and informal classroom observations teachers were observed implementing best practices recevied during professional development.

School Performance Plan for George Washington Elementary School 19 of 69
Annual Measurable Objectives
Objective #1:
Grade 3Between June 2012 and June 2013, the proficient rate on the Reading portion of the Maryland School Assessment will increase a minimum of 10 percentage points for all students from the previous year from 74.4% to %; African-American students from 74.3% to %; White students from *% to %; Hispanic students from % to %; LEP students from % to %; Special Education students from % to % and FARM students from 73.7% to %.
Grade 4Between June 2012 and June 2013, the proficient rate on the Reading portion of the Maryland School Assessment will increase a minimum of 10 percentage points for all students from the previous year from 71.9% to %; African-American students from 69% to %; White students from *% to %; Hispanic students from % to %; LEP students from % to %; Special Education students from % to % and FARM students from 71.9% to %.
Grade 5Between June 2012 and June 2013, the proficient rate on the Reading portion of the Maryland School Assessment will increase a minimum of 10 percentage points for all students from the previous year from 81.6% to %; African-American students from 81.8% to %; White students from *% to %; Hispanic students from % to %; LEP students from % to %; Special Education students from % to % and FARM students from 80.6% to %.
Objective #2:
Grade 3Between June 2012 and June 2013, the proficient rate on the Mathematics portion of the Maryland School Assessment will increase a minimum of 10 percentage points for all students from the previous year from 84.6% to %; African-American students from 82.9% to %; White students from *% to %; Hispanic students from % to %; LEP students from % to %; Special Education students from % to % and FARM students from 84.2% to %.
Grade 4Between June 2012 and June 2013, the proficient rate on the Mathematics portion of the Maryland School Assessment will increase a minimum of 10 percentage points for all students from the previous year from 84.4% to %; African-American students from 82.8% to %; White students from *% to %; Hispanic students from % to %; LEP students from % to %; Special Education students from % to % and FARM students from 84.4% to %.
Grade 5Between June 2012 and June 2013, the proficient rate on the Mathematics portion of the Maryland School Assessment will increase a minimum of 10 percentage points for all students from the previous year from 81.6% to %; African-American students from 81.8% to %; White students from *% to %; Hispanic students from % to %; LEP students from % to %; Special Education students from % to % and FARM students from 80.6% to %.
School Performance Plan for George Washington Elementary School 20 of 69
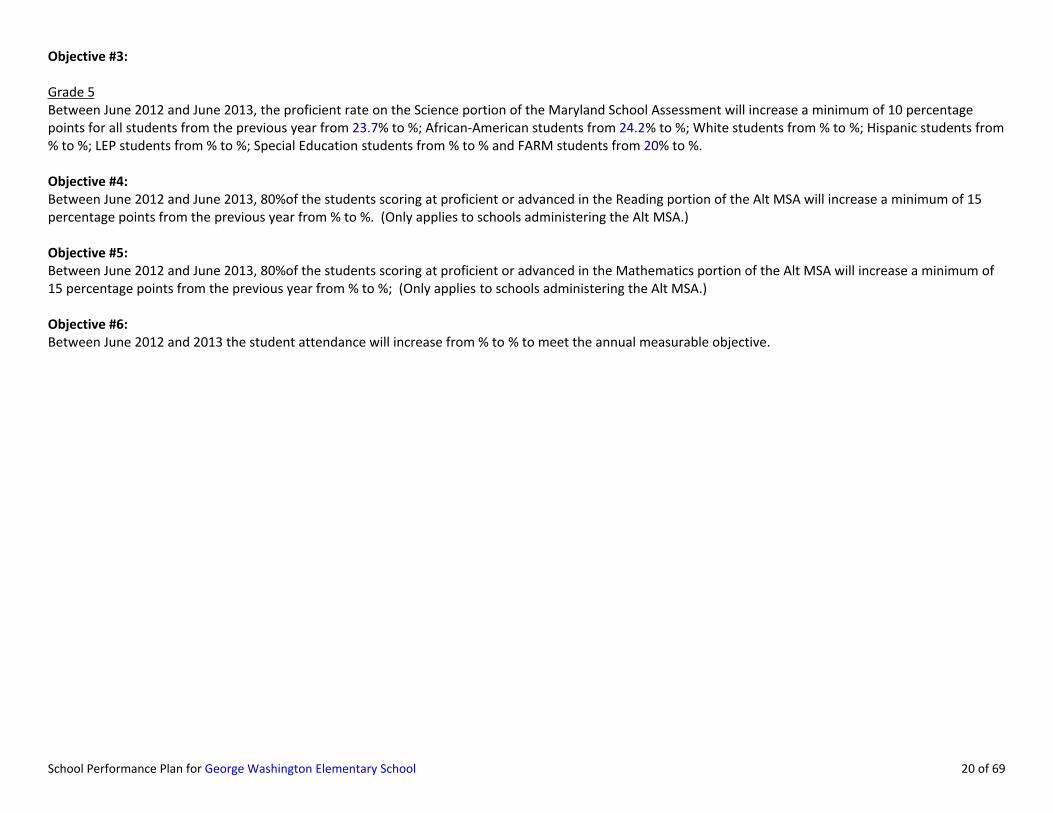
Objective #3:
Grade 5Between June 2012 and June 2013, the proficient rate on the Science portion of the Maryland School Assessment will increase a minimum of 10 percentage points for all students from the previous year from 23.7% to %; African-American students from 24.2% to %; White students from % to %; Hispanic students from % to %; LEP students from % to %; Special Education students from % to % and FARM students from 20% to %.
Objective #4:Between June 2012 and June 2013, 80%of the students scoring at proficient or advanced in the Reading portion of the Alt MSA will increase a minimum of 15 percentage points from the previous year from % to %. (Only applies to schools administering the Alt MSA.)
Objective #5:Between June 2012 and June 2013, 80%of the students scoring at proficient or advanced in the Mathematics portion of the Alt MSA will increase a minimum of 15 percentage points from the previous year from % to %; (Only applies to schools administering the Alt MSA.)
Objective #6:Between June 2012 and 2013 the student attendance will increase from % to % to meet the annual measurable objective.
School Performance Plan for George Washington Elementary School 21 of 69
Step 2: Analyze Data to Prioritize Needs
Guidance: Complete these questions by meeting with your Instructional Leadership Team, School Family Council, Executive Director, and Network Facilitator to begin the development of your school’s 2012-13 School Performance Plan. Record your answers below.
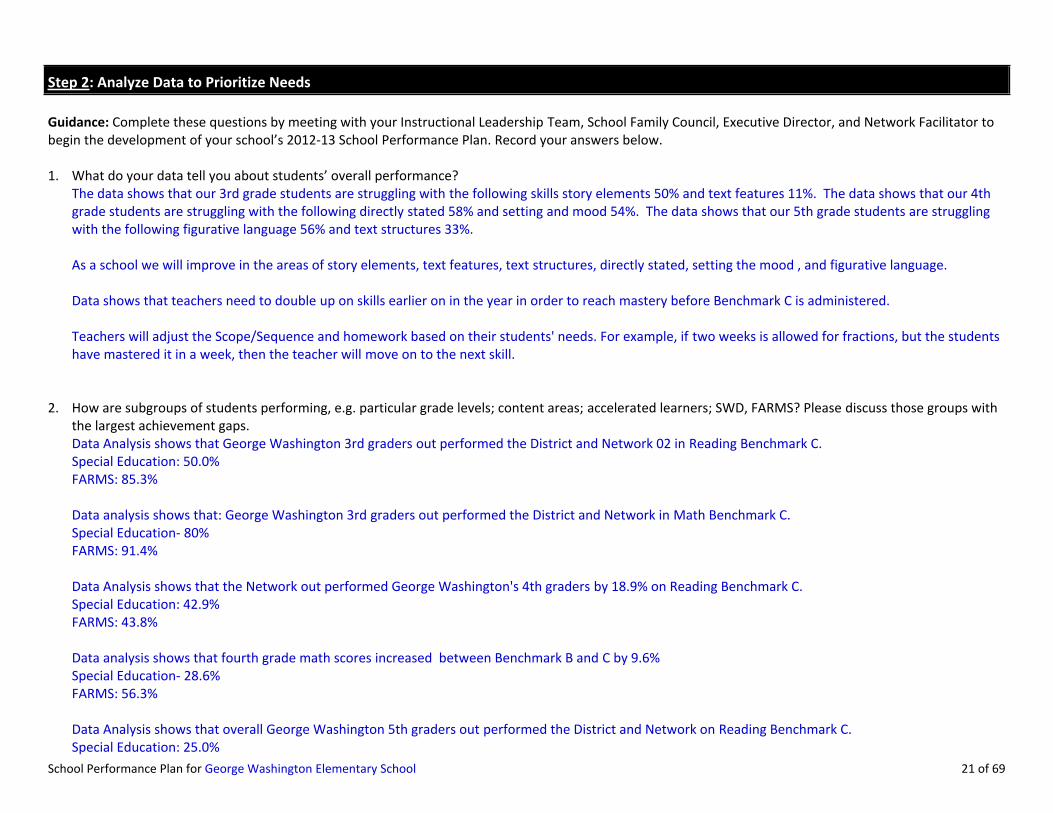
1. What do your data tell you about students’ overall performance?The data shows that our 3rd grade students are struggling with the following skills story elements 50% and text features 11%. The data shows that our 4th grade students are struggling with the following directly stated 58% and setting and mood 54%. The data shows that our 5th grade students are struggling with the following figurative language 56% and text structures 33%.
As a school we will improve in the areas of story elements, text features, text structures, directly stated, setting the mood , and figurative language.
Data shows that teachers need to double up on skills earlier on in the year in order to reach mastery before Benchmark C is administered.
Teachers will adjust the Scope/Sequence and homework based on their students' needs. For example, if two weeks is allowed for fractions, but the students have mastered it in a week, then the teacher will move on to the next skill.
2. How are subgroups of students performing, e.g. particular grade levels; content areas; accelerated learners; SWD, FARMS? Please discuss those groups with the largest achievement gaps.Data Analysis shows that George Washington 3rd graders out performed the District and Network 02 in Reading Benchmark C.Special Education: 50.0%FARMS: 85.3%
Data analysis shows that: George Washington 3rd graders out performed the District and Network in Math Benchmark C.Special Education- 80%FARMS: 91.4%
Data Analysis shows that the Network out performed George Washington's 4th graders by 18.9% on Reading Benchmark C.Special Education: 42.9%FARMS: 43.8%
Data analysis shows that fourth grade math scores increased between Benchmark B and C by 9.6%Special Education- 28.6%FARMS: 56.3%
Data Analysis shows that overall George Washington 5th graders out performed the District and Network on Reading Benchmark C.Special Education: 25.0%

School Performance Plan for George Washington Elementary School 22 of 69
FARMS: 71%
Data analysis shows that overall George Washington 5th graders out performed the District and Network in Math Benchmark C.Special Education- 25%FARMS: 65.6%
The above data shows that overall the SWD subgroup is performing below 50 % in the areas of Reading and Mathematics. This subgroup shows the largest gap in performance.
3. How did my teachers perform (test results by grade level, teacher/class, subject area/and subgroup. e.g. SWD)?The data shows us that teachers are having difficulty with delievering explicit instruction in the following areas:
Skill is needed in this area as we move towards the CCSS.
Test Results by Grade Level, Teacher/Class, Subject Area/and SubGroup.e.g. SWD)Grade #:3Total ProficientDoctorick/LA: 86.1%Kennedy/MATH: 92%Grade 3 out performed the Network by 29% in Reading and 22% Math
Grade #4Total ProficientMoran/MATH: 56.3 %Snowden/LA: 43.8%Grade 4 performed lower than the Network in Reading by 9.7% and higher than the network by 0.7% in Math
Grade 5Total ProficientN. Jones Math: 64.7%Dorsey/LA: 72.7%Grade 5 out performed the Network by 14.5% in Reading and 10.4% in Math.
Subgroups:Reading Grade 3 Benchmark C: Math Grade 3 Benchmark C:SWD: 50% 80%

School Performance Plan for George Washington Elementary School 23 of 69
Males: 71.4% 86.7%Females: 95.5% 95.5%FARMS: 85.3% 91.4%LEP: N/A N/A
Reading Grade 4 Benchmark C: Math Grade 4 Benchmark C:SWD: 42.9% 28.6%Males: 43.8% 62.5%Females: 43.8% 50%FARMS: 43.8% 56.3%LEP: N/A N/A
Reading Grade 5 Benchmark C: Math Grade 5 Benchmark C:SWD: 25% 25%Males: 75% 61.9%Females: 69.2% 69.2%FARMS: 71% 65.6%LEP: N/A N/A
Guidance: Based on the answers to the questions above, generate a list of school strengths and needs, and record them below. Consider the contributing factors and identify the sources of data that demonstrate these trends, and record them below.
Limit your Strengths and Needs to the three most important.
Examples of Cause Data (Contributing Factors): Professional Practices that Create Effects or Results
• Use of teacher collaborative planning time• Implementation of effective professional development strategies• Research-based classroom instructional strategies• Classroom visits • Teacher feedback• Professional Learning Communities• Other:
Strengths Contributing Factors Data Source
School Performance Plan for George Washington Elementary School 24 of 69
Strengths Contributing Factors Data Source
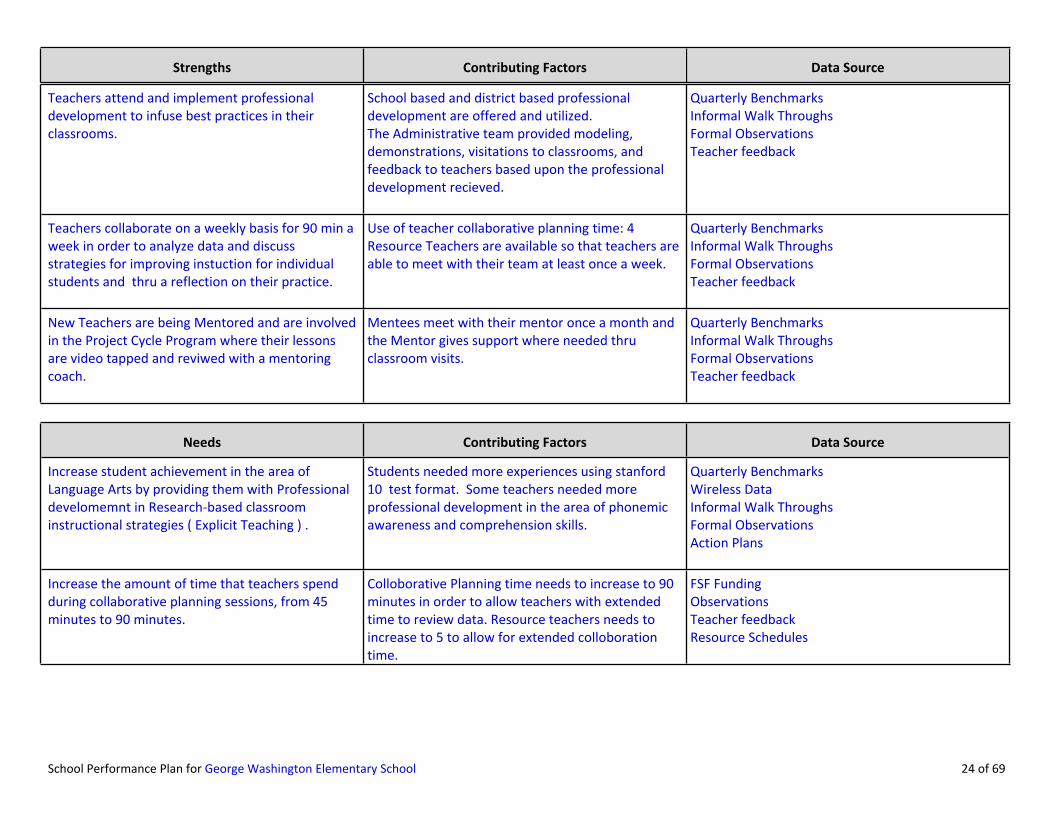
Teachers attend and implement professional development to infuse best practices in their classrooms.----------
School based and district based professional development are offered and utilized.The Administrative team provided modeling, demonstrations, visitations to classrooms, and feedback to teachers based upon the professional development recieved.
Quarterly BenchmarksInformal Walk ThroughsFormal ObservationsTeacher feedback
Teachers collaborate on a weekly basis for 90 min a week in order to analyze data and discuss strategies for improving instuction for individual students and thru a reflection on their practice.----------
Use of teacher collaborative planning time: 4 Resource Teachers are available so that teachers are able to meet with their team at least once a week.
Quarterly BenchmarksInformal Walk ThroughsFormal ObservationsTeacher feedback
New Teachers are being Mentored and are involved in the Project Cycle Program where their lessons are video tapped and reviwed with a mentoring coach. ----------
Mentees meet with their mentor once a month and the Mentor gives support where needed thru classroom visits.
Quarterly BenchmarksInformal Walk ThroughsFormal ObservationsTeacher feedback
Needs Contributing Factors Data Source
Increase student achievement in the area of Language Arts by providing them with Professional develomemnt in Research-based classroom instructional strategies ( Explicit Teaching ) .----------
Students needed more experiences using stanford 10 test format. Some teachers needed more professional development in the area of phonemic awareness and comprehension skills.
Quarterly BenchmarksWireless DataInformal Walk ThroughsFormal ObservationsAction Plans
Increase the amount of time that teachers spend during collaborative planning sessions, from 45 minutes to 90 minutes.----------
Colloborative Planning time needs to increase to 90 minutes in order to allow teachers with extended time to review data. Resource teachers needs to increase to 5 to allow for extended colloboration time.
FSF FundingObservationsTeacher feedbackResource Schedules

School Performance Plan for George Washington Elementary School 25 of 69
Needs Contributing Factors Data Source
Increase student achievement amongst the SWD subgroup.----------
Teachers need to review SWD data with the special educators and develop action plans to meet the needs of the individual students.Teachers failure to adequately address the needs of SWD scoring basic on benchmarks and formative tests. The expectation from teachers is low for these students.
Quarterly BenchmarksWireless DataInformal Walk ThroughsFormal ObservationsAction PlansKurzweil program to assit students with Reading texts and comprehension skills
School Performance Plan for George Washington Elementary School 26 of 69
Step 3: Establish SMART Goals and Step 4: Select Strategies
Guidance: Identify your three most critical goals for student achievement based on needs that were identified through the inquiry process. Be sure your goals are Specific, Measurable, Achievable, Relevant, and Timely (SMART).
Then, for each goal, identify specific strategies that support: Highly Effective Instruction or Climate; Professional Development; and Engaged Family and Community. Strategies should be action-oriented, measurable, and research-based. Your school should focus on two Highly Effective Instruction strategies and one Climate strategy. There may be multiple components of a strategy noted within each category. More than one Professional Development strategy may be selected by the dropdown menu.
Please refer to the SPP Implementation Guide for additional guidance on completing this section.
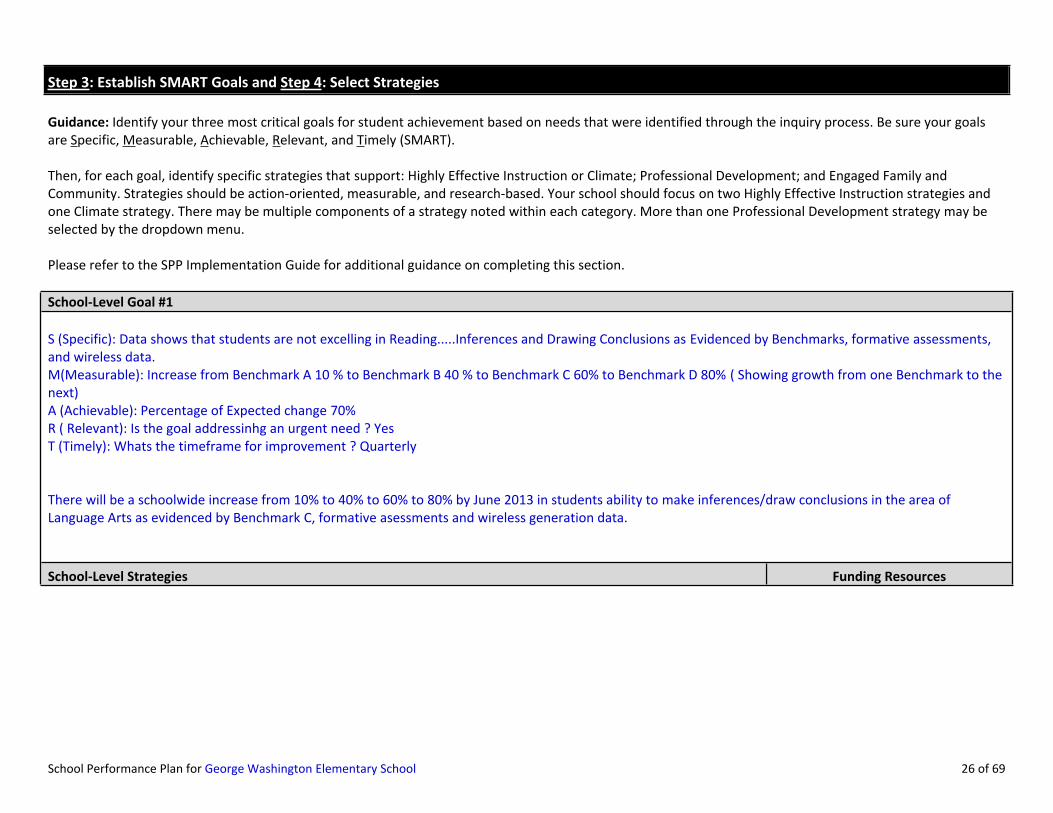
School-Level Goal #1
S (Specific): Data shows that students are not excelling in Reading.....Inferences and Drawing Conclusions as Evidenced by Benchmarks, formative assessments, and wireless data.M(Measurable): Increase from Benchmark A 10 % to Benchmark B 40 % to Benchmark C 60% to Benchmark D 80% ( Showing growth from one Benchmark to the next)A (Achievable): Percentage of Expected change 70%R ( Relevant): Is the goal addressinhg an urgent need ? YesT (Timely): Whats the timeframe for improvement ? Quarterly
There will be a schoolwide increase from 10% to 40% to 60% to 80% by June 2013 in students ability to make inferences/draw conclusions in the area of Language Arts as evidenced by Benchmark C, formative asessments and wireless generation data.
School-Level Strategies Funding Resources

School Performance Plan for George Washington Elementary School 27 of 69
High Yield Instructional Strategy:
Our High Yield strategy for the entire school yearwill be Explicit Teaching which will impact achievement of all goals. The year long strategy will be:
Explicit Teaching ( I Do; We Do ; You Do)
Literacy Coach will assist with implementation of Explicit Teaching and will provide Professional Development on Explicit Teaching for staff each month.
General Funds
General Funds
Title I Schoolwide 46800
Cycle of Professional Learning (REQUIRED): Please see attached Cycle of Professional LearningCommon Core OPT in school for Reading for Common Core: Quarterly throughout 4 cycles
Explicit Teaching Cycle I & 2Cooperative Learning Cycle 1
Professional Development Strategy:
District-Sponsored Systemic Professional Development;Teachers will be provided with school based professional development on an ongoing basis along with district provided professional development; complete article studeis on Explicit teaching strategies; Read/ Write PD; The Works; Common Core Opt-In School for Reading .Engaged Family and Community Strategy:Family Reading Circle ( Families gather together for 6 weeks to read selected books together at the school and share a meal together during the process).Quarterly workshops for parents and students to provide instructional strategies to improve reading skills.Families will participate in monthly PTA meetings that have a focus on increasing literacy in the home.Parents will participate in Book Reading campaign with their children weekly and they will record the results on a book chart.

School Performance Plan for George Washington Elementary School 28 of 69
School-Level Goal #2S (Specific): Data shows that students are not excelling in Math in the area of Word Problems as evidenced by Benchmarks, formative assessments, and wireless data.M(Measurable): Increase from Benchmark A 10% to Benchmark B 40% to Benchmark C 60% to Benchmark D 80% ( Showing growth from one Benchmark to the next)A (Achievable): Percentage of Expected change? 70%R ( Relevant): Is the goal addressing an urgent need ? YesT (Timely): Whats the timeframe for improvement ? Quarterly
By June 2013 students will increase profiency in responses to word problems by 10% to 40% to 60% to 80% in the area of Mathematics as measured by Benchmark C and formative assessements.
School-Level Strategies Funding Resources
High Yield Instructional Strategy:Our High Yield strategies will include the following :
Explicit TeachingRigor in the Classroom
General Funds
Cycle of Professional Learning (REQUIRED): Please attach the Cycle of Professional learning.OPT in school for Reading for Common Core: Quarterly throughout 4 cycles
Explicit Teaching
Professional Development Strategy:
District-Sponsored Systemic Professional Development;

School Performance Plan for George Washington Elementary School 29 of 69
OPT in school for Math and Reading for common coreSchool based Professional development (Marzano's High Yield Strategies)First in MathDO the MathMath WorksTeacher Assisted Instruction (TAI)
Engaged Family and Community Strategy:Family Math NightQuarterly Family Meetings that discuss how to assist students with MathBack to School NightRobotics Contest ( Math and Science skills utilized)PTA Meetings held monthly to discuss Math initiativesNewsletters from teachers with methods of helping students at home with math and word problems.Daily writing responses in math journal.Parent Link

School Performance Plan for George Washington Elementary School 30 of 69
School-Level Goal #3
S (Specific): Data shows that students are not excelling in Math in the area of Writing as evidenced by Benchmarks, formative assessments, and wireless data.M(Measurable): Increase from Benchmark A 10% to Benchmark B 40% to Benchmark C 60% to Benchmark D 80% ( Showing growth from one Benchmark to the next)A (Achievable): Percentage of Expected change? 70%R ( Relevant): Is the goal addressing an urgent need ? YesT (Timely): Whats the timeframe for improvement ? Quarterly
Students will increase their writing skills with the use of the writing process and writing rubrics from 10% to 40% to 60% to 80% by completing daily journaling assignments and a monthly schoolwide writing project.
School-Level Strategies Funding Resources
High Yield Instructional Strategy:
Explicit Teaching( Gradual release. I do-we do-you do)
General Funds
Cycle of Professional Learning (REQUIRED): Please attach the Cycle of Professional learning.OPT in school for Reading for Common Core: Quarterly throughout 4 cycles
Summarizing and Note Taking (Marzano's High Yield Instructional Strategy)
Professional Development Strategy:
Collaborative Planning;Teachers meet together for 90 minute blocks each week by grade levels PK-2 and by content in grades 3-5 to discuss student progress by examining data ; explicit teaching strategies ; lesson exemplars; and other pertinent data related to student progress.Teachers will meet monthly for staff meetings that will focus on the Instructional strategy of Explicit Teaching.

School Performance Plan for George Washington Elementary School 31 of 69
Engaged Family and Community Strategy:
Monthly Family Meeting on Writing skillsDramatic Reading ContestIf I were the Mayor ContestReading the most boks chalenge for families and studentsNewslettersGlobal Connect
School Performance Plan for George Washington Elementary School 32 of 69
What strategies will your school use to support new teachers? Funding Resources
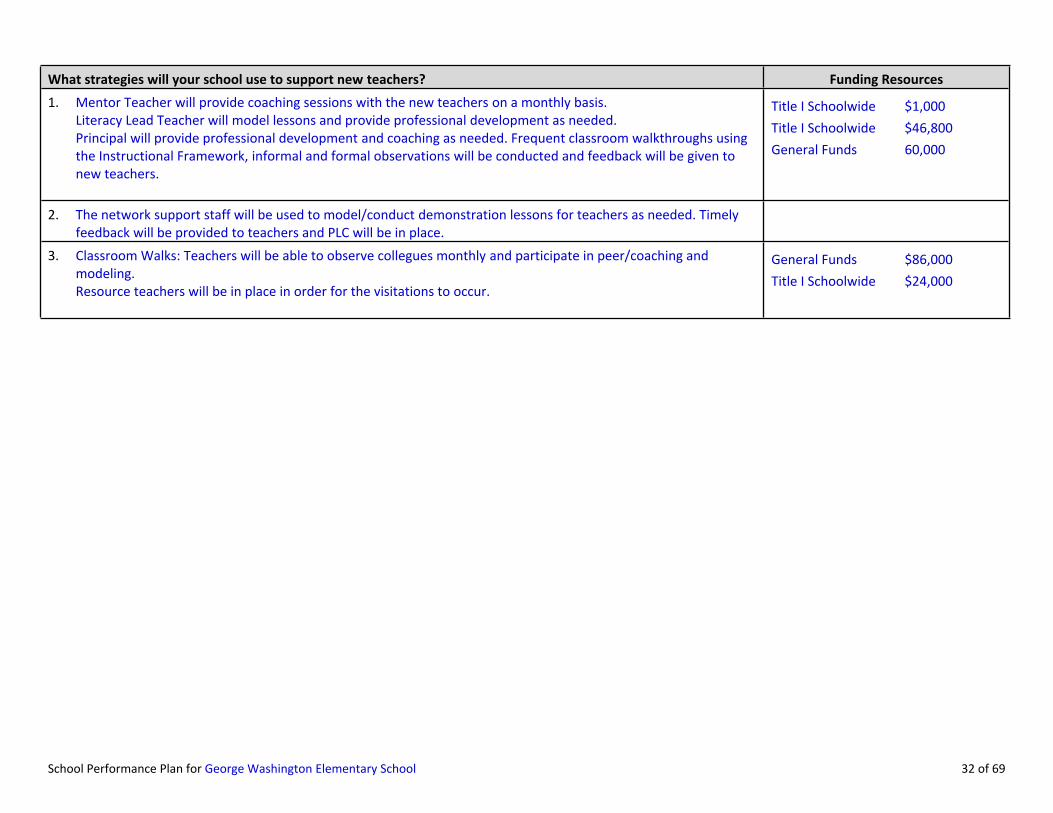
1. Mentor Teacher will provide coaching sessions with the new teachers on a monthly basis.Literacy Lead Teacher will model lessons and provide professional development as needed.Principal will provide professional development and coaching as needed. Frequent classroom walkthroughs using the Instructional Framework, informal and formal observations will be conducted and feedback will be given to new teachers.
Title I Schoolwide $1,000
Title I Schoolwide $46,800
General Funds 60,000
2. The network support staff will be used to model/conduct demonstration lessons for teachers as needed. Timely feedback will be provided to teachers and PLC will be in place.
3. Classroom Walks: Teachers will be able to observe collegues monthly and participate in peer/coaching and modeling.Resource teachers will be in place in order for the visitations to occur.
General Funds $86,000
Title I Schoolwide $24,000

School Performance Plan for George Washington Elementary School 33 of 69
Step 5: Determine Results Indicators
Results Indicator Statements: Results Indicators describe:
• What to look for in monitoring the implementation of the strategy; and• What relationships can be established between strategies and outcome data.
Your ILT should identify results indicators for each of the three strategies connected to each school-level goal.
(NOTE: The 3 primary strategies identified below will pre-populate here: Highly Effective Inst./Climate, Professional Development, and Engaged Fam and Comm.)
School-Level Goal #1
S (Specific): Data shows that students are not excelling in Reading.....Inferences and Drawing Conclusions as Evidenced by Benchmarks, formative assessments, and wireless data.M(Measurable): Increase from Benchmark A 10 % to Benchmark B 40 % to Benchmark C 60% to Benchmark D 80% ( Showing growth from one Benchmark to the next)A (Achievable): Percentage of Expected change 70%R ( Relevant): Is the goal addressinhg an urgent need ? YesT (Timely): Whats the timeframe for improvement ? Quarterly
There will be a schoolwide increase from 10% to 40% to 60% to 80% by June 2013 in students ability to make inferences/draw conclusions in the area of Language Arts as evidenced by Benchmark C, formative asessments and wireless generation data.
School-Level Goal #1 Strategies Results Indicator Reporting Mechanism

School Performance Plan for George Washington Elementary School 34 of 69
School-Level Goal #1
S (Specific): Data shows that students are not excelling in Reading.....Inferences and Drawing Conclusions as Evidenced by Benchmarks, formative assessments, and wireless data.M(Measurable): Increase from Benchmark A 10 % to Benchmark B 40 % to Benchmark C 60% to Benchmark D 80% ( Showing growth from one Benchmark to the next)A (Achievable): Percentage of Expected change 70%R ( Relevant): Is the goal addressinhg an urgent need ? YesT (Timely): Whats the timeframe for improvement ? Quarterly
There will be a schoolwide increase from 10% to 40% to 60% to 80% by June 2013 in students ability to make inferences/draw conclusions in the area of Language Arts as evidenced by Benchmark C, formative asessments and wireless generation data.
School-Level Goal #1 Strategies Results Indicator Reporting Mechanism
Our High Yield strategy for the entire school yearwill be Explicit Teaching which will impact achievement of all goals. The year long strategy will be:
Explicit Teaching ( I Do; We Do ; You Do)
Literacy Coach will assist with implementation of Explicit Teaching and will provide Professional Development on Explicit Teaching for staff each month.
Implementation of the Explicit Teaching Model (I do, We do, You do) at faculty meetings and in colloborative planning sessions.Increase test scores my .Enhance accountable talk.Ensure Independent thinking by reading response journals, informal assessments, formal assessments, conferences.Increase critical thinking skillsIncrease of students scoring in the Proficient and Advanced categories by 10 %.
Lesson PlansFormal and Informal ObservationsTeacher Created Test Data utilizing Data linksBenchmark DataWireless Generation DataStudent Work SamplesObservation formsProgress Monitoring

School Performance Plan for George Washington Elementary School 35 of 69
School-Level Goal #1
S (Specific): Data shows that students are not excelling in Reading.....Inferences and Drawing Conclusions as Evidenced by Benchmarks, formative assessments, and wireless data.M(Measurable): Increase from Benchmark A 10 % to Benchmark B 40 % to Benchmark C 60% to Benchmark D 80% ( Showing growth from one Benchmark to the next)A (Achievable): Percentage of Expected change 70%R ( Relevant): Is the goal addressinhg an urgent need ? YesT (Timely): Whats the timeframe for improvement ? Quarterly
There will be a schoolwide increase from 10% to 40% to 60% to 80% by June 2013 in students ability to make inferences/draw conclusions in the area of Language Arts as evidenced by Benchmark C, formative asessments and wireless generation data.
School-Level Goal #1 Strategies Results Indicator Reporting Mechanism
Teachers will be provided with school based professional development on an ongoing basis along with district provided professional development; complete article studeis on Explicit teaching strategies; Read/ Write PD; The Works; Common Core Opt-In School for Reading .
Teachers will implement best practice strategies learned during professional development sessions and collaborative planning meetings.Improvement on test scores as shown with comprehension with a 10 % increase.
Formal and informal observations of teachers implementing strategies. Instructional Framework Feedback forms will reflect the best practices.Teacher created test.Observation of student academic talk.Team meeting agendas
Family Reading Circle ( Families gather together for 6 weeks to read selected books together at the school and share a meal together during the process).Quarterly workshops for parents and students to provide instructional strategies to improve reading skills.Families will participate in monthly PTA meetings that have a focus on increasing literacy in the home.Parents will participate in Book Reading campaign with their children weekly and they will record the results on a book chart.
Parents attendance at meetings.Parents using the strategies at home with students.
SANEParent surveysNewsletters, Parent conect, PTA Meetings, Family Meetings, Open House, and Back to School Night.

School Performance Plan for George Washington Elementary School 36 of 69
School-Level Goal #2S (Specific): Data shows that students are not excelling in Math in the area of Word Problems as evidenced by Benchmarks, formative assessments, and wireless data.M(Measurable): Increase from Benchmark A 10% to Benchmark B 40% to Benchmark C 60% to Benchmark D 80% ( Showing growth from one Benchmark to the next)A (Achievable): Percentage of Expected change? 70%R ( Relevant): Is the goal addressing an urgent need ? YesT (Timely): Whats the timeframe for improvement ? Quarterly
By June 2013 students will increase profiency in responses to word problems by 10% to 40% to 60% to 80% in the area of Mathematics as measured by Benchmark C and formative assessements.
School-Level Goal #2 Strategies Results Indicator Reporting Mechanism

School Performance Plan for George Washington Elementary School 37 of 69
School-Level Goal #2S (Specific): Data shows that students are not excelling in Math in the area of Word Problems as evidenced by Benchmarks, formative assessments, and wireless data.M(Measurable): Increase from Benchmark A 10% to Benchmark B 40% to Benchmark C 60% to Benchmark D 80% ( Showing growth from one Benchmark to the next)A (Achievable): Percentage of Expected change? 70%R ( Relevant): Is the goal addressing an urgent need ? YesT (Timely): Whats the timeframe for improvement ? Quarterly
By June 2013 students will increase profiency in responses to word problems by 10% to 40% to 60% to 80% in the area of Mathematics as measured by Benchmark C and formative assessements.
School-Level Goal #2 Strategies Results Indicator Reporting Mechanism
Our High Yield strategies will include the following :
Explicit TeachingRigor in the Classroom
Implementation of the High Yield Strategy Rigor thru PD at faculty meetings and colloborative planning.
Students will be achieving at a higher level with an increase of 10%student growth.
Students demonstrating high order thinking thru technology, projects, drawings, etc.
Enhance accountable talk.Ensure Independent thinking.
Lesson Plans will show differention of instruction and scaffolding within a lesson.Students are engaged in higher order thinking skillsLesson studies using mdk12 lessons during collobrative meetings.
Teacher modeling the thinking process during lessons.
Students in attendance at after school tutoring. for further instructional opportunities.
Formal and Informal Observations will give evidence of Rigor in the classrooms.
Teacher Created TestData utilizing Data linxBenchmark DataWireless Generation DataStudent Work SamplesObservation forms

School Performance Plan for George Washington Elementary School 38 of 69
School-Level Goal #2S (Specific): Data shows that students are not excelling in Math in the area of Word Problems as evidenced by Benchmarks, formative assessments, and wireless data.M(Measurable): Increase from Benchmark A 10% to Benchmark B 40% to Benchmark C 60% to Benchmark D 80% ( Showing growth from one Benchmark to the next)A (Achievable): Percentage of Expected change? 70%R ( Relevant): Is the goal addressing an urgent need ? YesT (Timely): Whats the timeframe for improvement ? Quarterly
By June 2013 students will increase profiency in responses to word problems by 10% to 40% to 60% to 80% in the area of Mathematics as measured by Benchmark C and formative assessements.
School-Level Goal #2 Strategies Results Indicator Reporting Mechanism
OPT in school for Math and Reading for common coreSchool based Professional development (Marzano's High Yield Strategies)First in MathDO the MathMath WorksTeacher Assisted Instruction (TAI)
Increase teacher knowledge of common coreBest Practices
Formal and informal observations of teachers implementing strategies,
Team meeting SANE documents
Family Math NightQuarterly Family Meetings that discuss how to assist students with MathBack to School NightRobotics Contest ( Math and Science skills utilized)PTA Meetings held monthly to discuss Math initiativesNewsletters from teachers with methods of helping students at home with math and word problems.Daily writing responses in math journal.Parent Link
Increase parental involvement SANEParent feedback

School Performance Plan for George Washington Elementary School 39 of 69
School-Level Goal #3
S (Specific): Data shows that students are not excelling in Math in the area of Writing as evidenced by Benchmarks, formative assessments, and wireless data.M(Measurable): Increase from Benchmark A 10% to Benchmark B 40% to Benchmark C 60% to Benchmark D 80% ( Showing growth from one Benchmark to the next)A (Achievable): Percentage of Expected change? 70%R ( Relevant): Is the goal addressing an urgent need ? YesT (Timely): Whats the timeframe for improvement ? Quarterly
Students will increase their writing skills with the use of the writing process and writing rubrics from 10% to 40% to 60% to 80% by completing daily journaling assignments and a monthly schoolwide writing project.
School-Level Goal #3 Strategies Results Indicator Reporting Mechanism
Explicit Teaching( Gradual release. I do-we do-you do)
Increase test scores.Enhance accountable talk.Ensure Independent thinking.Increase critical thinking skills
Lesson PlansObservationsTeacher Created Test DataBenchmark Data
Teachers meet together for 90 minute blocks each week by grade levels PK-2 and by content in grades 3-5 to discuss student progress by examining data ; explicit teaching strategies ; lesson exemplars; and other pertinent data related to student progress.Teachers will meet monthly for staff meetings that will focus on the Instructional strategy of Explicit Teaching.
Increase knowledge of common coreBest Practices
Formal and informal observations of teachers implementing strategiesTeam meeting agendas
Monthly Family Meeting on Writing skillsDramatic Reading ContestIf I were the Mayor ContestReading the most boks chalenge for families and studentsNewslettersGlobal Connect
Increase parental involvement SANEParent feedbackParent connect updates sent out to families

School Performance Plan for George Washington Elementary School 40 of 69
Step 6: Monitor and Evaluate Results
Guidance: Use this template at designated Instructional Leadership Team (ILT) and School Family Council (SFC) meetings throughout the year to monitor specific goals and strategies in your plan.
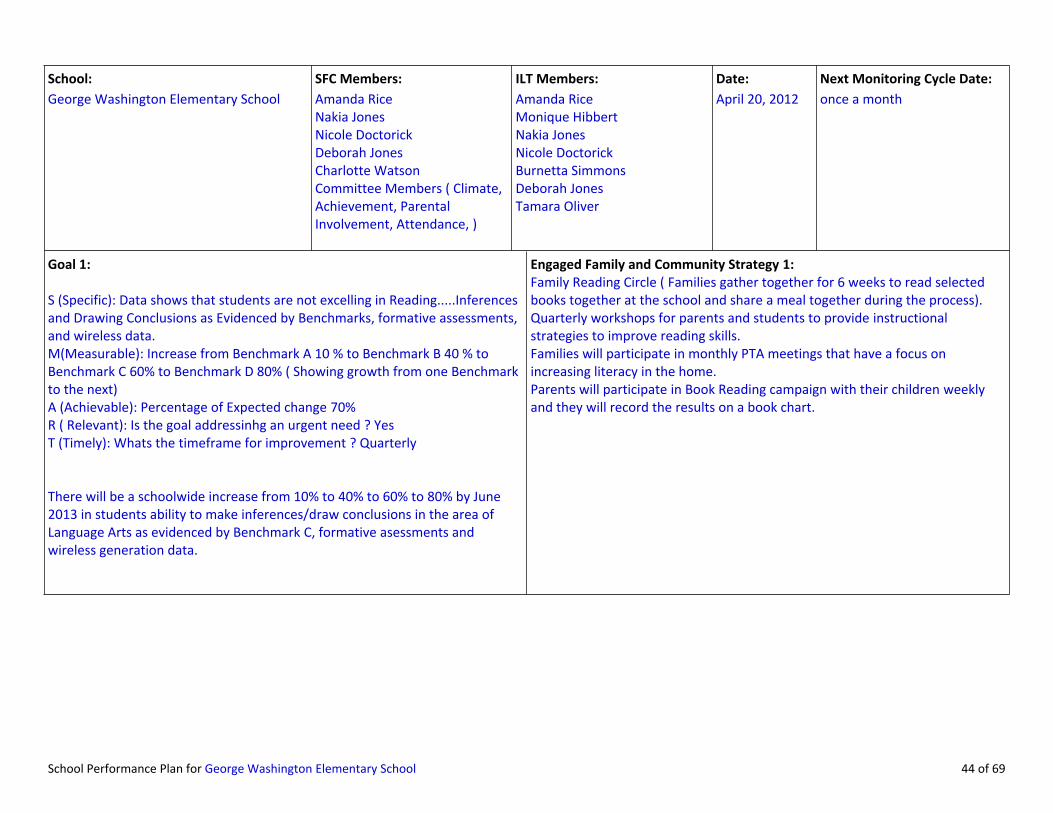
School: SFC Members: ILT Members: Date: Next Monitoring Cycle Date:George Washington Elementary School Amanda Rice
Nakia JonesNicole DoctorickDeborah JonesCharlotte WatsonCommittee Members ( Climate, Achievement, Parental Involvement, Attendance, )
Amanda RiceMonique HibbertNakia JonesNicole DoctorickBurnetta SimmonsDeborah JonesTamara Oliver
April 20, 2012 once a month---------------
Goal 1:
S (Specific): Data shows that students are not excelling in Reading.....Inferences and Drawing Conclusions as Evidenced by Benchmarks, formative assessments, and wireless data.M(Measurable): Increase from Benchmark A 10 % to Benchmark B 40 % to Benchmark C 60% to Benchmark D 80% ( Showing growth from one Benchmark to the next)A (Achievable): Percentage of Expected change 70%R ( Relevant): Is the goal addressinhg an urgent need ? YesT (Timely): Whats the timeframe for improvement ? Quarterly
There will be a schoolwide increase from 10% to 40% to 60% to 80% by June 2013 in students ability to make inferences/draw conclusions in the area of Language Arts as evidenced by Benchmark C, formative asessments and wireless generation data.
Instructional Strategy 1:
Our High Yield strategy for the entire school yearwill be Explicit Teaching which will impact achievement of all goals. The year long strategy will be:
Explicit Teaching ( I Do; We Do ; You Do)
Literacy Coach will assist with implementation of Explicit Teaching and will provide Professional Development on Explicit Teaching for staff each month.
School Performance Plan for George Washington Elementary School 41 of 69
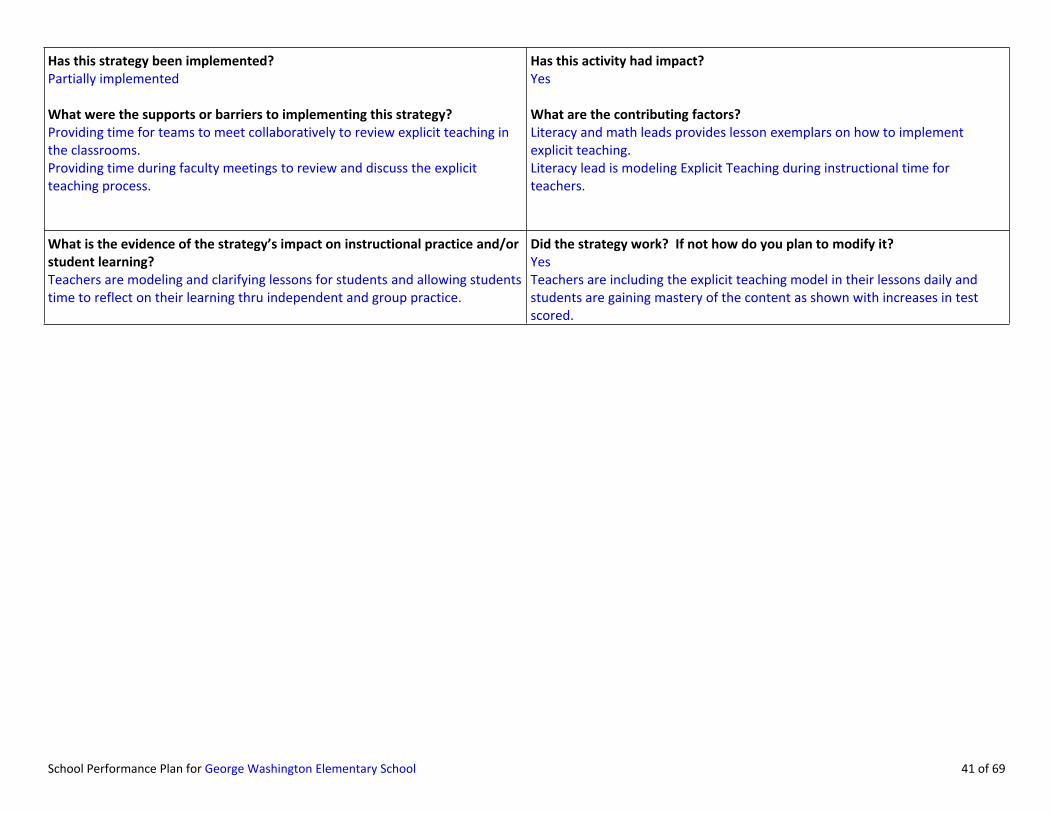
Has this strategy been implemented?Partially implemented
What were the supports or barriers to implementing this strategy?Providing time for teams to meet collaboratively to review explicit teaching in the classrooms.Providing time during faculty meetings to review and discuss the explicit teaching process.
Has this activity had impact?Yes
What are the contributing factors?Literacy and math leads provides lesson exemplars on how to implement explicit teaching.Literacy lead is modeling Explicit Teaching during instructional time for teachers.
What is the evidence of the strategy’s impact on instructional practice and/or student learning?Teachers are modeling and clarifying lessons for students and allowing students time to reflect on their learning thru independent and group practice.
Did the strategy work? If not how do you plan to modify it?YesTeachers are including the explicit teaching model in their lessons daily and students are gaining mastery of the content as shown with increases in test scored.

School Performance Plan for George Washington Elementary School 42 of 69
School: SFC Members: ILT Members: Date: Next Monitoring Cycle Date:George Washington Elementary School Amanda Rice
Nakia JonesNicole DoctorickDeborah JonesCharlotte WatsonCommittee Members ( Climate, Achievement, Parental Involvement, Attendance, )
Amanda RiceMonique HibbertNakia JonesNicole DoctorickBurnetta SimmonsDeborah JonesTamara Oliver
08/28/2012 11/01/2012---------------
Goal 1:
S (Specific): Data shows that students are not excelling in Reading.....Inferences and Drawing Conclusions as Evidenced by Benchmarks, formative assessments, and wireless data.M(Measurable): Increase from Benchmark A 10 % to Benchmark B 40 % to Benchmark C 60% to Benchmark D 80% ( Showing growth from one Benchmark to the next)A (Achievable): Percentage of Expected change 70%R ( Relevant): Is the goal addressinhg an urgent need ? YesT (Timely): Whats the timeframe for improvement ? Quarterly
There will be a schoolwide increase from 10% to 40% to 60% to 80% by June 2013 in students ability to make inferences/draw conclusions in the area of Language Arts as evidenced by Benchmark C, formative asessments and wireless generation data.
Professional Development Strategy 1:Collaborative Planning;Teachers meet together for 90 minute blocks each week by grade levels PK-2 and by content in grades 3-5 to discuss student progress by examining data ; explicit teaching strategies ; lesson exemplars; and other pertinent data related to student progress.Teachers will meet monthly for staff meetings that will focus on the Instructional strategy of Explicit Teaching.
Has this strategy been implemented?Fully Implemented
What were the supports or barriers to implementing this strategy?The supports in place are resource teachers and temporary staff to hold classes for instructors while they meet.
Has this activity had impact?Yes
What are the contributing factors?Teams are able to discuss content and strategies for delivering the content. Student achievement is showing increases.
School Performance Plan for George Washington Elementary School 43 of 69
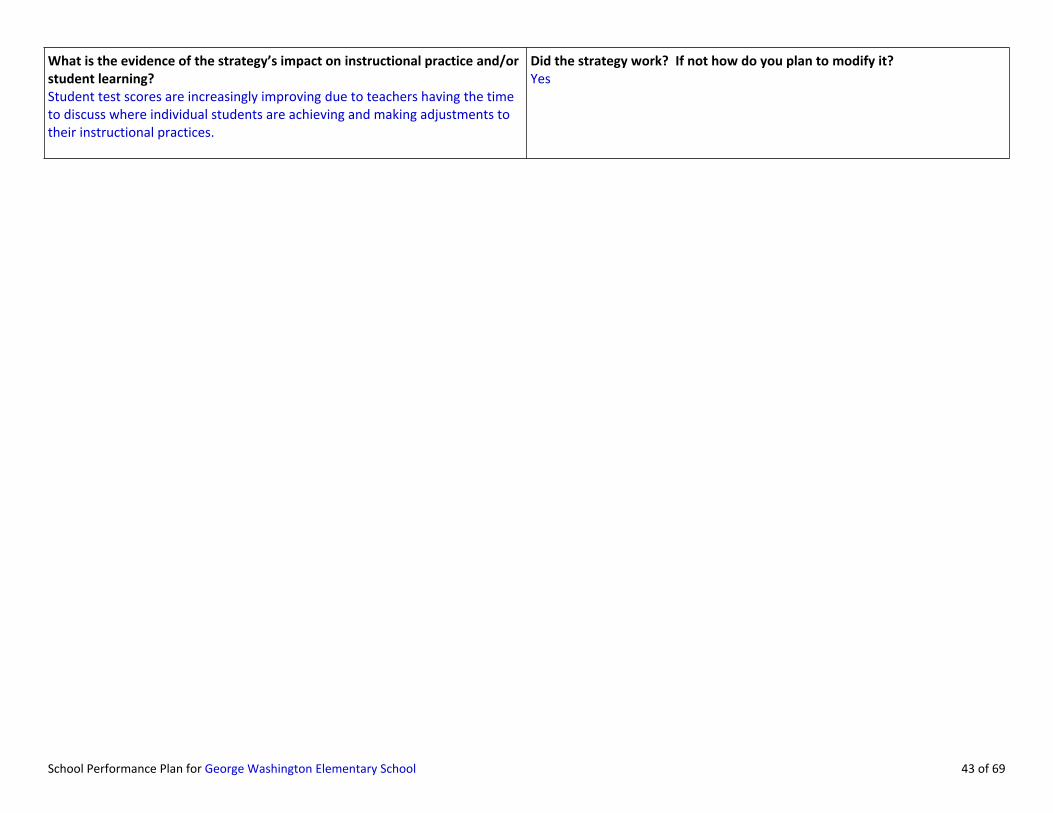
What is the evidence of the strategy’s impact on instructional practice and/or student learning?Student test scores are increasingly improving due to teachers having the time to discuss where individual students are achieving and making adjustments to their instructional practices.
Did the strategy work? If not how do you plan to modify it?Yes
School Performance Plan for George Washington Elementary School 44 of 69
School: SFC Members: ILT Members: Date: Next Monitoring Cycle Date:George Washington Elementary School Amanda Rice
Nakia JonesNicole DoctorickDeborah JonesCharlotte WatsonCommittee Members ( Climate, Achievement, Parental Involvement, Attendance, )
Amanda RiceMonique HibbertNakia JonesNicole DoctorickBurnetta SimmonsDeborah JonesTamara Oliver
April 20, 2012 once a month---------------
Goal 1:
S (Specific): Data shows that students are not excelling in Reading.....Inferences and Drawing Conclusions as Evidenced by Benchmarks, formative assessments, and wireless data.M(Measurable): Increase from Benchmark A 10 % to Benchmark B 40 % to Benchmark C 60% to Benchmark D 80% ( Showing growth from one Benchmark to the next)A (Achievable): Percentage of Expected change 70%R ( Relevant): Is the goal addressinhg an urgent need ? YesT (Timely): Whats the timeframe for improvement ? Quarterly
There will be a schoolwide increase from 10% to 40% to 60% to 80% by June 2013 in students ability to make inferences/draw conclusions in the area of Language Arts as evidenced by Benchmark C, formative asessments and wireless generation data.
Engaged Family and Community Strategy 1:Family Reading Circle ( Families gather together for 6 weeks to read selected books together at the school and share a meal together during the process).Quarterly workshops for parents and students to provide instructional strategies to improve reading skills.Families will participate in monthly PTA meetings that have a focus on increasing literacy in the home.Parents will participate in Book Reading campaign with their children weekly and they will record the results on a book chart.

School Performance Plan for George Washington Elementary School 45 of 69
Has this strategy been implemented?Partially implemented
What were the supports or barriers to implementing this strategy?The barriers are getting parents to participate in the monthly meetings.
Has this activity had impact?Yes
What are the contributing factors?Providing parents with written and verbal notices of all meetings in a timely fashion.Providing a specific location for all meetings.
What is the evidence of the strategy’s impact on instructional practice and/or student learning?Students are eager to chart their progress on the reading charts and discuss how their parents have assisted.
Did the strategy work? If not how do you plan to modify it?Yes

School Performance Plan for George Washington Elementary School 46 of 69
School: SFC Members: ILT Members: Date: Next Monitoring Cycle Date:George Washington Elementary School Amanda Rice
Nakia JonesNicole DoctorickDeborah JonesCharlotte WatsonCommittee Members ( Climate, Achievement, Parental Involvement, Attendance, )
Amanda RiceMonique HibbertNakia JonesNicole DoctorickBurnetta SimmonsDeborah JonesTamara Oliver
April 20, 2012 once a month---------------
Goal 2:S (Specific): Data shows that students are not excelling in Math in the area of Word Problems as evidenced by Benchmarks, formative assessments, and wireless data.M(Measurable): Increase from Benchmark A 10% to Benchmark B 40% to Benchmark C 60% to Benchmark D 80% ( Showing growth from one Benchmark to the next)A (Achievable): Percentage of Expected change? 70%R ( Relevant): Is the goal addressing an urgent need ? YesT (Timely): Whats the timeframe for improvement ? Quarterly
By June 2013 students will increase profiency in responses to word problems by 10% to 40% to 60% to 80% in the area of Mathematics as measured by Benchmark C and formative assessements.
Instructional Strategy 2:Our High Yield strategies will include the following :
Explicit TeachingRigor in the Classroom
Has this strategy been implemented?Partially implemented
What were the supports or barriers to implementing this strategy?More Professional Development on Rigor in the classrooms.Providing teachers with assistance with forming small groups, which will allow for differentiation of instruction.
Has this activity had impact?Yes
What are the contributing factors?The incorporation of Experience Corp workers in the classrooms assisting with intervention, small grouping, and cooperative learning.

School Performance Plan for George Washington Elementary School 47 of 69
What is the evidence of the strategy’s impact on instructional practice and/or student learning?Increase in formative assessment test scores with a goal of 80% masteryLearner becomes more independent and critical thinkersLearner is able to answer more higher level questionsLearners are engaged in various activities such as subject related school projects and use of technology.
Did the strategy work? If not how do you plan to modify it?Yes

School Performance Plan for George Washington Elementary School 48 of 69
School: SFC Members: ILT Members: Date: Next Monitoring Cycle Date:George Washington Elementary School Amanda Rice
Nakia JonesNicole DoctorickDeborah JonesCharlotte WatsonCommittee Members ( Climate, Achievement, Parental Involvement, Attendance, )
Amanda RiceMonique HibbertNakia JonesNicole DoctorickBurnetta SimmonsDeborah JonesTamara Oliver
08/28/2012 11/05/12---------------
Goal 2:S (Specific): Data shows that students are not excelling in Math in the area of Word Problems as evidenced by Benchmarks, formative assessments, and wireless data.M(Measurable): Increase from Benchmark A 10% to Benchmark B 40% to Benchmark C 60% to Benchmark D 80% ( Showing growth from one Benchmark to the next)A (Achievable): Percentage of Expected change? 70%R ( Relevant): Is the goal addressing an urgent need ? YesT (Timely): Whats the timeframe for improvement ? Quarterly
By June 2013 students will increase profiency in responses to word problems by 10% to 40% to 60% to 80% in the area of Mathematics as measured by Benchmark C and formative assessements.
Professional Development Strategy 2:Collaborative Planning;Teachers meet together for 90 minute blocks each week by grade levels PK-2 and by content in grades 3-5 to discuss student progress by examining data ; explicit teaching strategies ; lesson exemplars; and other pertinent data related to student progress.Teachers will meet monthly for staff meetings that will focus on the Instructional strategy of Explicit Teaching.
Has this strategy been implemented?Fully Implemented
What were the supports or barriers to implementing this strategy?Resource teachers hold classes in order to allow teachers time to meet to plan.
Has this activity had impact?Yes
What are the contributing factors?
School Performance Plan for George Washington Elementary School 49 of 69
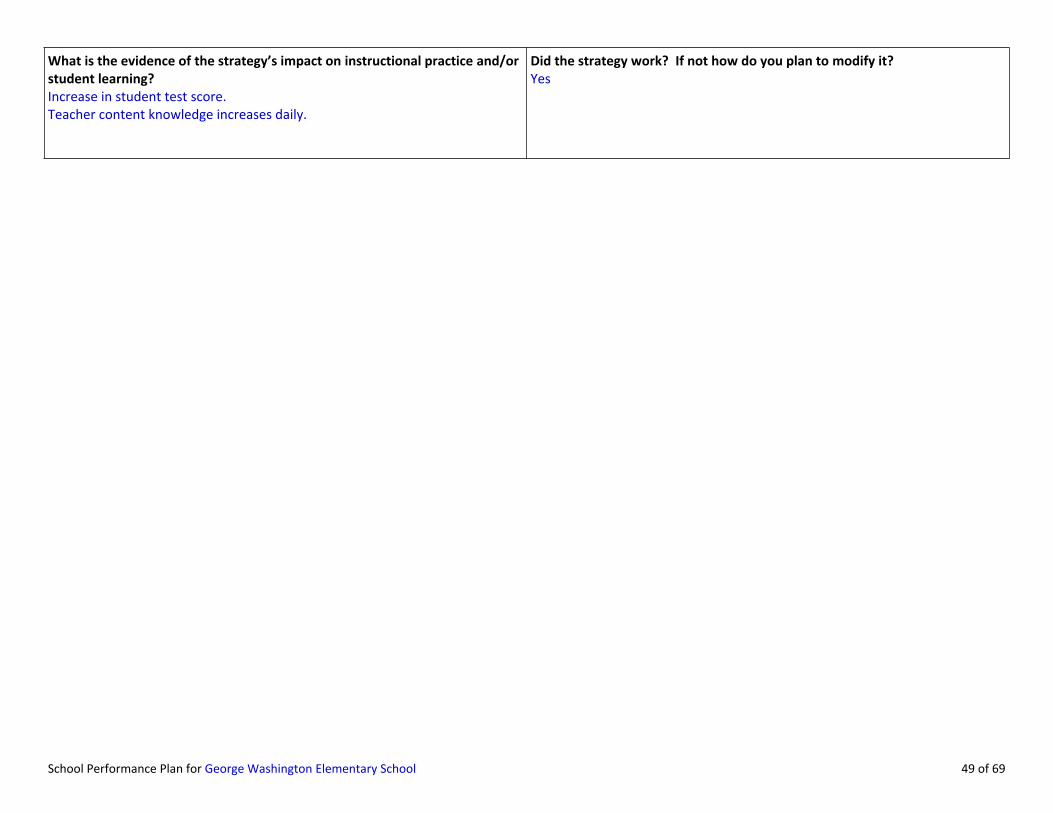
What is the evidence of the strategy’s impact on instructional practice and/or student learning?Increase in student test score.Teacher content knowledge increases daily.
Did the strategy work? If not how do you plan to modify it?Yes

School Performance Plan for George Washington Elementary School 50 of 69
School: SFC Members: ILT Members: Date: Next Monitoring Cycle Date:George Washington Elementary School Amanda Rice
Nakia JonesNicole DoctorickDeborah JonesCharlotte WatsonCommittee Members ( Climate, Achievement, Parental Involvement, Attendance, )
Amanda RiceMonique HibbertNakia JonesNicole DoctorickBurnetta SimmonsDeborah JonesTamara Oliver
April 20, 2012 once a month---------------
Goal 2:S (Specific): Data shows that students are not excelling in Math in the area of Word Problems as evidenced by Benchmarks, formative assessments, and wireless data.M(Measurable): Increase from Benchmark A 10% to Benchmark B 40% to Benchmark C 60% to Benchmark D 80% ( Showing growth from one Benchmark to the next)A (Achievable): Percentage of Expected change? 70%R ( Relevant): Is the goal addressing an urgent need ? YesT (Timely): Whats the timeframe for improvement ? Quarterly
By June 2013 students will increase profiency in responses to word problems by 10% to 40% to 60% to 80% in the area of Mathematics as measured by Benchmark C and formative assessements.
Engaged Family and Community Strategy 2:Family Math NightQuarterly Family Meetings that discuss how to assist students with MathBack to School NightRobotics Contest ( Math and Science skills utilized)PTA Meetings held monthly to discuss Math initiativesNewsletters from teachers with methods of helping students at home with math and word problems.Daily writing responses in math journal.Parent Link
Has this strategy been implemented?Partially implemented
What were the supports or barriers to implementing this strategy?The PTA is a great support with the strategies to assist parents with their children's instructional needs. The PTA reaches out to parents each month and provides strategies to them for helping students achieve academically.
Has this activity had impact?Yes
What are the contributing factors?PTA partnership and keeping parents informed of meetings and the benefit to them and their children.

School Performance Plan for George Washington Elementary School 51 of 69
What is the evidence of the strategy’s impact on instructional practice and/or student learning?Student's are progressing academically as revealed in the increase in test scores.
Did the strategy work? If not how do you plan to modify it?Yes
School Performance Plan for George Washington Elementary School 52 of 69
School: SFC Members: ILT Members: Date: Next Monitoring Cycle Date:George Washington Elementary School Amanda Rice
Nakia JonesNicole DoctorickDeborah JonesCharlotte WatsonCommittee Members ( Climate, Achievement, Parental Involvement, Attendance, )
Amanda RiceMonique HibbertNakia JonesNicole DoctorickBurnetta SimmonsDeborah JonesTamara Oliver
April 20, 2012 11/05/12---------------
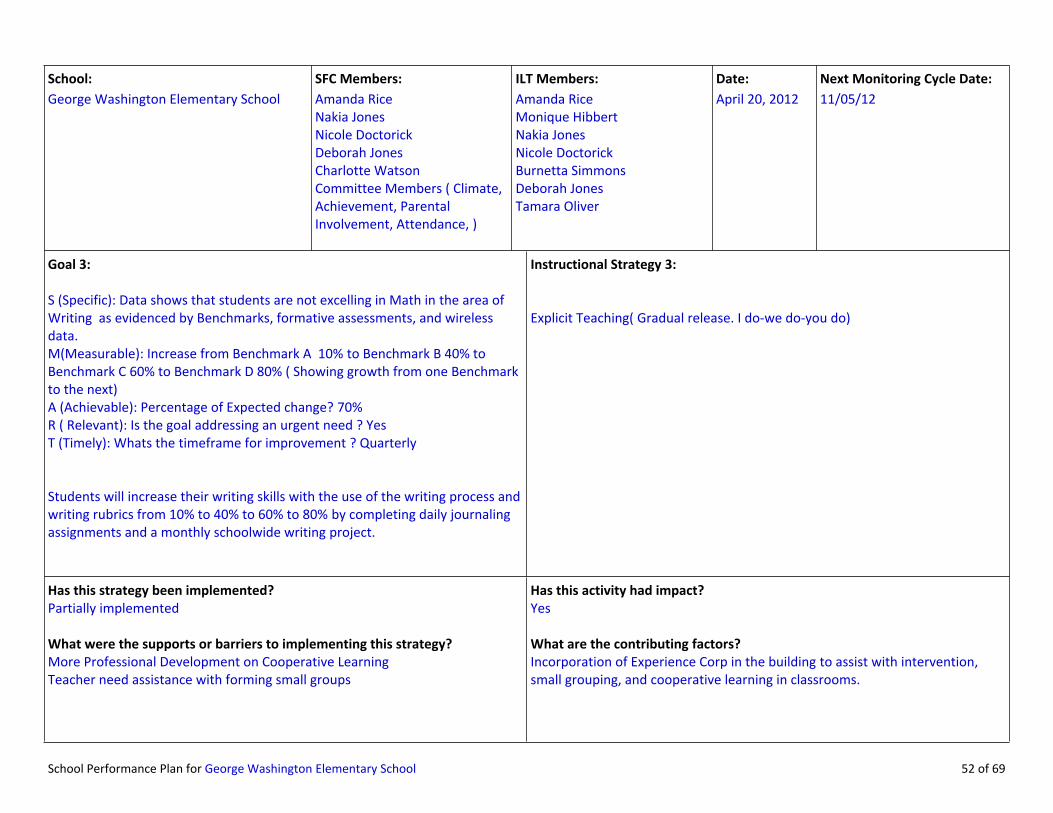
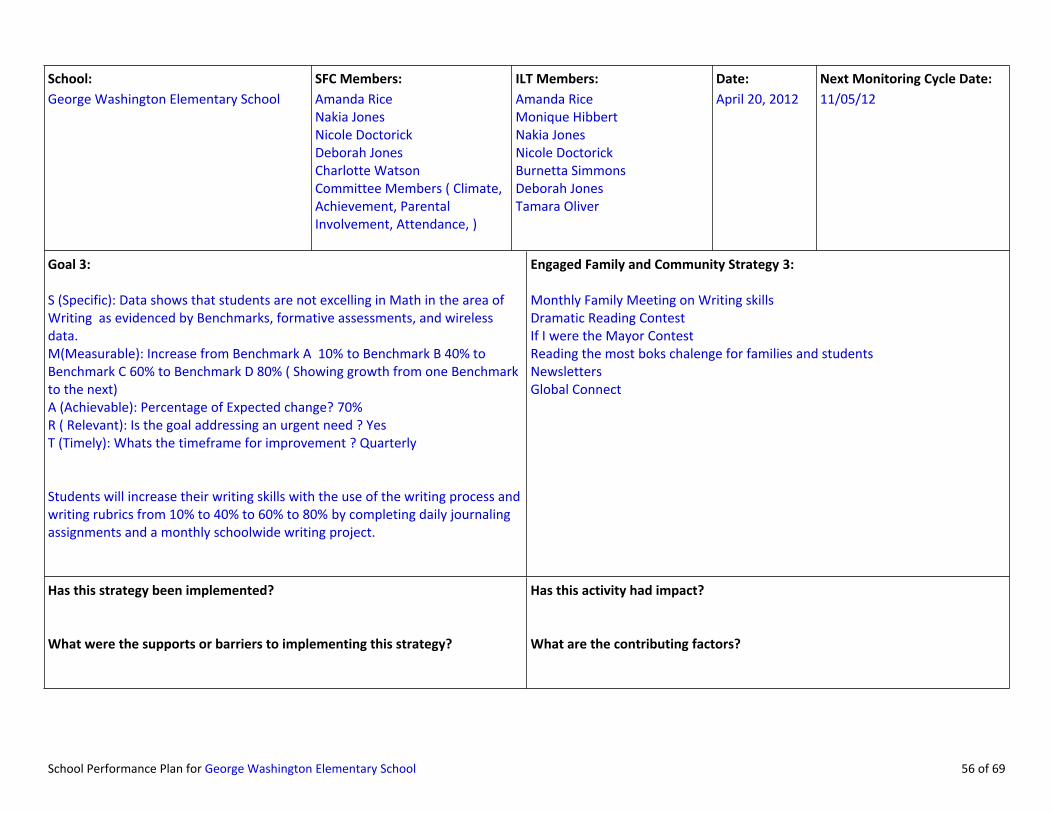
Goal 3:
S (Specific): Data shows that students are not excelling in Math in the area of Writing as evidenced by Benchmarks, formative assessments, and wireless data.M(Measurable): Increase from Benchmark A 10% to Benchmark B 40% to Benchmark C 60% to Benchmark D 80% ( Showing growth from one Benchmark to the next)A (Achievable): Percentage of Expected change? 70%R ( Relevant): Is the goal addressing an urgent need ? YesT (Timely): Whats the timeframe for improvement ? Quarterly
Students will increase their writing skills with the use of the writing process and writing rubrics from 10% to 40% to 60% to 80% by completing daily journaling assignments and a monthly schoolwide writing project.
Instructional Strategy 3:
Explicit Teaching( Gradual release. I do-we do-you do)
Has this strategy been implemented?Partially implemented
What were the supports or barriers to implementing this strategy?More Professional Development on Cooperative LearningTeacher need assistance with forming small groups
Has this activity had impact?Yes
What are the contributing factors?Incorporation of Experience Corp in the building to assist with intervention, small grouping, and cooperative learning in classrooms.

School Performance Plan for George Washington Elementary School 53 of 69
What is the evidence of the strategy’s impact on instructional practice and/or student learning?Increase in formative assessment test scores with a goal of 80% masteryLearner becomes more independent and critical thinkersLearner is able to answer more higher level questionsLearners comprehension skills increase as evidence on formative assessments.
Did the strategy work? If not how do you plan to modify it?Yes

School Performance Plan for George Washington Elementary School 54 of 69
School: SFC Members: ILT Members: Date: Next Monitoring Cycle Date:George Washington Elementary School Amanda Rice
Nakia JonesNicole DoctorickDeborah JonesCharlotte WatsonCommittee Members ( Climate, Achievement, Parental Involvement, Attendance, )
Amanda RiceMonique HibbertNakia JonesNicole DoctorickBurnetta SimmonsDeborah JonesTamara Oliver
11/05/12 12/05/12---------------
Goal 3:
S (Specific): Data shows that students are not excelling in Math in the area of Writing as evidenced by Benchmarks, formative assessments, and wireless data.M(Measurable): Increase from Benchmark A 10% to Benchmark B 40% to Benchmark C 60% to Benchmark D 80% ( Showing growth from one Benchmark to the next)A (Achievable): Percentage of Expected change? 70%R ( Relevant): Is the goal addressing an urgent need ? YesT (Timely): Whats the timeframe for improvement ? Quarterly
Students will increase their writing skills with the use of the writing process and writing rubrics from 10% to 40% to 60% to 80% by completing daily journaling assignments and a monthly schoolwide writing project.
Professional Development Strategy 3:Collaborative Planning;Teachers meet together for 90 minute blocks each week by grade levels PK-2 and by content in grades 3-5 to discuss student progress by examining data ; explicit teaching strategies ; lesson exemplars; and other pertinent data related to student progress.Teachers will meet monthly for staff meetings that will focus on the Instructional strategy of Explicit Teaching.
Has this strategy been implemented?Fully Implemented
What were the supports or barriers to implementing this strategy?Teachers are provided with sticky note pads for student use and novels for lesson studies utilizing the note taking strategies as they read.
Has this activity had impact?Yes
What are the contributing factors?Providing teachers with instructional materials to incorporate the techniquesProviding teachers with professional development on note taking strategies.

School Performance Plan for George Washington Elementary School 55 of 69
What is the evidence of the strategy’s impact on instructional practice and/or student learning?Teachers are able to develop lessons where students are encouraged to use the note taking strategies with novel studies.increase in student comprehension skills .
Did the strategy work? If not how do you plan to modify it?Yes
School Performance Plan for George Washington Elementary School 56 of 69
School: SFC Members: ILT Members: Date: Next Monitoring Cycle Date:George Washington Elementary School Amanda Rice
Nakia JonesNicole DoctorickDeborah JonesCharlotte WatsonCommittee Members ( Climate, Achievement, Parental Involvement, Attendance, )
Amanda RiceMonique HibbertNakia JonesNicole DoctorickBurnetta SimmonsDeborah JonesTamara Oliver
April 20, 2012 11/05/12---------------
Goal 3:
S (Specific): Data shows that students are not excelling in Math in the area of Writing as evidenced by Benchmarks, formative assessments, and wireless data.M(Measurable): Increase from Benchmark A 10% to Benchmark B 40% to Benchmark C 60% to Benchmark D 80% ( Showing growth from one Benchmark to the next)A (Achievable): Percentage of Expected change? 70%R ( Relevant): Is the goal addressing an urgent need ? YesT (Timely): Whats the timeframe for improvement ? Quarterly
Students will increase their writing skills with the use of the writing process and writing rubrics from 10% to 40% to 60% to 80% by completing daily journaling assignments and a monthly schoolwide writing project.
Engaged Family and Community Strategy 3:
Monthly Family Meeting on Writing skillsDramatic Reading ContestIf I were the Mayor ContestReading the most boks chalenge for families and studentsNewslettersGlobal Connect
Has this strategy been implemented?
What were the supports or barriers to implementing this strategy?
Has this activity had impact?
What are the contributing factors?

School Performance Plan for George Washington Elementary School 57 of 69
What is the evidence of the strategy’s impact on instructional practice and/or student learning?
Did the strategy work? If not how do you plan to modify it?

School Performance Plan for George Washington Elementary School 58 of 69
Appendix 1: Title I Family and Community Engagement Plan
Does your school receive Title I funds?Yes
If yes, complete Appendix 1 below.
If no, continue to Appendix 4.
Building Family Capacity for InvolvementYour school should provide assistance to families in order to support their:• Familiarity with Title I requirements;• Understanding of MSDE’s Common Core State Standards and assessments; • Connections to other programs and activities, including Head Start, HIPPY, and parent resource centers; • Involvement in school activities and governance; and• Engagement in actively supporting academic progress and achievement.
Provide the dates of 3 school-level opportunities that will contribute to building parent capacity for involvement.• Date 1: 09/08/2012- Back- To-School Rally• Date 2: 09/20/2012- Back-To- School Night• Date 3: 11/15/2012- Parent Workshop
√ File SANE
School-Parent CompactThe School-Parent Compact is an agreement between families, students, and school staff to support each other in ensuring that students are successful. The compact addresses communication between teachers and parents on an ongoing basis about their children’s progress and achievement. Your school should provide opportunity for families to take part in the development of the School-Parent Compact.
Provide the dates of at least one school-level opportunity that will contribute to building parent capacity for involvement.• Date 1: 08/23/2012• Date 2: 09/20/2012
√ File SANE

School Performance Plan for George Washington Elementary School 59 of 69
Annual MeetingYour school should invite families to attend the Annual Meeting (at Back to School Night or another time convenient for the school community) to learn about your school’s Title I programs and requirements. Families should be given opportunity to review and provide feedback in the following areas:• Annual Yearly Progress (AYP)/School Data• Overall School Budget• Overview of Parent Involvement Plan• School-Parent Compact• Rights of Title I Parents
Provide the date of the planned Annual Meeting below.• Date 1: 09/20/2012
√ File SANE
Title I Parent Involvement BudgetYour school should invite families to take part in decisions about how Title I Parent Involvement Funds are spent.
Provide the date of the planned meeting for parents to take part in Title I Parent Involvement budget allocation decisions below.• Date 1: 04/18/2012
√ File SANE

School Performance Plan for George Washington Elementary School 60 of 69
Appendix 2: Title I Schoolwide
Does your school receive Title I Schoolwide funds?Yes
If yes, complete Appendix 2 below.
If no, continue to Appendix 3.
Title 1 Schoolwide StrategiesPerson(s)
ResponsibleTimeline Title I Funding
1. How will your school support student achievement among high achieving students?
The school will be implementing an Advanced Learner Program for our high achieving students who will be recieivng the instruction after school. The students will be identified thru the use of pre-assessments in order to find out what they already know, what they are interested in, and how they learn best. Existing data will also be used to determine each student's reading and writing levels in all content areas. Based upon all of the above data students will be identified for the program and then provided with curriculum that will be adjusted to meet their needs in the areas of content, process, and final product demonstrating what they have learned in class.Students will also be encouraged to be on the Robotics team in order to learn about computer technology and science.
Amanda Rice, Deborah Jones, and Shamera Wilkins
August 2012 - June 2013
FSF $86,000FSF $2,000 StipendsFSF $3,000 materials and supplies

School Performance Plan for George Washington Elementary School 61 of 69
Title 1 Schoolwide StrategiesPerson(s)
ResponsibleTimeline Title I Funding
Implementing and Exposing S.T.E.M (Science, Technology, Engineering, Mathematics) . The STEM project will begin during the Summer STEM Academy and will extend to the 2012-2013 school year. The STEM program will lead to students participation in 2 school wide Science Fairs and students will compete in a City Wide Science fair at Morgan State University at the conclusion of the school year. Students will also extend their learning to the Robotics program and will compete against other schools in this area.
All Teachers August 2012 - June 2013
FSF $1,000 to replenish STEM science kits
Utilization of Wireless Data to provide students differentiation of instruction as their reading levels increase and progress monitoring to ensure students are mastering skills.
All Teachers August 2012 - June 2013
FSF $7,000 Scholastic libraries for each classFSF $14,000 for laptop computers to use with Wireless data monitoring.
Professional Development of staff on data analysis and forming intervention groups for high performing students.
Literacy Lead Teacher
August 2012-June 2013
TItle I $46,800 salary of a .50 literacy lead teacher
System-wide PD/ Opt in Common Core Units and PD sessions provided by the District
Literacy and Math Lead
August 2012-June 2013
Differentiating Instruction to meet the needs of all learners based upon Wireless Data.
All Teachers August 2012 - June 2013
$6,000 Scholastic libraries
2. How will your school support low-performing students achieve at proficient or advanced levels?
Professional Development of staff on data analysis and forming intervention groups for high performing students. Teachers will also attend the systemic PD "The Works".
Literacy Lead Teacher
August 2012 - June 2013
$46,800 salary
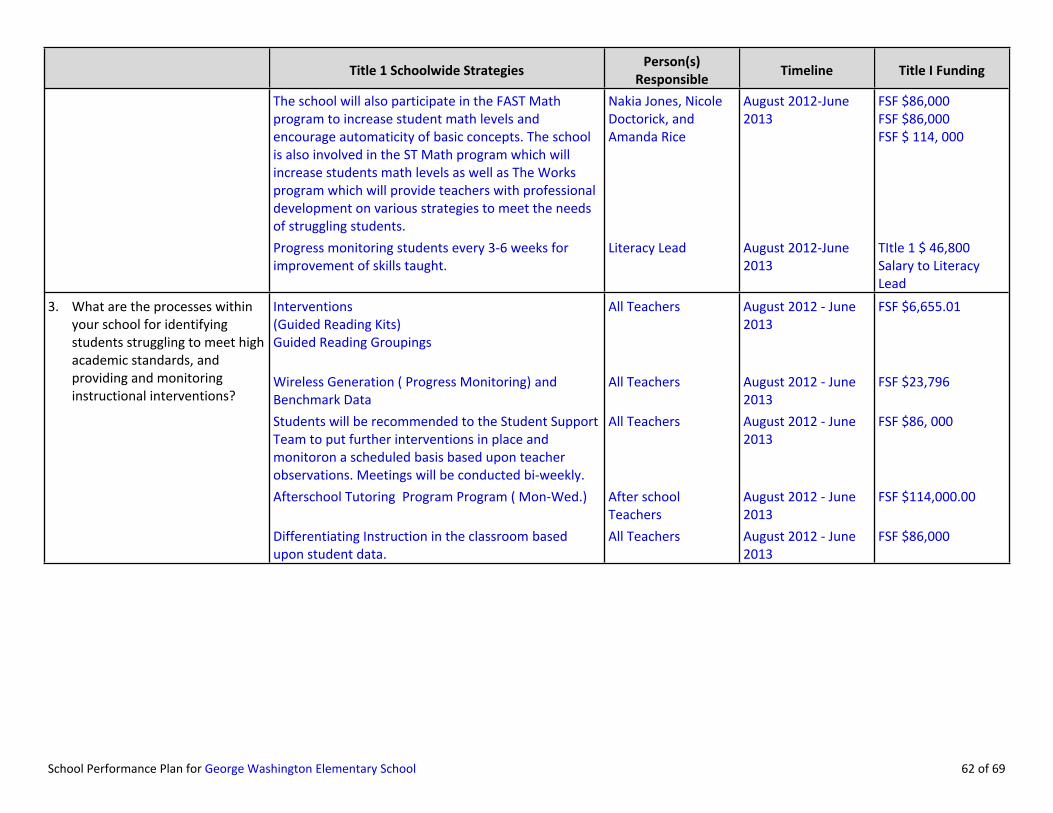
School Performance Plan for George Washington Elementary School 62 of 69
Title 1 Schoolwide StrategiesPerson(s)
ResponsibleTimeline Title I Funding
The school will also participate in the FAST Math program to increase student math levels and encourage automaticity of basic concepts. The school is also involved in the ST Math program which will increase students math levels as well as The Works program which will provide teachers with professional development on various strategies to meet the needs of struggling students.
Nakia Jones, Nicole Doctorick, and Amanda Rice
August 2012-June 2013
FSF $86,000FSF $86,000FSF $ 114, 000
Progress monitoring students every 3-6 weeks for improvement of skills taught.
Literacy Lead August 2012-June 2013
TItle 1 $ 46,800 Salary to Literacy Lead
Interventions(Guided Reading Kits)Guided Reading Groupings
All Teachers August 2012 - June 2013
FSF $6,655.01
Wireless Generation ( Progress Monitoring) and Benchmark Data
All Teachers August 2012 - June 2013
FSF $23,796
Students will be recommended to the Student Support Team to put further interventions in place and monitoron a scheduled basis based upon teacher observations. Meetings will be conducted bi-weekly.
All Teachers August 2012 - June 2013
FSF $86, 000
Afterschool Tutoring Program Program ( Mon-Wed.) After school Teachers
August 2012 - June 2013
FSF $114,000.00
3. What are the processes within your school for identifying students struggling to meet high academic standards, and providing and monitoring instructional interventions?
Differentiating Instruction in the classroom based upon student data.
All Teachers August 2012 - June 2013
FSF $86,000

School Performance Plan for George Washington Elementary School 63 of 69
Title 1 Schoolwide StrategiesPerson(s)
ResponsibleTimeline Title I Funding
Teacher Mentor will provide bi-weekly meetings with teachers with 1-3 years of service addressing their needs based upon an Action Plan developed by each teacher in the program. New teachers will also be included in the BTEN ( Building A Teacher Effectiveness Network). THE BTEN program is a District level approach to retain new teachers in the school by examinig and evaluating teachers on how they are supported and how they would like to be supported. The overall goal is to create a school-based professional community that supports new teachers.
Deborah Jones and Amanda Rice
August 2012 - June 2013
FSF$86,000$114,000
On-going Professional Development, Formal and informal observations, Teacher discussion sessions , and ongoing feedback provided directly by the principal to the teachers.Principal also mentors developing teacher leaders and provides opportunities for leadership within the building ( Math Lead, Literacy Lead, STEM Coach, Advanced Learner lead, Teacher Mentor, Emerging Leader Student).
Amanda Rice, Principal
August 2012 - June 2013
FSF $114,000.00
4. What does your school do to recruit and retain highly qualified and effective teachers in core subjects? Include a description of principal support.
Job Fair, College Open Houses Amanda RiceDeborah JonesNakia JonesNicole Doctorick
August 2012 - June 2013
FSF $1,000
Afterschool Tutoring Program Teachers Grades K-5 August 2012 - June 2013
$8,500
Saturday School Teachers grades K-5 January 2013 - March 2013
$10,000 Title I funds
5. How will your school incorporate extended learning activities, before/after-school, summer and school year extension opportunities into your instructional and student support strategies?
S.T.E.M (Science, Technology, Engineering, Mathematics)
Teachers grades K-5 July 2013 -August 1, 2012
$2,000

School Performance Plan for George Washington Elementary School 64 of 69
Title 1 Schoolwide StrategiesPerson(s)
ResponsibleTimeline Title I Funding
Open Houses for Pre-K and KindergartenPre-K visits to KindergartenVisitations from St. Jeromes Early Child care to GWES.
Tiffany TysonShayla GordonLinda Ray
May 2012August 2012
Early Registration/ Late Registration Linda RayTiffany TysonShayla Gordon
May 2012August 2012
6. What are your school’s plans for assisting children in transition from: - Early learning programs to
elementary school; - Elementary to middle
school;- Middle to high school; and
High school to college and career? Middle School Choice Fair
Middle school visitationNakia JonesMaisha Dorsey
March 2013
Principal will collect SANE documentation for collaborative planning meetings and ILT will review and discuss monthly. Principal will attend collaborative meetings and provide feedback to teachers.
Gradel Level Team Leads
August 2012 - June 2013
Staff Development Reading - Nicole Doctorick
Math- Nakia Jones
August 2012 - June 2013
Content Specific Team Meetings Grade Level - Team Leads
August 2012 - June 2013
7. How will your school ensure that teachers are actively engaging in collaborative planning and instructional adjustment strategies?
Coverage provided in order for teachers to plan together for 90 minutes each week.
Resource Teachers August 2012-June 2013
Title I funds and FSF will be used cohesively to best meet the needs of all learners at George Washington Elementary . Fair student funding is used to pay for instructional resources, student resources and staff funding. Title I is used for technology teacher, supplemental staff, reduction of class size, and supplemental instructional supplies.
Amanda RiceMonique HibbertNakia Jones
August 2012 - June 2013
8. How will your school ensure that federal, state and local services and programs are coordinated and integrated?
Title I funds reviewed monthly with Title I Advisor Amanda RiceDeborah Holley
August 2012-June 2013

School Performance Plan for George Washington Elementary School 65 of 69
Title 1 Schoolwide StrategiesPerson(s)
ResponsibleTimeline Title I Funding
Special Education and Service Providers will meet monthly with the principal to review students serviced and progress of each student.
Amanda Rice, principalTobietter Caldwell, ITA, resource teachers
August 2012-June 2013
$53,000

School Performance Plan for George Washington Elementary School 66 of 69
Appendix 5: School Family Council SANE
√ This page must be attached to the SPP as SANE.
#022 - George Washington Elementary School
The School Performance Plan has been reviewed and approved by the School Family Council as indicated by the signatures below:
Name Signature Position Date
Amanda P. Rice Principal
Nakia Jones Teacher 1
Nicole Doctorick Teacher 2
Donna Benford Student Support Service Provider
Deborah Jones Classified Staff
Mechelle Laster Paraprofessional
Ms. Bettima Shomo Parent 1
Mr. Logan Parent 2
Ms. Charlotte Watson Parent 3
Brian Sturdivant Community Representative 1
MarkMontgomery Community Representative 2

School Performance Plan for George Washington Elementary School 67 of 69
Appendix 6: School Update Sign-Off
√ Please press “Save Data” after checking the appropriate box for each step.
#022 - George Washington Elementary School
School Update Sign-Off:
[X] Initial Draft Submitted by May 11
[X] Peer Review Input Entered by June 29
[X] SPP Edits Submitted by July 15
[X] Check Point 1: Start of School Year Update Completed
[X] Check Point 2: October 31 Updated Completed
[ ] Check Point 3: January 15 Update Completed
[ ] Check Point 4: April 15 Update Completed
School Performance Plan for George Washington Elementary School 68 of 69
Appendix 7: Executive Director Review Sign-Off
√ Please press “Save Data” after checking the appropriate box for each step.
#022 - George Washington Elementary School
Executive Review Sign-Off:
[ ] Check Point 1: Start of School Year Update Completed by September 15
[ ] Check Point 2: October 31 Updated Completed
[ ] Check Point 3: January 15 Update Completed
[ ] Check Point 4: April 15 Update Completed

School Performance Plan for George Washington Elementary School 69 of 69
Appendix 8: Common Core State Standards School Transition Plan
Our School’s Transition Plan for the New Maryland Common Core State Curriculum
#022 - George Washington Elementary School
By June 2013, EEA teams will:
Outcome #1: Facilitate opportunities for school staff to navigate the curriculum toolkits using English Language Arts model units and model lessons and resources to support CCSC implementation.
Outcome #2: Facilitate opportunities for school staff to navigate the curriculum toolkits using Mathematics model units and model lessons and resources, to support CCSC implementation
Outcome #3: Create and deliver professional development that increases the skills and knowledge of school staff in the history/social studies, science and technology literacy standards to support CCSC implementation
Outcome #4: Create and deliver professional development that increases the skills and knowledge of school staff in the Maryland STEM Standards of Practice and Frameworks
Outcome #5: Provide to school staff PARCC assessment development, design and timeline as available
Outcome #What specific
activities are we goingto include?
Who are the identified faculty
members involved?
What resources are needed to
implement?
Who is leadteam memberresponsible?
Whatis timeframe?
Howwill outcome
be measured?
By checking this box, I confirm that my school’s Common Core State Standards Transition Plan is complete.

Office of Federal Programs/Title I School Performance Plan Feedback
School Name and Number:__George Washington ES__________________ Date:__9/7/12____ Title I Reviewer:__D. Holley__________________
1
Title I Schoolwide Component Location in SPP
Observation Points Yes/No
Comments
Relevant data is presented. Yes
Subgroup performance is discussed. YesRoot causes are identified. No The contributing factors for areas identified
under “Needs” were not provided. Discussion was futuristic.
1. A comprehensive needs assessment of the entire school based on information which includes the achievement of children in relation to the State academic content standards and the State student academic achievement standards. [Section 1114(b)(1)(B)]
Step 1: Data ChartsStep 2: Data Analysis and Prioritized Needs Priorities are aligned to the data
discussion.Yes
SBR strategies are identified. Yes
SBR strategies are aligned with priorities and area(s) of need.
Yes
Extended learning opportunities have been identified.
Yes
Schoolwide Reform Strategies that - Provide opportunities for all children to meet the State’s proficient and advanced levels of student academic achievement; Use effective methods and instructional strategies that are based on scientifically based research (SBR) that… (A) strengthen the core academic program (B) increases the amount and quality of learning time (before/after-school, summer programs, extended school year)(C) include strategies to address the needs of all children, but particularly the needs of low-achieving students and those at risk of not meeting state standards;(D) address how the school will determine if such needs have been met. [Section 1114(b)(1)(C)]
Step 4: Strategies for each goalAppendix 2: #1, #2, #3, #5
Strategies to identify and support the academic needs of struggling students have been identified.
Yes
Strategies to retain HQ teachers are identified.
Yes3. Instruction by Highly Qualified Teachers (Teachers and paraprofessionals meet highly qualified requirements; parents are aware of the highly qualified
Appendix 2: #4 A process for parent notification is No Please add a statement in attachment 2,

Office of Federal Programs/Title I School Performance Plan Feedback
School Name and Number:__George Washington ES__________________ Date:__9/7/12____ Title I Reviewer:__D. Holley__________________
2
Title I Schoolwide Component Location in SPP
Observation Points Yes/No
Comments
status of all teachers. All teachers are assigned to the areas in which they are qualified to teach.)[Section 1114(b)(1)(C)]
provided.* question #4, on how the school will notify parents if their children’s teacher is non-HQ.
HQ PD is planned for all staff. Yes Please include activities for para-educators.4. High Quality and Ongoing Professional Development for… Teachers , Principals, Paraprofessionals[Section1114(b)(1)(D)]
Step 4: PD strategies for each goal
PD will build teacher capacity to implement high yield strategies.
Yes
5. Strategies to Attract High-Quality Highly Qualified Teachers to “High-Need” Schools[Section 1114(b)(1)(E)]
Appendix 2: #4
Strategies to recruit and retain HQ teachers are identified.
Yes
Strategies to build parents’ capacity for helping students improve performance are provided.
Yes6. Strategies to Increase Parent Involvement [Section1114(b)(1)(F)]
Appendix 1 & Step 4: Family & community engagement strategies under each goal
The Parent Involvement Plan works as a stand-alone document that informs parents of planned activities.
Yes
7. Plans for Assisting Preschool Children in the Transition from Early Childhood Programs to Elementary School Programs. [Section1114(b)(1)(G)]
Appendix 2: #6
Transition plans for supporting students and their families are identified.
Yes
A plan for implementing collaborative planning is provided.
Yes8. Measures to Include Teachers in Decisions Regarding the Use of Academic Assessments[Section1114(b)(1)(H)]
Appendix 2: #7
A plan to ensure that collaborative planning occurs is provided.
Yes
9. Activities to Ensure that Students Having Difficulty Mastering Proficient or Advanced Levels of Academic
Appendix 2: #2, #3 Specific interventions are identified
Yes

Office of Federal Programs/Title I School Performance Plan Feedback
School Name and Number:__George Washington ES__________________ Date:__9/7/12____ Title I Reviewer:__D. Holley__________________
3
Title I Schoolwide Component Location in SPP
Observation Points Yes/No
Comments
Achievement Standards Are Provided Timely Additional Assistance[Section1114(b)(1)(I)]
to support struggling students.
The use of federal, local, and other funding sources is specified.
No All funding sources (including grants) should be mentioned and a statement about how each supports the school program should be provided.
10. Coordination and Integration of Federal, State, and local services and programs.[Section 1114(b)(1)(J)]
Appendix 2: #8
Details on how funding is coordinated and integrated to provide the total education program are provided.
Yes The response should indicate FSF provides…..; Title I funds are used to ……..; and our partnership with ……. provides……., as an example.
*Principals will need to add this information in the Title I schoolwide attachment, #4.

Cycle One of Professional LearningSchool: George Washington Elementary School #022
School Goal: There will be a school-wide increase ( from _________% to 80 %) by students in the area of Inferences and Drawing Conclusions by June 2013
Cycle 1
Input Training SafePractice
Professional Reading ObservationsCoaching/Feedback
TeamDiscussions
LASW/Feedback
Assessment Targeted Learning Walks
Week 1
8/21-8/24
Job Embedded PD
-Explicit Teaching (Marzano)-Reading LP-Intervention Hour-Reading A-Z-Scope and Sequence-Analyzing Data
August 27-September 7
8/27-9/7
Daily practice and integration of the highly effective strategies discussed during PD sessions. New professional readings/videos/websites, emailed and used during collaborative meetings.
Administrative walk through in order to collect base-line data regarding teachers building reading stamina thru the use of explicit teaching techniques.
Collaborative planning during the instructional day; per daily instructional schedule
Informal ObservationsLearning Walk Feedback ( Target Grade : ___)ILT Observations and Feedback, SMART Goal Setting
Week 2
8/27-8/31
-How cooperative learning fits into explicit teaching (Marzano)
August 27- September 7
Daily practice and integration of the highly effective strategies discussed during PD sessions. New professional readings/videos/websites, emailed and used during collaborative meetings.
Administrative walk through in order to collect base-line data regarding teachers building reading stamina thru the use of explicit teaching techniques.
Collaborative planning during the instructional day; per daily instructional schedule
Informal ObservationsLearning Walk Feedback ( Target Grade: ___)ILT Observations and Feedback, SMART Goal Setting
Week 3
9/3-9/7
Job Embedded PD-Differentiation during SR/WS
September 3-September 14
Daily practice and integration of the highly effective strategies discussed during PD sessions. New professional readings/videos/websites, emailed and used during collaborative meetings.
Administrative walk through in order to collect base-line data regarding teachers building reading stamina thru the use of explicit teaching techniques.
Collaborative planning during the instructional day; per daily instructional schedule
Informal ObservationsLearning Walk Feedback (Target Grade: ___)ILT Observations and Feedback, SMART Goal Setting
Week 4
9/10-9/14
Job Embedded PD
-Analyzing Student work
September 10-September 21
Daily practice and integration of the highly effective strategies discussed during PD sessions. New professional readings/videos/websites, emailed and used during collaborative meetings.
Administrative walk through in order to collect base-line data regarding teachers building reading stamina thru the use of explicit teaching techniques.
Collaborative planning during the instructional day; per daily instructional schedule
Informal ObservationsLearning Walk Feedback(Target Grade:____)ILT Observations and Feedback, SMART Goal Setting
Week 5
9/17-21
Job Embedded PD
-Revisit intervention
hour
September 17-September 28
Daily practice and integration of the highly effective strategies discussed during PD sessions. New professional readings/videos/websites, emailed and used during collaborative meetings.
Administrative walk through in order to collect base-line data regarding teachers building reading stamina thru the use of explicit teaching techniques.
Collaborative planning during the instructional day; per daily instructional schedule
Informal ObservationsLearning Walk Feedback(Target Grade:___)ILT Observations and Feedback, SMART Goal Setting
Week 6
9/24-9/28
PLC -Revisit
Reading A to Z
September 24-October 5
Daily practice and integration of the highly effective strategies discussed during PD sessions. New professional readings/videos/websites, emailed and used during collaborative meetings.
Administrative walk through in order to collect base-line data regarding teachers building reading stamina thru the use of explicit teaching techniques.
Collaborative planning during the instructional day; per daily instructional schedule
Informal ObservationsLearning Walk Feedback (Target Grade:____)ILT Observations and Feedback, SMART Goal Setting
Week 7
10/1-10/5
Job Embedded PD
-Scope and Sequence for next quarter
October 1-October 12
Daily practice and integration of the highly effective strategies discussed during PD sessions. New professional readings/videos/websites, emailed and used during collaborative meetings.
Administrative walk through in order to collect base-line data regarding teachers building reading stamina thru the use of explicit teaching techniques.
Collaborative planning during the instructional day; per daily instructional schedule
Informal ObservationsLearning Walk Feedback: ( Target Grade: ____)ILT Observations and Feedback, SMART Goal Setting
Week 8
10/8-10/12
PLC -Reflect and
revisit areas of improvement
October 8-October 19
Daily practice and integration of the highly effective strategies discussed during PD sessions. New professional readings/videos/websites, emailed and used during collaborative meetings.
Administrative walk through in order to collect base-line data regarding teachers building reading stamina thru the use of explicit teaching techniques.
Collaborative planning during the instructional day; per daily instructional schedule
Informal ObservationsLearning Walk Feedback: ILT Observations and FeedbackSMART Goal Setting

Professional Learning Cycle 1 Cycle One of Professional Learning
School: George Washington Elementary School #022School Goal: There will be a school-wide increase ( from _________% to 80 %) by students in the area of responding to Math Word Problems by June
2013.
Cycle 1
Input Training SafePractice
Professional Reading ObservationsCoaching/Feedback
TeamDiscussions
LASW/Feedback
Assessment Targeted Learning Walks
Week 1
8/21-8/24
Job Embedded PD
-Explicit Teaching (Marzano)-Math LP
-Math Scope and Sequence-Data Links
August 27-September 7
Daily practice and integration of the highly effective strategies discussed during PD sessions. Do The Math – Intervention Materials by Burns Solving for Why – Tapper/Burns
Administrative walk through in order to collect base-line data regarding teachers building reading stamina thru the use of explicit teaching techniques.
Collaborative planning during the instructional day; per daily instructional schedule
Informal ObservationsLearning Walk FeedbackILT Observations and Feedback, SMART Goal Setting
Week 2
8/27-8/31
PLC
Differentiation through small
groups
August 27-September 7
Daily practice and integration of the highly effective strategies discussed during PD sessions. Do The Math – Intervention Materials by Burns Solving for Why – Tapper/Burns
Administrative walk through in order to collect base-line data regarding teachers building reading stamina thru the use of explicit teaching techniques.
Collaborative planning during the instructional day; per daily instructional schedule
Informal ObservationsLearning Walk FeedbackILT Observations and Feedback, SMART Goal Setting
Week 3
9/3-9/7
Job Embedded PD
(Marzano) High Yield Strategy: Identifying similarities and differences
September 3-September 14
Daily practice and integration of the highly effective strategies discussed during PD sessions. Do The Math – Intervention Materials by Burns Solving for Why – Tapper/Burns
Administrative walk through in order to collect base-line data regarding teachers building reading stamina thru the use of explicit teaching techniques.
Collaborative planning during the instructional day; per daily instructional schedule
Informal ObservationsLearning Walk FeedbackILT Observations and Feedback, SMART Goal Setting
Week 4
9/10-9/14
PLC
Analyze data
September 10-September 21
Daily practice and integration of the highly effective strategies discussed during PD sessions. Do The Math – Intervention Materials by Burns Solving for Why – Tapper/Burns
Administrative walk through in order to collect base-line data regarding teachers building reading stamina thru the use of explicit teaching techniques.
Collaborative planning during the instructional day; per daily instructional schedule
Informal ObservationsLearning Walk FeedbackILT Observations and Feedback, SMART Goal Setting
Week 5
9/17-9/21
Job Embedded PD
Using manipulatives
September 17-September 28
Daily practice and integration of the highly effective strategies discussed during PD sessions. Do The Math – Intervention Materials by Burns Solving for Why – Tapper/Burns
Administrative walk through in order to collect base-line data regarding teachers building reading stamina thru the use of explicit teaching techniques.
Collaborative planning during the instructional day; per daily instructional schedule
Informal ObservationsLearning Walk FeedbackILT Observations and Feedback, SMART Goal Setting
Week 6
9/24-9/28
PLC
Revisit differentiation
September 24-October 5
Daily practice and integration of the highly effective strategies discussed during PD sessions. Do The Math – Intervention Materials by Burns Solving for Why – Tapper/Burns
Administrative walk through in order to collect base-line data regarding teachers building reading stamina thru the use of explicit teaching techniques.
Collaborative planning during the instructional day; per daily instructional schedule
Informal ObservationsLearning Walk FeedbackILT Observations and Feedback, SMART Goal Setting
Week 7
10/1-10/5
Job Embedded PD
Scope and Sequence for
second quarter
October 1-October 12
Daily practice and integration of the highly effective strategies discussed during PD sessions. Do The Math – Intervention Materials by Burns Solving for Why – Tapper/Burns
Administrative walk through in order to collect base-line data regarding teachers building reading stamina thru the use of explicit teaching techniques.
Collaborative planning during the instructional day; per daily instructional schedule
Informal ObservationsLearning Walk FeedbackILT Observations and Feedback, SMART Goal Setting
Week 8
10/8-10/12
PLC
Reflection and revisit areas of improvement
October 8-October 19
Daily practice and integration of the highly effective strategies discussed during PD sessions. Do The Math – Intervention Materials by Burns Solving for Why – Tapper/Burns
Administrative walk through in order to collect base-line data regarding teachers building reading stamina thru the use of explicit teaching techniques.
Collaborative planning during the instructional day; per daily instructional schedule
Informal ObservationsLearning Walk FeedbackILT Observations and FeedbackSMART Goal Setting

Cycle One of Professional LearningSchool: George Washington Elementary School #022
School Goal: There will be a school-wide increase ( from _________% to 80 %) by June 2013 in student Writing Skills.
Cycle 1
Input Training
SafePractice
Professional Reading ObservationsCoaching/Feedback
TeamDiscussions
LASW/Feedback
Assessment Targeted Learning Walks
Week 1
8/21-8/24
Job Embedded
PD
Components of a Writing
LP
Scope and Sequence
How to incorporate writing cross the curriculums
August 27-September 7
Daily practice and integration of the highly effective strategies discussed during PD sessions. New professional readings/videos/websites, emailed and used during collaborative meetings.
Administrative walk through in order to collect base-line data regarding teachers building reading stamina thru the use of explicit teaching techniques.
Collaborative planning during the instructional day; per daily instructional schedule; peer coaching ( teams to develop schedule during meetings)
Informal ObservationsLearning Walk FeedbackILT Observations and Feedback, SMART Goal Setting
Week 2
8/27-8/31
PLC -High Yield Strategy: Summarizing and Notetaking (Marzano)
August 27-September 7
Daily practice and integration of the highly effective strategies discussed during PD sessions. New professional readings/videos/websites, emailed and used during collaborative meetings.
Teacher – Led Lesson study, to systematically examine their practice, with the goal of becoming more
Collaborative planning during the instructional day; per daily instructional schedule
Informal ObservationsLearning Walk FeedbackILT Observations and Feedback, SMART Goal Setting
Week 3
9/3-9/7
Job Embedded
PD
The Writing Process
September 3-September 14
Daily practice and integration of the highly effective strategies discussed during PD sessions. New professional readings/videos/websites, emailed and used during collaborative meetings.
Administrative walk through in order to collect base-line data regarding teachers building reading stamina thru the use of explicit teaching techniques.
Collaborative planning during the instructional day; per daily instructional schedule
Informal ObservationsLearning Walk FeedbackILT Observations and Feedback, SMART Goal Setting
Week 4
9/10-9/14
PLC
Different-iation in Writing
September 10-September 21
Daily practice and integration of the highly effective strategies discussed during PD sessions. New professional readings/videos/websites, emailed and used during collaborative meetings.
Administrative walk through in order to collect base-line data regarding teachers building reading stamina thru the use of explicit teaching techniques.
Collaborative planning during the instructional day; per daily instructional schedule
Informal ObservationsLearning Walk FeedbackILT Observations and Feedback, SMART Goal Setting
Week 5
9/17-9/21
Job Embedded
PDAnalyze
student work
September 17-September 28
Daily practice and integration of the highly effective strategies discussed during PD sessions. New professional readings/videos/websites, emailed and used during collaborative meetings.
Administrative walk through in order to collect base-line data regarding teachers building reading stamina thru the use of explicit teaching techniques.
Collaborative planning during the instructional day; per daily instructional schedule
Informal ObservationsLearning Walk FeedbackILT Observations and Feedback, SMART Goal Setting
Week 6
9/24-9/28
PLC Revisit high
yield strategy:
summarize-ing and
notetaking (Marzano)
September 24-October 5
Daily practice and integration of the highly effective strategies discussed during PD sessions. New professional readings/videos/websites, emailed and used during collaborative meetings.
Administrative walk through in order to collect base-line data regarding teachers building reading stamina thru the use of explicit teaching techniques.
Collaborative planning during the instructional day; per daily instructional schedule
Informal ObservationsLearning Walk FeedbackILT Observations and Feedback, SMART Goal Setting
Week 7
10/1-10/5
Job Embedded
PD
Scope and Sequence for next quarter
October 1-October 12
Daily practice and integration of the highly effective strategies discussed during PD sessions. New professional readings/videos/websites, emailed and used during collaborative meetings.
Administrative walk through in order to collect base-line data regarding teachers building reading stamina thru the use of explicit teaching techniques.
Collaborative planning during the instructional day; per daily instructional schedule
Informal ObservationsLearning Walk FeedbackILT Observations and Feedback, SMART Goal Setting
Week 8
10/8-10/12
PLC
Reflect and revisit areas of improve-
ment
October 8-October 19
Daily practice and integration of the highly effective strategies discussed during PD sessions. New professional readings/videos/websites, emailed and used during collaborative meetings.
Administrative walk through in order to collect base-line data regarding teachers building reading stamina thru the use of explicit teaching techniques.
Collaborative planning during the instructional day; per daily instructional schedule
Informal ObservationsLearning Walk FeedbackILT Observations and FeedbackSMART Goal Setting
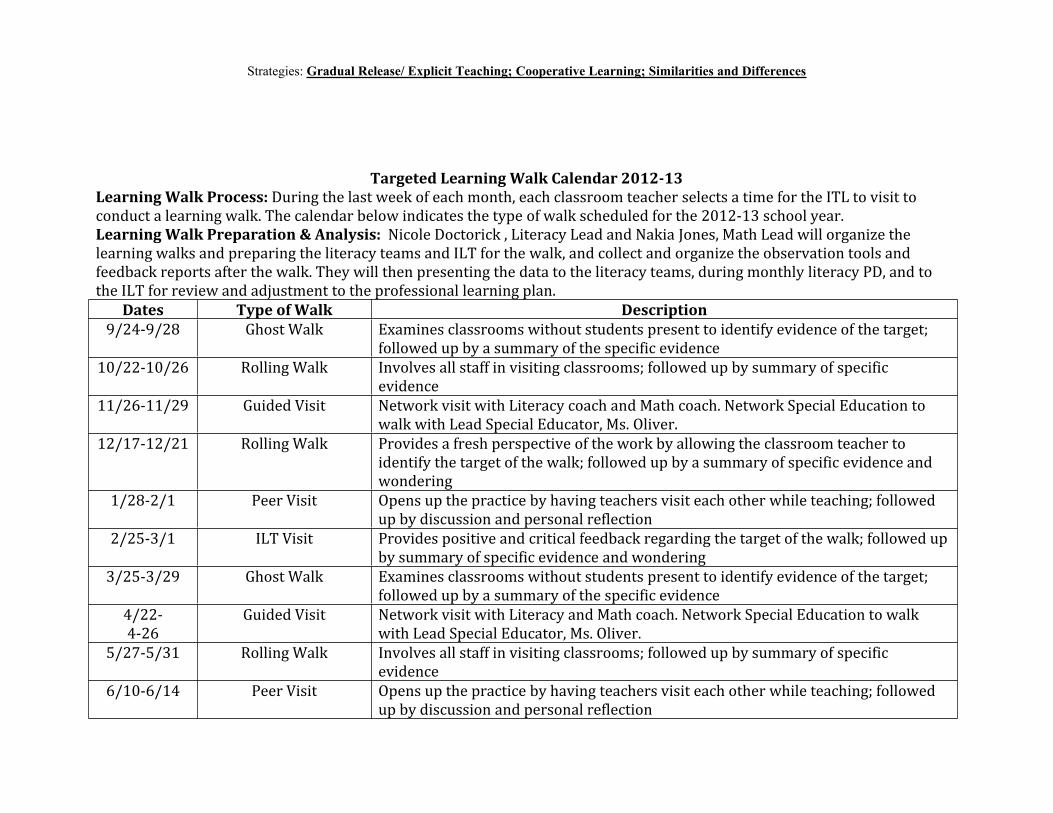
Strategies: Gradual Release/ Explicit Teaching; Cooperative Learning; Similarities and Differences
Targeted Learning Walk Calendar 2012-13Learning Walk Process: During the last week of each month, each classroom teacher selects a time for the ITL to visit to conduct a learning walk. The calendar below indicates the type of walk scheduled for the 2012-13 school year.Learning Walk Preparation & Analysis: Nicole Doctorick , Literacy Lead and Nakia Jones, Math Lead will organize the learning walks and preparing the literacy teams and ILT for the walk, and collect and organize the observation tools and feedback reports after the walk. They will then presenting the data to the literacy teams, during monthly literacy PD, and to the ILT for review and adjustment to the professional learning plan.
Dates Type of Walk Description9/24-9/28 Ghost Walk Examines classrooms without students present to identify evidence of the target;
followed up by a summary of the specific evidence10/22-10/26 Rolling Walk Involves all staff in visiting classrooms; followed up by summary of specific
evidence11/26-11/29 Guided Visit Network visit with Literacy coach and Math coach. Network Special Education to
walk with Lead Special Educator, Ms. Oliver.12/17-12/21 Rolling Walk Provides a fresh perspective of the work by allowing the classroom teacher to
identify the target of the walk; followed up by a summary of specific evidence and wondering
1/28-2/1 Peer Visit Opens up the practice by having teachers visit each other while teaching; followed up by discussion and personal reflection
2/25-3/1 ILT Visit Provides positive and critical feedback regarding the target of the walk; followed up by summary of specific evidence and wondering
3/25-3/29 Ghost Walk Examines classrooms without students present to identify evidence of the target; followed up by a summary of the specific evidence
4/22-4-26
Guided Visit Network visit with Literacy and Math coach. Network Special Education to walk with Lead Special Educator, Ms. Oliver.
5/27-5/31 Rolling Walk Involves all staff in visiting classrooms; followed up by summary of specific evidence
6/10-6/14 Peer Visit Opens up the practice by having teachers visit each other while teaching; followed up by discussion and personal reflection


![[XLS] Seniority Tie Breaker List 2012.1.xls · Web viewNATHAN SOLOMON NADINE THOMAS-ROSS NOLAND THOMAS NATHAN TEAL NELS VASENDEN NAKIA WHITE MAALIK WALKER NYREE WATSON-MOSS NANCY](https://static.fdocuments.us/doc/165x107/5ad472807f8b9a1a028be0d8/xls-seniority-tie-breaker-list-20121xlsweb-viewnathan-solomon-nadine-thomas-ross.jpg)