ELEMENTARY EDUCATION IN INDIA · Programme (DPEP) in 1994, as a result of which the District...
39
Transcript of ELEMENTARY EDUCATION IN INDIA · Programme (DPEP) in 1994, as a result of which the District...


National University of Educational Planning and Administration17-B, Sri Aurobindo Marg, New Delhi 110016
FLA
SH
STA
TISTIC
S
G
I
AN
N
ND
N
A
A
L
D
P
M
L
IN
A
I
N
S
O
T
I
R
T
A
A
T
C
I
U
ON
D
E
F
N
O
A
Y
T
T
I
I
O
S
N
R
A
E
L
VIU
N
;yk|
o
j
f
k
o
"V
'
hª
o
;
f
'
u
kfS
l
{
kk
kd'zi
a
;o
kts , ku
*
ELEMENTARY EDUCATION IN INDIAProgress towards UEE
DISE 2005-06

The data presented and indicators constructed in the document are entirely based upon the data as received from the States as on 30th September, 2005. Published in 2007 by National University of Educational Planning and Administration 17-B, Sri Aurobindo Marg New Delhi – 110016, INDIA and Department of School Education and Literacy Ministry of Human Resource Development Government of India
© NUEPA 2007
Design and Layout by Publication Unit, NUEPA
Printed at Anil Offset & Packagings (P) Limited 35-UB, Jawahar Nagar Delhi – 110007

Foreword
Development of a sound information system is critical for successful monitoring and implementation of any programme, particularly in social sectors. Design of a school information system was, therefore, accorded priority from the very beginning of the District Primary Education Programme (DPEP) in 1994, as a result of which the District Information System for Education (DISE) was developed by the National University of Educational Planning and Administration (NUEPA).
Importance of an Educational Management Information System (EMIS) was reiterated when Sarva Shiksha Abhiyan (SSA) was launched in 2001. SSA guidelines envisage development of a community-owned and transparent EMIS, and preparatory activities of the programme included substantial strengthening of MIS infrastructure in the States and UTs of the country.
I am happy to note that all the States & UTs of the country have now adopted DISE. The present volume presents DISE Flash Statistics: Elementary Education in India: Progress towards UEE for the year 2005-06. I am confident that the state-specific indicators presented on different aspects of UEE in the volume will be used in planning for good quality elementary education, and that data users, researchers and development planners interested in the Indian education system will find the volume useful. Based on the DISE data, an attempt has also been made for the first time to develop an Educational Development Index (EDI) which may be helpful in deciding future course of investment on elementary education in the country.
I must take this opportunity to thank UNICEF, Delhi, for consistently supporting EMIS activities since 1994, as well as NUEPA, especially Prof. Arun C. Mehta and his team, for bringing out the present publication.
New Delhi January, 2007

From the Vice-Chancellor’s Desk
It pleases me to present the DISE Flash Statistics: Elementary Education in India: Progress towards UEE which is based upon the 2005-06 data. Besides launching of one million plus School Report Cards, we have recently brought out significant publications namely Elementary Education in India: Where Do We Stand: District Report Cards, State Report Cards, and Analytical Report for the year 2004-05 which contain a large number of indicators encompassing different aspects of universalisation of elementary education. The state-specific indicators that are being disseminated through the present publication are very rich in contents. In addition, we are also going to release shortly the District and State Report Cards as well as Analytical Report for the year 2005-06.
NUEPA is committed to provide professional and technical support to all the States and UTs. This has helped in improving the capacities of both state and district level MIS officers to a great extent. Further, we wish to intensify our capacity building activities in the years to come.
I thank the DISE team led by Prof. Arun C. Mehta for bringing out this publication which is of great significance. I hope that the researchers, policy makers, administrators and planners will find the publication both informative and useful.
New Delhi January, 2007

Acknowledgements
For the last several years, NUEPA has been actively involved in strengthening the Educational Management Information System (EMIS) in the country. The DISE Flash Statistics: Elementary Education in India: Progress towards UEE is based on the data received from all the States & UTs of the country for the year 2005-06. Besides an Educational Development Index, the publication presents not only state-specific indicators but also brings in many new dimensions of elementary education into focus. It incorporates key indicators on all aspects of universalisation of elementary education in case of all the States & UTs of the country.
The Flash Statistics: 2005-06 is based on the data received from as many as 1.12 million schools spread over 604 districts across 35 States & UTs. The study of this magnitude cannot be completed without the active involvement and participation of the EMIS professionals at the national and sub-national levels. I am extremely thankful to all the State Project Directors, the state level EMIS coordinators and district level programmers and data entry operators for timely supply of data.
I take this opportunity to thank UNICEF, Delhi, in particular Mr. Samphe Lhalungpa, Chief (Education) for consistently supporting EMIS activities ever since the inception of DISE and Ms Vrinda Sarup, Joint Secretary, Department of School Education & Literacy, Government of India, who played a crucial role in facilitating the implementation of DISE in various states.
I am thankful to Prof Ved Prakash, Vice-Chancellor, NUEPA, for his consistent encouragement and support.
I am also thankful to Shri M. K. Talukdar, Chief Consultant (MIS), TSG for providing professional support to states.
The contribution of Shri Naveen Bhatia, Computer Programmer and Shri Shalender Sharma, Project Associate Fellow, in database management, is gratefully acknowledged.
I am also thankful to Shri S. A. Siddiqui and Ms Alka Mishra for their efficient assistance and colleagues in the Publication Unit especially Shri Pramod Rawat, Deputy Publication Officer for timely bringing out the publication.
I hope that this publication will be of value to education planners, policy formulators and researchers. Any suggestions for improvement are most welcome. More comprehensive data on elementary education will be available soon through our forthcoming publictions based on the DISE 2005-06 data.
Arun C. Mehta [email protected]

DISE 2005-06: Key Indicators (As on 30th September 2005)
Number of Districts Covered under DISE
Total Number of Schools Ratio of Primary to Upper Primary Schools/Sections
Average Number of Instructional Days
Sl No. State/UT 2003-04 2004-05 2005-06 2003-04 2004-05 2005-06 2003-04 2004-05 2005-06 2003-04 2004-05 2005-06
1 A & N Islands - - 2 - - 287 - - 2.20 - - 192 2 Andhra Pradesh 23 23 23 84579 92768 94984 3.10 2.53 2.42 209 212 212 3 Arunachal Pradesh - 15 15 - 2224 3070 - 3.57 4.01 - 184 183 4 Assam 23 23 23 39459 40175 40215 3.25 3.25 3.24 219 230 233 5 Bihar 37 37 37 52202 53275 53778 4.52 3.60 3.18 214 219 212 6 Chandigarh 1 1 1 164 179 185 1.14 1.17 1.15 222 208 207 7 Chhattisgarh 16 16 16 35448 38607 51347 3.32 3.20 2.51 203 214 190 8 Dadra & Nagar Haveli - - 1 - - 228 - - 2.39 - - 221 9 Daman & Diu - - 2 - - 101 - - 1.44 - - 198
10 Delhi - 9 9 - 4267 4542 - 1.67 1.68 - 203 205 11 Goa - - 2 - - 1345 - - 3.02 - - 205 12 Gujarat 25 25 25 34786 36315 37256 1.51 1.50 1.47 217 210 209 13 Haryana 17 19 19 11342 13199 13559 2.54 2.08 2.06 201 203 204 14 Himachal Pradesh 12 12 12 14964 15676 16013 2.94 2.69 2.59 230 231 228 15 Jammu & Kashmir - 12 14 - 15925 19451 - 2.69 2.41 - 191 196 16 Jharkhand 22 22 22 22010 22199 36211 4.51 3.78 3.97 207 207 213 17 Karnataka 27 27 27 51546 53461 54085 1.98 1.97 1.98 224 225 92 * 18 Kerala 14 14 14 11988 11684 11381 1.84 1.83 1.83 183 181 181 19 Lakshadweep - - 1 - - 30 - - 1.59 - - 208 20 Madhya Pradesh 45 45 48 86327 111727 121335 2.33 2.77 2.81 180 188 192 21 Maharashtra 35 35 35 77381 76581 84286 1.93 1.84 1.75 214 199 208 22 Manipur - - 9 - - 3849 - - 2.87 - - 208 23 Meghalaya 7 7 7 6229 8196 8128 4.24 3.91 3.73 211 194 181 24 Mizoram 8 8 8 2274 2346 2521 1.64 1.56 1.51 194 191 193 25 Nagaland 8 8 8 2271 2356 2514 2.60 2.52 2.40 186 185 188 26 Orissa 30 30 30 49063 50849 51881 3.46 2.88 2.72 215 218 200 27 Pondicherry - 4 4 - 563 616 - 1.76 1.72 - 192 164 28 Punjab 17 17 17 9949 21940 20298 2.45 2.14 2.29 223 199 214 29 Rajasthan 32 32 32 78158 87691 94319 3.07 2.81 2.57 186 191 168 30 Sikkim 4 4 4 984 1070 1097 2.92 3.18 3.31 170 178 213 31 Tamil Nadu 29 29 30 45952 50436 51574 2.88 2.66 2.69 216 217 217 32 Tripura 4 4 4 3143 3456 3548 2.69 2.02 2.07 231 228 241 33 Uttar Pradesh 70 70 70 134225 142856 161869 4.12 3.63 3.03 210 194 200 34 Uttaranchal 13 13 13 17471 18628 18907 3.30 2.94 2.93 211 212 208 35 West Bengal 20 20 20 59556 59165 59223 5.33 5.30 5.28 218 222 233
All Districts 539 581 604 931471 1037814 1124033 2.87 2.56 2.57 208 206 204
* Complete data not reported
DISE 2005-2006: Flash Statistics 1

Number of Schools Without Building
% of Enrolment in Schools without Building
% Distribution of Schools having Pucca Building
% of Single-Classroom Schools
Sl No. State/UT 2003-04 2004-05 2005-06 2003-04 2004-05 2005-06 2003-04 2004-05 2005-06 2003-04 2004-05 2005-06
1 A & N Islands - - 3 - - 0.29 - - 42.20 - - 3.14 2 Andhra Pradesh 5795 5554 4046 4.23 4.07 1.75 70.55 73.97 * 24.62 23.67 24.83 3 Arunachal Pradesh - 17 193 - 2.41 2.63 - 31.41 25.60 - 7.15 19.19 4 Assam 320 306 211 1.22 0.76 0.63 32.18 38.97 44.44 51.03 54.38 52.59 5 Bihar 3096 2799 2148 3.99 3.27 2.40 66.34 67.66 64.78 12.63 11.32 9.62 6 Chandigarh 0 1 1 0.00 0.09 0.09 95.73 91.01 90.27 0.00 0.56 0.00 7 Chhattisgarh 3520 4710 7835 7.50 8.25 8.17 54.06 54.31 54.55 5.58 6.44 5.70 8 Dadra & Nagar Haveli - - 0 - - 0.05 - - 27.63 - - 10.53 9 Daman & Diu - - 0 - - 0.00 - - 97.03 - - 1.98
10 Delhi - 35 46 - 1.25 1.62 - 65.86 64.83 - 0.14 0.13 11 Goa - - 1 - - 0.00 - - 93.68 - - 23.94 12 Gujarat 568 482 495 0.87 0.68 0.51 78.29 76.05 79.50 6.60 5.57 4.24 13 Haryana 14 17 24 1.74 0.86 0.56 90.71 94.47 96.90 9.36 6.21 6.84 14 Himachal Pradesh 411 398 315 1.86 1.38 1.20 60.79 61.27 64.05 6.52 5.41 4.73 15 Jammu & Kashmir - 732 684 - 2.90 1.56 - 57.15 61.66 - 11.98 11.39 16 Jharkhand 813 1017 7896 1.73 1.60 14.29 79.12 79.80 57.10 6.19 4.68 5.51 17 Karnataka 1080 684 558 0.90 0.52 0.71 83.36 85.25 81.81 12.47 12.01 9.71 18 Kerala 5 5 5 0.50 0.44 0.00 67.78 67.26 70.56 0.69 1.68 0.82 19 Lakshadweep - - 0 - - 2.36 - - 59.26 - - 0.00 20 Madhya Pradesh 9255 14061 13347 7.28 8.84 7.63 61.31 60.30 66.16 6.99 8.47 9.39 21 Maharashtra 506 434 334 0.80 0.75 0.27 81.99 77.42 81.74 10.66 7.35 7.29 22 Manipur - - 124 - - 1.43 - - 10.09 - - 2.55 23 Meghalaya 71 165 125 0.82 1.69 1.14 21.41 23.81 26.94 24.98 22.29 18.39 24 Mizoram 0 1 1 0.15 0.00 0.15 11.61 14.15 14.04 0.92 1.41 0.91 25 Nagaland 0 1 0 0.12 0.43 0.00 13.74 20.54 22.28 0.26 0.21 0.20 26 Orissa 1114 1391 956 1.12 1.35 0.89 30.49 30.78 34.91 7.77 7.33 6.74 27 Pondicherry - 4 0 - 2.39 0.19 - 84.01 72.59 - 4.97 3.57 28 Punjab 1 103 81 0.18 0.75 0.47 97.90 92.97 93.37 2.35 3.65 3.47 29 Rajasthan 5991 5522 5712 4.53 3.84 3.08 73.87 78.52 85.63 3.18 3.13 4.27 30 Sikkim 5 7 10 0.68 0.68 0.59 20.96 23.5 26.94 0.51 0.37 1.55 31 Tamil Nadu - 131 21 0.22 0.30 0.01 49.42 51.56 53.00 8.72 7.64 5.24 32 Tripura 0 39 0 0.00 0.17 0.00 30.22 36.86 40.64 11.93 10.42 9.19 33 Uttar Pradesh 1905 1720 731 0.82 0.70 0.30 95.44 94.98 95.22 1.96 2.13 0.97 34 Uttaranchal 497 357 153 3.87 1.76 1.31 79.09 84.53 85.48 2.17 2.49 2.36 35 West Bengal 482 386 308 0.65 0.43 0.34 62.86 63.15 64.55 17.41 17.10 15.04
All Districts 35449 41079 46364 2.20 2.22 2.12 69.29 69.96 70.56 10.94 10.39 9.54 * State reported multiple building blocks
2 Elementary Education in India

Average Number of Classrooms
% Distribution of Schools without Classrooms
% Distribution of Schools without Enrolment
Primary Schools All Schools Sl No. State/UT 2003-04 2004-05 2005-06 2003-04 2004-05 2005-06 2003-04 2004-05 2005-06 2003-04 2004-05 2005-06
1 A & N Islands - - 3.8 - - 7.7 - - 6.62 - - 2.09 2 Andhra Pradesh 2.1 2.5 2.6 3.3 3.9 4.1 13.58 8.37 4.26 3.44 0.33 0.47 3 Arunachal Pradesh - 2.6 2.3 - 4.0 3.6 - 17.13 13.19 - 13.22 11.27 4 Assam 1.5 1.5 1.6 2.1 2.1 2.2 7.18 3.99 2.35 0.10 0.14 1.81 5 Bihar 2.0 2.0 2.0 2.6 2.7 2.7 9.25 8.91 10.36 2.97 2.69 4.65 6 Chandigarh 8.8 8.0 6.8 23.8 22.7 23.8 1.83 5.06 6.49 0.61 4.49 4.32 7 Chhattisgarh 2.6 2.4 2.3 2.8 2.7 2.7 14.75 17.64 20.85 2.91 4.01 6.20 8 Dadra & Nagar Haveli - - 2.0 - - 3.9 - - 12.72 - - 7.89 9 Daman & Diu - - 4.6 - - 6.7 - - 3.96 - - 0.99
10 Delhi - 10.4 8.1 - 16.2 11.9 - 2.84 28.23 - 1.38 0.51 11 Goa - - 2.4 - - 4.3 - - 1.78 - - 0.45 12 Gujarat 2.5 2.5 2.6 4.7 4.8 5.0 4.95 6.06 6.12 2.43 3.95 3.56 13 Haryana 3.3 3.6 3.6 3.7 4.5 4.7 15.79 7.84 5.51 6.39 3.64 3.42 14 Himachal Pradesh 3.0 3.1 3.1 3.5 3.6 3.7 4.43 4.03 3.47 0.57 0.45 0.55 15 Jammu & Kashmir - 2.2 2.3 - 4.1 4.2 - 9.22 6.13 - 0.52 0.90 16 Jharkhand 2.1 2.1 1.5 2.8 2.9 2.4 7.34 7.45 32.18 2.74 3.90 2.35 17 Karnataka 2.2 2.2 2.2 4.4 4.5 4.2 3.91 2.67 11.87 1.69 1.20 14.69 18 Kerala 5.9 5.7 5.6 10.9 10.5 10.1 2.59 3.47 8.13 3.05 5.77 1.72 19 Lakshadweep - - 8.8 - - 12.1 - - 3.33 - - 0.00 20 Madhya Pradesh 2.3 2.1 1.9 2.7 2.4 2.2 22.76 26.83 30.68 7.46 6.25 3.28 21 Maharashtra 3.0 2.3 2.6 5.2 4.1 4.5 2.35 21.10 14.17 2.19 6.85 1.52 22 Manipur - - 3.1 - - 5.2 - - 6.63 - - 1.71 23 Meghalaya 2.4 2.2 2.2 2.8 2.6 2.6 3.15 12.09 15.56 1.78 7.27 13.52 24 Mizoram 4.1 4.0 4.0 4.2 4.1 4.3 0.48 0.47 1.35 0.92 0.77 0.52 25 Nagaland 4.9 5.0 5.1 6.0 6.6 6.6 4.45 2.16 0.04 1.59 1.32 2.15 26 Orissa 2.7 2.6 2.7 3.2 3.2 3.2 4.26 4.60 5.68 1.68 0.87 2.45 27 Pondicherry - 4.1 5.1 - 6.9 8.7 - 3.55 11.36 - 3.37 6.82 28 Punjab 3.7 3.4 3.3 4.6 4.8 4.4 3.73 5.74 5.64 2.13 5.42 5.30 29 Rajasthan 2.3 2.1 2.6 3.4 3.4 4.3 20.63 27.38 10.19 11.73 8.61 0.75 30 Sikkim 4.3 4.1 4.3 6.3 6.2 6.6 10.87 10.84 6.47 6.00 3.64 2.83 31 Tamil Nadu 3.8 3.9 4.2 5.9 5.6 7.0 1.15 1.33 0.49 1.51 0.68 0.18 32 Tripura 3.3 3.1 3.4 4.9 5.0 5.2 0.03 3.56 0.08 0.03 0.09 0.03 33 Uttar Pradesh 3.0 3.0 3.4 3.4 3.4 3.9 1.94 2.93 2.06 2.22 0.67 2.01 34 Uttaranchal 2.6 2.6 2.6 3.0 3.2 3.2 12.58 8.92 7.78 8.23 6.31 6.63 35 West Bengal 2.6 2.7 2.8 3.5 3.7 3.8 6.80 2.17 1.77 2.06 0.68 0.46
All Districts 2.6 2.6 2.7 3.7 3.7 3.8 8.84 10.90 10.45 3.64 3.18 2.92
DISE 2005-2006: Flash Statistics 3

% Distribution of Classrooms having Good Condition
Student-Classroom Ratio Average Number of Teachers
per School % Distribution of Schools
without Teachers Sl No. State/UT 2003-04 2004-05 2005-06 2003-04 2004-05 2005-06 2003-04 2004-05 2005-06 2003-04 2004-05 2005-06 1 A & N Islands - - 54.44 - - 22 - - 10.34 - - 2.09 2 Andhra Pradesh 79.45 76.15 78.48 37 31 29 3.86 5.03 4.87 4.77 1.19 2.16 3 Arunachal Pradesh - 41.25 40.46 - 23 23 - 3.90 3.50 - 14.57 4.89 4 Assam 22.82 23.42 32.43 44 48 44 4.19 3.88 3.98 0.19 0.22 0.44 5 Bihar 49.57 52.22 51.10 84 90 92 3.04 3.10 3.86 2.75 2.89 3.44 6 Chandigarh 88.01 87.94 89.01 27 26 27 20.21 25.23 26.28 3.05 0.56 0.54 7 Chhattisgarh 57.99 59.28 69.34 38 37 35 2.85 2.71 3.30 2.90 4.58 3.25 8 Dadra & Nagar Haveli - - 68.26 - - 45 - - 4.22 - - 7.46 9 Daman & Diu - - 60.80 - - 36 - - 7.13 - - 7.92
10 Delhi - 89.98 89.02 - 30 41 - 15.21 14.15 - 0.84 8.67 11 Goa - - 72.93 - - 24 - - 4.09 - - 1.78 12 Gujarat 80.05 81.44 82.42 40 39 38 5.20 5.26 5.55 2.73 2.54 2.10 13 Haryana 66.47 69.46 73.70 43 37 33 4.09 4.54 4.65 6.92 6.64 4.83 14 Himachal Pradesh 58.00 57.86 62.52 21 20 18 3.40 3.36 3.30 0.72 0.97 1.32 15 Jammu & Kashmir - 55.52 58.50 - 21 19 - 4.47 4.60 - 0.25 0.68 16 Jharkhand 46.02 50.19 55.12 55 59 62 2.71 3.20 3.07 2.18 1.77 0.69 17 Karnataka 74.66 74.19 75.38 35 33 31 4.61 4.26 4.21 2.21 7.17 8.23 18 Kerala 62.19 67.42 68.89 28 27 29 10.15 10.18 10.04 2.67 3.41 2.49 19 Lakshadweep - - 47.23 - - 27 - - 19.83 - - 0.00 20 Madhya Pradesh 65.57 70.41 75.03 45 46 52 3.64 3.38 3.12 2.17 2.28 1.89 21 Maharashtra 79.01 81.79 84.01 34 41 40 6.17 5.89 5.97 1.10 2.48 0.50 22 Manipur - - 30.60 - - 22 - - 6.04 - - 1.01 23 Meghalaya 23.85 28.65 26.32 22 22 21 3.07 3.09 3.13 1.33 2.23 1.32 24 Mizoram 29.78 33.53 42.41 18 20 20 5.23 5.36 5.25 0.31 0.34 0.36 25 Nagaland 25.68 30.09 38.58 26 26 25 8.05 7.77 7.71 1.01 0.93 0.95 26 Orissa 37.30 40.05 45.34 37 36 35 2.90 3.12 3.26 3.72 0.79 0.88 27 Pondicherry - 91.38 92.66 - 32 26 - 8.26 9.55 - 3.91 1.95 28 Punjab 83.36 80.27 78.23 27 26 27 4.30 4.17 3.58 8.09 7.40 7.83 29 Rajasthan 69.41 74.70 76.80 32 34 29 3.33 3.38 3.76 4.74 3.81 1.17 30 Sikkim 34.37 53.40 51.46 17 18 16 6.90 7.18 7.21 4.88 2.15 1.19 31 Tamil Nadu 77.41 80.47 81.62 34 35 27 4.98 4.96 6.43 0.45 0.80 0.11 32 Tripura 45.35 48.81 47.19 42 40 38 8.71 8.81 8.55 0.03 0.00 0.00 33 Uttar Pradesh 69.30 74.52 75.28 56 56 48 2.98 2.81 3.26 1.20 2.70 1.63 34 Uttaranchal 61.49 63.35 63.47 24 23 22 2.78 2.84 2.72 8.82 5.86 6.34 35 West Bengal 39.03 40.81 44.45 61 58 55 3.78 3.93 3.96 1.66 0.52 0.39
All Districts 65.56 68.48 71.03 42 41 39 3.94 4.02 4.19 2.57 5.06 2.07
4 Elementary Education in India

% of Single-Teacher Schools % of Enrolment in Single-Teacher Schools Pupil-Teacher Ratio
Primary Schools All Schools Sl No. State/UT 2003-04 2004-05 2005-06 2003-04 2004-05 2005-06 2003-04 2004-05 2005-06 2003-04 2004-05 2005-06
1 A & N Islands - - 5.92 - - 2.82 - - 0.70 - - 16 2 Andhra Pradesh 11.35 5.73 6.75 6.75 3.16 3.91 3.69 1.55 1.92 32 24 24 3 Arunachal Pradesh - 28.37 48.08 - 30.85 43.27 - 12.29 17.41 - 24 23 4 Assam 12.09 17.49 16.67 12.42 20.56 19.94 8.68 14.1 13.34 23 26 25 5 Bihar 12.81 11.36 8.26 12.68 11.61 8.67 8.29 7.46 5.15 71 78 65 6 Chandigarh 0.00 0.00 0.00 0.00 0.00 0.00 0.00 0.00 0.00 32 23 24 7 Chhattisgarh 16.39 21.86 9.81 12.32 17.31 7.07 8.72 12.08 4.98 38 37 28 8 Dadra & Nagar Haveli - - 14.47 - - 14.60 - - 4.35 - - 41 9 Daman & Diu - - 0.99 - - 0.14 - - 0.05 - - 34
10 Delhi - 0.30 0.31 - 0.10 0.08 - 0.11 0.11 - 32 35 11 Goa - - 31.52 - - 13.75 - - 5.00 - - 25 12 Gujarat 5.04 5.70 3.73 5.50 6.33 4.40 1.44 1.63 0.99 36 36 35 13 Haryana 8.07 6.73 6.50 5.34 4.04 4.04 4.05 2.93 3.00 39 36 33 14 Himachal Pradesh 10.19 8.67 9.72 8.23 6.93 8.48 4.66 4.00 4.69 21 21 20 15 Jammu & Kashmir - 5.16 5.50 - 5.31 6.75 - 1.71 1.83 - 19 18 16 Jharkhand 26.96 16.59 25.70 27.85 16.23 23.81 16.47 8.97 12.98 57 54 48 17 Karnataka 10.41 8.75 8.65 10.61 8.90 9.69 2.21 1.81 2.15 33 35 30 18 Kerala 0.07 0.15 0.08 0.02 0.12 0.00 0.01 0.05 0.02 30 28 29 19 Lakshadweep - - 0.00 - - 0.02 - - 0.00 - - 16 20 Madhya Pradesh 10.97 20.25 25.02 9.11 17.72 22.80 6.59 11.24 15.63 33 32 36 21 Maharashtra 9.15 8.05 7.58 4.03 3.63 3.66 1.40 1.27 1.12 29 28 29 22 Manipur - - 13.54 - - 13.64 - - 5.18 - - 20 23 Meghalaya 11.56 11.96 11.18 10.23 10.71 9.35 6.89 7.00 5.97 20 19 17 24 Mizoram 4.49 3.45 3.77 3.73 3.68 4.23 2.07 2.06 2.29 14 16 17 25 Nagaland 4.01 3.06 2.70 2.53 2.19 1.31 0.83 0.85 0.54 19 22 22 26 Orissa 14.49 14.45 11.45 11.27 11.70 9.35 7.02 6.86 5.36 40 37 35 27 Pondicherry - 2.49 1.46 - 0.00 1.12 - 0.00 0.29 - 27 24 28 Punjab 15.98 12.84 16.20 10.82 10.44 13.53 7.67 6.02 8.13 29 29 33 29 Rajasthan 26.62 26.97 26.17 24.67 27.36 28.76 12.62 13.44 14.45 34 34 33 30 Sikkim 1.63 0.93 1.37 1.27 0.51 0.72 0.65 0.16 0.24 16 15 15 31 Tamil Nadu 7.77 7.77 3.36 4.81 5.10 2.09 2.24 2.26 0.96 40 39 29 32 Tripura 7.70 0.03 1.35 7.87 0.03 1.54 2.41 0.01 0.46 23 22 23 33 Uttar Pradesh 15.11 16.28 8.01 13.32 13.40 3.71 11.88 12.44 4.35 63 68 57 34 Uttaranchal 16.76 19.27 17.65 13.18 16.20 13.93 9.22 11.22 9.52 26 26 26 35 West Bengal 6.91 5.22 5.11 4.32 3.45 3.61 2.70 2.25 2.09 57 55 54
All Districts 12.93 13.36 12.17 11.75 12.58 8.39 7.65 8.28 5.65 39 38 36
DISE 2005-2006: Flash Statistics 5
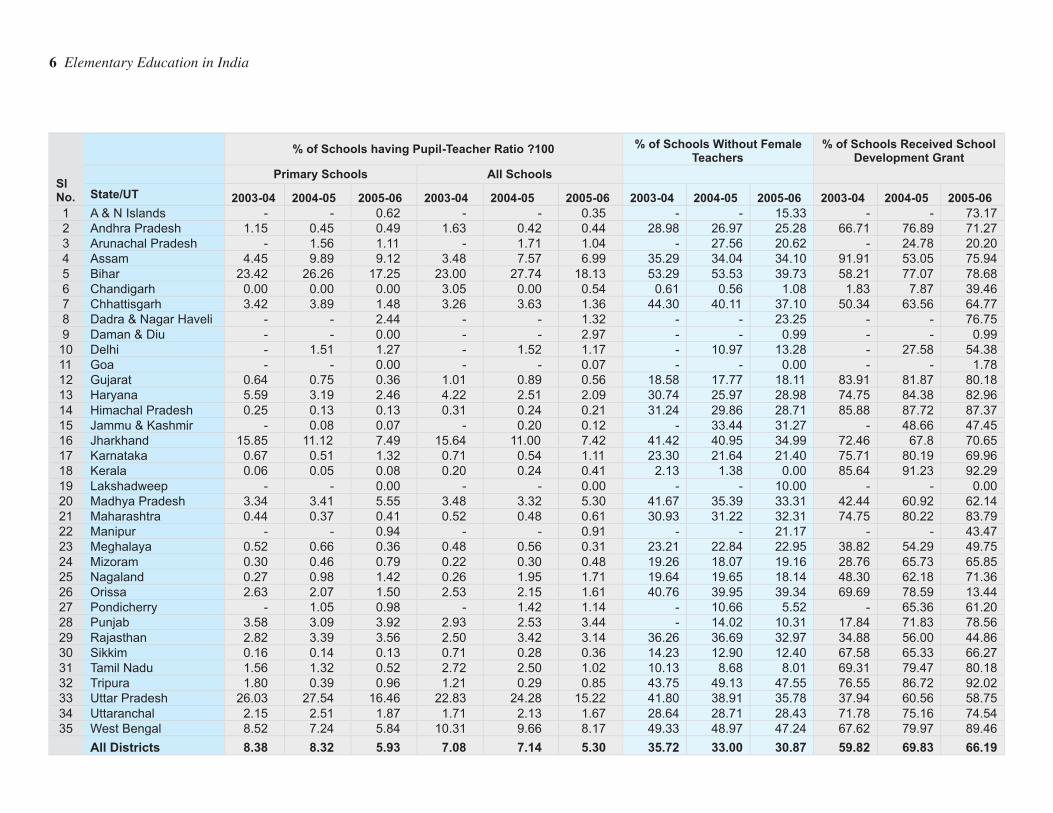
% of Schools having Pupil-Teacher Ratio ?100 % of Schools Without Female Teachers
% of Schools Received School Development Grant
Primary Schools All Schools Sl No. State/UT 2003-04 2004-05 2005-06 2003-04 2004-05 2005-06 2003-04 2004-05 2005-06 2003-04 2004-05 2005-06
1 A & N Islands - - 0.62 - - 0.35 - - 15.33 - - 73.17 2 Andhra Pradesh 1.15 0.45 0.49 1.63 0.42 0.44 28.98 26.97 25.28 66.71 76.89 71.27 3 Arunachal Pradesh - 1.56 1.11 - 1.71 1.04 - 27.56 20.62 - 24.78 20.20 4 Assam 4.45 9.89 9.12 3.48 7.57 6.99 35.29 34.04 34.10 91.91 53.05 75.94 5 Bihar 23.42 26.26 17.25 23.00 27.74 18.13 53.29 53.53 39.73 58.21 77.07 78.68 6 Chandigarh 0.00 0.00 0.00 3.05 0.00 0.54 0.61 0.56 1.08 1.83 7.87 39.46 7 Chhattisgarh 3.42 3.89 1.48 3.26 3.63 1.36 44.30 40.11 37.10 50.34 63.56 64.77 8 Dadra & Nagar Haveli - - 2.44 - - 1.32 - - 23.25 - - 76.75 9 Daman & Diu - - 0.00 - - 2.97 - - 0.99 - - 0.99
10 Delhi - 1.51 1.27 - 1.52 1.17 - 10.97 13.28 - 27.58 54.38 11 Goa - - 0.00 - - 0.07 - - 0.00 - - 1.78 12 Gujarat 0.64 0.75 0.36 1.01 0.89 0.56 18.58 17.77 18.11 83.91 81.87 80.18 13 Haryana 5.59 3.19 2.46 4.22 2.51 2.09 30.74 25.97 28.98 74.75 84.38 82.96 14 Himachal Pradesh 0.25 0.13 0.13 0.31 0.24 0.21 31.24 29.86 28.71 85.88 87.72 87.37 15 Jammu & Kashmir - 0.08 0.07 - 0.20 0.12 - 33.44 31.27 - 48.66 47.45 16 Jharkhand 15.85 11.12 7.49 15.64 11.00 7.42 41.42 40.95 34.99 72.46 67.8 70.65 17 Karnataka 0.67 0.51 1.32 0.71 0.54 1.11 23.30 21.64 21.40 75.71 80.19 69.96 18 Kerala 0.06 0.05 0.08 0.20 0.24 0.41 2.13 1.38 0.00 85.64 91.23 92.29 19 Lakshadweep - - 0.00 - - 0.00 - - 10.00 - - 0.00 20 Madhya Pradesh 3.34 3.41 5.55 3.48 3.32 5.30 41.67 35.39 33.31 42.44 60.92 62.14 21 Maharashtra 0.44 0.37 0.41 0.52 0.48 0.61 30.93 31.22 32.31 74.75 80.22 83.79 22 Manipur - - 0.94 - - 0.91 - - 21.17 - - 43.47 23 Meghalaya 0.52 0.66 0.36 0.48 0.56 0.31 23.21 22.84 22.95 38.82 54.29 49.75 24 Mizoram 0.30 0.46 0.79 0.22 0.30 0.48 19.26 18.07 19.16 28.76 65.73 65.85 25 Nagaland 0.27 0.98 1.42 0.26 1.95 1.71 19.64 19.65 18.14 48.30 62.18 71.36 26 Orissa 2.63 2.07 1.50 2.53 2.15 1.61 40.76 39.95 39.34 69.69 78.59 13.44 27 Pondicherry - 1.05 0.98 - 1.42 1.14 - 10.66 5.52 - 65.36 61.20 28 Punjab 3.58 3.09 3.92 2.93 2.53 3.44 - 14.02 10.31 17.84 71.83 78.56 29 Rajasthan 2.82 3.39 3.56 2.50 3.42 3.14 36.26 36.69 32.97 34.88 56.00 44.86 30 Sikkim 0.16 0.14 0.13 0.71 0.28 0.36 14.23 12.90 12.40 67.58 65.33 66.27 31 Tamil Nadu 1.56 1.32 0.52 2.72 2.50 1.02 10.13 8.68 8.01 69.31 79.47 80.18 32 Tripura 1.80 0.39 0.96 1.21 0.29 0.85 43.75 49.13 47.55 76.55 86.72 92.02 33 Uttar Pradesh 26.03 27.54 16.46 22.83 24.28 15.22 41.80 38.91 35.78 37.94 60.56 58.75 34 Uttaranchal 2.15 2.51 1.87 1.71 2.13 1.67 28.64 28.71 28.43 71.78 75.16 74.54 35 West Bengal 8.52 7.24 5.84 10.31 9.66 8.17 49.33 48.97 47.24 67.62 79.97 89.46
All Districts 8.38 8.32 5.93 7.08 7.14 5.30 35.72 33.00 30.87 59.82 69.83 66.19
6 Elementary Education in India

% of Schools Received TLM Grant
% of Schools Having Boundary Wall
% of Schools having Drinking Water Facility in School
% of Schools Having Common Toilet in School
Sl No. State/UT 2003-04 2004-05 2005-06 2003-04 2004-05 2005-06 2003-04 2004-05 2005-06 2003-04 2004-05 2005-06
1 A & N Islands - - 58.89 - - 41.11 - - 81.88 - - 35.89 2 Andhra Pradesh 55.58 70.42 72.48 62.50 54.35 51.08 58.45 71.80 77.64 37.56 52.87 57.02 3 Arunachal Pradesh - 15.92 15.18 - 52.07 41.69 - 58.36 68.96 - 22.44 21.24 4 Assam 32.93 17.81 86.79 41.40 33.75 30.34 61.2 63.58 70.56 26.13 30.19 31.30 5 Bihar 23.43 60.40 66.20 29.69 30.65 32.69 80.08 83.43 87.68 20.25 25.16 34.93 6 Chandigarh 0.61 22.47 50.27 96.34 97.75 97.30 98.17 98.88 99.46 44.51 43.82 36.22 7 Chhattisgarh 42.83 57.02 65.29 55.83 51.91 43.83 77.47 79.25 79.69 12.50 13.27 16.96 8 Dadra & Nagar Haveli - - 84.65 - - 56.58 - - 87.28 - - 29.39 9 Daman & Diu - - 0.82 - - 85.15 - - 95.05 - - 80.20
10 Delhi - 25.87 49.67 - 99.30 97.67 - 96.32 98.17 - 93.91 94.39 11 Goa - - 0.00 - - 61.04 - - 94.13 - - 47.88 12 Gujarat 83.44 81.39 79.49 68.06 69.94 75.26 72.16 77.65 80.92 45.01 50.7 57.26 13 Haryana 74.89 84.15 79.14 91.22 92.79 91.27 87.91 88.69 90.01 65.03 64.97 69.10 14 Himachal Pradesh 72.27 87.60 86.99 29.98 22.06 24.73 85.45 86.44 88.67 31.51 34.88 40.00 15 Jammu & Kashmir - 55.23 66.01 - 36.06 33.75 - 58.93 61.99 - 25.63 30.36 16 Jharkhand 46.07 48.24 60.27 44.55 40.97 28.47 80.88 82.53 71.70 12.63 19.27 21.41 17 Karnataka 63.90 79.52 55.99 57.40 58.77 56.35 75.50 81.47 79.67 47.63 58.92 62.78 18 Kerala 72.56 89.01 89.32 60.32 71.24 66.79 91.93 92.84 93.65 76.47 76.97 78.45 19 Lakshadweep - - 0.00 - - 73.33 - - 86.67 - - 83.33 20 Madhya Pradesh 25.38 38.55 42.54 61.23 59.82 55.10 82.04 81.12 84.71 27.94 30.47 34.53 21 Maharashtra 71.26 79.43 81.83 55.99 57.20 57.97 79.55 79.69 82.62 46.27 51.92 58.74 22 Manipur - - 41.41 - - 28.71 - - 73.68 - - 37.00 23 Meghalaya 35.70 26.98 44.37 27.64 23.61 18.42 41.42 39.14 35.75 21.66 20.97 22.03 24 Mizoram 34.43 53.03 62.87 30.65 31.24 35.14 70.62 67.18 72.59 44.33 45.91 77.47 25 Nagaland 43.15 54.54 70.17 44.08 64.77 71.84 45.09 46.94 51.47 41.96 32.89 48.29 26 Orissa 56.65 69.52 13.21 49.63 54.88 65.32 73.36 73.97 82.84 28.11 29.92 32.54 27 Pondicherry - 65.90 62.50 - 83.48 87.66 - 90.76 96.27 - 43.34 56.82 28 Punjab 0.26 67.58 72.59 98.61 91.43 89.93 75.48 91.55 92.95 53.97 59.50 77.82 29 Rajasthan 36.82 52.80 34.73 64.70 64.10 59.39 73.85 76.82 77.14 43.52 51.84 52.96 30 Sikkim 35.47 43.18 21.88 38.21 32.52 25.16 63.52 74.30 76.85 77.54 84.95 86.51 31 Tamil Nadu 84.75 82.71 80.43 45.84 54.24 61.91 92.67 94.00 96.22 45.72 38.86 55.65 32 Tripura 51.26 79.43 84.64 12.12 13.77 14.54 72.06 66.32 73.79 38.12 51.16 63.75 33 Uttar Pradesh 29.76 54.53 56.33 37.10 39.92 43.63 94.08 93.49 94.90 66.34 70.68 80.82 34 Uttaranchal 71.63 74.31 74.27 46.21 46.29 51.76 65.95 73.89 75.39 55.37 62.55 67.57 35 West Bengal 60.42 74.99 83.35 30.85 31.31 32.94 75.23 79.83 83.04 50.34 57.65 65.44
All Districts 48.79 61.82 61.26 50.55 51.40 50.67 77.89 80.60 83.07 41.81 46.82 52.39
DISE 2005-2006: Flash Statistics 7

% of Schools having Girl's Toilet in School
% of Schools without Blackboard % of Schools having Computer
in School % of Schools having Ramp in
School Sl No. State/UT 2003-04 2004-05 2005-06 2003-04 2004-05 2005-06 2003-04 2004-05 2005-06 2003-04 2004-05 2005-06
1 A & N Islands - - 63.76 - - 15.68 - - 17.42 - - 5.57 2 Andhra Pradesh 26.07 37.54 40.47 13.64 9.19 6.80 9.66 14.49 15.73 3.23 6.35 7.66 3 Arunachal Pradesh - 12.05 11.69 - 32.28 29.93 - 8.09 7.04 - 4.09 6.87 4 Assam 7.42 8.19 9.58 8.52 4.56 0.54 8.44 3.53 4.06 5.32 6.62 10.85 5 Bihar 6.79 8.88 11.78 20.50 11.98 14.85 2.43 1.79 2.39 2.75 4.87 11.73 6 Chandigarh 86.59 87.08 89.19 6.71 11.24 10.27 65.24 67.98 71.35 25.00 26.40 28.65 7 Chhattisgarh 7.12 7.19 9.81 12.14 13.24 13.13 5.42 5.05 5.69 8.27 13.45 16.02 8 Dadra & Nagar Haveli - - 28.07 - - 13.16 - - 4.39 - - 1.32 9 Daman & Diu - - 47.52 - - 8.91 - - 21.78 - - 9.90
10 Delhi - 87.95 87.82 - 11.53 10.83 - 54.68 74.75 - 57.21 59.05 11 Goa - - 40.74 - - 17.40 - - 29.96 - - 4.09 12 Gujarat 37.87 43.51 50.35 4.89 7.01 7.76 7.14 10.33 15.76 3.90 4.74 44.18 13 Haryana 65.81 69.88 70.66 8.61 7.06 5.13 6.04 8.21 10.65 14.87 30.41 48.85 14 Himachal Pradesh 19.87 23.00 29.73 7.95 5.98 5.64 5.67 6.14 7.58 5.17 4.87 5.65 15 Jammu & Kashmir - 14.78 17.32 - 13.71 11.81 - 8.33 8.64 - 2.37 1.99 16 Jharkhand 6.77 11.18 11.64 22.47 19.09 25.76 4.00 2.18 4.67 1.75 5.68 4.27 17 Karnataka 33.17 41.32 42.58 5.42 4.89 11.44 9.31 9.96 9.15 2.34 3.10 14.21 18 Kerala 60.97 68.07 71.50 4.79 4.95 4.72 31.41 37.87 51.16 10.81 12.02 32.92 19 Lakshadweep - - 50.00 - - 23.33 - - 36.67 - - 60.00 20 Madhya Pradesh 18.93 19.51 21.42 17.60 4.09 9.82 9.11 8.48 10.38 11.93 12.27 16.69 21 Maharashtra 38.50 43.16 47.52 0.55 5.92 1.39 16.57 18.31 23.10 2.37 49.77 59.19 22 Manipur - - 15.72 - - 6.73 - - 10.96 - - 1.48 23 Meghalaya 7.88 7.66 7.71 11.75 19.36 20.24 2.66 3.36 1.82 2.25 2.70 2.09 24 Mizoram 9.06 9.25 16.86 16.89 8.61 6.98 5.23 6.22 10.19 6.82 6.27 11.03 25 Nagaland 19.15 17.15 21.28 23.73 25.85 0.00 6.96 12.01 13.88 2.51 4.50 3.82 26 Orissa 10.28 10.78 12.40 5.09 5.21 8.41 3.33 4.97 11.42 3.36 4.64 8.09 27 Pondicherry - 76.20 80.03 - 6.93 24.19 - 29.48 14.94 - 23.27 24.19 28 Punjab 58.40 63.15 69.96 6.53 15.28 13.63 1.66 12.33 14.02 1.11 4.58 12.65 29 Rajasthan 23.79 29.76 34.59 19.80 15.43 14.02 8.27 8.94 9.57 4.77 8.14 12.59 30 Sikkim 35.16 34.77 34.46 29.37 20.65 36.65 23.58 21.59 18.05 4.57 4.49 4.47 31 Tamil Nadu 37.62 43.56 55.10 0.93 1.45 3.22 14.33 15.16 19.64 7.30 12.04 17.77 32 Tripura 10.47 12.50 18.04 31.43 4.98 11.87 8.30 6.48 6.88 8.27 12.09 24.01 33 Uttar Pradesh 52.18 55.48 69.41 3.84 7.37 2.20 2.76 4.03 3.62 4.79 10.59 12.39 34 Uttaranchal 32.33 37.58 41.58 8.85 6.80 7.45 8.64 13.40 14.19 1.38 2.23 5.96 35 West Bengal 20.19 25.41 30.56 3.66 0.86 0.49 2.62 2.87 4.47 5.39 6.89 8.85
All Districts 28.24 32.75 37.42 9.51 7.86 7.95 7.68 8.99 10.73 5.10 11.49 17.14
8 Elementary Education in India


% Distribution of Schools having Enrolment ? 50
Total Number of Teachers % Distribution of Female
Teachers % Distribution of SC Teaches
to Total Teachers Sl No. State/UT 2003-04 2004-05 2005-06 2003-04 2004-05 2005-06 2003-04 2004-05 2005-06 2003-04 2004-05 2005-06
1 A & N Islands - - 34.49 - - 2967 - - 52.32 - - 6.64 2 Andhra Pradesh 35.45 33.37 35.27 319539 466725 462869 39.69 41.80 42.50 6.47 6.24 6.04 3 Arunachal Pradesh - 50.54 58.93 - 8670 10741 - 29.73 32.68 - 5.37 7.11 4 Assam 32.76 32.02 34.93 165415 155897 148869 29.12 29.66 29.70 35.22 37.85 39.60 5 Bihar 5.06 4.18 5.80 158944 165309 207347 19.83 19.57 26.21 22.33 21.75 15.97 6 Chandigarh 1.22 6.18 4.86 3315 4476 4862 84.52 83.89 83.07 8.17 7.21 7.05 7 Chhattisgarh 28.68 32.70 34.95 101168 104495 162707 27.01 27.05 31.25 4.10 3.88 3.66 8 Dadra & Nagar Haveli - - 17.54 - - 963 - - 51.52 - - 33.23 9 Daman & Diu - - 6.93 - - 481 - - 73.38 - - 45.74
10 Delhi - 3.47 2.62 - 64899 64284 - 70.64 69.97 - 1.15 1.38 11 Goa - - 58.74 - - 5501 - - 76.83 - - 37.74 12 Gujarat 19.93 20.92 19.96 181006 190955 206693 50.13 51.40 51.05 55.89 54.71 48.78 13 Haryana 14.68 12.93 14.89 46411 59905 63051 42.77 42.93 41.82 20.15 21.00 18.23 14 Himachal Pradesh 48.30 50.17 51.90 50931 52618 52778 36.65 39.70 40.54 24.41 26.22 31.00 15 Jammu & Kashmir - 49.65 51.74 - 71181 89408 - 40.09 41.56 - 12.43 11.87 16 Jharkhand 14.12 12.63 16.20 59740 71126 111288 25.18 28.24 29.29 27.55 24.95 22.63 17 Karnataka 32.34 32.96 42.36 237684 227665 227785 52.08 50.57 50.57 32.78 31.42 31.41 18 Kerala 6.87 10.09 6.97 121725 118948 114268 71.41 72.08 72.31 33.80 30.16 28.07 19 Lakshadweep - - 3.33 - - 595 - - 36.14 - - 48.74 20 Madhya Pradesh 24.41 26.09 23.17 313881 377420 378501 31.87 32.00 32.73 5.13 5.32 5.60 21 Maharashtra 30.00 35.82 31.72 477062 450785 509402 43.00 40.24 40.51 33.08 31.18 33.57 22 Manipur - - 36.89 - - 21920 - - 41.79 - - 13.58 23 Meghalaya 53.72 58.17 61.71 19120 25363 25445 50.28 49.94 50.15 34.14 33.49 33.90 24 Mizoram 37.99 30.90 30.58 11897 12582 13233 40.37 40.91 41.45 27.05 26.52 26.77 25 Nagaland 27.12 27.97 25.10 18289 18306 19376 37.29 40.29 40.91 20.61 21.15 21.82 26 Orissa 22.45 24.19 25.48 142054 158481 169232 30.45 32.63 34.05 36.46 34.57 33.63 27 Pondicherry - 23.80 23.38 - 4650 5882 - 56.98 63.50 - 16.34 11.51 28 Punjab 21.80 25.12 25.31 42808 91484 72704 - 64.00 61.80 - 14.62 16.11 29 Rajasthan 27.60 27.11 21.23 260060 296041 354439 24.18 25.47 27.10 4.98 4.59 4.64 30 Sikkim 40.41 42.99 42.84 6793 7682 7908 41.67 43.75 43.67 27.23 28.00 26.66 31 Tamil Nadu 20.73 21.79 23.97 228748 250214 331513 70.18 72.25 69.47 24.90 23.47 17.46 32 Tripura 14.32 17.10 15.50 27371 30441 30344 25.08 25.56 25.44 26.62 26.27 27.26 33 Uttar Pradesh 7.59 7.80 9.05 399813 400721 527035 29.02 29.53 32.36 10.12 10.01 8.56 34 Uttaranchal 49.73 49.62 51.21 48621 52922 51507 46.23 46.77 45.16 6.85 6.24 5.87 35 West Bengal 9.02 8.14 8.80 225242 232311 234278 25.30 26.61 27.73 26.10 25.94 24.96
All Districts 22.61 23.93 24.29 3667637 4172272 4690176 38.18 39.78 40.33 21.76 19.80 18.39
16 Elementary Education in India

% Distribution of ST Teachers to Total Teachers
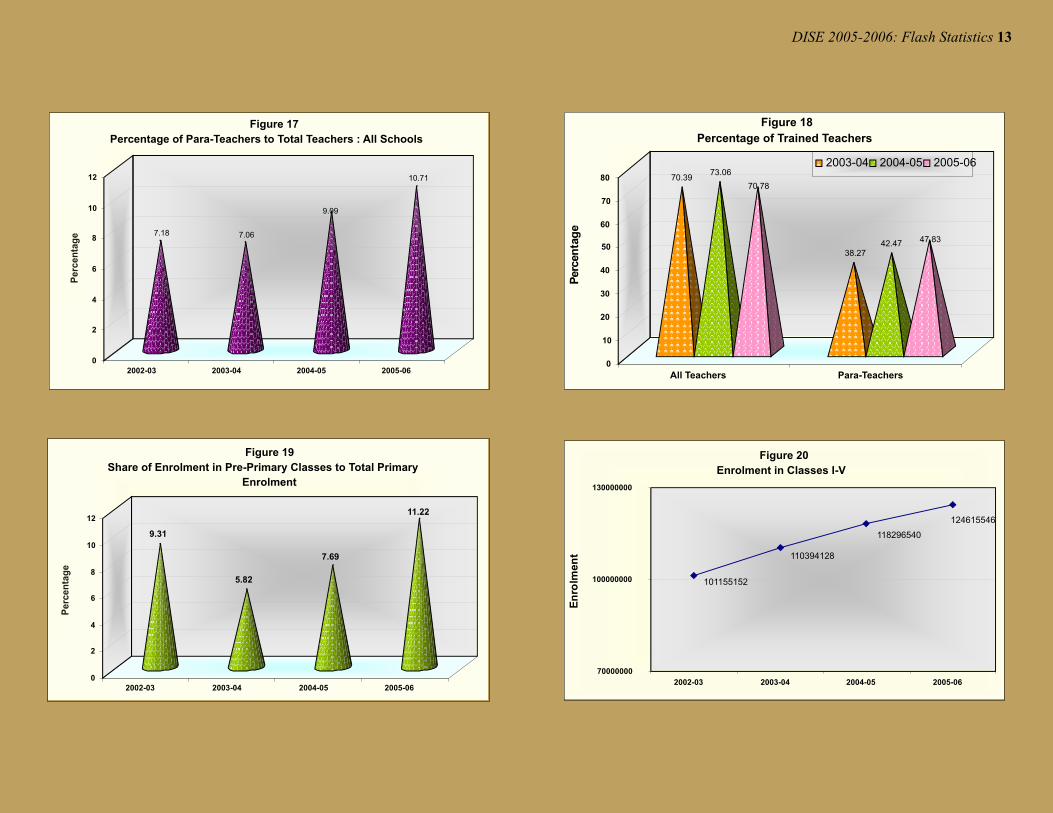
% Distribution of Para-Teachers to Total Teachers
% of Trained Para-Teachers % Distribution of Trained
Teachers Sl No. State/UT 2003-04 2004-05 2005-06 2003-04 2004-05 2005-06 2003-04 2004-05 2005-06 2003-04 2004-05 2005-06
1 A & N Islands - - 35.89 - - 1.11 - - 87.88 - - 91.10 2 Andhra Pradesh 15.17 15.40 15.33 6.21 12.9 13.69 23.75 23.53 53.16 77.65 77.04 76.57 3 Arunachal Pradesh - 25.50 26.07 - 6.24 10.94 - 10.91 9.53 - 22.17 23.59 4 Assam 29.27 29.05 30.56 5.21 0.25 3.05 9.87 13.60 16.18 38.35 44.11 44.10 5 Bihar 13.94 16.00 30.13 11.22 15.01 33.56 21.95 29.46 27.98 55.22 56.38 47.02 6 Chandigarh 5.67 5.03 4.36 1.69 0.85 1.28 75.00 73.68 93.55 94.24 90.36 91.90 7 Chhattisgarh 34.61 33.14 32.97 28.37 28.95 25.30 24.44 33.01 40.30 42.18 45.91 41.39 8 Dadra & Nagar Haveli - - 21.50 - - 1.35 - - 92.31 - - 82.97 9 Daman & Diu - - 19.75 - - 0.69 - - 80.00 - - 69.72
10 Delhi - 7.73 7.73 - 2.17 2.55 - 95.61 92.43 - 90.84 86.67 11 Goa - - 12.00 - - 1.25 - - 72.46 - - 85.95 12 Gujarat 18.23 18.94 19.85 1.23 0.68 0.55 79.43 75.29 77.04 89.18 89.58 87.19 13 Haryana 11.17 12.11 12.03 0.69 0.43 0.49 89.75 79.69 75.82 83.90 84.93 85.02 14 Himachal Pradesh 12.49 12.81 14.79 10.51 12.76 12.85 68.72 80.83 77.23 84.44 92.41 83.45 15 Jammu & Kashmir - 23.20 22.21 - 8.90 0.53 - 36.00 33.12 - 41.41 42.77 16 Jharkhand 16.64 18.91 22.96 6.69 14.19 22.44 40.57 46.03 42.33 70.75 77.57 70.46 17 Karnataka 36.55 40.66 40.64 0.91 0.76 0.15 83.36 81.53 89.16 87.29 91.57 91.48 18 Kerala 21.45 22.86 25.02 1.96 1.79 2.15 91.19 90.55 93.25 92.30 92.87 91.19 19 Lakshadweep - - 13.11 - - 0.34 - - 50.00 - - 79.16 20 Madhya Pradesh 30.95 31.59 33.03 25.37 31.11 31.48 35.77 44.06 56.87 48.96 53.32 46.89 21 Maharashtra 16.53 17.81 20.70 0.74 0.82 0.77 94.82 95.71 99.44 78.30 84.18 85.68 22 Manipur - - 21.91 - - 1.44 - - 28.57 - - 35.84 23 Meghalaya 28.27 30.18 30.76 4.65 3.49 3.64 14.72 20.68 15.68 31.21 28.98 34.62 24 Mizoram 17.31 18.36 18.08 4.02 3.19 9.66 28.45 24.94 17.21 64.97 65.22 62.19 25 Nagaland 21.81 24.64 26.63 0.20 0.87 0.36 2.78 9.43 2.90 10.08 8.45 9.33 26 Orissa 17.34 18.04 19.21 8.80 7.77 6.90 89.04 80.03 76.84 87.59 83.00 77.40 27 Pondicherry - 13.63 11.68 - 0.73 0.14 - 67.65 100.00 - 81.18 95.95 28 Punjab - 12.75 12.70 - 2.19 2.90 - 70.19 78.89 - 70.64 80.68 29 Rajasthan 19.96 18.48 18.53 11.79 12.36 9.08 62.41 71.46 82.22 72.01 70.49 78.93 30 Sikkim 30.05 31.42 31.77 1.87 0.83 0.44 21.26 14.06 2.86 31.62 33.26 33.66 31 Tamil Nadu 25.80 26.34 22.56 0.61 0.79 1.38 77.54 81.93 75.77 91.47 92.11 89.30 32 Tripura 18.16 17.16 17.62 0.29 2.01 3.18 21.25 12.44 28.22 33.82 33.57 42.01 33 Uttar Pradesh 28.54 28.98 26.78 8.88 12.60 18.20 18.56 28.94 34.74 67.97 71.34 63.45 34 Uttaranchal 18.33 17.48 16.45 3.25 3.65 3.86 18.20 20.48 19.25 67.66 67.81 66.21 35 West Bengal 19.68 19.96 20.11 0.54 1.22 3.94 77.35 29.17 19.72 67.18 72.45 70.34
All Districts 22.33 22.54 23.57 7.06 9.05 10.71 38.27 42.47 47.83 70.39 73.06 70.78
DISE 2005-2006: Flash Statistics 17

% Distribution of Teachers Received In-Service Training*
% Teachers Aged 55+ Years
Male Female Sl No. State/UT 2003-04 2004-05 2005-06 2003-04 2004-05 2005-06 2003-04 2004-05 2005-06
1 A & N Islands - - 21.26 - - 9.05 - - 3.22 2 Andhra Pradesh 45.46 44.03 45.94 6.58 4.37 2.71 4.85 3.22 2.07 3 Arunachal Pradesh - 6.24 9.93 - 5.06 3.10 - 1.37 1.39 4 Assam 35.75 38.19 58.91 6.91 6.01 5.09 5.11 4.53 3.79 5 Bihar 25.86 39.88 40.37 19.08 16.70 12.35 14.67 11.11 6.32 6 Chandigarh 7.27 6.21 14.51 7.41 6.53 2.76 9.78 7.55 4.80 7 Chhattisgarh 20.61 48.90 26.77 13.20 11.40 9.71 5.21 4.49 4.29 8 Dadra & Nagar Haveli - - 1.80 - - 6.05 - - 6.50 9 Daman & Diu - - 17.98 - - 17.65 - - 9.45
10 Delhi - 2.17 9.27 - 9.73 7.19 - 7.67 5.80 11 Goa - - 40.72 - - 8.79 - - 4.36 12 Gujarat 45.63 43.93 56.49 7.32 5.79 3.66 5.30 4.36 2.95 13 Haryana 54.20 42.42 77.02 17.29 11.10 6.55 11.46 6.95 4.40 14 Himachal Pradesh 32.76 44.46 63.75 8.92 6.94 4.31 8.95 6.40 4.10 15 Jammu & Kashmir - 8.90 38.95 - 5.23 3.94 - 3.32 2.08 16 Jharkhand 25.88 35.93 37.35 18.98 14.54 10.72 13.90 9.29 7.52 17 Karnataka 51.65 54.69 12.50 5.68 3.86 3.86 3.56 2.50 2.50 18 Kerala 62.86 66.11 76.32 3.48 0.63 0.38 2.81 0.50 0.43 19 Lakshadweep - - 69.10 - - 6.29 - - 3.17 20 Madhya Pradesh 6.43 36.46 27.56 10.95 9.21 8.01 7.00 6.37 5.76 21 Maharashtra 18.92 20.84 33.07 8.11 5.24 3.68 5.85 4.26 3.04 22 Manipur - - 10.16 - - 4.76 - - 2.48 23 Meghalaya 19.31 18.05 6.07 3.77 3.33 2.92 3.69 3.06 2.77 24 Mizoram 17.07 19.33 27.42 33.89 33.36 29.84 46.57 45.42 41.60 25 Nagaland 8.59 9.45 37.83 3.12 1.80 1.25 1.71 1.17 0.55 26 Orissa 15.55 21.71 43.10 13.79 9.74 6.14 3.35 2.51 1.60 27 Pondicherry - 0.73 16.30 - 15.69 13.24 - 6.73 4.52 28 Punjab - 2.19 55.27 - 12.28 8.23 - 10.33 7.83 29 Rajasthan 35.18 43.27 30.44 4.69 4.07 3.80 2.96 2.54 2.25 30 Sikkim 8.11 8.01 0.80 2.58 2.19 1.72 1.33 1.13 0.90 31 Tamil Nadu 49.55 46.09 183.56 22.73 16.81 10.53 8.59 6.12 4.49 32 Tripura 1.62 3.46 21.27 8.70 6.96 4.74 9.63 7.62 5.27 33 Uttar Pradesh 24.46 37.01 22.42 20.80 20.78 16.92 9.60 10.12 6.71 34 Uttaranchal 33.31 34.26 46.30 13.03 12.12 9.24 5.90 5.81 5.01 35 West Bengal 28.26 28.62 33.11 23.50 19.47 16.17 21.98 17.52 14.04
All Districts 30.78 36.11 40.02 12.50 10.09 8.04 7.06 5.71 4.34 * During previous academic year
18 Elementary Education in India

% of Teachers Involved in Non-Teaching Assignments to Total Teachers & Number of Days *
Enrolment
% Days % Days % Days Classes I-V Classes VI-VII/VIII** Sl No. State/UT 2003-04 2004-05 2005-06 2003-04 2004-05 2005-06 2003-04 2004-05 2005-06 2003-04 2004-05 2005-06 1 A & N Islands - - - - 21.06 12 - - 29453 - - 18845 2 Andhra Pradesh 14.65 14 17.35 14 16.98 16 7603739 7692411 7391922 2634267 3643030 3731018 3 Arunachal Pradesh - - 14.70 28 18.62 13 - 159290 194012 - 49442 58290 4 Assam 27.58 35 37.17 20 32.44 22 3052186 3329424 3188565 679477 727572 763697 5 Bihar 29.15 29 26.74 31 22.48 31 9732357 10917135 11233588 1482460 1936213 2163453 6 Chandigarh 8.60 9 7.06 9 18.69 12 66349 65276 76279 38702 38591 42777 7 Chhattisgarh 19.59 22 20.64 17 11.44 16 2756435 2810050 3410558 1062632 1062310 1396952 8 Dadra & Nagar Haveli - - - - 1.63 13 - - 31851 - - 7351 9 Daman & Diu - - - - 16.48 18 - - 15828 - - 8335
10 Delhi - - 8.05 15 5.48 19 - 1280142 1399122 - 766723 819830 11 Goa - - - - 30.75 25 - - 95857 - - 42171 12 Gujarat 13.37 9 11.62 9 5.08 12 5144278 5275337 5479659 1456753 1544569 1675341 13 Haryana 22.54 19 21.12 19 21.45 18 1331334 1490595 1442315 480510 690852 642062 14 Himachal Pradesh 17.47 18 21.57 16 18.76 18 666941 670807 660960 419878 418802 410860 15 Jammu & Kashmir - - 16.36 15 15.04 13 - 917085 1038360 - 434777 528777 16 Jharkhand 24.14 42 17.43 31 16.46 27 2927384 3233271 4494753 490028 588405 812381 17 Karnataka 22.98 9 23.98 7 5.13 6 5855165 5819740 5006382 2077064 2080389 1908074 18 Kerala 26.85 8 25.49 8 26.99 8 2226872 2075531 2057012 1429229 890849 1243534 19 Lakshadweep - - - - 34.45 21 - - 6188 - - 3483 20 Madhya Pradesh 6.74 23 7.32 21 8.77 21 7537695 9103583 10190213 2730313 3077249 3345216 21 Maharashtra 6.63 17 7.25 14 6.04 12 10192436 8698669 9926924 3527810 2938200 5031763 22 Manipur - - - - 15.32 19 - - 335683 - - 102392 23 Meghalaya 48.10 15 24.37 16 27.47 18 328675 403079 361204 58914 78277 72320 24 Mizoram 26.99 15 6.89 11 27.85 9 131813 153168 162316 38017 43688 57770 25 Nagaland 27.41 13 26.45 13 37.03 15 258078 293650 310688 91320 106962 111191 26 Orissa 22.90 18 24.81 14 16.05 15 4694941 4677237 4616412 1031094 1138416 1225781 27 Pondicherry - - 5.50 21 1.53 25 - 77263 90479 - 48076 50520 28 Punjab 0.00 0 19.40 13 15.76 15 850346 1806720 1545398 392709 877255 854667 29 Rajasthan 21.98 19 28.12 19 16.65 19 6978195 7712167 8746946 1756244 2252234 2930530 30 Sikkim 20.96 17 15.07 13 6.82 9 80354 85912 87527 26784 29377 30232 31 Tamil Nadu 8.67 7 11.36 6 19.99 16 5846131 6216962 6186218 3262864 3567430 3568479 32 Tripura 9.15 40 11.35 24 11.92 26 458297 488163 500491 182904 188673 197196 33 Uttar Pradesh 13.52 12 15.77 13 12.89 13 21158877 22472205 24342931 4189960 4615361 5831921 34 Uttaranchal 17.16 16 15.06 14 10.70 17 940004 976832 953477 341980 408112 394219 35 West Bengal 27.31 13 31.50 12 29.53 13 9575246 9394836 9005975 3259679 3475656 3586358
All Districts 16.69 18 18.14 15 15.06 17 110394128 118296540 124615546 33141592 37717490 43667786 * During previous academic year ** Incomplete enrolment
DISE 2005-2006: Flash Statistics 19
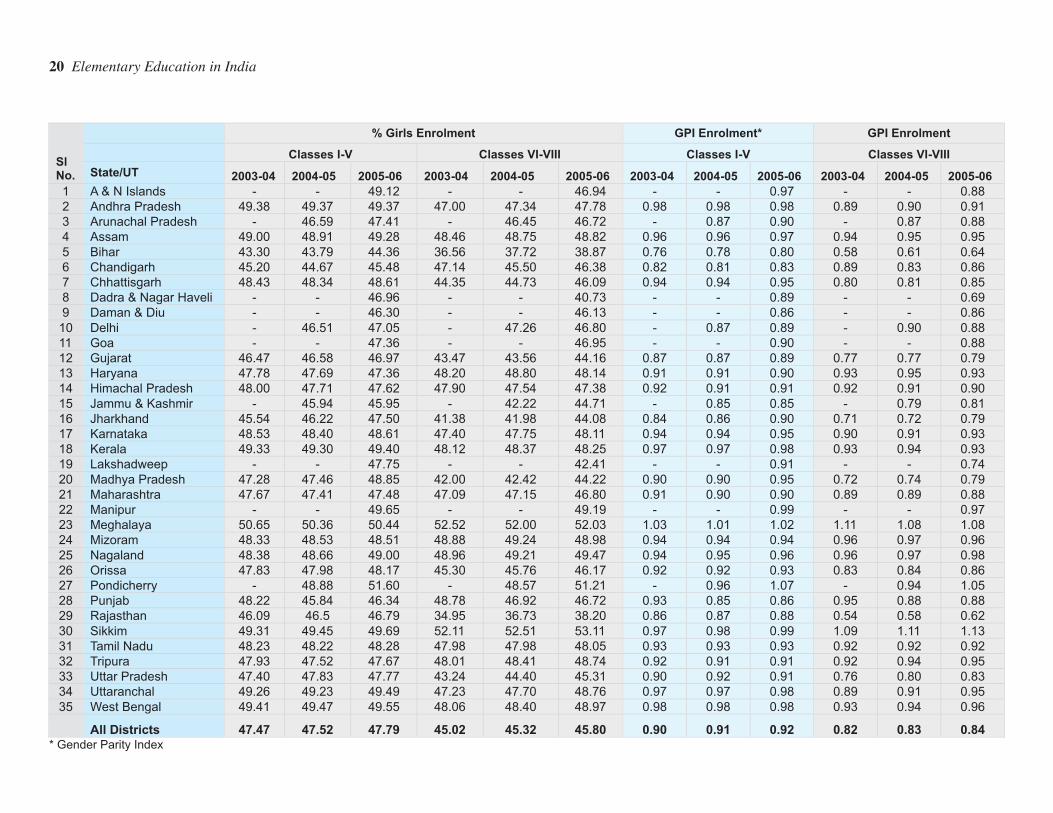
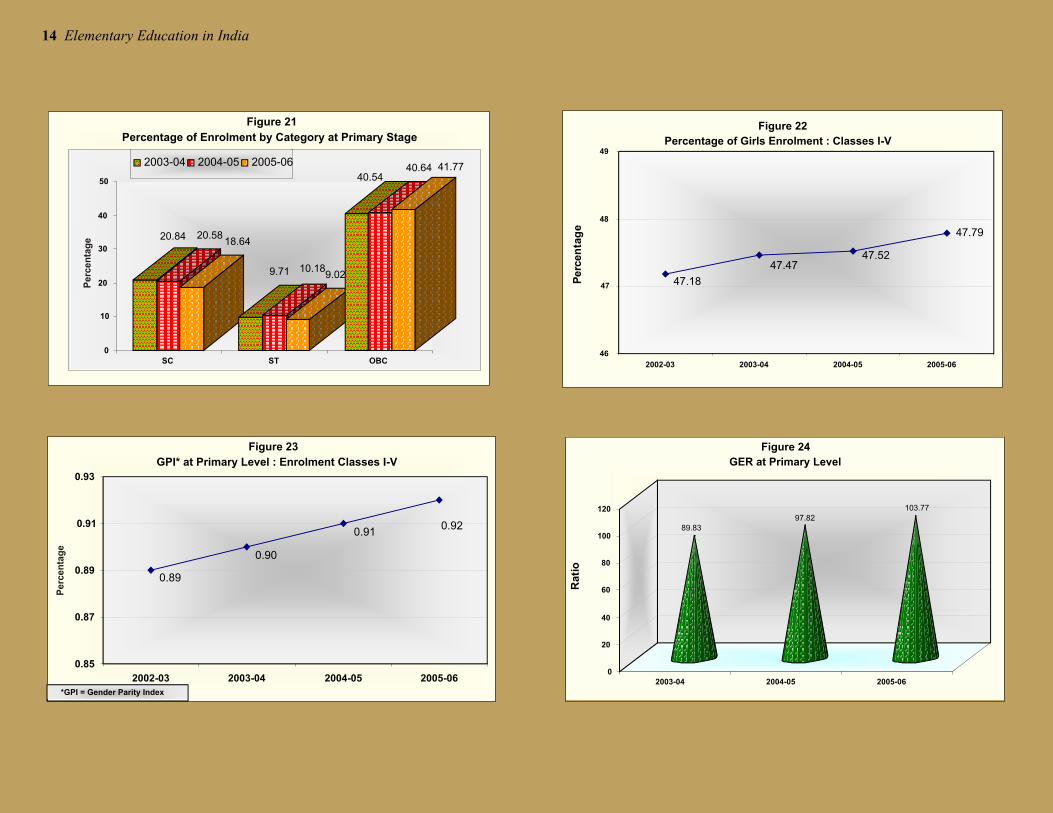
% Girls Enrolment GPI Enrolment* GPI Enrolment
Classes I-V Classes VI-VIII Classes I-V Classes VI-VIII Sl No. State/UT 2003-04 2004-05 2005-06 2003-04 2004-05 2005-06 2003-04 2004-05 2005-06 2003-04 2004-05 2005-06
1 A & N Islands - - 49.12 - - 46.94 - - 0.97 - - 0.88 2 Andhra Pradesh 49.38 49.37 49.37 47.00 47.34 47.78 0.98 0.98 0.98 0.89 0.90 0.91 3 Arunachal Pradesh - 46.59 47.41 - 46.45 46.72 - 0.87 0.90 - 0.87 0.88 4 Assam 49.00 48.91 49.28 48.46 48.75 48.82 0.96 0.96 0.97 0.94 0.95 0.95 5 Bihar 43.30 43.79 44.36 36.56 37.72 38.87 0.76 0.78 0.80 0.58 0.61 0.64 6 Chandigarh 45.20 44.67 45.48 47.14 45.50 46.38 0.82 0.81 0.83 0.89 0.83 0.86 7 Chhattisgarh 48.43 48.34 48.61 44.35 44.73 46.09 0.94 0.94 0.95 0.80 0.81 0.85 8 Dadra & Nagar Haveli - - 46.96 - - 40.73 - - 0.89 - - 0.69 9 Daman & Diu - - 46.30 - - 46.13 - - 0.86 - - 0.86
10 Delhi - 46.51 47.05 - 47.26 46.80 - 0.87 0.89 - 0.90 0.88 11 Goa - - 47.36 - - 46.95 - - 0.90 - - 0.88 12 Gujarat 46.47 46.58 46.97 43.47 43.56 44.16 0.87 0.87 0.89 0.77 0.77 0.79 13 Haryana 47.78 47.69 47.36 48.20 48.80 48.14 0.91 0.91 0.90 0.93 0.95 0.93 14 Himachal Pradesh 48.00 47.71 47.62 47.90 47.54 47.38 0.92 0.91 0.91 0.92 0.91 0.90 15 Jammu & Kashmir - 45.94 45.95 - 42.22 44.71 - 0.85 0.85 - 0.79 0.81 16 Jharkhand 45.54 46.22 47.50 41.38 41.98 44.08 0.84 0.86 0.90 0.71 0.72 0.79 17 Karnataka 48.53 48.40 48.61 47.40 47.75 48.11 0.94 0.94 0.95 0.90 0.91 0.93 18 Kerala 49.33 49.30 49.40 48.12 48.37 48.25 0.97 0.97 0.98 0.93 0.94 0.93 19 Lakshadweep - - 47.75 - - 42.41 - - 0.91 - - 0.74 20 Madhya Pradesh 47.28 47.46 48.85 42.00 42.42 44.22 0.90 0.90 0.95 0.72 0.74 0.79 21 Maharashtra 47.67 47.41 47.48 47.09 47.15 46.80 0.91 0.90 0.90 0.89 0.89 0.88 22 Manipur - - 49.65 - - 49.19 - - 0.99 - - 0.97 23 Meghalaya 50.65 50.36 50.44 52.52 52.00 52.03 1.03 1.01 1.02 1.11 1.08 1.08 24 Mizoram 48.33 48.53 48.51 48.88 49.24 48.98 0.94 0.94 0.94 0.96 0.97 0.96 25 Nagaland 48.38 48.66 49.00 48.96 49.21 49.47 0.94 0.95 0.96 0.96 0.97 0.98 26 Orissa 47.83 47.98 48.17 45.30 45.76 46.17 0.92 0.92 0.93 0.83 0.84 0.86 27 Pondicherry - 48.88 51.60 - 48.57 51.21 - 0.96 1.07 - 0.94 1.05 28 Punjab 48.22 45.84 46.34 48.78 46.92 46.72 0.93 0.85 0.86 0.95 0.88 0.88 29 Rajasthan 46.09 46.5 46.79 34.95 36.73 38.20 0.86 0.87 0.88 0.54 0.58 0.62 30 Sikkim 49.31 49.45 49.69 52.11 52.51 53.11 0.97 0.98 0.99 1.09 1.11 1.13 31 Tamil Nadu 48.23 48.22 48.28 47.98 47.98 48.05 0.93 0.93 0.93 0.92 0.92 0.92 32 Tripura 47.93 47.52 47.67 48.01 48.41 48.74 0.92 0.91 0.91 0.92 0.94 0.95 33 Uttar Pradesh 47.40 47.83 47.77 43.24 44.40 45.31 0.90 0.92 0.91 0.76 0.80 0.83 34 Uttaranchal 49.26 49.23 49.49 47.23 47.70 48.76 0.97 0.97 0.98 0.89 0.91 0.95 35 West Bengal 49.41 49.47 49.55 48.06 48.40 48.97 0.98 0.98 0.98 0.93 0.94 0.96
All Districts 47.47 47.52 47.79 45.02 45.32 45.80 0.90 0.91 0.92 0.82 0.83 0.84 * Gender Parity Index
20 Elementary Education in India
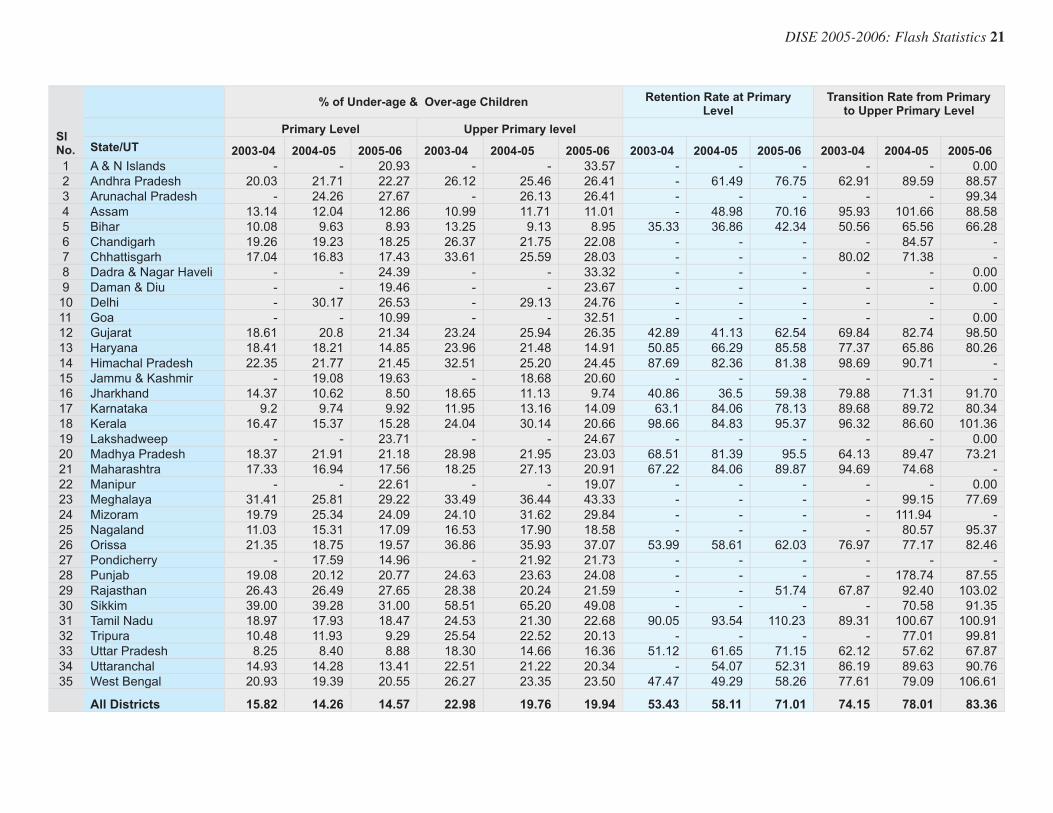
% of Under-age & Over-age Children Retention Rate at Primary Level
Transition Rate from Primary to Upper Primary Level
Primary Level Upper Primary level Sl No. State/UT 2003-04 2004-05 2005-06 2003-04 2004-05 2005-06 2003-04 2004-05 2005-06 2003-04 2004-05 2005-06
1 A & N Islands - - 20.93 - - 33.57 - - - - - 0.00 2 Andhra Pradesh 20.03 21.71 22.27 26.12 25.46 26.41 - 61.49 76.75 62.91 89.59 88.57 3 Arunachal Pradesh - 24.26 27.67 - 26.13 26.41 - - - - - 99.34 4 Assam 13.14 12.04 12.86 10.99 11.71 11.01 - 48.98 70.16 95.93 101.66 88.58 5 Bihar 10.08 9.63 8.93 13.25 9.13 8.95 35.33 36.86 42.34 50.56 65.56 66.28 6 Chandigarh 19.26 19.23 18.25 26.37 21.75 22.08 - - - - 84.57 - 7 Chhattisgarh 17.04 16.83 17.43 33.61 25.59 28.03 - - - 80.02 71.38 - 8 Dadra & Nagar Haveli - - 24.39 - - 33.32 - - - - - 0.00 9 Daman & Diu - - 19.46 - - 23.67 - - - - - 0.00
10 Delhi - 30.17 26.53 - 29.13 24.76 - - - - - - 11 Goa - - 10.99 - - 32.51 - - - - - 0.00 12 Gujarat 18.61 20.8 21.34 23.24 25.94 26.35 42.89 41.13 62.54 69.84 82.74 98.50 13 Haryana 18.41 18.21 14.85 23.96 21.48 14.91 50.85 66.29 85.58 77.37 65.86 80.26 14 Himachal Pradesh 22.35 21.77 21.45 32.51 25.20 24.45 87.69 82.36 81.38 98.69 90.71 - 15 Jammu & Kashmir - 19.08 19.63 - 18.68 20.60 - - - - - - 16 Jharkhand 14.37 10.62 8.50 18.65 11.13 9.74 40.86 36.5 59.38 79.88 71.31 91.70 17 Karnataka 9.2 9.74 9.92 11.95 13.16 14.09 63.1 84.06 78.13 89.68 89.72 80.34 18 Kerala 16.47 15.37 15.28 24.04 30.14 20.66 98.66 84.83 95.37 96.32 86.60 101.36 19 Lakshadweep - - 23.71 - - 24.67 - - - - - 0.00 20 Madhya Pradesh 18.37 21.91 21.18 28.98 21.95 23.03 68.51 81.39 95.5 64.13 89.47 73.21 21 Maharashtra 17.33 16.94 17.56 18.25 27.13 20.91 67.22 84.06 89.87 94.69 74.68 - 22 Manipur - - 22.61 - - 19.07 - - - - - 0.00 23 Meghalaya 31.41 25.81 29.22 33.49 36.44 43.33 - - - - 99.15 77.69 24 Mizoram 19.79 25.34 24.09 24.10 31.62 29.84 - - - - 111.94 - 25 Nagaland 11.03 15.31 17.09 16.53 17.90 18.58 - - - - 80.57 95.37 26 Orissa 21.35 18.75 19.57 36.86 35.93 37.07 53.99 58.61 62.03 76.97 77.17 82.46 27 Pondicherry - 17.59 14.96 - 21.92 21.73 - - - - - - 28 Punjab 19.08 20.12 20.77 24.63 23.63 24.08 - - - - 178.74 87.55 29 Rajasthan 26.43 26.49 27.65 28.38 20.24 21.59 - - 51.74 67.87 92.40 103.02 30 Sikkim 39.00 39.28 31.00 58.51 65.20 49.08 - - - - 70.58 91.35 31 Tamil Nadu 18.97 17.93 18.47 24.53 21.30 22.68 90.05 93.54 110.23 89.31 100.67 100.91 32 Tripura 10.48 11.93 9.29 25.54 22.52 20.13 - - - - 77.01 99.81 33 Uttar Pradesh 8.25 8.40 8.88 18.30 14.66 16.36 51.12 61.65 71.15 62.12 57.62 67.87 34 Uttaranchal 14.93 14.28 13.41 22.51 21.22 20.34 - 54.07 52.31 86.19 89.63 90.76 35 West Bengal 20.93 19.39 20.55 26.27 23.35 23.50 47.47 49.29 58.26 77.61 79.09 106.61
All Districts 15.82 14.26 14.57 22.98 19.76 19.94 53.43 58.11 71.01 74.15 78.01 83.36
DISE 2005-2006: Flash Statistics 21

Boys Passed with 60 % & above Marks, Grade IV/V
Girls Passed with 60 % & above Marks, Grade IV/V
% of Enrolment in Schools with Student-Classroom Ratio
above 60
% Share of Enrolment in Pre-Primary Classes to Total
Enrolment (Primary) Sl No. State/UT 2003-04 2004-05 2005-06 2003-04 2004-05 2005-06 2003-04 2004-05 2005-06 2003-04 2004-05 2005-06
1 A & N Islands - - 32.59 - - 37.00 - - 0.00 - - 1.72 2 Andhra Pradesh 66.18 70.62 72.48 65.66 70.04 70.43 25.51 14.74 5.29 9.55 5.13 6.06 3 Arunachal Pradesh - 14.64 19.57 - 14.69 18.58 - 0.00 9.51 - 24.22 6.87 4 Assam 24.31 24.92 29.44 23.31 25.13 28.66 47.06 17.43 32.54 9.82 4.18 8.50 5 Bihar 30.49 35.69 34.81 29.73 35.23 34.70 77.94 63.09 74.47 20.9 1.79 6.60 6 Chandigarh 43.5 43.89 48.63 51.14 47.97 53.69 10.80 13.86 1.04 27.67 10.93 11.68 7 Chhattisgarh 44.98 43.22 46.16 43.33 42.06 45.36 26.76 27.49 23.10 8.63 12.26 18.06 8 Dadra & Nagar Haveli - - 48.89 - - 49.87 - - 0.00 - - 6.18 9 Daman & Diu - - 40.05 - - 41.78 - - 0.00 - - 45.29
10 Delhi - 43.88 50.68 - 49.75 57.01 - 0.00 10.13 - 5.70 3.29 11 Goa - - 43.85 - - 48.02 - - 0.00 - - 23.12 12 Gujarat 50.86 50.31 54.62 53.07 52.08 57.13 19.75 9.41 8.72 4.79 5.70 10.79 13 Haryana 30.45 29.84 29.84 33.59 31.37 31.37 32.51 20.69 15.90 12.66 12.08 13.89 14 Himachal Pradesh 51.28 54.79 54.13 54.62 58.41 57.88 9.31 5.80 5.40 1.62 2.76 22.98 15 Jammu & Kashmir - 45.02 46.91 - 44.80 46.92 - 0.00 4.01 - 23.64 15.51 16 Jharkhand 22.94 23.05 23.91 22.26 22.34 23.10 55.12 50.58 35.23 4.50 5.42 12.73 17 Karnataka 53.11 49.17 71.61 55.97 53.13 79.95 20.18 12.53 10.27 14.32 17.69 26.32 18 Kerala 47.91 54.21 55.49 52.66 57.69 58.77 5.40 9.47 1.52 4.71 4.81 5.23 19 Lakshadweep - - 34.90 - - 41.91 - - 0.00 - - 0.00 20 Madhya Pradesh 23.77 20.89 25.26 22.84 19.95 24.21 31.66 19.69 25.23 21.92 23.59 15.58 21 Maharashtra 61.22 60.55 61.57 62.11 61.69 62.89 19.73 11.35 7.05 16.71 17.54 12.50 22 Manipur - - 29.22 - - 29.44 - - 0.00 - - 19.71 23 Meghalaya 23.36 21.55 24.25 24.33 21.66 24.55 14.23 6.08 8.68 75.15 69.24 29.47 24 Mizoram 18.66 24 29.32 20.74 26.12 32.78 3.34 2.54 4.05 9.60 6.98 29.19 25 Nagaland 16.45 21.29 25.12 18.72 21.95 25.66 19.59 12.77 27.55 55.61 55.45 24.69 26 Orissa 19.26 21.71 20.93 17.95 20.25 19.48 21.04 23.73 20.51 2.47 3.34 1.60 27 Pondicherry - 49.25 48.95 - 50.86 50.78 - 0.00 9.49 - 33.26 15.70 28 Punjab 13.84 26.27 27.05 16.73 28.86 29.94 12.6 7.54 19.27 1.45 7.11 19.17 29 Rajasthan 57.14 54.35 52.61 55.81 51.09 49.48 14.85 17.18 10.77 8.25 10.06 6.31 30 Sikkim 16.36 17.17 16.36 17.37 17.26 16.11 2.59 4.82 6.81 50.54 46.78 25.18 31 Tamil Nadu 55.72 60.53 64.60 61.10 65.87 69.37 17.93 21.79 21.38 5.45 8.37 12.07 32 Tripura 12.11 15.43 14.92 12.48 15.01 14.67 44.26 6.43 5.67 1.23 2.49 1.88 33 Uttar Pradesh 37.55 39.40 39.88 34.90 37.10 38.00 60.80 61.94 60.27 2.32 5.24 3.96 34 Uttaranchal 37.11 39.39 41.50 33.26 34.90 37.66 17.40 19.06 21.41 5.71 6.67 13.80 35 West Bengal 41.97 43.43 46.14 40.36 41.99 44.70 56.43 54.43 52.39 0.00 0.00 0.00
All Districts 44.22 45.02 47.83 44.83 45.68 48.50 37.18 31.57 30.71 5.82 7.69 11.22
22 Elementary Education in India

Number of Districts where Enrolment in Classes I-V
declined over Previous Year
% SC Population & Enrolment (I-VII/VIII)
% ST Population & Enrolment (I-VII/VIII)
Population % SC Enrolment Population % ST Enrolment
State/UT 2003-04 2004-05 2005-06 2001 2003-04 2004-05 2005-06 2001 2003-04 2004-05 2005-06
1 A & N Islands - - 0 0.00 - - 0.03 8.30 - - 8.06 2 Andhra Pradesh 22 14 20 16.20 19.66 19.6 19.29 6.60 9.50 9.32 9.38 3 Arunachal Pradesh - - 1 0.60 - 0.81 1.01 64.20 - 74.16 73.13 4 Assam 2 2 4 6.90 10.21 10.28 10.53 12.40 15.11 14.50 16.00 5 Bihar 12 1 9 15.70 16.06 15.87 15.44 0.90 1.03 1.15 1.28 6 Chandigarh - 1 0 17.50 15.56 14.62 12.92 0.00 0.05 0.10 0.09 7 Chhattisgarh 3 6 7 11.60 14.71 14.42 14.04 31.80 29.98 31.39 32.62 8 Dadra & Nagar Haveli - - 0 1.90 - - 3.47 62.20 - - 69.53 9 Daman & Diu - - 0 3.10 - - 4.27 8.80 - - 12.00
10 Delhi - - 3 16.90 - 12.05 12.25 0.00 - 0.39 0.45 11 Goa - - 0 1.80 - - 2.54 0.00 - - 5.60 12 Gujarat 8 12 1 7.10 7.82 8.19 7.51 14.80 18.89 18.28 18.34 13 Haryana 6 7 12 19.30 31.05 31.06 31.39 0.00 0.33 0.66 0.50 14 Himachal Pradesh 11 6 12 24.70 28.7 28.69 28.64 4.00 5.19 5.43 5.51 15 Jammu & Kashmir - - 2 7.60 - 8.76 9.52 10.90 - 12.94 12.93 16 Jharkhand 3 3 1 11.80 12.58 13.62 14.30 26.30 29.61 29.03 32.67 17 Karnataka 17 21 25 16.20 19.63 19.72 20.70 6.60 7.86 7.85 7.91 18 Kerala 9 8 0 9.80 10.88 12.17 11.01 1.10 1.64 2.12 2.06 19 Lakshadweep - - 0 0.00 - - 2.71 94.50 - - 95.01 20 Madhya Pradesh 14 3 7 15.20 16.74 17.01 15.76 20.30 19.61 21.06 19.15 21 Maharashtra 14 26 1 10.20 14.87 16.61 14.37 8.90 10.83 11.73 10.89 22 Manipur - - 0 2.80 - - 3.21 34.20 - - 37.84 23 Meghalaya - 3 5 0.50 1.48 1.48 1.05 85.90 92.37 92.32 92.89 24 Mizoram - - 1 0.00 0.26 0.46 0.51 94.50 98.75 98.19 97.09 25 Nagaland - - 1 0.00 2.32 1.63 1.88 89.10 97.31 94.43 94.65 26 Orissa 5 17 11 16.50 20.2 20.18 20.04 22.10 23.69 23.52 24.46 27 Pondicherry - - 1 16.20 - 20.76 18.33 0.00 - 0.08 0.07 28 Punjab - 1 12 28.90 54.31 43.97 47.33 0.00 0.13 0.29 0.21 29 Rajasthan 25 8 3 17.20 19.97 19.32 19.53 12.60 12.93 15.38 0.00 30 Sikkim - - 2 5.00 7.43 6.76 7.20 20.60 35.97 35.38 36.26 31 Tamil Nadu 20 14 12 19.00 25.87 25.65 24.81 1.00 1.50 1.68 1.81 32 Tripura - - 0 17.40 19.67 19.19 19.19 31.10 36.98 38.65 38.73 33 Uttar Pradesh 3 5 3 21.10 30.53 28.51 27.66 0.10 0.19 1.02 0.69 34 Uttaranchal 5 7 7 17.90 25.86 25.41 26.12 3.00 4.20 3.90 3.88 35 West Bengal 10 16 17 23.00 26.93 26.79 27.67 5.50 5.96 6.04 6.15
All Districts 189 181 180 16.20 20.84 20.58 18.64 8.20 9.71 10.18 9.02
DISE 2005-2006: Flash Statistics 23

% OBC Enrolment at Primary Level
Apparent Survival Rate Grade V
Average Flow Rates (%) 2004-05
Gross Enrolment Ratio (Primary Level)
NER @@ (Primary Level)
Sl No. State/UT 2003-04 2004-05 2005-06 2003-04 2004-05 2005-06
Promo-tion
Repeti-tion
Drop-out 2003-04 2004-05 2005-06 2005-06
1 A & N Islands - - 0.00 - - 103.89 - - 70.83 55.37 2 Andhra Pradesh 44.93 45.06 47.97 89.83 99.19 90.10 85.16 5.22 9.62 86.63 96.54 96.84 75.28
3 Arunachal Pradesh - 0.60 0.77 - 44.22 35.23
68.35 15.72 15.93 - 106.19 153.94 -
4 Assam 24.21 26.33 19.10 48.38 57.58 64.35 86.32 2.44 11.25 85.51 99.92 96.65 88.84 5 Bihar 60.29 60.05 62.06 33.71 39.23 46.04 75.10 13.54 11.36 76.20 91.05 92.44 84.13 6 Chandigarh 1.91 2.05 1.74 106.23 102.73 96.30 102.68 3.21 - 74.51 80.59 72.55 59.31 7 Chhattisgarh 47.90 47.08 45.26 64.26 60.96 59.04 78.20 12.14 9.66 107.56 108.78 131.48 - 8 D & N Haveli - - 0.81 - - 55.11 - - - - - 123.73 93.82 9 Daman & Diu - - 0.76 - - 90.59 - - - - - 85.70 70.11
10 Delhi - 7.62 7.91 - 80.02 79.13 94.66 9.14 - - 82.90 89.57 65.81 11 Goa - - 7.21 - - 88.97 - - - - - 54.12 48.17 12 Gujarat 49.50 50.51 49.92 75.21 78.93 74.38 84.61 11.09 4.3 91.35 95.68 100.30 78.89 13 Haryana 33.91 31.42 32.92 75.04 87.97 87.97 87.34 0.00 12.66 51.81 59.08 57.90 38.08 14 Himachal Pradesh 13.80 14.23 14.15 91.43 93.12 100.77 92.82 4.34 2.85 111.32 109.35 110.53 87.29 15 Jammu & Kashmir - 6.34 6.09 - 73.83 82.95 89.82 1.66 8.52 - 79.13 94.40 75.86 16 Jharkhand 42.83 45.86 42.32 33.88 37.33 38.70 77.21 5.81 16.98 75.68 89.00 123.58 63.66 17 Karnataka 44.62 44.94 46.27 95.31 98.22 98.69 94.10 3.85 2.06 106.23 105.95 93.58 83.97 18 Kerala 59.95 60.72 60.29 105.06 108.55 112.66 95.66 3.00 1.34 89.08 76.44 76.16 63.90 19 Lakshadweep - - 0.57 - - 80.21 - - - - - 87.39 69.33 20 Madhya Pradesh 43.84 41.05 37.89 80.58 70.91 72.29 90.07 0.12 9.81 93.84 116.28 129.76 94.22 21 Maharashtra 33.29 34.84 34.45 82.60 81.53 87.30 87.68 6.14 6.18 102.41 84.31 96.82 79.32 22 Manipur - - 8.80 - - 39.58 - - - - - 132.10 - 23 Meghalaya 0.60 0.67 0.65 31.68 36.16 37.84 69.17 8.30 22.53 97.70 127.56 132.83 94.01 24 Mizoram 0.38 0.61 0.44 55.99 58.74 70.71 91.21 5.63 3.16 128.01 157.91 155.76 - 25 Nagaland 0.02 0.88 0.61 58.61 57.13 55.66 85.36 5.73 8.91 104.43 115.16 133.13 - 26 Orissa 34.33 33.54 34.77 60.80 76.44 81.56 86.78 6.27 6.95 109.16 116.14 117.38 94.05 27 Pondicherry - 69.91 66.37 - 96.53 96.71 109.2 0.00 - - 61.81 79.54 56.66 28 Punjab 17.13 16.78 16.44 90.84 90.19 93.56 82.85 8.24 8.92 - 73.16 65.34 51.78 29 Rajasthan 50.40 48.98 48.52 42.68 50.85 54.24 74.27 10.83 14.9 87.50 100.20 112.72 81.52 30 Sikkim 39.40 38.36 41.14 64.67 66.73 65.90 72.71 21.59 5.70 128.31 143.19 138.00 94.54 31 Tamil Nadu 68.74 68.92 68.48 98.55 103.19 97.39 96.4 1.60 2.00 106.25 114.83 118.58 93.92 32 Tripura 16.16 15.31 14.93 67.44 64.37 70.66 80.7 15.25 4.05 132.29 138.29 133.40 - 33 Uttar Pradesh 40.07 43.01 47.68 54.09 56.63 62.31 84.07 1.83 14.10 85.68 98.33 107.27 97.74 34 Uttaranchal 19.52 20.23 21.73 59.76 62.89 66.52 81.04 7.43 11.53 89.54 96.81 97.00 83.32 35 West Bengal 3.73 4.04 4.51 64.13 73.58 80.48 74.82 13.63 11.55 103.43 106.57 104.45 82.76
All Districts 40.54 40.64 41.77 63.21 67.15 69.50 83.76 6.29 9.96 89.83 97.82 103.77 84.53
NER:Net Enrolment Ratio; @@ States reported above 100 per cent NER not reported
24 Elementary Education in India


E D U C AT I O N A L
D E V E L O P M E N T
I N D E X( E D I )

Variables Used in Computing Educational Development Index (EDI)
Component Indicator
Percentage of Habitations not Served ACCESS
Availability of Schools per 1000 Population
Average Student-Classroom Ratio
Schools with Student-Classroom Ratio ? 60
School without Drinking Water Facilities
School with Boy's Toilet
INFRASTRUCTURE
Schools with Girl's Toilet
Percentage of Female Teachers
Pupil-Teacher Ratio
School with Pupil-Teacher Ratio ? 60
Single-Teacher Schools (in schools with more than 15 students)
Percentage of Schools with 3 or less Teachers
TEACHERS
Teachers without Professional Qualification
Gross Enrolment Ratio - Overall
Scheduled Castes : Gross Enrolment Ratio
Scheduled Tribes : Gross Enrolment Ratio
Gender Parity Index in Enrolment
Repetition Rate
Drop-out Rate
Ratio of Exit class over Class 1 Enrolment (primary stage only)
Percentage of Passed Children to Total Enrolment
OUTCOMES
Percentage of Appeared Children passing with 60 per cent and above Marks
Note: Principal Component Analysis was used to assign loading factors before that indicators were normalised.
DISE 2005-2006: Flash Statistics 27

Education Development Index (EDI) All Schools under Government & Government Aided Managements
Primary Level Upper Primary Level Composite (Primary
& Upper Primary Level) Index
Sl No. State/UT EDI Rank EDI Rank EDI Rank
1 A & N Islands 0.569 20 0.618 19 0.594 19
2 Andhra Pradesh 0.630 11 0.648 15 0.639 12
3 Arunachal Pradesh 0.462 32 0.502 30 0.482 31
4 Assam 0.443 33 0.505 29 0.474 33
5 Bihar 0.327 35 0.340 35 0.333 35
6 Chandigarh 0.655 8 0.699 4 0.677 6
7 Chhattisgarh 0.574 18 0.550 26 0.562 24
8 Dadra & Nagar Haveli 0.524 27 0.582 24 0.553 26
9 Daman & Diu 0.556 23 0.651 14 0.603 17
10 Delhi 0.689 4 0.702 3 0.695 3
11 Goa 0.593 16 0.652 13 0.623 15
12 Gujarat 0.620 13 0.645 16 0.632 13
13 Haryana 0.550 25 0.598 21 0.574 22
14 Himachal Pradesh 0.666 5 0.692 6 0.679 5
15 Jammu & Kashmir 0.575 17 0.588 23 0.581 20
16 Jharkhand 0.407 34 0.445 34 0.426 34
17 Karnataka 0.657 7 0.690 7 0.674 7
18 Kerala 0.699 2 0.753 1 0.726 1
19 Lakshadweep 0.662 6 0.659 11 0.661 10
20 Madhya Pradesh 0.502 29 0.464 33 0.483 29
21 Maharashtra 0.625 12 0.659 10 0.642 11
22 Manipur 0.557 22 0.635 17 0.596 18
23 Meghalaya 0.573 19 0.565 25 0.569 23
24 Mizoram 0.646 10 0.686 9 0.666 9
25 Nagaland 0.521 28 0.514 28 0.518 28
26 Orissa 0.561 21 0.527 27 0.544 27
27 Pondicherry 0.713 1 0.723 2 0.718 2
28 Punjab 0.609 15 0.655 12 0.632 14
29 Rajasthan 0.529 26 0.591 22 0.560 25
30 Sikkim 0.649 9 0.688 8 0.669 8
31 Tamil Nadu 0.694 3 0.696 5 0.695 4
32 Tripura 0.551 24 0.598 20 0.574 21
33 Uttar Pradesh 0.481 30 0.470 32 0.475 32
34 Uttaranchal 0.610 14 0.629 18 0.620 16
35 West Bengal 0.479 31 0.486 31 0.482 30
28 Elementary Education in India

Education Development Index (EDI) All Schools: All Managements
Primary Level Upper Primary Level Composite (Primary
& Upper Primary Level) Index
State/UT EDI Rank EDI Rank EDI Rank
A & N Islands 0.511 26 0.620 20 0.566 20
Andhra Pradesh 0.604 11 0.705 8 0.654 8
Arunachal Pradesh 0.417 34 0.500 31 0.458 33
Assam 0.454 31 0.525 28 0.490 30
Bihar 0.335 35 0.319 35 0.327 35
Chandigarh 0.642 5 0.737 3 0.690 5
Chhattisgarh 0.557 16 0.561 24 0.559 22
Dadra & Nagar Haveli 0.492 29 0.584 23 0.538 24
Daman & Diu 0.536 19 0.648 14 0.592 17
Delhi 0.688 1 0.725 5 0.707 2
Goa 0.529 20 0.643 16 0.586 18
Gujarat 0.595 12 0.666 11 0.630 13
Haryana 0.521 22 0.591 22 0.556 23
Himachal Pradesh 0.630 7 0.707 7 0.668 7
Jammu & Kashmir 0.556 17 0.639 17 0.597 16
Jharkhand 0.428 33 0.441 34 0.435 34
Karnataka 0.627 8 0.720 6 0.674 6
Kerala 0.660 3 0.755 1 0.708 1
Lakshadweep 0.635 6 0.664 12 0.650 10
Madhya Pradesh 0.514 24 0.509 29 0.512 29
Maharashtra 0.593 13 0.677 10 0.635 12
Manipur 0.520 23 0.608 21 0.564 21
Meghalaya 0.512 25 0.556 27 0.534 26
Mizoram 0.623 9 0.677 9 0.650 9
Nagaland 0.510 28 0.556 26 0.533 27
Orissa 0.522 21 0.502 30 0.512 28
Pondicherry 0.651 4 0.748 2 0.700 4
Punjab 0.568 15 0.648 15 0.608 14
Rajasthan 0.540 18 0.626 19 0.583 19
Sikkim 0.611 10 0.660 13 0.635 11
Tamil Nadu 0.672 2 0.730 4 0.701 3
Tripura 0.511 27 0.560 25 0.535 25
Uttar Pradesh 0.482 30 0.482 32 0.482 31
Uttaranchal 0.575 14 0.635 18 0.605 15
West Bengal 0.454 32 0.480 33 0.467 32
DISE 2005-2006: Flash Statistics 29