Elemental Analysis using next generation plasma spectroscopy · 2016-09-11 · 1 Elemental Analysis...
43
April 22, 2014 Confidentiality Label 1 Elemental Analysis using next generation plasma spectroscopy
Transcript of Elemental Analysis using next generation plasma spectroscopy · 2016-09-11 · 1 Elemental Analysis...
April 22, 2014
Confidentiality Label
1
Elemental Analysis using next generation plasma spectroscopy
April 22, 2014
Confidentiality Label
2
Agenda
• Routine elemental spectroscopy over the last 50 years
• Common challenges facing routine elemental spectroscopy
• R&D to address challenges
• How does the MP-AES work?
• Analytical performance and applications.

April 22, 2014
Confidentiality Label
3
Routine Elemental Analysis over last 50 yrs
• Routine = 5-10 elements. 100-200 samples per day. Mid ppb
to ppm concentration range.
Sample
Ground State Excited State
Flame Graphite Furnace
Or
Monochromator
&Detector
Quantitation
Lamp
Hollow Cathode Lamp
(HCL)
Electrode-Less Discharge
Lamp (EDL)
AAS
April 22, 2014
Confidentiality Label
4
Agenda
• Routine elemental spectroscopy over the last 50 years
• Common challenges facing routine elemental spectroscopy
• R&D to address challenges
• How does the MP-AES work?
• Analytical performance and applications.

April 22, 2014
Confidentiality Label
5
Common challenges facing Labs doing elemental analysis
• Increased need for multi-element determination over a wide dynamic range
• Desire to reduce the overall cost of analysis due to rising costs (instrument supplies and consumables – power, labor, etc)
• Some laboratories under pressure to improve safety by removing flammable gases
• Difficulty in sourcing some gases – especially in remote areas and emerging geographies
• Availability of suitably trained personnel to develop methods, perform sample measurement and interpret results
April 22, 2014
Confidentiality Label
6
Agenda
• Routine elemental spectroscopy over the last 50 years
• Common challenges facing routine elemental spectroscopy
• R&D to address challenges
• How does the MP-AES work?
• Analytical performance and applications.
April 22, 2014
Confidentiality Label
7
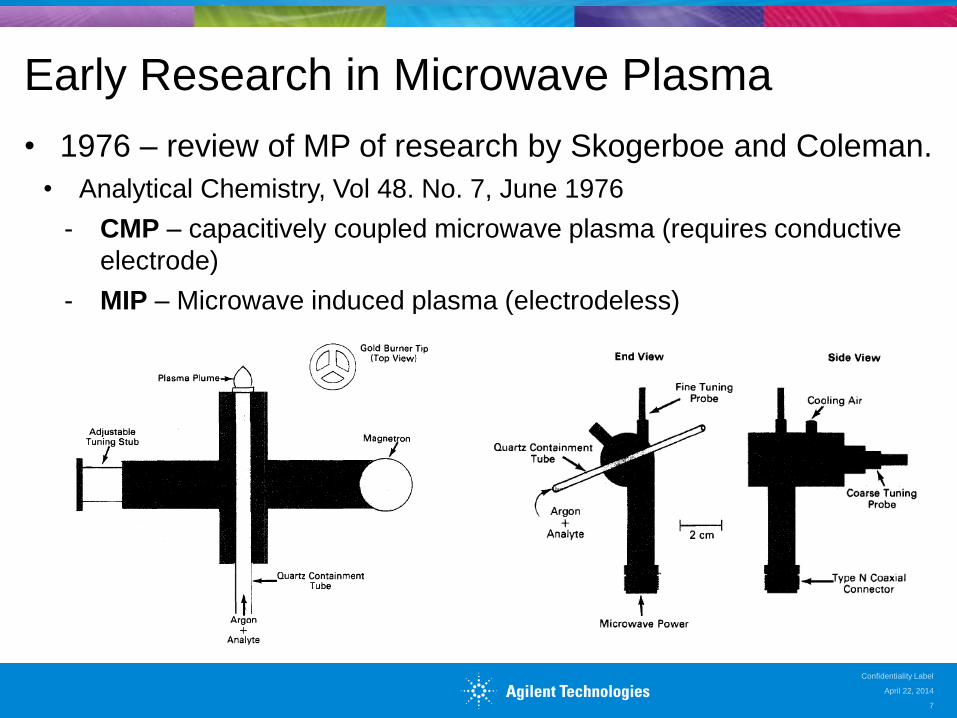
Early Research in Microwave Plasma
• 1976 – review of MP of research by Skogerboe and Coleman.
• Analytical Chemistry, Vol 48. No. 7, June 1976
- CMP – capacitively coupled microwave plasma (requires conductive
electrode)
- MIP – Microwave induced plasma (electrodeless)
April 22, 2014
Confidentiality Label
8
Early research conclusion
• CMP was better suited for elemental analysis
• Sample is introduced from peripheral boundary of the plasma. This lead
to analytical problems.
• MIP was better suited as an atomization/ionization
source for GC
• Could not handle lots of liquid as the plasma would extinguish.
• CONCLUSION: “Plasmas produced with low power
microwave supplies show considerable promise as spectral
excitation sources.”

April 22, 2014
Confidentiality Label
9
MP-AES technology research at Agilent
• CMP and MIP systems not adequate for routine elemental
spectroscopy - needs new approach.
• Used axial magnetic and radial electric field from microwave
source to sustain plasma.
Senior Research Engineer:
Michael Hammer
Senior Development Engineer:
Hugh Stevenson

April 22, 2014
Confidentiality Label
10
Award winning MP-AES
2013 AIRG medal
2012 R&D 100

April 22, 2014
Confidentiality Label
11
Agenda
• Routine elemental spectroscopy over the last 50 years
• Common challenges facing routine elemental spectroscopy
• R&D to address challenges
• How does the MP-AES work?
• Analytical performance and applications.

Ground State Excited State Relaxation
Sample
Microwave excited
Plasma
Monochromator
& Detector
Quantitation
Atom Formation
EXCITATION
Emission
Page 12
Microwave Plasma Emission Overview
MP-AES
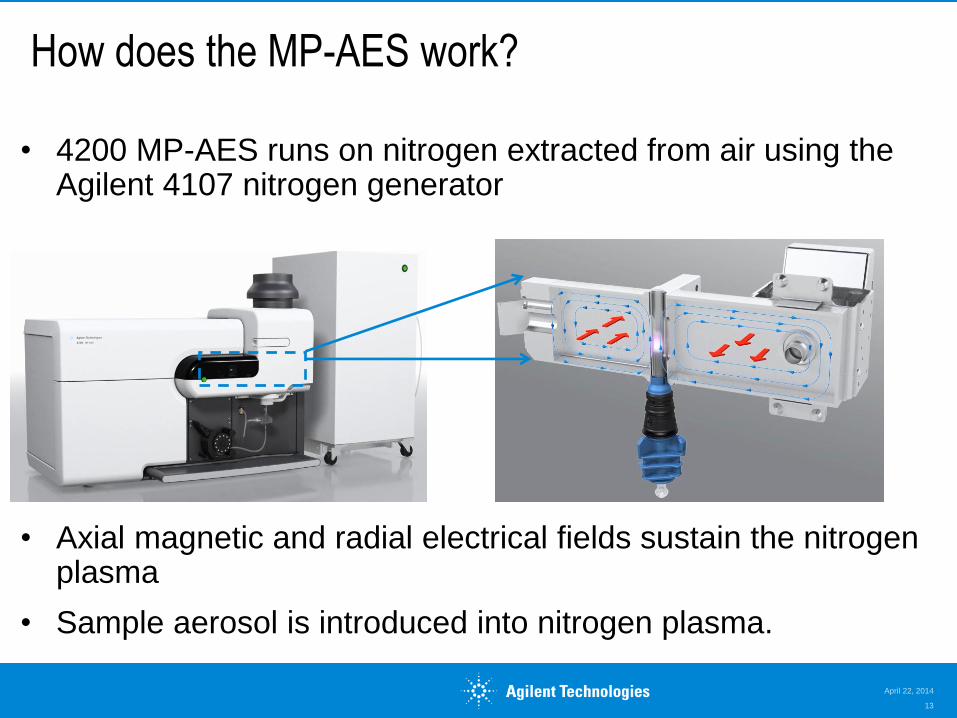
How does the MP-AES work?
• 4200 MP-AES runs on nitrogen extracted from air using the Agilent 4107 nitrogen generator
• Axial magnetic and radial electrical fields sustain the nitrogen plasma
• Sample aerosol is introduced into nitrogen plasma.
April 22, 2014
13

How does the MP-AES work?
• Axial emission from the vertical oriented nitrogen plasma is
directed into the fast scanning monochromator optics
• Wavelength specific emissions are detected using a high
efficiency CCD.
April 22, 2014
14
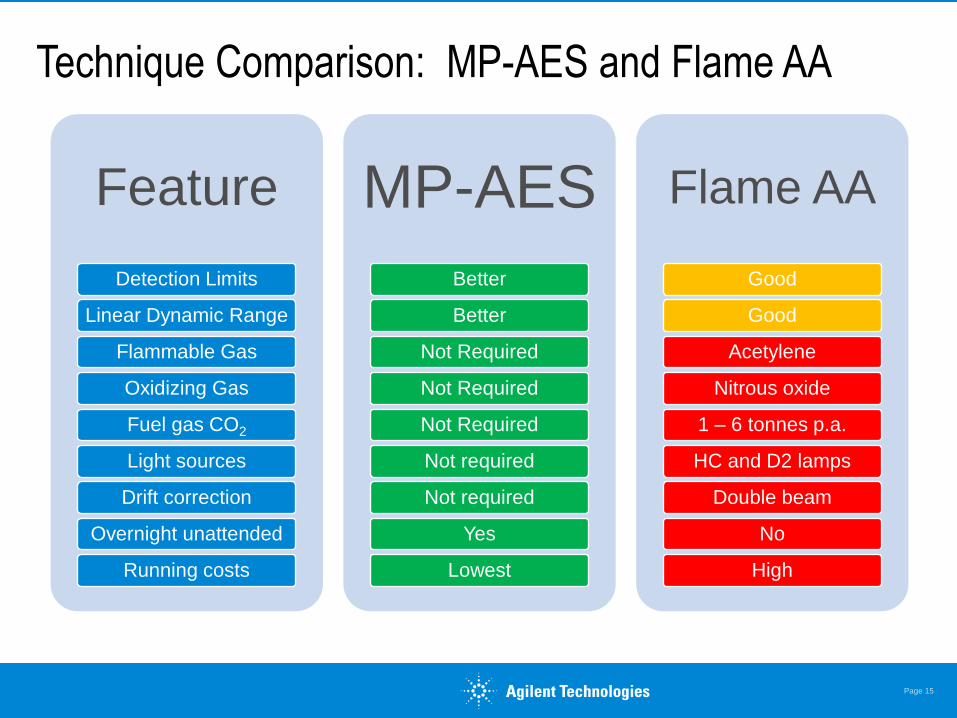
Technique Comparison: MP-AES and Flame AA
Feature
Detection Limits
Linear Dynamic Range
Flammable Gas
Oxidizing Gas
Fuel gas CO2
Light sources
Drift correction
Overnight unattended
Running costs
MP-AES
Better
Better
Not Required
Not Required
Not Required
Not required
Not required
Yes
Lowest
Flame AA
Good
Good
Acetylene
Nitrous oxide
1 – 6 tonnes p.a.
HC and D2 lamps
Double beam
No
High
Page 15

Higher Performance
• Ideal flame AA alternative
• Handles major, minor & most trace levels
• Wider linear dynamic range
• Lower detection limits
Easy Operation
• New generation software
• Simultaneous auto background correction
• Plug & Play torch
Safer Laboratory Operation
• No flammable gases
• Unattended multi-element operation
Key benefits of MP-AES
Lowest cost of ownership
• Runs on air!
• Eliminates on-going gas supply costs

Low cost of ownership
April 22, 2014
Agilent Confidential
17
• Supply of gases is the major on going cost for any routine
elemental spectrometer.
• 4200 MP-AES uses nitrogen extracted from air using Agilent
4107 nitrogen generator.
• Example, big USA fruit juice manufacturer doing 100 FAAS
samples per day, 3 elements per sample.
Online cost estimator available at:
http://www.chem.agilent.com/en-
US/products-services/Instruments-
Systems/Atomic-
Spectroscopy/Pages/mpaes-
estimator.aspx

Safety
April 22, 2014
18
• Using inert nitrogen gas to sustain the
atomization/ionization source eliminates
the need to use combustible gases like
acetylene.
• Not having to ever replace a gas cylinder
reduces manual handling issues.

3 sigma DLs using a 10 second integration time with dewar nitrogen
Element Flame AA 4200MP-
AES
K 0.8 0.65
Ca 0.4 0.04
Mg 0.3 0.09
Na 0.3 0.12
Au 5 2.1
Pt 76 6.1
Pd 15 1.6
Ag 1.7 1.2
Rh 4 0.5
DL’s in ppb, clean water samples
4200 MP-AES Performance – Detection Limits
Element Flame AA 4200 MP-
AES
As* 60 57
Cd 1.5 1.4
Cr 5 0.3
Mn 1.0 1.05
Pb 14 2.5
Sb 37 12
Se* 500 77
Zn 1.6 3.1
* 30 second integration time used for these elements

Ease of use– reduced sample preparation
Optimum working range
comparison between FAAS
and MP-AES:
April 22, 2014
20
Element 4200 MP-AES,
mg/L
Linear correlation
coef. MP-AES
FAAS, mg/L
Au 242.8 0.05 – 50 0.9999 0.1 – 30
Ca 422.6 0.01 – 20 0.9999 0.01-10
Mg 518.3 0.05 – 100 0.99988 0.15-20 (202.6nm)
Na 589.5 0.01 – 20 0.99996 0.01-2
K 767.8 0.05 – 100 0.99968 1-6
Example: Au 242.8nm calibration for 4200 MP-AES

Ease of Use
Simple hardware
• Torch installation
• Sample Introduction System
April 22, 2014
21

Ease of Use
Simple software
• Applet quick start methods
• Auto optimization tools
• FLIC and IEC tools
April 22, 2014
22

Ease of Use - MP-AES verses FAAS
• Simple sample preparation
- Reduced chemical and ionization interferences minimizes need for
addition of extra reagents
• Lower costs, higher sample throughput
• Reduces introduction of possible contaminants
April 22, 2014
23

April 22, 2014
Confidentiality Label
24
Agenda
• Routine elemental spectroscopy over the last 50 years
• Common challenges facing routine elemental spectroscopy
• R&D to address challenges
• How does the MP-AES work?
• Analytical performance and applications.

Determination of major elements in copper alloys using the Agilent 4200 MP-AES
April 22, 2014
25

Major elements in copper alloys by 4200 MP-AES
Copper alloy sample preparation:
1 g SRM drillings (3 different alloys) was digested in open test
tube (pyrex) digestion / 1.5 ml HNO3 and 4.5 ml HCl made to
50ml (2% TDS 50 x dilution).
For determination of Cu and Zn, the samples were diluted
further 1:50 (0.04% TDS, 2500 x dilution)
Calibration solutions were prepared from commercial bulk
standards.
April 22, 2014
Confidentiality Label
26

Analysis of brass and bronze – major elements Cu and Zn
These analysis results had Neb flow optimized on the diluted bronze sample
Note: Cu and Zn had different nebulizer flows after auto optimisation.
Element Certified value (%) Result with MP(%) Wavelengths
Aluminium Brass Cu 75.1 75.2 (100.1%) 219 nm
SRM 1118 Zn 21.9 22.3 (101.8%) 481 nm
Bronze Standard Cu 93.0 92.4 (99.4%) 219 nm
NBS C1117 Zn 6.8 6.8 (100%) 481 nm
Naval Brass Cu 65.0 65.9 (101.4%) 219 nm
NIST C1108 Zn 34.4 34.3 (99.7%) 481 nm

Determination of major, minor and trace elements in rice flour using the 4200 (MP-AES)
April 22, 2014
Page 28

Sample Preparation NIES CRM 10c Rice Flour
• Digested in Milestone Ethos microwave using preloaded
method
• 0.5g in 7 mL of HNO3 and 1 mL H2O2
• Digested, cooled then diluted to 25 mL
• Final total dissolved solids of 2%
No further sample preparation required
No modifiers or ionization buffers required
22 April 2014
29

Results Method Detection Limits
Element/
Wavelengt
h (nm)
Ca
422.673
Cd
228.802
Cu
324.754
Fe
438.354
K
766.491
Mg
280.271
Mn
403.076
P
214.915
Zn
213.857
MDL
(mg/kg)
In soild
sample
0.10 0.16 0.05 0.44 3.0 0.06 0.05 13 0.15
22 April 2014
30
Excellent Detection Limits
• 2nd generation waveguide and torch handle the 2% matrix
• Standard, robust sample introduction setup
• High temperature plasma source (~5000K) improves
performance
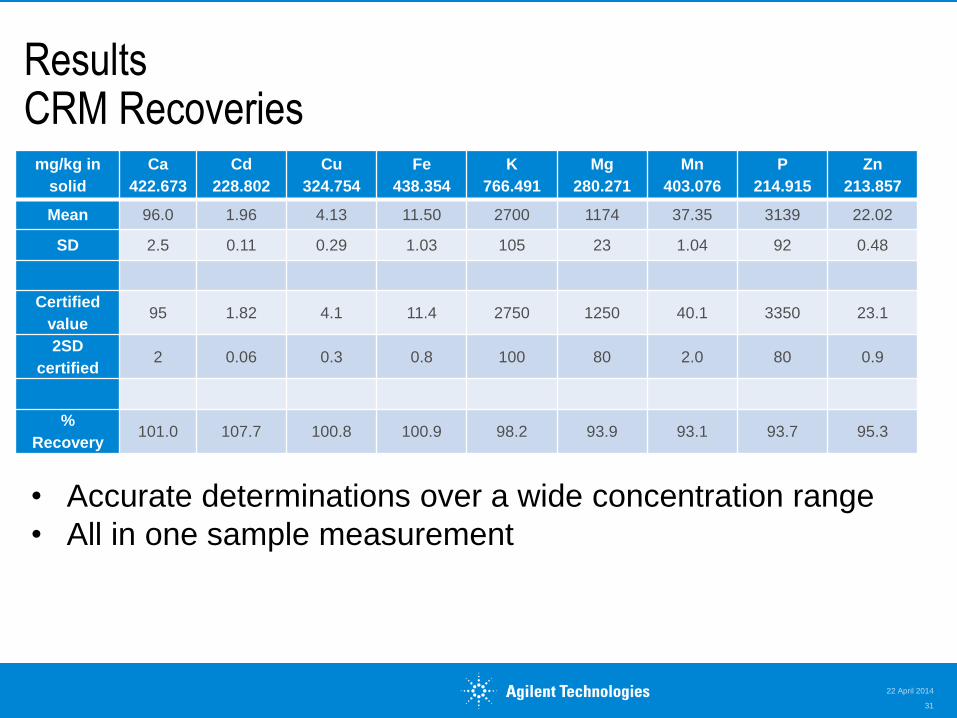
Results CRM Recoveries
mg/kg in
solid
Ca
422.673
Cd
228.802
Cu
324.754
Fe
438.354
K
766.491
Mg
280.271
Mn
403.076
P
214.915
Zn
213.857
Mean 96.0 1.96 4.13 11.50 2700 1174 37.35 3139 22.02
SD 2.5 0.11 0.29 1.03 105 23 1.04 92 0.48
Certified
value 95 1.82 4.1 11.4 2750 1250 40.1 3350 23.1
2SD
certified 2 0.06 0.3 0.8 100 80 2.0 80 0.9
%
Recovery 101.0 107.7 100.8 100.9 98.2 93.9 93.1 93.7 95.3
22 April 2014
31
• Accurate determinations over a wide concentration range
• All in one sample measurement

Long Term Stability <3% RSD for all elements over 8 hours in 2% TDS
22 April 2014
32
0
0.1
0.2
0.3
0.4
0.5
0.6
0.7
0.8
0.9
1
1.1
1.2
1.3
1.4
1.5
0 33 66 99 132
No
rmalized
Co
nc.
No. of Samples
Ca 422.673 Cd 228.802 Cu 324.754 Fe 438.354 K 766.491
Mg 280.271 Mn 403.076 P 214.915 Zn 213.857
Combination of improved waveguide and torch, robust plasma
and sample introduction give excellent long term stability

Experiment Summary 4200 MP-AES is the ideal FAAS alternative
Improved Performance
• Increased working range
• Phosphorus
• Lower detection limits
Reduced Running Costs
• Runs on Air!
• No modifiers
Increased safety
• No acetylene
• No nitrous oxide
Ease of Use
• MP Expert
• Simple sample prep
• No burner change over
22 April 2014
33

Determination of major and minor elements in geological samples using the 4200 Microwave Plasma-Atomic Emission Spectrometer (MP-AES)
April 22, 2014
34

Analytical challenges of analyzing geochemical samples
• Wide working range to cover major, minor and trace concentrations
• High levels of total dissolved solids, complex acid sample prep
• Spectral interferences due to emission line overlaps
• Varying sample composition
• Non-spectral interferences due to EIE
April 22, 2014
35

Sample preparation
Two CRMs prepared
• GBM398-4 Low grade Cu/Pb/Zn with Laterite
• GBM908-14 Cu-Zn-Pb Sulphide Ore
Acid digestion
• HNO3-HCl-HClO4-HF four-acid ‘total’ digestion
Sample dilution
• 0.4 g nominal sample weight brought to 100 mL final volume with 30% HCl
Calibration standards
• All calibration standards in 6% HNO3 and 19% HCl
- No modifiers or ionization buffers required
- No further sample dilutions required
April 22, 2014
36

Analyte line selection, and background and interference correction methods
April 22, 2014
37
Element Wavelength (nm) Type Background Correction
Interference Correction Possible Interferences
Ni 305.082 Analyte FLIC La
Ag 328.068 Analyte Auto IEC Cu, Ti
Ti 334.940 IEC element Auto x x
Pb 405.781 Analyte FLIC La and Ti
Zn 481.053 Analyte FLIC La, Sr, and Ti
Cu 510.554 Analyte FLIC Al2O3, and La
Lu 547.669 Internal standard FLIC Ni, Ti
• Wavelengths were selected to minimize spectral interferences and have
widest dynamic range
• All calibration curves are linear with correlation coefficient >0.999 and
<10% calibration fit error
• Lu internal standard was 10 ppm and delivered via Y-connector to the
sample tubing
Table 2. The emission line selection, background and interference correction methods
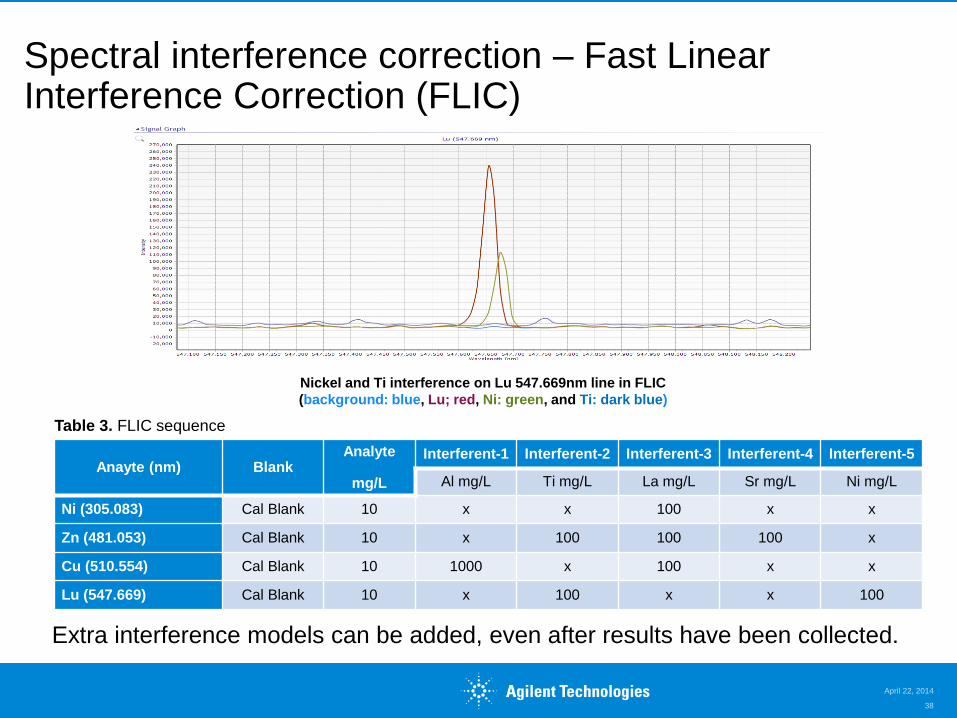
Spectral interference correction – Fast Linear Interference Correction (FLIC)
April 22, 2014
38
Nickel and Ti interference on Lu 547.669nm line in FLIC
(background: blue, Lu; red, Ni: green, and Ti: dark blue)
Anayte (nm) Blank Analyte
mg/L
Interferent-1 Interferent-2 Interferent-3 Interferent-4 Interferent-5
Al mg/L Ti mg/L La mg/L Sr mg/L Ni mg/L
Ni (305.083) Cal Blank 10 x x 100 x x
Zn (481.053) Cal Blank 10 x 100 100 100 x
Cu (510.554) Cal Blank 10 1000 x 100 x x
Lu (547.669) Cal Blank 10 x 100 x x 100
Extra interference models can be added, even after results have been collected.
Table 3. FLIC sequence
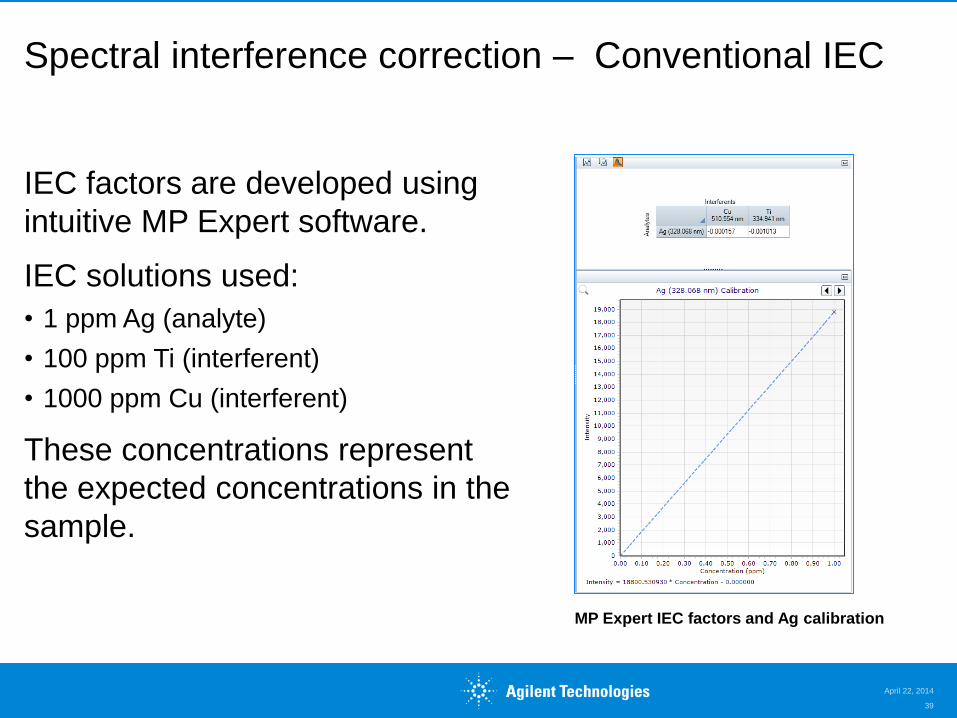
Spectral interference correction – Conventional IEC
IEC factors are developed using
intuitive MP Expert software.
IEC solutions used:
• 1 ppm Ag (analyte)
• 100 ppm Ti (interferent)
• 1000 ppm Cu (interferent)
These concentrations represent
the expected concentrations in the
sample.
April 22, 2014
39
MP Expert IEC factors and Ag calibration

Results and discussion
April 22, 2014
40
Reference MDL GBM398-4 GBM908-14
MP-AES Certified Recovery (%) MP-AES Certified Recovery (%)
Ag (mg/kg) 1 45.8 48.7 94 289.7 304.7 98
Cu (wt %) 0.002 0.37 0.39 95 2.30 2.37 97
Ni (wt %) 0.002 0.39 0.41 97 - Not reported -
Pb (wt %) 0.002 1.08 1.17 92 3.24 3.30 98
Zn (wt %) 0.002 0.50 0.51 98 4.24 4.27 99
All results are shown as results in the original sample.
Results demonstrate the ability of the 4200 MP-AES to:
• Measure Ag at low concentrations, with interferences corrected by IECs
• Achieve excellent recoveries across a wide concentration range (0.39% to
2.37% for Cu, and 0.51% to 4.27% for Zn)
• Determine all elements in a single sample preparation
Table 4. MP-AES and certified CRM results

Potential cost savings with the 4200 MP-AES
April 22, 2014
41
This example is intended to help you compare the running costs &
savings of the MP-AES vs. flame AA. The applied formulas and
parameters are correct to the best of our knowledge, but we cannot
guarantee the results. Savings may vary depending on factors such
as local gas and electricity costs, operator costs, number and types
of elements. For this calculation operator labor costs were set to
US$25/hour and electricity costs were set to US$0.18 per kW.
Total savings of more than
US$150k over an 7 year
evaluation period.
• FAAS with air compressor and
1 year consumables
• MP-AES with air compressor,
SPS 3 and 1 year consumables
• 5 elements measured under
method conditions
• 350 samples per week

Experiment Summary The Agilent 4200 MP-AES is the ideal FAAS replacement.
Improved performance
• Increased linear working range
• Lower detection limits
Reduced running costs
• Runs on air
Increased safety
• No acetylene
• No nitrous oxide
Ease of use
• MP Expert
• IEC and FLIC
• Simple sample prep
April 22, 2014
42
Conclusions
The 4200 MP-AES is the second generation of proven MP-AES technology, and is an ideal alternative (upgrade) for flame AA.
• MP-AES offers safe, cost effective elemental analysis, and is an ideal tool for routine beverage, food, and geochemical sample analysis
• QUESTIONS
April 22, 2014
Confidentiality Label
43