Electrostatic field aroundcytochrome c: … field aroundcytochromec: Theoryandenergy transfer...
5
Proc. Nati. Acad. Sci. USA Vol. 87, pp. 9503-9507, December 1990 Biophysics Electrostatic field around cytochrome c: Theory and energy transfer experiment (fluorescence/molecular dynamics/protein/bimolecular rate/Poisson-Boltzmann equation) SCOTT H. NORTHRUP*, THEODORE G. WENSELtt, CLAUDE F. MEARESt, JOHN J. WENDOLOSKI§ AND JAMES B. MATTHEW§¶II *Chemistry Department, Tennessee Technological University, Cookeville, TN 38505; tChemistry Department, University of California, Davis, CA 95616; and ME. I. du Pont de Nemours Company, Central Research and Development Department, Wilmington, DE 19898 Communicated by Frederic M. Richards, August 20, 1990 ABSTRACT Energy transfer in the "rapid diffusion" limit from electronically excited terbium(llI) chelates in three different charge states to horse heart ferricytochrome c was measured as a function of ionic strength. Theoretical rate constants calculated by numerical integration of the Forster integral (containing the Poisson-Boltzmann-generated protein electrostatic potential) were compared with the experimental data to evaluate the accuracy of protein electrostatic field calculations at the protein/solvent interface. Two dielectric formalisms were used: a simple coulombic/Debye-Huckel procedure and a finite difference method [Warwicker, J. & Watson, H. C. (1982)J. Mol. Biol. 157, 671-679] that accounts for the low-dielectric protein interior and the irregular pro- tein/solvent boundary. Good agreement with experiment was obtained and the ionic-strength dependence of the reaction was successfully reproduced. The sensitivity of theoretical rate constants to the choices of effective donor sphere size and the energy transfer distance criterion was analyzed. Electrostatic potential and rate-constant calculations were carried out on sets of structures collected along two molecular dynamics trajectories of cytochrome c. Protein conformational fluctua- tions were shown to produce large variations in the calculated energy transfer -rate constant. We conclude that protein fluc- tuations and the resulting transient structures can play signif- icant roles in biological or catalytic activities that are not apparent from examination of a static structure. For calculat- ing protein electrostatics, large-scale low-frequency conforma- tional fluctuations, such as charged side-chain reorientation, are established to be as important as the computational method for incorporating dielectric boundary effects. Electrostatic interactions are known to play a significant role in the biological activity of proteins, as indicated by the pH and ionic-strength dependence of virtually all protein reac- tions (1). Numerous studies have shown that reaction rates between proteins and charged substrates often depend strongly on the solution ionic strength. These observations have been taken to suggest that intermolecular electrostatic forces are important in facilitating the association of reaction complexes. To analyze specific interactions at the molecular level an accurate description of the electrostatic forces around the protein is essential. The electrostatic analysis of proteins by theoretical frameworks is usually couched in terms of the net charge and the dipole moment (2, 3), higher moments (4), or the full asymmetric charge distribution of a single structure derived by crystallography (5-10). One of the more rigorous approaches to the computation of the electro- static field surrounding proteins in aqueous electrolyte solu- tion involves the iteration of the Poisson-Boltzmann equa- tion by the Warwicker-Watson (WW) algorithm (11). Starting with the protein crystal structure, this procedure accounts for (i) the irregular topography of the protein surface, (ii) the presence of diffusible ions in the medium, and (iii) the discontinuity in the dielectric constant and ionic strength across the protein/solvent boundary. This method has been useful in understanding the propagation of electric fields across irregular dielectric boundaries. Dielectric continuum models applied to a single structure do account for the effects of small-scale high-frequency fluctuation of protein structure through the effective dielectric constant; however, they do not account for large-scale conformational variability due to slower charged side-chain reorientation. Another fundamen- tal question concerns refining computational methods based on an ensemble average structure (12) while experiments may represent the properties of a regularly occurring transient conformer. Here we examine how large-scale, slow, confor- mational fluctuations affect pH- and ionic strength- dependent predictions, and establish a protocol for deter- mining the rms deviation for a computed value that is attributable to an average structure assumption. Diffusion-enhanced energy transfer studies provide a con- venient way to probe the electrostatic field surrounding proteins and DNA in solution (13). Accurate experimental energy transfer rates for charged probe behavior around charged macromolecules allow us to evaluate the accuracy of theoretical electrostatic methods. Experimental energy transfer rates from electronically excited terbium chelates to the heme of horse heart ferricytochrome c were measured (14) as a function of sodium chloride concentration for terbium probes in three different charged states: - le, Oe, and + le. Series of structures collected along molecular dynamics (MD) trajectories of horse heart cytochrome c were used to evaluate the sensitivity of electrostatic calculations and the predicted energy transfer rate constants to protein structural flexibility. Two different electrostatic computational formal- isms were applied to these structures, a simple Debye- Huckel (DH) procedure and the WW finite difference method (11). The second-order rate constant for dipole-dipole energy transfer in the rapid diffusion limit (i.e., diffusion is suffi- ciently rapid to provide an equilibrium spatial distribution of donors around acceptors) is obtained for a single structure by integrating the energy transfer rate (15) over all donor- Abbreviations: MD, molecular dynamics; WW, Warwicker-Watson; DH, Debye-Huckel; D80, MD trajectory with high dielectric for- malism; DW, trajectory with explicit water molecules. tPresent address: Baylor College of Medicine, Houston, TX 77030. 1Present address: ICI Pharmaceuticals Group, Structural Chemistry, Wilmington, DE 19897. ITo whom reprint requests should be addressed at present address. 9503 The publication costs of this article were defrayed in part by page charge payment. This article must therefore be hereby marked "advertisement" in accordance with 18 U.S.C. §1734 solely to indicate this fact.
Transcript of Electrostatic field aroundcytochrome c: … field aroundcytochromec: Theoryandenergy transfer...
Proc. Nati. Acad. Sci. USAVol. 87, pp. 9503-9507, December 1990Biophysics
Electrostatic field around cytochrome c: Theory and energytransfer experiment
(fluorescence/molecular dynamics/protein/bimolecular rate/Poisson-Boltzmann equation)
SCOTT H. NORTHRUP*, THEODORE G. WENSELtt, CLAUDE F. MEARESt, JOHN J. WENDOLOSKI§AND JAMES B. MATTHEW§¶II*Chemistry Department, Tennessee Technological University, Cookeville, TN 38505; tChemistry Department, University of California, Davis, CA 95616;and ME. I. du Pont de Nemours Company, Central Research and Development Department, Wilmington, DE 19898
Communicated by Frederic M. Richards, August 20, 1990
ABSTRACT Energy transfer in the "rapid diffusion"limit from electronically excited terbium(llI) chelates in threedifferent charge states to horse heart ferricytochrome c wasmeasured as a function of ionic strength. Theoretical rateconstants calculated by numerical integration of the Forsterintegral (containing the Poisson-Boltzmann-generated proteinelectrostatic potential) were compared with the experimentaldata to evaluate the accuracy of protein electrostatic fieldcalculations at the protein/solvent interface. Two dielectricformalisms were used: a simple coulombic/Debye-Huckelprocedure and a finite difference method [Warwicker, J. &Watson, H. C. (1982)J. Mol. Biol. 157, 671-679] that accountsfor the low-dielectric protein interior and the irregular pro-tein/solvent boundary. Good agreement with experiment wasobtained and the ionic-strength dependence of the reaction wassuccessfully reproduced. The sensitivity of theoretical rateconstants to the choices of effective donor sphere size and theenergy transfer distance criterion was analyzed. Electrostaticpotential and rate-constant calculations were carried out onsets of structures collected along two molecular dynamicstrajectories of cytochrome c. Protein conformational fluctua-tions were shown to produce large variations in the calculatedenergy transfer -rate constant. We conclude that protein fluc-tuations and the resulting transient structures can play signif-icant roles in biological or catalytic activities that are notapparent from examination of a static structure. For calculat-ing protein electrostatics, large-scale low-frequency conforma-tional fluctuations, such as charged side-chain reorientation,are established to be as important as the computational methodfor incorporating dielectric boundary effects.
Electrostatic interactions are known to play a significant rolein the biological activity of proteins, as indicated by the pHand ionic-strength dependence of virtually all protein reac-tions (1). Numerous studies have shown that reaction ratesbetween proteins and charged substrates often dependstrongly on the solution ionic strength. These observationshave been taken to suggest that intermolecular electrostaticforces are important in facilitating the association of reactioncomplexes. To analyze specific interactions at the molecularlevel an accurate description of the electrostatic forcesaround the protein is essential. The electrostatic analysis ofproteins by theoretical frameworks is usually couched interms of the net charge and the dipole moment (2, 3), highermoments (4), or the full asymmetric charge distribution of asingle structure derived by crystallography (5-10). One of themore rigorous approaches to the computation of the electro-static field surrounding proteins in aqueous electrolyte solu-
tion involves the iteration of the Poisson-Boltzmann equa-tion by the Warwicker-Watson (WW) algorithm (11). Startingwith the protein crystal structure, this procedure accounts for(i) the irregular topography of the protein surface, (ii) thepresence of diffusible ions in the medium, and (iii) thediscontinuity in the dielectric constant and ionic strengthacross the protein/solvent boundary. This method has beenuseful in understanding the propagation of electric fieldsacross irregular dielectric boundaries. Dielectric continuummodels applied to a single structure do account for the effectsof small-scale high-frequency fluctuation of protein structurethrough the effective dielectric constant; however, they donot account for large-scale conformational variability due toslower charged side-chain reorientation. Another fundamen-tal question concerns refining computational methods basedon an ensemble average structure (12) while experiments mayrepresent the properties of a regularly occurring transientconformer. Here we examine how large-scale, slow, confor-mational fluctuations affect pH- and ionic strength-dependent predictions, and establish a protocol for deter-mining the rms deviation for a computed value that isattributable to an average structure assumption.
Diffusion-enhanced energy transfer studies provide a con-venient way to probe the electrostatic field surroundingproteins and DNA in solution (13). Accurate experimentalenergy transfer rates for charged probe behavior aroundcharged macromolecules allow us to evaluate the accuracy oftheoretical electrostatic methods. Experimental energytransfer rates from electronically excited terbium chelates tothe heme of horse heart ferricytochrome c were measured(14) as a function of sodium chloride concentration forterbium probes in three different charged states: - le, Oe, and+ le. Series of structures collected along molecular dynamics(MD) trajectories of horse heart cytochrome c were used toevaluate the sensitivity of electrostatic calculations and thepredicted energy transfer rate constants to protein structuralflexibility. Two different electrostatic computational formal-isms were applied to these structures, a simple Debye-Huckel (DH) procedure and theWW finite difference method(11).The second-order rate constant for dipole-dipole energy
transfer in the rapid diffusion limit (i.e., diffusion is suffi-ciently rapid to provide an equilibrium spatial distribution ofdonors around acceptors) is obtained for a single structure byintegrating the energy transfer rate (15) over all donor-
Abbreviations: MD, molecular dynamics; WW, Warwicker-Watson;DH, Debye-Huckel; D80, MD trajectory with high dielectric for-malism; DW, trajectory with explicit water molecules.tPresent address: Baylor College of Medicine, Houston, TX 77030.1Present address: ICI Pharmaceuticals Group, Structural Chemistry,Wilmington, DE 19897.ITo whom reprint requests should be addressed at present address.
9503
The publication costs of this article were defrayed in part by page chargepayment. This article must therefore be hereby marked "advertisement"in accordance with 18 U.S.C. §1734 solely to indicate this fact.
Proc. Natl. Acad. Sci. USA 87 (1990)
acceptor geometries. The predicted bimolecular rate con-stant for energy transfer is then given by the volume integral:
k = 0.6023(R6/T0) ffJ dr ri6e-,w(r) M-1sec-'. [1]
Here, Ro is the distance (nm) at which energy transfer is 50%efficient (16), and may be calculated from the measuredproperties of the donor emission and the acceptor absorptionspectra as described elsewhere. The quantity rO is the excit-ed-state lifetime (sec) in the absence of acceptor, and ret is thedistance (nm) from the donor to the acceptor. The electro-static potential about the protein enters the problem throughthe equilibrium spatial weighting factor e-,3(r) containing theelectrostatic potential energy w(r) of the donor in the field ofthe protein. The quantity 3 = (kBT)-h, where kB is theBoltzmann constant and T is absolute temperature. Thesubstitution of the donor potential of mean force by theelectrostatic potential of a single protein conformation as-sumes that the spatial relaxation ofthe donor is fast comparedwith the protein conformational fluctuation. Eq. 1 provides atheoretical means of calculating the rate constant when aknowledge of the conformation and electrostatic field of theprotein is available. Analytical solutions to this integral havebeen reported where simple spherical models of the proteinand donor are assumed (14). Here we apply the rigor ofcurrent numerical techniques, taking advantage of a detailedknowledge of the protein atomic coordinates. No attempt hasbeen made to evaluate alternative mechanisms, such asexchange, to the energy transfer rates.
METHODSExperimental. The Tb(III) chelates were TbEDTA- [ter-
bium(III)-ethylenediaminetetraacetate], TbHED3A [ter-bium(III)-N-(2-hydroxyethyl)ethylenediaminetriacetate],and TbBED2A' [terbium(III)-N, N '-bis(2-hydroxyethyl)-ethylenediaminediacetate]. Horse heart cytochrome c wasobtained from Sigma (type III). The commercial preparationcontained various amounts of deamidated and aggregatedforms in addition to the native protein (17) and about 20% ofthe reduced form. To obtain homogeneous, native ferricy-tochrome c, the commercial preparation was mixed withK3Fe(CN)6 and chromatographed on carboxymethyl cellu-lose with a sodium phosphate gradient according to Brautiganet al. (17). The details of the chromatographic procedure aregiven elsewhere (14).
Phosphate was removed by dialysis for several daysagainst 0.1 M NaCl before addition of Tb(III) chelates (18).Extensive dialysis against distilled water reduced the NaClconcentration to below 1 mM. The deionized protein wasstored as a frozen solution. The energy transfer distance Ro(Eq. 1) was calculated from the spectrum of the purifiedoxidized protein (14, 16), and found to be 3.7 nm withTbHED3A as energy donor. The rate constant for energytransfer to the heme from each donor chelate was determinedat each salt concentration from the Tb(III) luminescencelifetimes in the presence and absence of cytochrome c (13).Over the range of experimental conditions, each lumines-cence decay was accurately fit by a single exponential(correlation coefficient, >0.99), indicating that all the donorswere in equivalent average environments. This implies thatprotein binding of the chelates was not significant in theseexperiments.To accurately measure the ionic-strength dependence of
energy transfer to cytochrome c, samples were prepared withprecisely determined NaCl concentrations. Large volumes(4-12.5 ml) of low-salt stock solutions were prepared, con-taining 50-100 AM cytochrome c and 0.2-0.4 mM Tb(III)
chelate (either TbBED2A AcO, TbHED3A, or NH4TbEDTA). High-salt solution (0.1 M NaCl) was preparedwith all the components except NaCI in the same concentra-tion as in the low-salt stock. The two solutions were matchedto give identical A490 values by addition of small (-1 tAl)aliquots of cytochrome c stock. A 1-,ul aliquot of 22NaCI(carrier-free) solution was added to each high-salt solution.This solution, of known NaCl concentration and measurable22Na specific activity, was used for all subsequent saltadditions. The samples were made by addition of increasingamounts of high-salt solution to the low-salt stock. After eachhigh-salt addition, duplicate aliquots were placed in 500-ptlsnap-cap Eppendorf vials for energy transfer measurements.Energy transfer experiments were performed immediately.Aliquots were weighed on an analytical balance and countedin the y counter to determine the salt concentration. Thisprocedure gave very precise measurements of the salt de-pendence of energy transfer (see Fig. 2). Experimental errorsfor the measured lifetimes, given in Table 3, are based on thevariations between identically prepared samples and theuncertainty in the measured lifetimes. Larger errors for theneutral and positive terbium probes are due to lower accu-racy in determining their shorter fluorescent lifetimes.
Computational. To study the effects of protein conforma-tional variability on computed energy transfer rates, sets ofprotein conformers were collected at points along MD tra-jectories of horse heart cytochrome c, following the proce-dure reported for tuna cytochrome c (19). The initial coor-dinates for the horse species were prepared by amino acidsubstitution into the tuna crystallographic coordinates in amanner previously described (7). MD simulations were car-ried out on horse cytochrome c by using the program AMBER(version 2.0) coupled to GEMM (20) on an ST100 arrayprocessor. Trajectories were computed and an ensemble ofstructures was accumulated for two different dielectric con-stants (E) in the AMBER nonbonded electrostatic energy term:Eij = QiQj/ERU. Here, Rij is the charge-site separation be-tween centers i and j and Qi is the charge on center i.Following Wendoloski and Matthew (19), the dielectric for-malisms were a high-dielectric model with e = 80 and noexplicit water molecules (D80 model) and a simulation whereE = 1 with 800 explicit TIP3P water molecules (21) included(DW model). These two different solvent-simulating dielec-tric treatments have been shown to give trajectory structuresfor cytochrome c that correspond well with the x-ray struc-ture based on a variety of criteria: average atomic position(rms), ion pairs, solvent-accessible surface, and molecularvolumes (19). The computations were carried out with afemtosecond time step and a coordinate set was saved every50 fsec. The simulations were run for 150 psec (post-equilibration). Structures taken at 5-psec intervals from thesetrajectories were analyzed to determine the energy transferrate constant. The extent of the side-chain reorientationbetween these structures and the resulting electrostatic po-tential variations at the heme edge are depicted in ref. 19,figures 1 and 6.To determine the integral of the energy transfer rate
constant (Eq. 1), the electrostatic potential energy w(r)around all the protein conformers was calculated. At neutralpH it was assumed that all lysines and arginines are proto-nated, and the aspartic acids, glutamic acids, heme propion-ate side chains, and carboxyl-terminal acid groups are dis-sociated (7). Histidines and the acetylated amino terminus arenonprotonated. Partial charges taken from the GROMOS set ofcharges (22) were assigned to each heavy atom and allhydrogens attached to polar atoms. The protein is repre-sented as an irregularly shaped cavity of low dielectricconstant (e = 4) and zero ionic strength with a total of 1069fixed embedded charges. The value for the internal dielectricis based on the typical average estimate for protein interiors
9504 Biophysics: Northrup et al.
Proc. Natl. Acad. Sci. USA 87 (1990) 9505
(1, 5, 10, 23). Surrounding this cavity is a continuum dielec-tric with E = 80, representative of water, with an ionicatmosphere that attenuates the field emanating from theprotein charges. The WW-based electrostatic potential fieldsurrounding the protein charge configuration was computedby iterating finite-difference solutions to the linearizedPoisson-Boltzmann equation (7). A coarse-grained solutionon a cubic lattice (51 x 51 x 51 elements) having a resolutionof 4 A and encompassing a 200 x 200 x 200-A3 regioncentered on the protein was computed for each structure atthree ionic strengths. Previously prepared trial solutionsbased on a simple Coulomb-Debye theory were used toinitiate the iterations. Convergence for a single structure atthree ionic strengths required a total of 1400 iterations and 42min of central processing unit (CPU) time on a VAX8800computer. These grids provide the required potential at largedistances from the protein as well as the outer boundarycondition for the iteration of a smaller fine-grained 1.0-A-resolution grid of 61 x 61 x 61 elements. Convergence ofeach conformer at each ionic strength for the fine-resolutiongrid required 1000 iterations and an hour of CPU time.The rate constant (Eq. 1) was evaluated by direct volume
integration on a lattice of 1-A resolution centered on theprotein center of mass. Points outside 100 A made nosignificant contribution to the integrand and were ignored.Each lattice point was tested against an exclusion grid todetermine probe overlaps with the protein; these points didnot contribute to the integral. The exclusion grids weredetermined by embedding each protein conformer on a 67 x
67 x 67-element cubic spatial grid of 1.0-A resolution. Rex,the exclusion grid parameter, was taken as the terbiumchelate donor radius plus the "cube-corner" distance cor-rection of the 1.0-A-resolution exclusion grid (=0.7 A). Fromconsiderations of the van der Waals shape of the chelates, Rexwas taken as -5 A (13). Test calculations with Re values of
4.0, 5.0, and 6.0 A were carried out to assess sensitivity toparameter choice. Full computation of the integral for oneprotein conformation at one ionic strength at one probe sizeand for three probe charges required 13 min of computationtime on a VAX8800.Two different methods of specifying the "reaction dis-
tance," ret, were tested. The simplest method takes ret to bethe distance from the terbium probe center to the heme ironatom. However, since energy transfer most likely takes placeover the entire extended ir system of the porphyrin, we alsotook re, as the distance between the donor probe center andthe closest ofa set of nine porphyrin atoms; the iron atom, thefour carbons bridging the pyrrole ring systems, and the fourpyrrole nitrogens.
RESULTS AND DISCUSSIONReaction Criteria. The sensitivity of the energy transfer
rate calculations to probe radius, ReX, and reaction-distancecriterion, ret, was explored. Calculated values for threevalues of Re, are compared with experimental in Table 1. As
Table 1. Theoretical energy transfer rates for three exclusion-grid distances (RX = 4.0, 5.0, or 6.0 A) compared withexperimental values
Probek x 10-6, M-1sec-1
charge 4.0 A 5.0A 6.0A Exp.-le 54.30 21.00 11.04 17.0Oe 6.06 3.35 2.23 4.0
+le 1.13 0.84 0.67 1.2
Computational results are given for a single protein conformerfrom the DW set that gave a value closest to the mean theoreticalresults. Ionic strength, I = 0.01.
expected from DNA studies (13), the r6 distance function inEq. 1 makes the computation sensitive to the choice of Rex.The Rex = 6.0 A case consistently underestimates the ratebecause it excludes the donor chelates from the region closeto the acceptor region, whereas the Rex = 4.0 A and 5.0 Acases give correspondingly higher rates. The intense overallpositive electrostatic potential of the protein particularlyenhances the sensitivity of the summation for the -lecharged probe.
Calculated rates for the two reaction-distance models, ironatom vs. heme edge, are compared with experiment in Table2. For an exclusion-grid radius of 5.0 A, the iron atom-to-probe distance criterion consistently underestimates the en-ergy transfer rate whereas the nine-atom heme edge defini-tion gives good agreement with experiment for all three donorcharged states. All subsequent studies reported here use themodel parameters (Rex = 5.0A and the nine-atom heme shapedefinition).
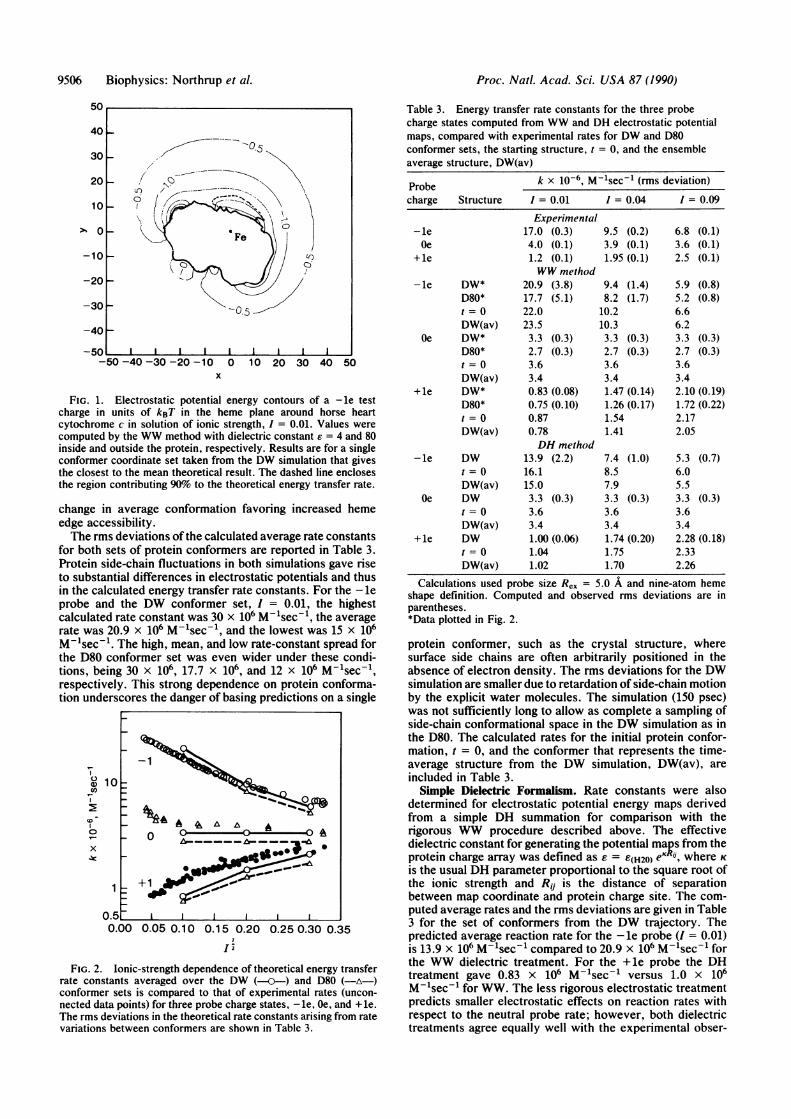
Fig. 1 shows the WW electrostatic potential energy map(ionic strength, I = 0.01) surrounding a single conformer ofthe cytochrome c protein. The conformation is the 40-psecjuncture in the DW simulation. The electric field aroundcytochrome c stabilizes a -le charge by about 2 units of kBTin the region of the exposed heme edge. Fig. 1 also shows thespatial region that dominates the energy transfer integrand.There is no significant contribution through the sides or backsurface of the protein. The computed rate constant is sensi-tive almost entirely to the region of space at or near the hemeedge/protein solvent dielectric boundary, where the WWmethod, which accounts for the irregular boundary condi-tion, is expected to give an accurate representation of thepotential compared with less rigorous representations of theprotein/solvent interface.MD Effect. Rate constants for the three terbium probes
were calculated by theWW method at I'/' = 0.1, 0.2, and 0.3for 14 unique protein configurations taken from the D80simulation and 17 from the DW MD simulation. In Fig. 2, theaverage rate constants are compared with the experimentalenergy transfer data. Note the overall agreement of thecalculations with experiment. The average rates calculatedfor the conformers from the DW simulation (solid lines) arecloser overall to experiment than the D80 simulation results.The agreement with the ionic-strength dependence is strik-ingly good for both the - le and the + le probe cases, thedependence being slightly steeper than experiment for the-le probe. The average rates calculated from the D80individual conformer rates are lower than the DW ones for allthree probes. This is attributable to the lower steric acces-sibility of the heme edge in the D80 structures compared withthe DW structures as measured by calculations of solvent-accessible surface. A previous study (19) reported that themolecular volumes of the D80 structures are slightly smallerthan for DW, indicating a more compact structure in theabsence of explicit solvent molecules. The variation of theobserved rate constant for the neutral probe at low ionicstrength has not been explored, but it could be due to a small
Table 2. Comparison of the theoretical and experimental rateconstant for two methods of defining the reaction distance rt
k x 10-6, M-1sec-1Probe Fe-probe Nine-atom hemecharge criterion shape criterion Exp.
-le 5.35 21.00 17.0Oe 1.03 3.35 4.0
+le 0.34 0.84 1.2
Computational results are given for a single protein conformerfrom the DW set that gave a value closest to the mean theoreticalresult. I = 0.01.
Biophysics: Northrup et al.
Proc. Natl. Acad. Sci. USA 87 (1990)
50
40
30 k20
10
-101--
-20 F-30
-40
-50 -40 -30 -20 -10x
0 10 20 30 40 50
FIG. 1. Electrostatic potential energy contours of a - le testcharge in units of kBT in the heme plane around horse heartcytochrome c in solution of ionic strength, I = 0.01. Values werecomputed by the WW method with dielectric constant e = 4 and 80inside and outside the protein, respectively. Results are for a singleconformer coordinate set taken from the DW simulation that givesthe closest to the mean theoretical result. The dashed line enclosesthe region contributing 90% to the theoretical energy transfer rate.
change in average conformation favoring increased hemeedge accessibility.The rms deviations of the calculated average rate constants
for both sets of protein conformers are reported in Table 3.Protein side-chain fluctuations in both simulations gave riseto substantial differences in electrostatic potentials and thusin the calculated energy transfer rate constants. For the - leprobe and the DW conformer set, I = 0.01, the highestcalculated rate constant was 30 x 106 M-1sec-1, the averagerate was 20.9 x 10⁶ M-1sec-1, and the lowest was 15 x 106M-'sec-1. The high, mean, and low rate-constant spread forthe D80 conformer set was even wider under these condi-tions, being 30 x 106, 17.7 x 10⁶, and 12 x 106 M-1sec-1,respectively. This strong dependence on protein conforma-tion underscores the danger of basing predictions on a single
7 1
0
x
1+C
0.00 0.05 0.10 0.15 0.20 0.25 0.30 0.35
I}
FIG. 2. Ionic-strength dependence of theoretical energy transferrate constants averaged over the DW (---) and D80 (-A-)conformer sets is compared to that of experimental rates (uncon-nected data points) for three probe charge states, - le, Oe, and + le.The rms deviations in the theoretical rate constants arising from ratevariations between conformers are shown in Table 3.
Table 3. Energy transfer rate constants for the three probecharge states computed from WW and DH electrostatic potentialmaps, compared with experimental rates for DW and D80conformer sets, the starting structure, t = 0, and the ensembleaverage structure, DW(av)
Probe k x 10-6, M'1sec-' (rms deviation)charge Structure I = 0.01 1 = 0.04 1 = 0.09
Experimental-le 17.0 (0.3) 9.5 (0.2) 6.8 (0.1)Oe 4.0 (0.1) 3.9 (0.1) 3.6 (0.1)
+le 1.2 (0.1) 1.95 (0.1) 2.5 (0.1)WW method
-le DW* 20.9 (3.8) 9.4 (1.4) 5.9 (0.8)D80* 17.7 (5.1) 8.2 (1.7) 5.2 (0.8)t = 0 22.0 10.2 6.6DW(av) 23.5 10.3 6.2
Oe DW* 3.3 (0.3) 3.3 (0.3) 3.3 (0.3)D80* 2.7 (0.3) 2.7 (0.3) 2.7 (0.3)t = 0 3.6 3.6 3.6DW(av) 3.4 3.4 3.4
+le DW* 0.83 (0.08) 1.47 (0.14) 2.10 (0.19)D80* 0.75 (0.10) 1.26 (0.17) 1.72 (0.22)t = 0 0.87 1.54 2.17DW(av) 0.78 1.41 2.05
DH method-le DW 13.9 (2.2) 7.4 (1.0) 5.3 (0.7)
t = 0 16.1 8.5 6.0DW(av) 15.0 7.9 5.5
Oe DW 3.3 (0.3) 3.3 (0.3) 3.3 (0.3)t = 0 3.6 3.6 3.6DW(av) 3.4 3.4 3.4
+le DW 1.00 (0.06) 1.74 (0.20) 2.28 (0.18)t = 0 1.04 1.75 2.33DW(av) 1.02 1.70 2.26
Calculations used probe size R, = 5.0 A and nine-atom hemeshape definition. Computed and observed rms deviations are inparentheses.*Data plotted in Fig. 2.
protein conformer, such as the crystal structure, wheresurface side chains are often arbitrarily positioned in theabsence of electron density. The rms deviations for the DWsimulation are smaller due to retardation of side-chain motionby the explicit water molecules. The simulation (150 psec)was not sufficiently long to allow as complete a sampling ofside-chain conformational space in the DW simulation as inthe D80. The calculated rates for the initial protein confor-mation, t = 0, and the conformer that represents the time-average structure from the DW simulation, DW(av), areincluded in Table 3.
Simple Dielectric Formalism. Rate constants were alsodetermined for electrostatic potential energy maps derivedfrom a simple DH summation for comparison with therigorous WW procedure described above. The effectivedielectric constant for generating the potential maps from theprotein charge array was defined as e = 6(H20) eKRJ, where Kis the usual DH parameter proportional to the square root ofthe ionic strength and Rij is the distance of separationbetween map coordinate and protein charge site. The com-puted average rates and the rms deviations are given in Table3 for the set of conformers from the DW trajectory. Thepredicted average reaction rate for the - le probe (I = 0.01)is 13.9 x 10⁶ M-1sec-1 compared to 20.9 x 10⁶ M-1sec-1 forthe WW dielectric treatment. For the +le probe the DHtreatment gave 0.83 x 10⁶ M-1sec-1 versus 1.0 x 10⁶M-lsec'l for WW. The less rigorous electrostatic treatmentpredicts smaller electrostatic effects on reaction rates withrespect to the neutral probe rate; however, both dielectrictreatments agree equally well with the experimental obser-
I I I I I I I I
-
9506 Biophysics: Northrup et al.
Proc. Natl. Acad. Sci. USA 87 (1990) 9507
vations. Additionally, the rms deviations (result of the struc-tural variations between protein conformers) indicate that theeffects of structural flexibility on electrostatic effects are aslarge as the computed differences by these two very differentelectrostatic algorithms. The calculated rates for the proteinstarting conformation and theDW time-average structure areincluded in Table 3.
Conclusions. We have demonstrated that diffusion-enhanced energy transfer studies provide a convenient probefor the electrostatic field surrounding a protein in solution.The comparison of experimental results with two theories ofprotein electrostatic behavior has allowed us to evaluate therelative accuracy of these methods. The effect of proteinside-chain fluctuations was addressed by carrying out elec-trostatic calculations and rate constant evaluations on sets ofstructures collected along two MD trajectories of horse heartcytochrome c.TheWW procedure for calculating electrostatic maps gave
good agreement with experiment and successfully repro-duced the ionic-strength dependence of the reaction for allthree charge states ofthe donor probe. Neglecting the proteindielectric properties and treating the entire region outside theprotein surface as equivalent to bulk aqueous electrolyte(DH) also gave good agreement with experiment. The cal-culations were sensitive to the probe radius parameter usedin generating the protein excluded volume profile and thedefinition of the reaction region, indicating that the rate issensitive to heme accessibility by donor probe. The observedweak salt dependence at low ionic strength of the neutralprobe reaction with cytochrome c was not explored compu-tationally; however, the effect is similar in magnitude to thecomputed rate changes for these parameters that affect theapparent heme accessibility (Table 1). As discussed in Meth-ods, specific binding of probe to protein at low ionic strengthis unlikely, since the luminescence decay was fit to a singleexponential.The intrinsic assumption for all computational studies
based on a protein crystal structure is that the x-ray structureadequately represents the time-average solution structure. Asubstantial body of literature supports this assumption. Ex-ceptions at various levels of structural detail have beenclearly identified, however. For example, a salt bridge ob-served by NMR and chemical studies in solution is absentfrom the myoglobin crystal structure (24). A further assump-tion often made is that a calculated quantity derived fromanalysis of a single average structure is equal to the averagecalculated for a whole ensemble of thermodynamically ac-cessible structures. Using MD conformers consistent withthe x-ray structure, we have shown that the relative merit ofelectrostatic methods cannot be judged without consider-ation of protein flexibility. Second, we have calculated anrms deviation for the predicted transfer rates that is attrib-utable to the single-structure assumption. Finally, by con-sidering individual structures in the ensemble and the largevariations in the calculated energy transfer rates, we see thattransient but possible structures can have properties that are
not intrinsic to the average structure. These transient struc-tures may be relevant to stochastic, possibly catalytic events.We conclude that attempts to refine protein computationalmethods through increased rigor without consideration of allunderlying assumptions does not necessarily result in a bettermethod.
This work has been funded at Tennessee Technological Universityby National Institutes of Health Grants DK01403 and GM34248 andby the donors ofthe Petroleum Research Fund as administered by theAmerican Chemical Society and at the University of California,Davis, by National Institutes of Health Grant GM25909. S.H.N. is arecipient of a National Institutes of Health Research Career Devel-opment Award.
1. Matthew, J. B. (1985) Annu. Rev. Biophys. Chem. 14, 387-417.2. Rush, J. D. & Koppenol, W. H. (1985) Biochim. Biophys. Acta
936, 187-192;3. Northrup, S. H., Reynolds, J. C. L., Miller, C. M., Forrest,
K. J. & Boles, J. 0. (1986) J. Am. Chem. Soc. 108, 8162-8170.4. Allison, S. A., Ganti, G. & McCammon, J. A. (1985) Biopoly-
mers 24, 1323-1336.5. Gilson, M. K. & Honig, B. H. (1988) Nature (London) 330,
84-86.6. Allison, S. A., Bacquet, R. J. & McCammon, J. A. (1988)
Biopolymers 27, 251-269.7. Northrup, S. H., Boles, J. 0. & Reynolds, J. C. L. (1987) J.
Phys. Chem. 91, 5991-5998.8. Northrup, S. H., Luton, J. A., Boles, J. 0. & Reynolds,
J. C. L. (1987) J. Comp. Aided Molec. Design 1, 291-311.9. Northrup, S. H., Boles, J. 0. & Reynolds, J. C. L. (1988)
Science 241, 67-70.10. Warshel, A. & Russell, S. T. (1984) Q. Rev. Biophys. 17,
283-422.11. Warwicker, J. & Watson, H. C. (1982) J. Mol. Biol. 157,
671-679.12. Gilson, M. K. & Honig, B. H. (1988) Proteins 3, 32-52.13. Wensel, T. G., Meares, C. F., Vlachy, V. & Matthew, J. B.
(1986) Proc. Natl. Acad. Sci. USA 83, 3267-3271.14. Wensel, T. G. (1985) Ph.D. dissertation (Univ. of California,
Davis).15. Stryer, L., Thomas, D. D. & Meares, C. F. (1982) Annu. Rev.
Biophys. Bioeng. 11, 203-213.16. Forster, T. (1948) Ann. Phys. (Leipzig) 2, 55-75.17. Brautigan, D. L., Ferguson-Miller, S. & Margoliash, E. (1978)
Methods Enzymol. 53, 128-137.18. Chen, P. S., Jr., Toribara, T. Y. & Warner, H. (1956) Anal.
Chem. 28, 1756-1760.19. Wendoloski, J. J. & Matthew, J. B. (1989) Proteins 4, 313-321.20. Brooks, B. R. (1987) Supercomputing Research in Chemistry
and Chemical Engineering (Am. Chem. Soc., Washington), pp.123-145.
21. Jorgensen, W. L., Chandrasekhar, J., Madura, J., Impey,R. W. & Klein, M. L. (1983) J. Chem. Phys. 79, 926-935.
22. Berendsen, H. J. C., Postma, J. P. M., van Gunsteren, W. F.& Hermans, J. (1981) in Intermolecular Forces, ed. Pullman, B.(Reidel, Dordrecht), pp. 331-350.
23. Pethig, R. (1979) Dielectric and Electronic Properties of Bio-logical Materials (Wiley, Chichester, U.K.).
24. Botelho, L. H., Friend, S. H., Matthew, J. B., Lehman, L. D.,Hanania, G. 1. H. & Gurd, F. R. N. (1978) Biochemistry 17,5197-5205.
Biophysics: Northrup et al.