Electronic supporting information ZIF-8 and ZIF-67 ... · Z 6 Calc. density 0.894166 g/cm3 ......
21
1 Electronic supporting information Characterization and properties of Zn/Co zeolitic imidazolate frameworks vs. ZIF-8 and ZIF-67 Kui Zhou a,c , Bibimaryam Mousavi a , Zhixiong Luo b , , Shophot Phatanasri e , Somboon Chaemchuen a* , Francis Verpoort a,b,c,d* Contents Experimental 2 Characterization - Scanning electron microscope 2 - Single crystal X-ray diffraction 5 - Fourier transform infrared resonance 6 - X-ray diffraction 7 - Gas adsorption 8 - Temperature program desorption 12 - Calculation of acidity 12 - Calculation of basicity 14 The stability testing 15 Catalytic activity 17 Thermal stability 21 Electronic Supplementary Material (ESI) for Journal of Materials Chemistry A. This journal is © The Royal Society of Chemistry 2016
Transcript of Electronic supporting information ZIF-8 and ZIF-67 ... · Z 6 Calc. density 0.894166 g/cm3 ......
1
Electronic supporting information
Characterization and properties of Zn/Co zeolitic imidazolate frameworks vs. ZIF-8 and ZIF-67
Kui Zhoua,c, Bibimaryam Mousavia , Zhixiong Luob, , Shophot Phatanasrie, Somboon Chaemchuena*, Francis Verpoorta,b,c,d*
Contents
Experimental 2Characterization - Scanning electron microscope 2 - Single crystal X-ray diffraction 5 - Fourier transform infrared resonance 6 - X-ray diffraction 7 - Gas adsorption 8 - Temperature program desorption 12 - Calculation of acidity 12 - Calculation of basicity 14The stability testing 15Catalytic activity 17Thermal stability 21
Electronic Supplementary Material (ESI) for Journal of Materials Chemistry A.This journal is © The Royal Society of Chemistry 2016
2
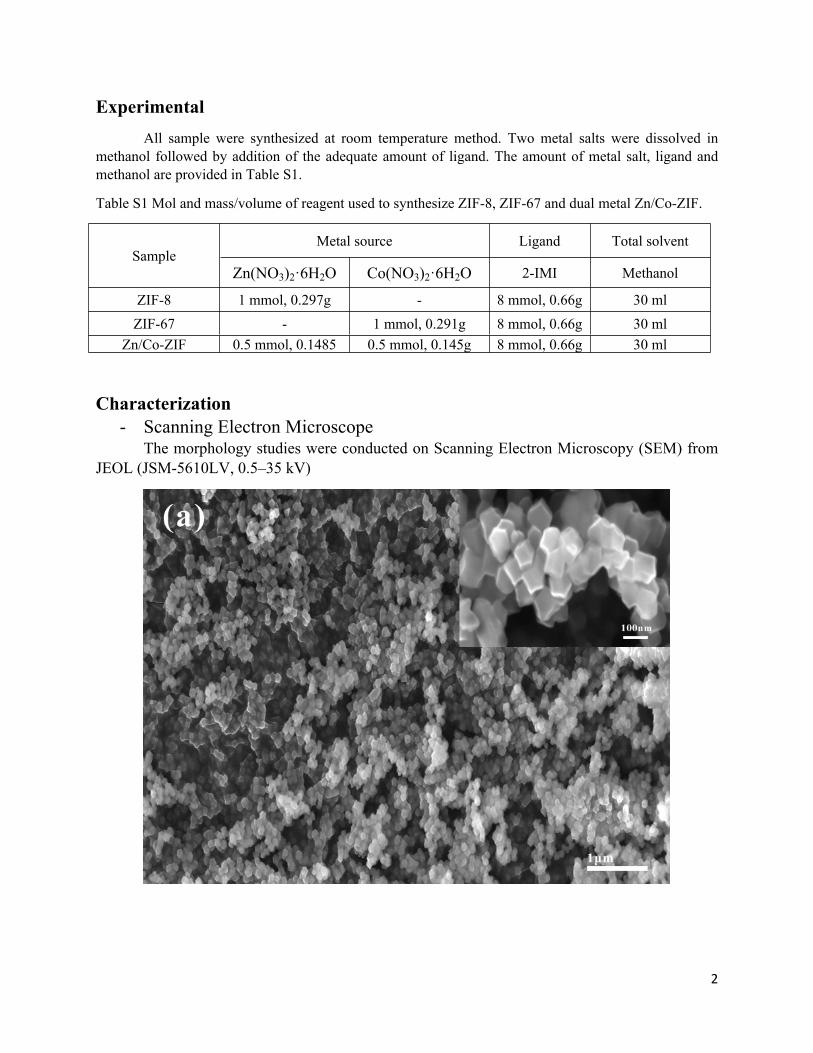
ExperimentalAll sample were synthesized at room temperature method. Two metal salts were dissolved in
methanol followed by addition of the adequate amount of ligand. The amount of metal salt, ligand and methanol are provided in Table S1.
Table S1 Mol and mass/volume of reagent used to synthesize ZIF-8, ZIF-67 and dual metal Zn/Co-ZIF.
Metal source Ligand Total solventSample
Zn(NO3)2·6H2O Co(NO3)2·6H2O 2-IMI Methanol
ZIF-8 1 mmol, 0.297g - 8 mmol, 0.66g 30 mlZIF-67 - 1 mmol, 0.291g 8 mmol, 0.66g 30 ml
Zn/Co-ZIF 0.5 mmol, 0.1485 0.5 mmol, 0.145g 8 mmol, 0.66g 30 ml
Characterization- Scanning Electron Microscope
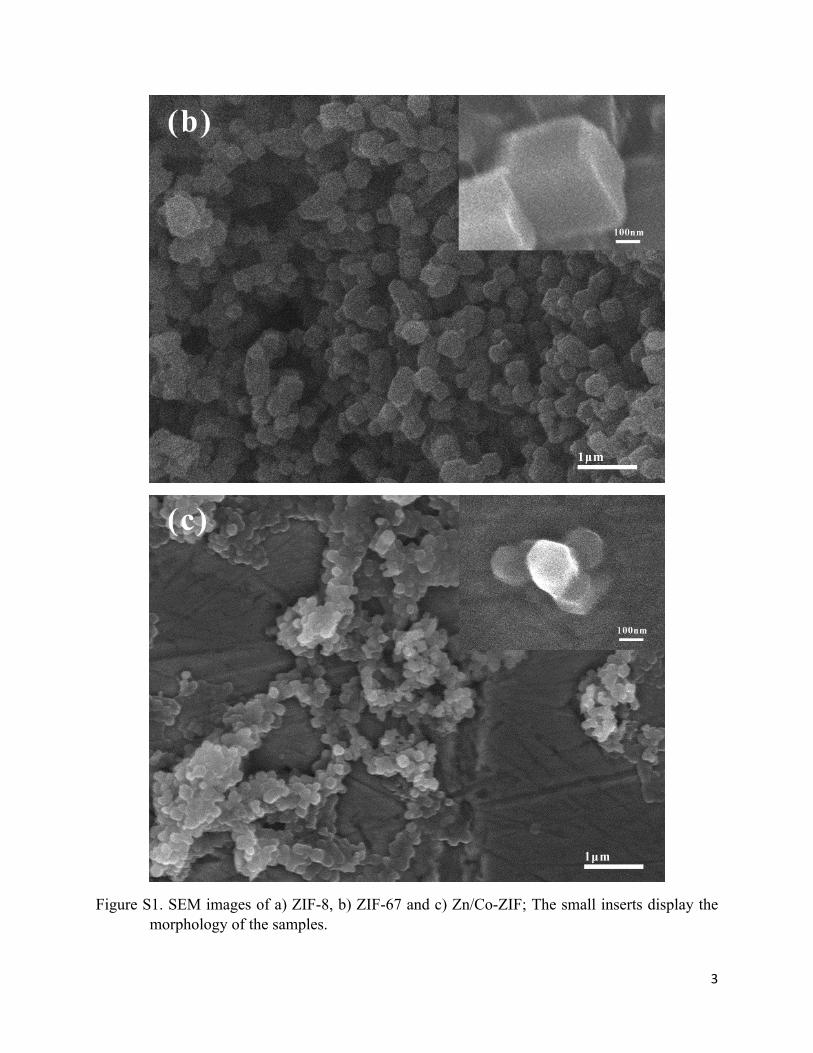
The morphology studies were conducted on Scanning Electron Microscopy (SEM) from JEOL (JSM-5610LV, 0.5–35 kV)
3
Figure S1. SEM images of a) ZIF-8, b) ZIF-67 and c) Zn/Co-ZIF; The small inserts display the morphology of the samples.
4
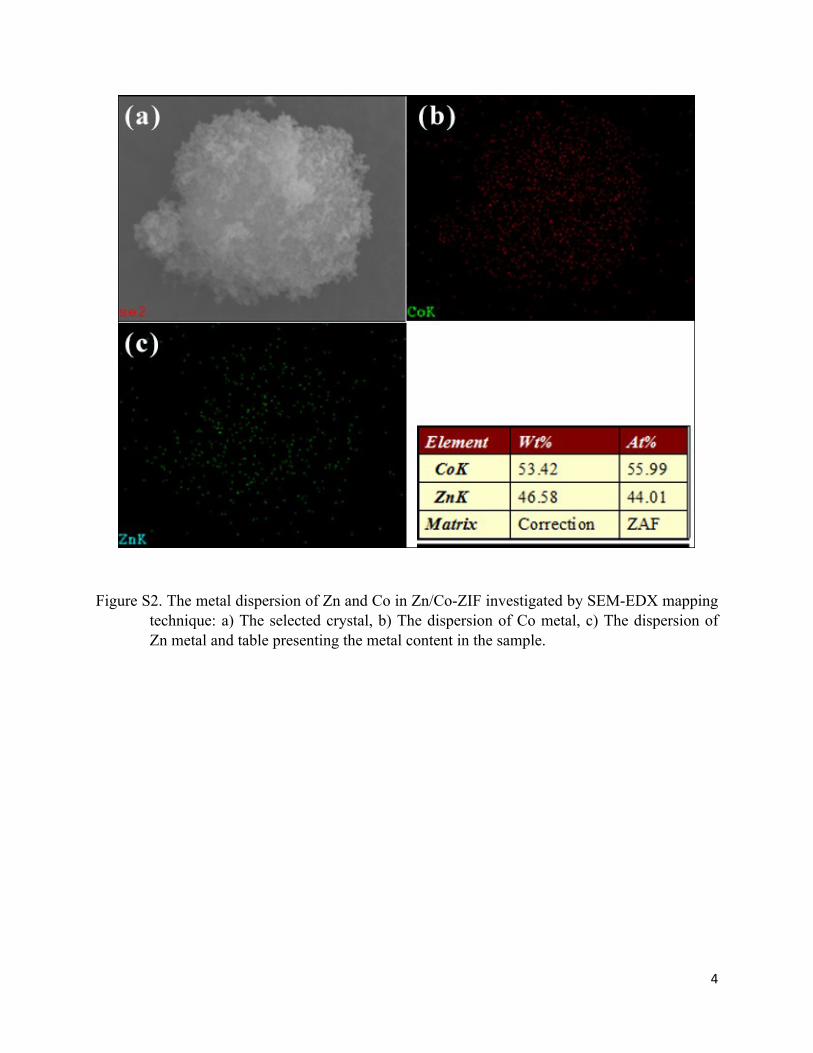
Figure S2. The metal dispersion of Zn and Co in Zn/Co-ZIF investigated by SEM-EDX mapping technique: a) The selected crystal, b) The dispersion of Co metal, c) The dispersion of Zn metal and table presenting the metal content in the sample.
5
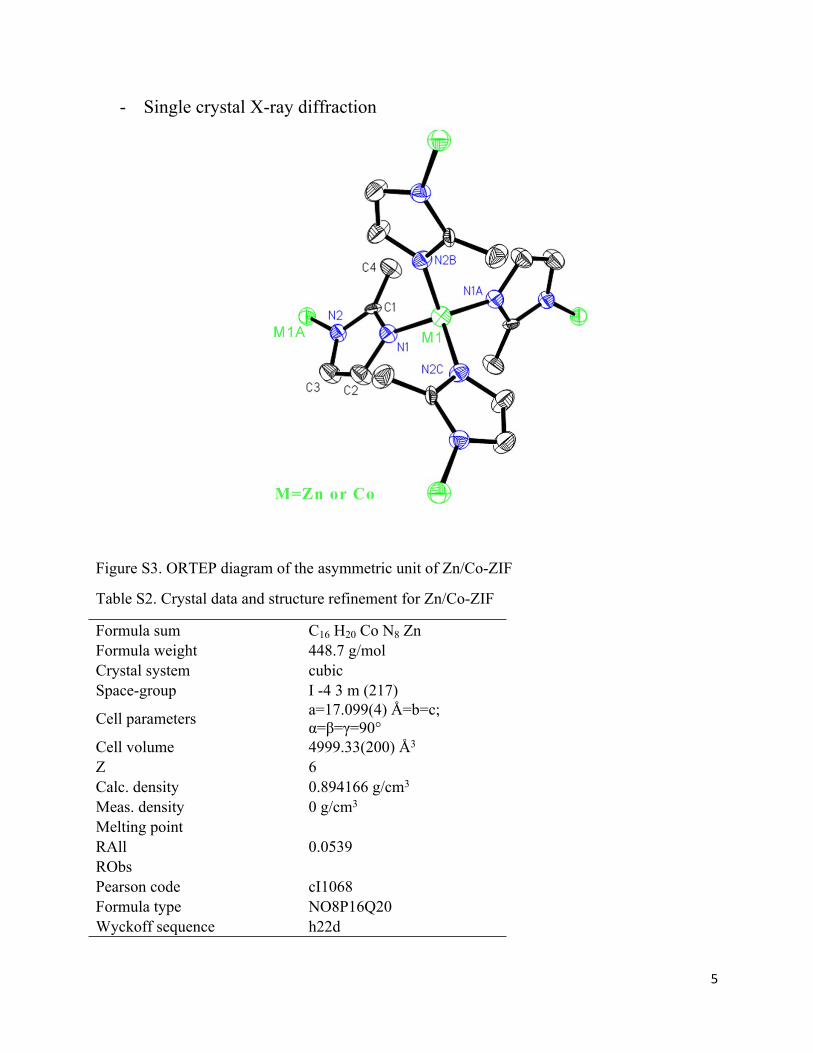
- Single crystal X-ray diffraction
Figure S3. ORTEP diagram of the asymmetric unit of Zn/Co-ZIF
Table S2. Crystal data and structure refinement for Zn/Co-ZIF
Formula sum C16 H20 Co N8 ZnFormula weight 448.7 g/molCrystal system cubicSpace-group I -4 3 m (217)
Cell parameters a=17.099(4) Å=b=c; α=β=γ=90°
Cell volume 4999.33(200) Å3
Z 6Calc. density 0.894166 g/cm3
Meas. density 0 g/cm3
Melting pointRAll 0.0539RObsPearson code cI1068Formula type NO8P16Q20Wyckoff sequence h22d
6
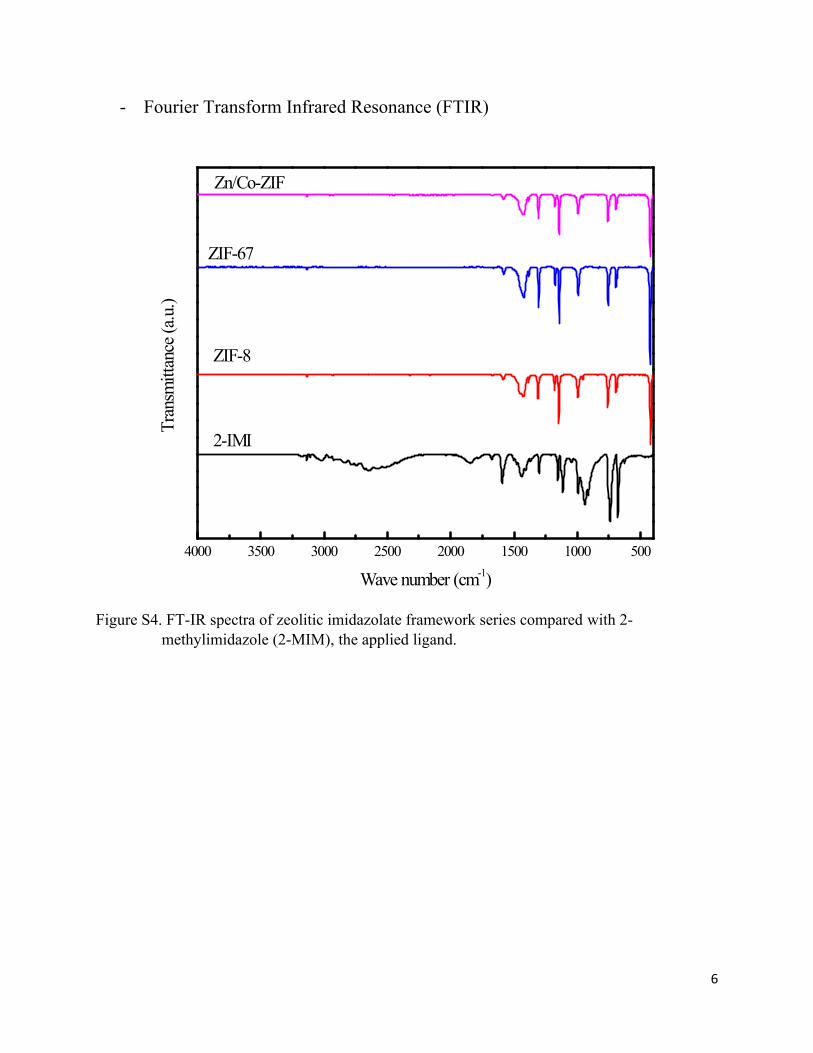
- Fourier Transform Infrared Resonance (FTIR)
4000 3500 3000 2500 2000 1500 1000 500
Tr
ansm
ittan
ce (a
.u.)
Wave number (cm-1)
2-IMI
ZIF-8
ZIF-67
Zn/Co-ZIF
Figure S4. FT-IR spectra of zeolitic imidazolate framework series compared with 2-methylimidazole (2-MIM), the applied ligand.
7
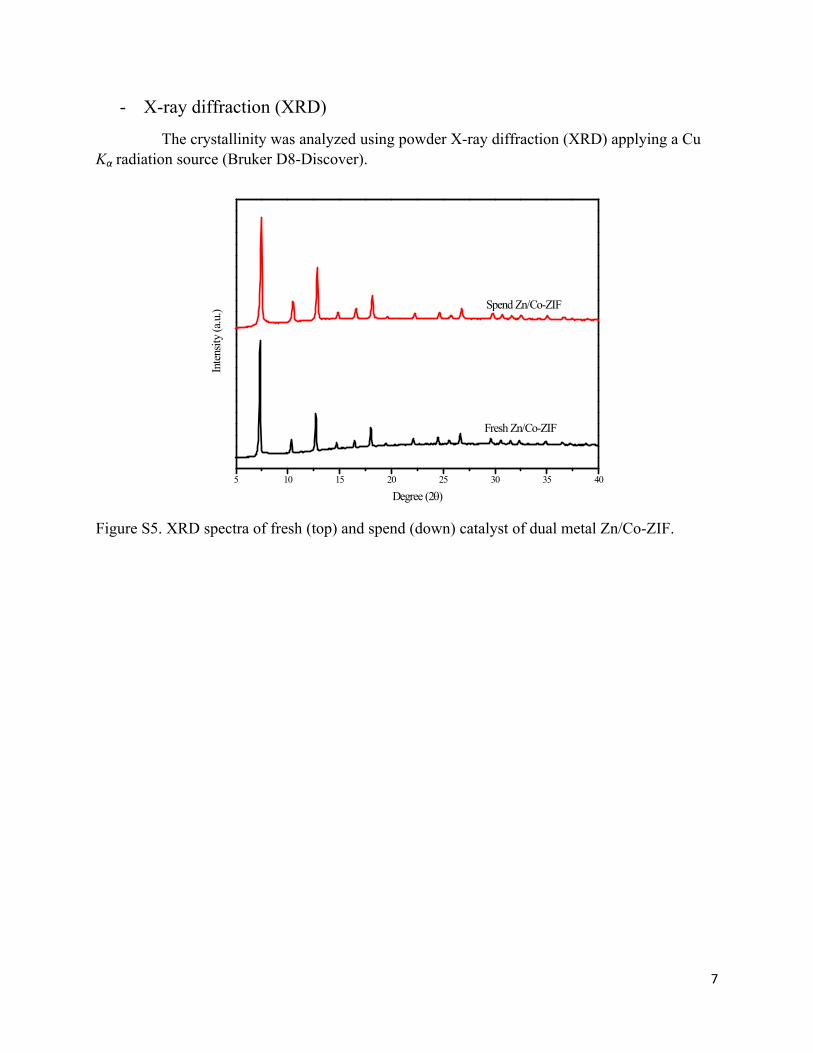
- X-ray diffraction (XRD)
The crystallinity was analyzed using powder X-ray diffraction (XRD) applying a Cu Kα radiation source (Bruker D8-Discover).
5 10 15 20 25 30 35 40
Inte
nsity
(a.u
.)
Degree (2)
Fresh Zn/Co-ZIF
Spend Zn/Co-ZIF
Figure S5. XRD spectra of fresh (top) and spend (down) catalyst of dual metal Zn/Co-ZIF.
8
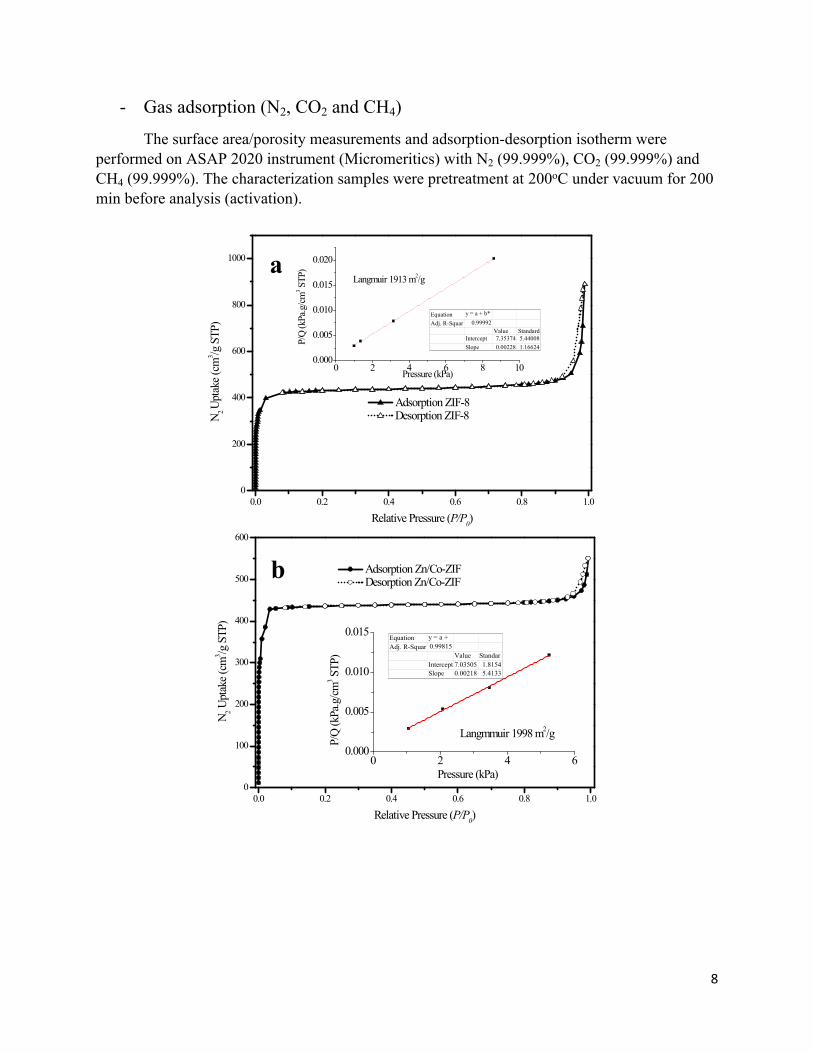
- Gas adsorption (N2, CO2 and CH4)
The surface area/porosity measurements and adsorption-desorption isotherm were performed on ASAP 2020 instrument (Micromeritics) with N2 (99.999%), CO2 (99.999%) and CH4 (99.999%). The characterization samples were pretreatment at 200oC under vacuum for 200 min before analysis (activation).
0.0 0.2 0.4 0.6 0.8 1.00
200
400
600
800
1000
N 2
Upta
ke (c
m3 /g
STP
)
Relative Pressure (P/P0)
Adsorption ZIF-8 Desorption ZIF-8
a
0 2 4 6 8 100.000
0.005
0.010
0.015
0.020
P/Q
(kPa
.g/cm
3 STP
)
Pressure (kPa)
Equation y = a + b*Adj. R-Squar 0.99992
Value StandardIntercept 7.35374 5.44008Slope 0.00228 1.16624
Langmuir 1913 m2/g
0.0 0.2 0.4 0.6 0.8 1.00
100
200
300
400
500
600
N 2 Upt
ake (
cm3 /g
STP
)
Relative Pressure (P/P0)
Adsorption Zn/Co-ZIF Desorption Zn/Co-ZIF
b
0 2 4 60.000
0.005
0.010
0.015
P/Q
(kPa
.g/cm
3 STP
)
Pressure (kPa)
Equation y = a + Adj. R-Squar 0.99815
Value StandarIntercept 7.03505 1.8154Slope 0.00218 5.4133
Langmmuir 1998 m2/g
9
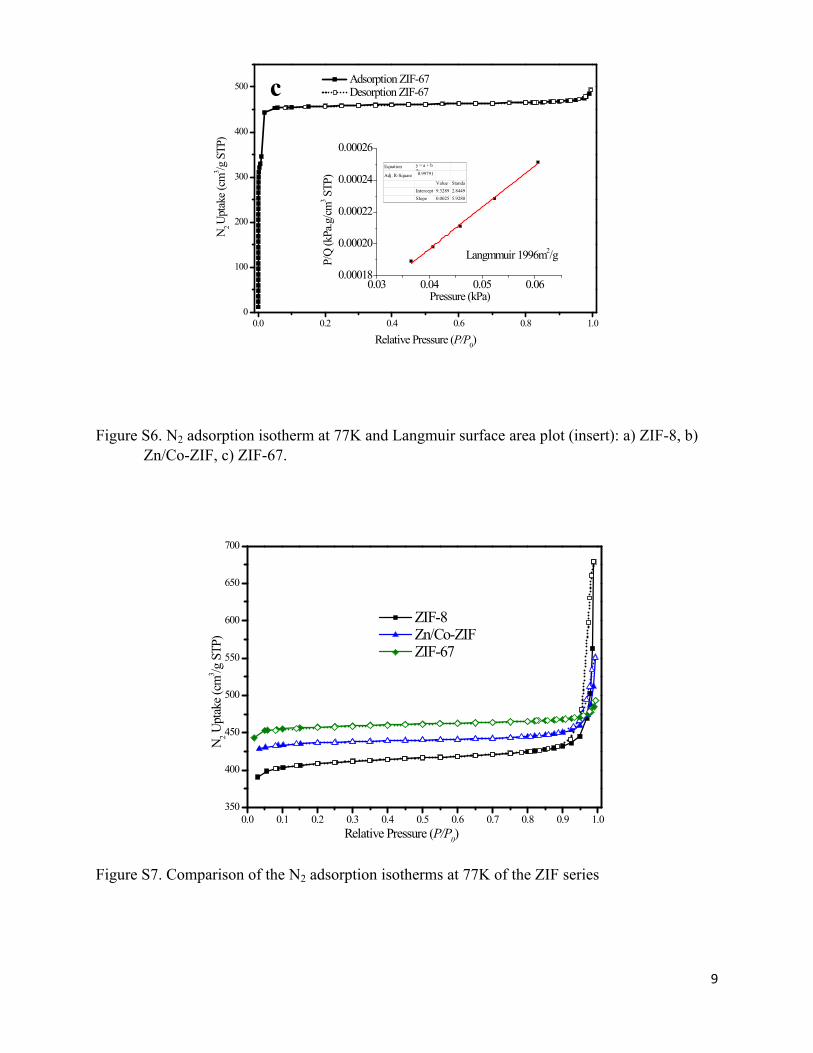
Figure S6. N2 adsorption isotherm at 77K and Langmuir surface area plot (insert): a) ZIF-8, b) Zn/Co-ZIF, c) ZIF-67.
Figure S7. Comparison of the N2 adsorption isotherms at 77K of the ZIF series
0.0 0.2 0.4 0.6 0.8 1.00
100
200
300
400
500
N 2 Up
take
(cm
3 /g S
TP)
Relative Pressure (P/P0)
Adsorption ZIF-67 Desorption ZIF-67c
0.03 0.04 0.05 0.060.00018
0.00020
0.00022
0.00024
0.00026
Langmmuir 1996m2/gP/Q
(kPa
.g/cm
3 STP
)
Pressure (kPa)
Equation y = a + b*x
Adj. R-Square 0.99791
Value StandaIntercept 9.3289 2.8449Slope 0.0025 5.9280
0.0 0.1 0.2 0.3 0.4 0.5 0.6 0.7 0.8 0.9 1.0350
400
450
500
550
600
650
700
N 2 Upt
ake (
cm3 /g
STP
)
Relative Pressure (P/P0)
ZIF-8 Zn/Co-ZIF ZIF-67
10
0 20 40 60 80 1000
2
4
6
8
10
12
14 b
CH4 U
ptak
e (cm
3 /g @
273K
)
Absolute Pressure (kPa)
ZIF-8 Zn/Co-ZIF ZIF-67
0 20 40 60 80 1000
10
20
30
40
CO2 U
ptak
e (cm
3 /g @
273K
)
Absolute Pressure (kPa)
ZIF-8 Zn/Co-ZIF ZIF-67
a
11
0 20 40 60 80 1000
1
2
3
4
5
6
c
N 2 upt
ake (
cm3 /g
@27
3K)
Absolute Pressure (kPa)
Zn-ZIF-8 ZnCo-ZIF Co-ZIF-67
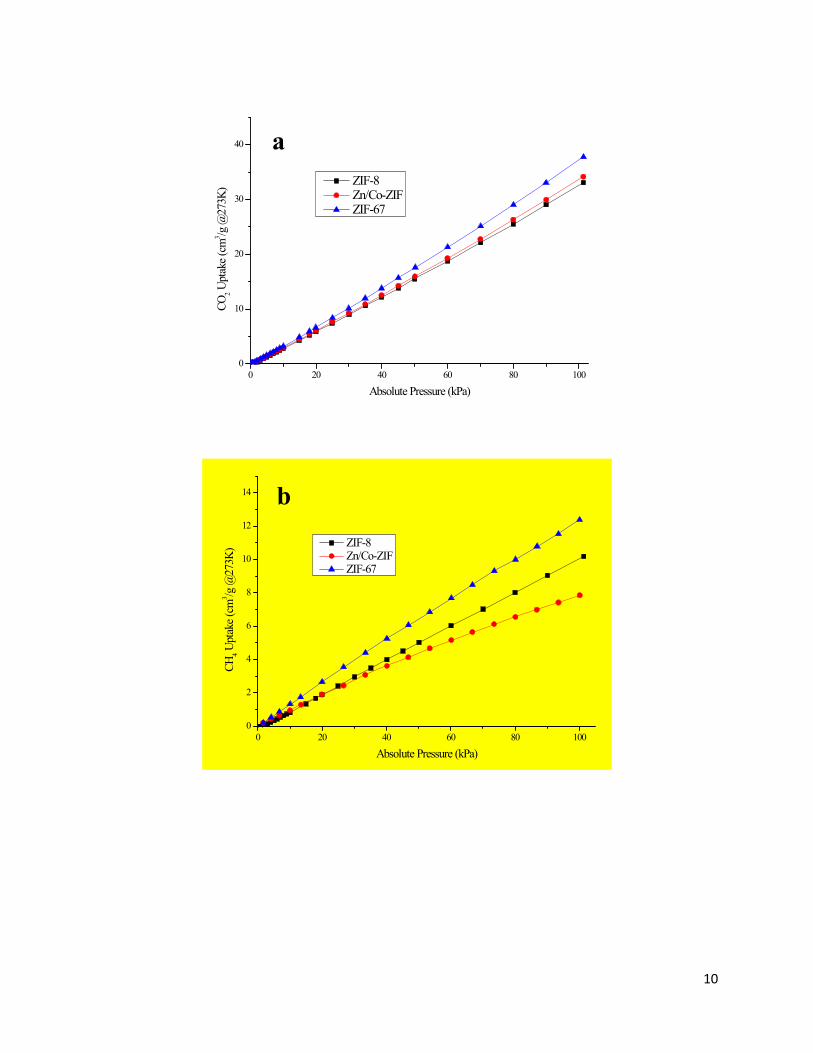
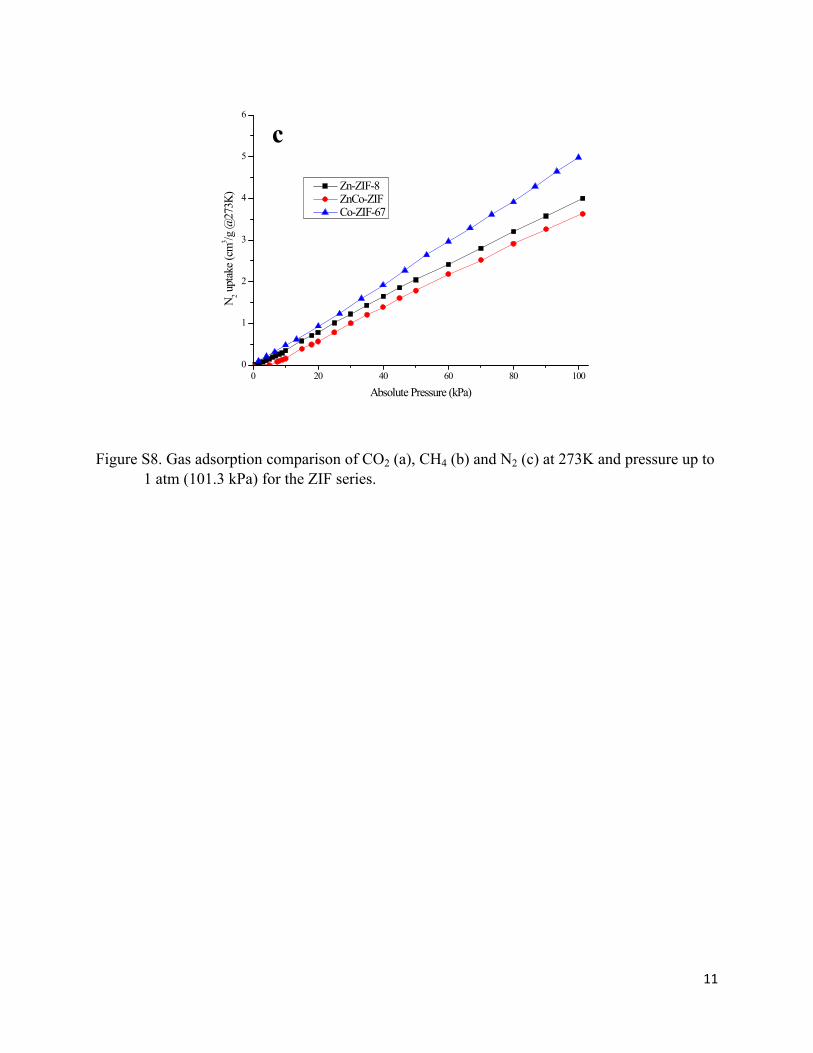
Figure S8. Gas adsorption comparison of CO2 (a), CH4 (b) and N2 (c) at 273K and pressure up to 1 atm (101.3 kPa) for the ZIF series.
12
- Temperature Program Desorption (TPD)
The temperature programmed desorption (TPD), was performed for all samples using a Micromeritics Chemisorb 2750 automated system with ChemiSoft TPx software. The samples were pretreated at 250oC under carrier He gas for 1h, then cooled down to the adsorption temperature at 25 oC. NH3 and CO2 as probe gases were introduced to the sample by continuous flow. The probe gas was adsorbed to saturation at adsorption temperature of 25 oC which can be observed from the stable TCD detector signal. The physically adsorbed gas on the samples was then removed by flushing the samples with He gas till a stable TCD signal was obtained. The temperature programmed desorption was measured using a TCD detector, temperature rising to 270 oC at a rate of 10 oC/min. Investigation of the defects in MOFs using temperature programmed desorption of CO as a probe gas (CO-TPD) was used in this study too. The samples were pretreated at 250oC under carrier He gas for 1h, then cooled to 25 oC, the adsorption temperature. The CO probe gas was introduced to the sample using a continuous flow. The probe gas was adsorbed to saturation at the adsorption temperature of 25 oC which was observed from the stable signal of the TCD detector. Thereafter, the physically adsorbed probe gas was removed by flushing the samples with He gas till a stable TCD signal was obtained. The temperature programmed desorption was measured with a TCD detector, temperature rising to 270 oC at a rate of 10 oC/min.
- Calculation of acidity
Calculation of total acidity was calculated from the NH3-TPD profiles.
The NH3-TPD profiles:
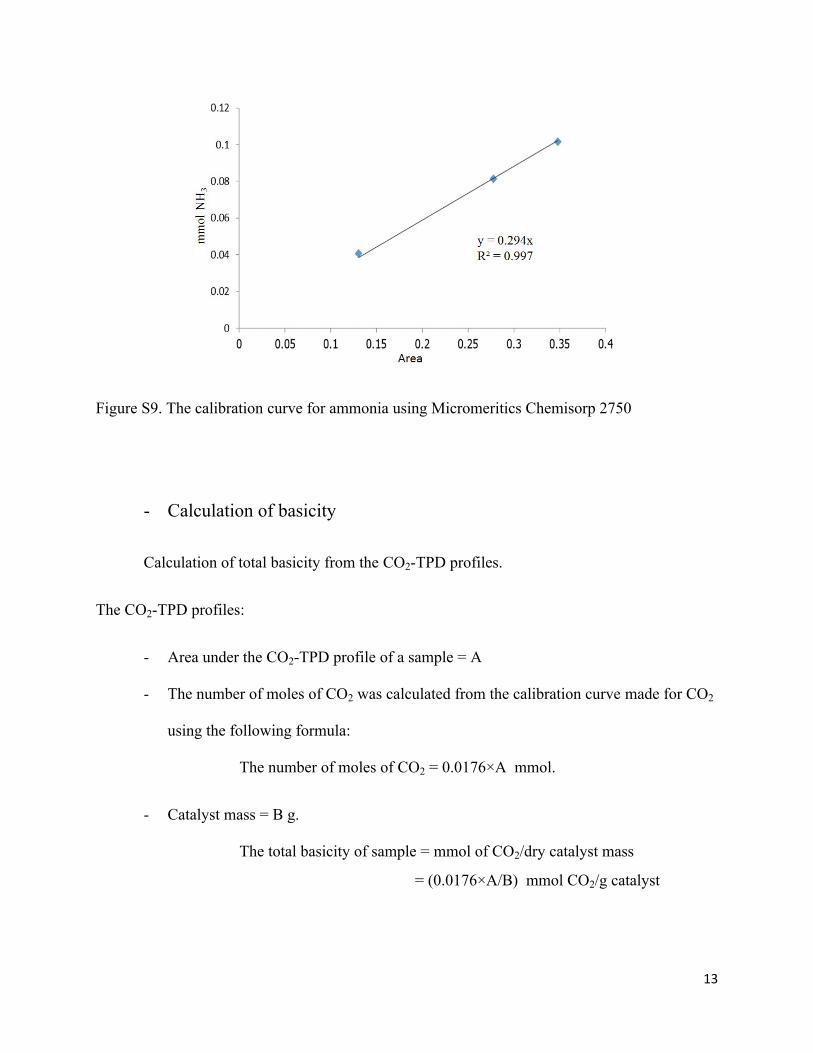
- Area under the NH3-TPD profile of a sample = A
- The number of moles of NH3 was calculated from the calibration curve made for NH3
using the following formula:
The number of moles of NH3 = 0.294×A mmol.
- Catalyst mass = B g.
The total acidity of a sample = mmol of NH3/dry catalyst mass
= (0.294×A/B) mmol NH3/g catalyst
13
Figure S9. The calibration curve for ammonia using Micromeritics Chemisorp 2750
- Calculation of basicity
Calculation of total basicity from the CO2-TPD profiles.
The CO2-TPD profiles:
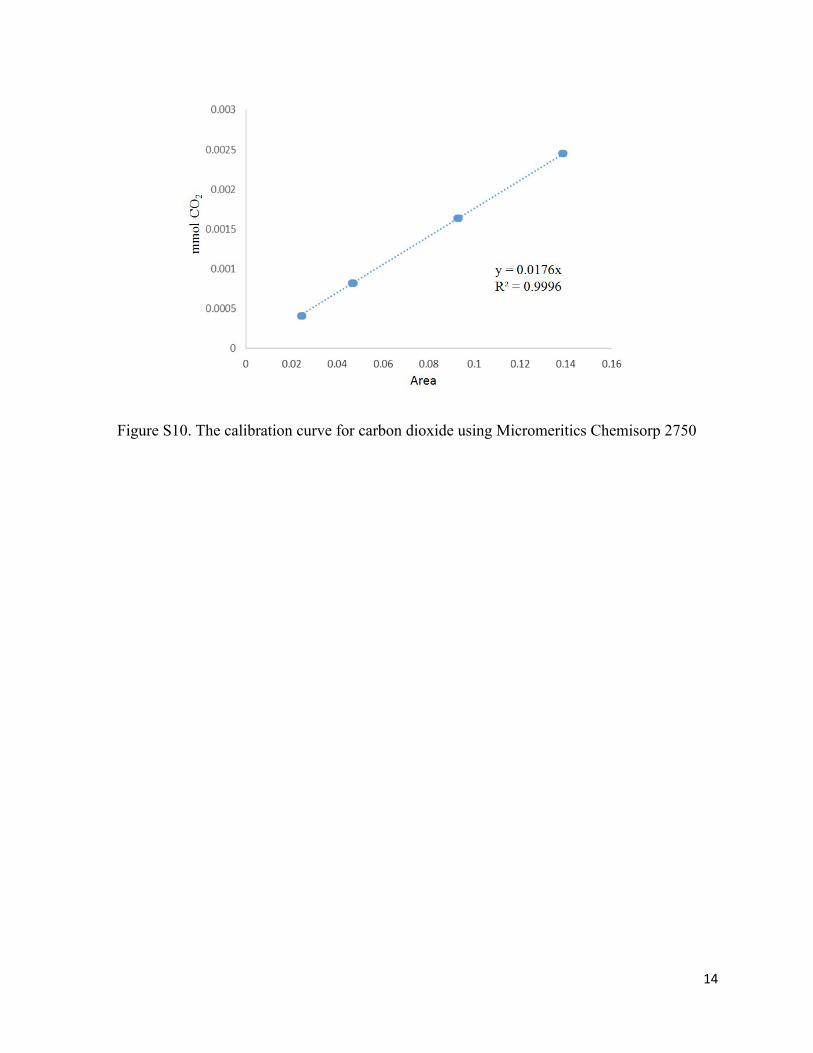
- Area under the CO2-TPD profile of a sample = A
- The number of moles of CO2 was calculated from the calibration curve made for CO2
using the following formula:
The number of moles of CO2 = 0.0176×A mmol.
- Catalyst mass = B g.
The total basicity of sample = mmol of CO2/dry catalyst mass
= (0.0176×A/B) mmol CO2/g catalyst
14
Figure S10. The calibration curve for carbon dioxide using Micromeritics Chemisorp 2750
15
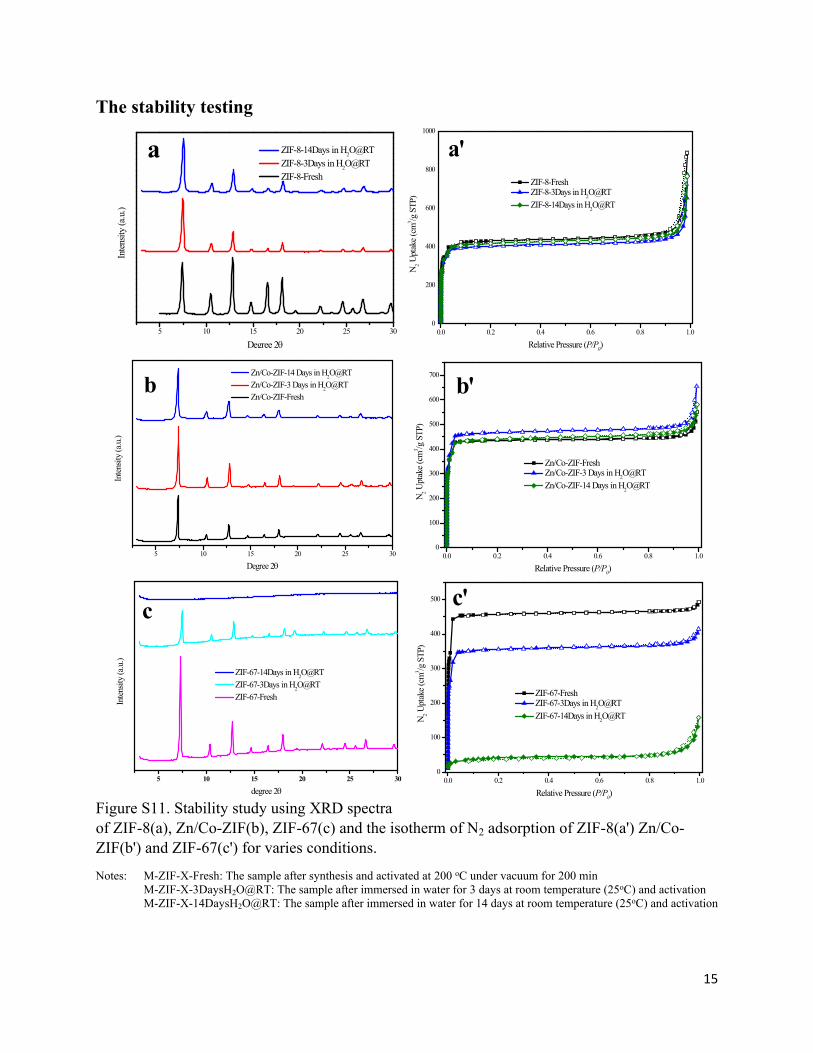
The stability testing
Figure S11. Stability study using XRD spectra of ZIF-8(a), Zn/Co-ZIF(b), ZIF-67(c) and the isotherm of N2 adsorption of ZIF-8(a') Zn/Co-ZIF(b') and ZIF-67(c') for varies conditions.
Notes: M-ZIF-X-Fresh: The sample after synthesis and activated at 200 oC under vacuum for 200 min M-ZIF-X-3DaysH2O@RT: The sample after immersed in water for 3 days at room temperature (25oC) and activation
M-ZIF-X-14DaysH2O@RT: The sample after immersed in water for 14 days at room temperature (25oC) and activation
5 10 15 20 25 30
In
tensit
y (a
.u.)
Degree 2
ZIF-8-14Days in H2O@RT ZIF-8-3Days in H2O@RT ZIF-8-Fresh
a
0.0 0.2 0.4 0.6 0.8 1.00
200
400
600
800
1000
N2 U
ptak
e (cm
3 /g S
TP)
Relative Pressure (P/P0)
ZIF-8-Fresh ZIF-8-3Days in H2O@RT ZIF-8-14Days in H2O@RT
a'
5 10 15 20 25 30
Inte
nsity
(a.u
.)
Degree 2
Zn/Co-ZIF-14 Days in H2O@RT Zn/Co-ZIF-3 Days in H2O@RT Zn/Co-ZIF-Fresh
b
0.0 0.2 0.4 0.6 0.8 1.00
100
200
300
400
500
600
700
N 2 Upt
ake (
cm3 /g
STP
)
Relative Pressure (P/P0)
Zn/Co-ZIF-Fresh Zn/Co-ZIF-3 Days in H2O@RT Zn/Co-ZIF-14 Days in H2O@RT
b'
5 10 15 20 25 30
Inte
nsity
(a.u
.)
degree 2
ZIF-67-14Days in H2O@RT ZIF-67-3Days in H2O@RT ZIF-67-Fresh
c
0.0 0.2 0.4 0.6 0.8 1.00
100
200
300
400
500
N2 U
ptak
e (cm
3 /g S
TP)
Relative Pressure (P/P0)
ZIF-67-Fresh ZIF-67-3Days in H2O@RT ZIF-67-14Days in H2O@RT
c'
16
5 10 15 20 25 30
Zn/Co-ZIF-3Days in H2O@25C
Zn/Co-ZIF-3Days Toluene@25C
Inten
sity
(a.u
.)
2degree)
Zn/Co-ZIF-Fresh
Zn/Co-ZIF-3Days H2O@75C
0.0 0.1 0.2 0.3 0.4 0.5 0.6 0.7 0.8 0.9 1.0
200
300
400
500
600
N 2 Upt
ake (
cm3 g
-1)
Relative pressure (p/p0)
Zn/Co-ZIF-Fresh Zn/Co-ZIF-3Days in H2O@298K Zn/Co-ZIF-3Days in Tuluene@298K Zn/Co-ZIF-3Days in H2O@348K
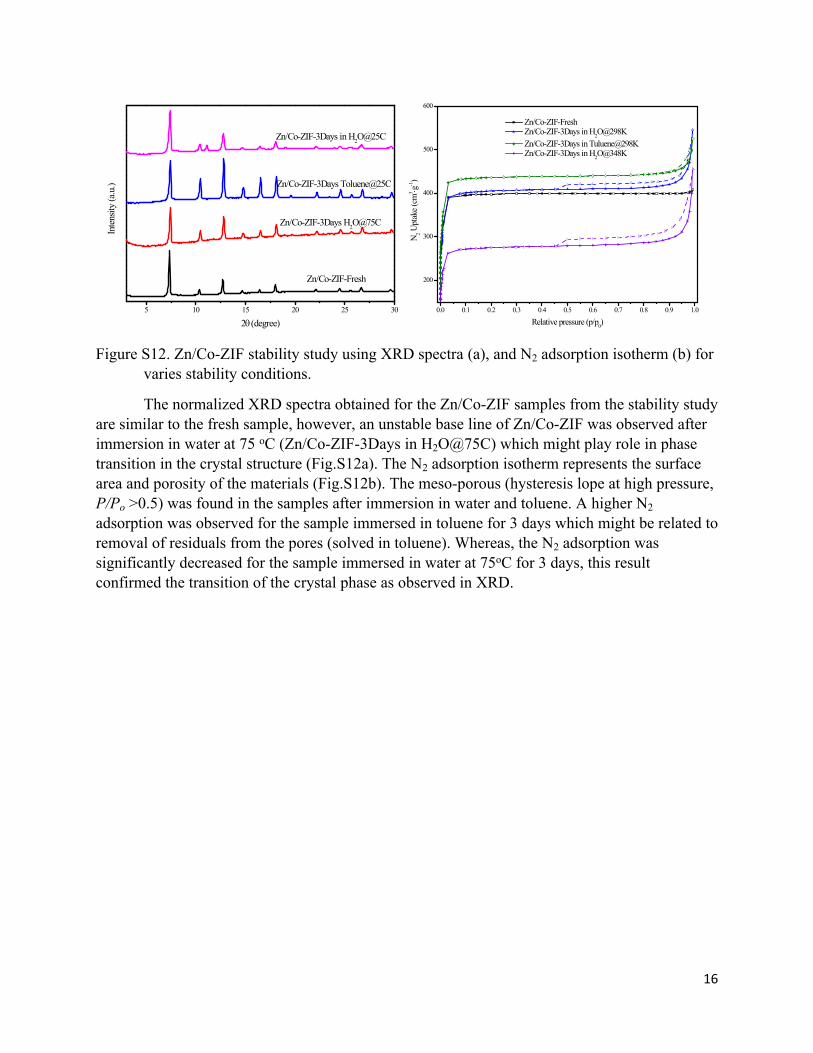
Figure S12. Zn/Co-ZIF stability study using XRD spectra (a), and N2 adsorption isotherm (b) for varies stability conditions.
The normalized XRD spectra obtained for the Zn/Co-ZIF samples from the stability study are similar to the fresh sample, however, an unstable base line of Zn/Co-ZIF was observed after immersion in water at 75 oC (Zn/Co-ZIF-3Days in H2O@75C) which might play role in phase transition in the crystal structure (Fig.S12a). The N2 adsorption isotherm represents the surface area and porosity of the materials (Fig.S12b). The meso-porous (hysteresis lope at high pressure, P/Po >0.5) was found in the samples after immersion in water and toluene. A higher N2 adsorption was observed for the sample immersed in toluene for 3 days which might be related to removal of residuals from the pores (solved in toluene). Whereas, the N2 adsorption was significantly decreased for the sample immersed in water at 75oC for 3 days, this result confirmed the transition of the crystal phase as observed in XRD.
17
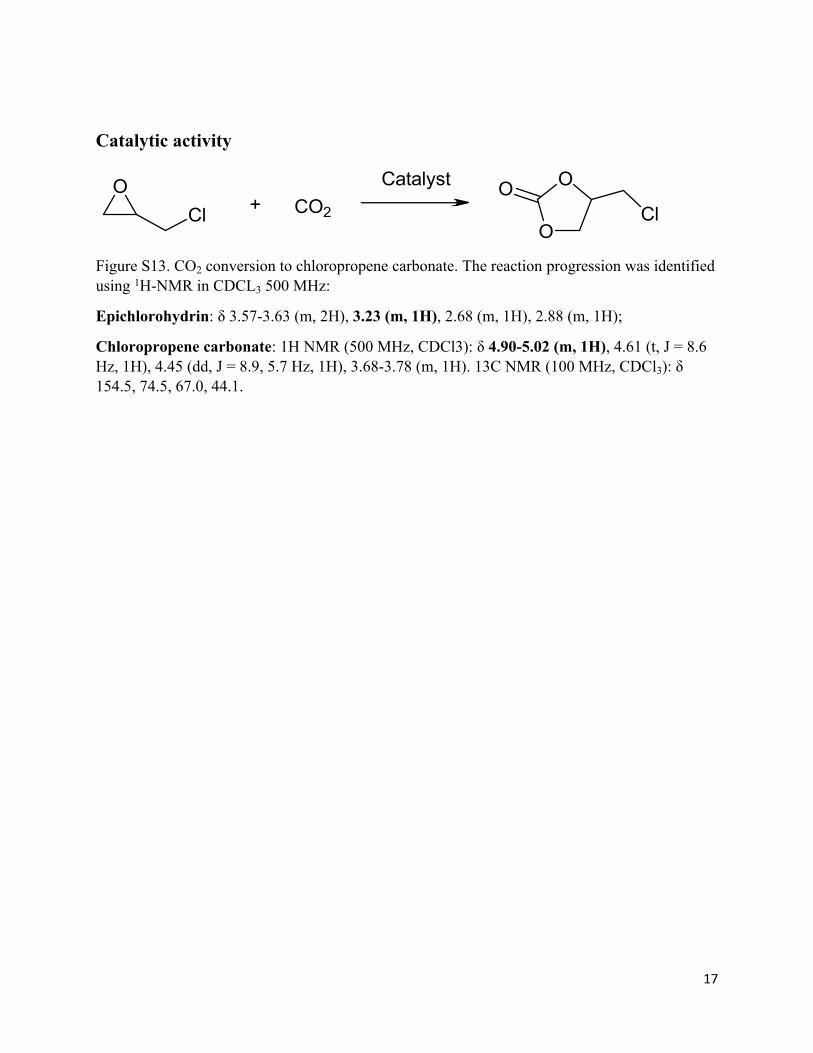
Catalytic activity
OCl
O
OOClCO2+
Catalyst
Figure S13. CO2 conversion to chloropropene carbonate. The reaction progression was identified using 1H-NMR in CDCL3 500 MHz:
Epichlorohydrin: δ 3.57-3.63 (m, 2H), 3.23 (m, 1H), 2.68 (m, 1H), 2.88 (m, 1H);
Chloropropene carbonate: 1H NMR (500 MHz, CDCl3): δ 4.90-5.02 (m, 1H), 4.61 (t, J = 8.6 Hz, 1H), 4.45 (dd, J = 8.9, 5.7 Hz, 1H), 3.68-3.78 (m, 1H). 13C NMR (100 MHz, CDCl3): δ 154.5, 74.5, 67.0, 44.1.
18
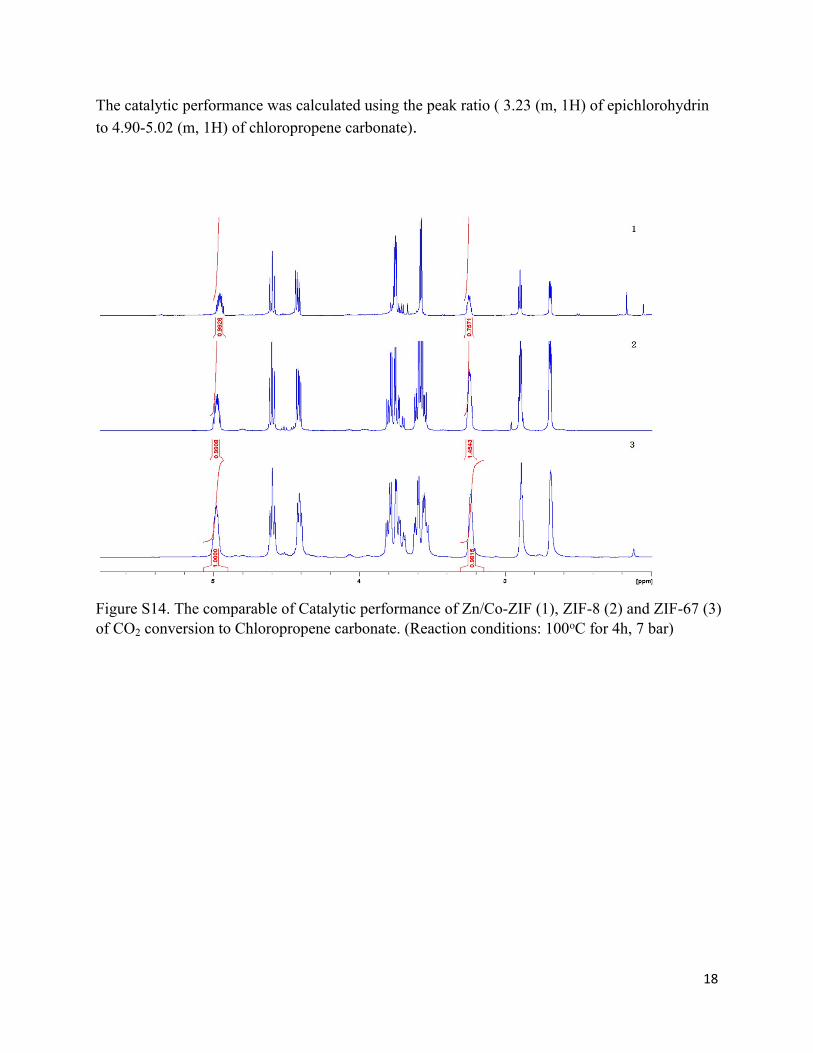
The catalytic performance was calculated using the peak ratio ( 3.23 (m, 1H) of epichlorohydrin to 4.90-5.02 (m, 1H) of chloropropene carbonate).
Figure S14. The comparable of Catalytic performance of Zn/Co-ZIF (1), ZIF-8 (2) and ZIF-67 (3) of CO2 conversion to Chloropropene carbonate. (Reaction conditions: 100oC for 4h, 7 bar)
19
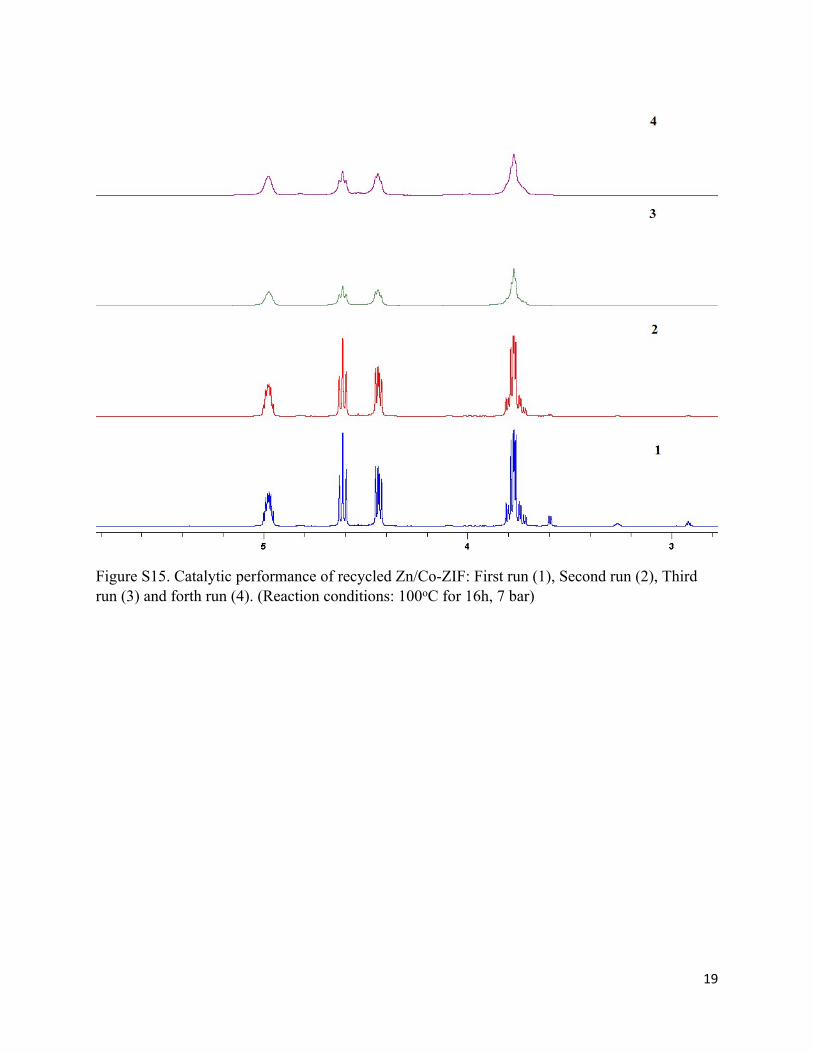
Figure S15. Catalytic performance of recycled Zn/Co-ZIF: First run (1), Second run (2), Third run (3) and forth run (4). (Reaction conditions: 100oC for 16h, 7 bar)
20
20
30
40
50
60
70
80
90
100 8h
CO
2 C
onve
rsio
n (%
)
1st run 3 rd run2nd run 4 th run
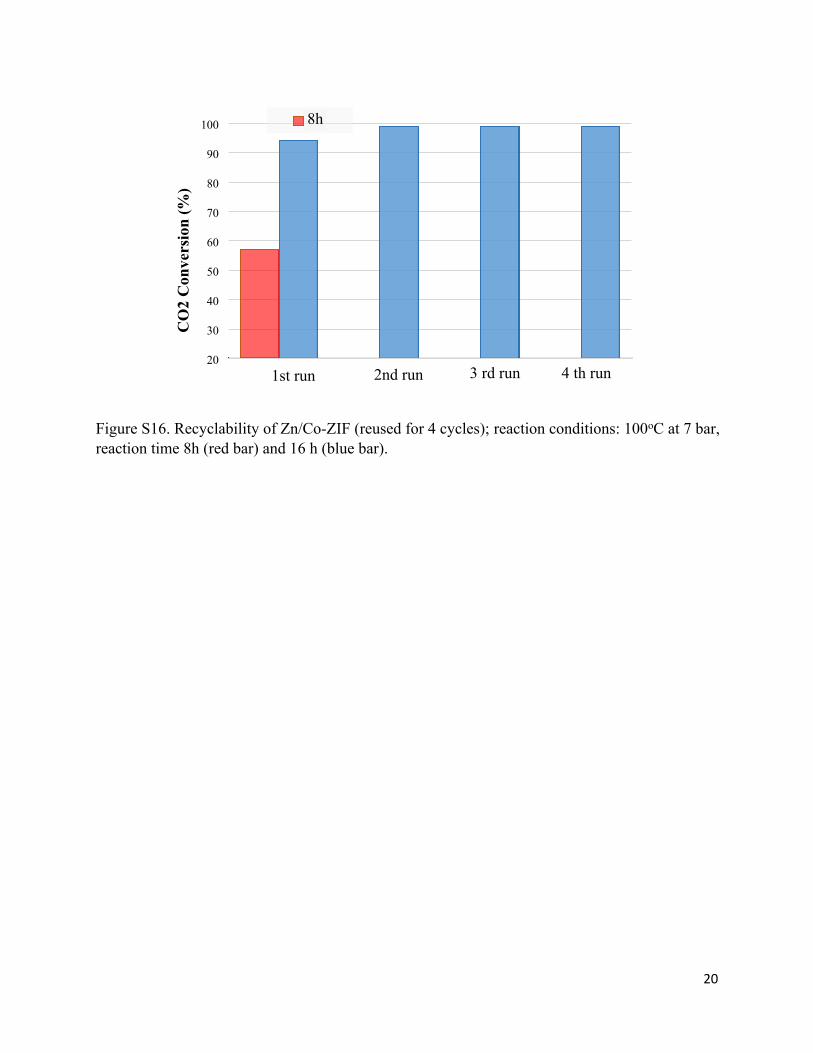
Figure S16. Recyclability of Zn/Co-ZIF (reused for 4 cycles); reaction conditions: 100oC at 7 bar, reaction time 8h (red bar) and 16 h (blue bar).
21
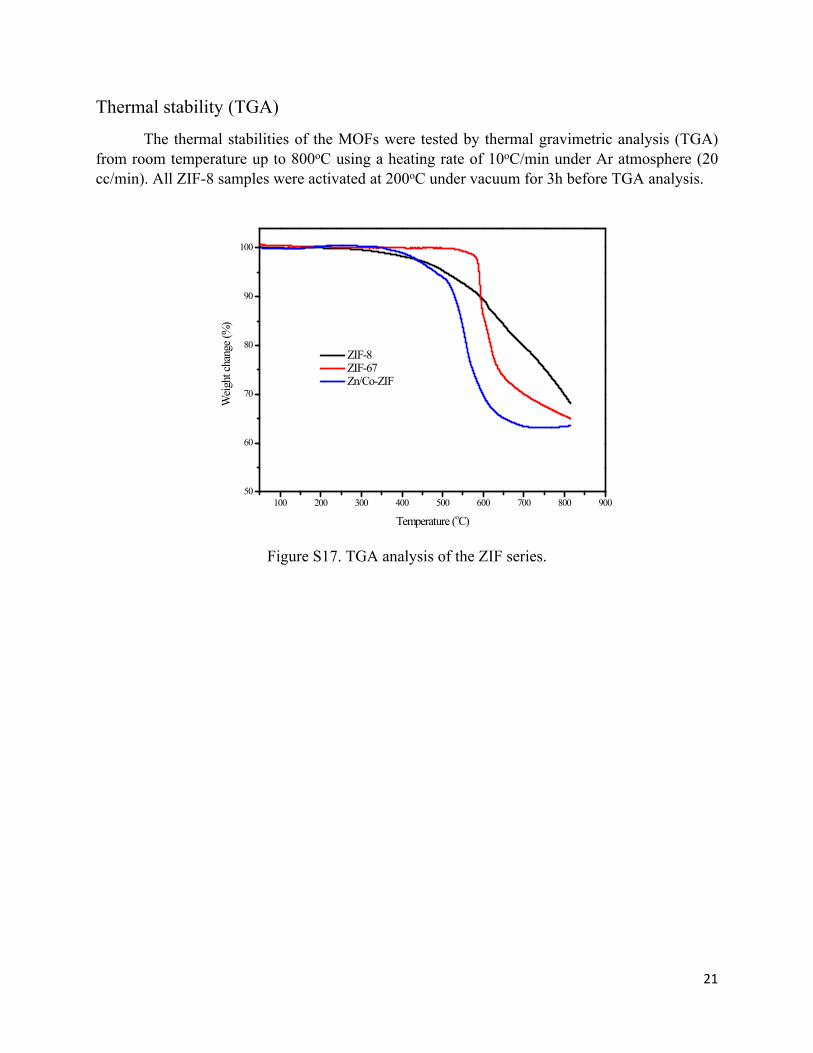
Thermal stability (TGA)
The thermal stabilities of the MOFs were tested by thermal gravimetric analysis (TGA) from room temperature up to 800oC using a heating rate of 10oC/min under Ar atmosphere (20 cc/min). All ZIF-8 samples were activated at 200oC under vacuum for 3h before TGA analysis.
Figure S17. TGA analysis of the ZIF series.
100 200 300 400 500 600 700 800 90050
60
70
80
90
100
W
eigh
t cha
nge (
%)
Temperature (oC)
ZIF-8 ZIF-67 Zn/Co-ZIF