Electronic Supplementary Information Operational ... Supplementary Information Operational...
18
S-1 Electronic Supplementary Information Electronic Supplementary Information Operational Calixarene-based Fluorescent Sensing Systems for Choline and Acetylcholine and Their Application to Enzymatic Reactions Dong-Sheng Guo, 1 Vanya D. Uzunova, 2 Xin Su, 1 Yu Liu, 1,* and Werner M. Nau 2,* 1 Department of Chemistry, State Key Laboratory of Elemento-Organic Chemistry, Nankai University, Tianjin, 300071, P. R. China. E-mail: [email protected] ; Fax: (86)2223503625 2 School of Engineering and Science, Jacobs University Bremen, Campus Ring 1, D-28759 Bremen, Germany. E-mail: [email protected] ; Fax: (49)4212003229 * Authors to whom correspondence should be addressed. Electronic Supplementary Material (ESI) for Chemical Science This journal is © The Royal Society of Chemistry 2011
Transcript of Electronic Supplementary Information Operational ... Supplementary Information Operational...

S-1
Electronic Supplementary InformationElectronic Supplementary Information
Operational Calixarene-based Fluorescent Sensing Systems for Choline and Acetylcholine and Their Application to Enzymatic Reactions
Dong-Sheng Guo,1 Vanya D. Uzunova,2 Xin Su,1 Yu Liu,1,*and Werner M. Nau2,*
1 Department of Chemistry, State Key Laboratory of Elemento-Organic Chemistry, Nankai University, Tianjin, 300071, P. R. China. E-mail: [email protected]; Fax: (86)2223503625
2 School of Engineering and Science, Jacobs University Bremen, Campus Ring 1, D-28759 Bremen, Germany. E-mail: [email protected]; Fax: (49)4212003229
* Authors to whom correspondence should be addressed.
Electronic Supplementary Material (ESI) for Chemical ScienceThis journal is © The Royal Society of Chemistry 2011

S-2
Table of Contents
1. Expanded Introduction .............................................................................................................S-3
1.1. Previously Investigated Host/Dye Pairs ..........................................................................S-3
2. Experimental Section ...............................................................................................................S-3
2.1. Materials ........................................................................................................................S-3
2.2. NMR spectroscopy .........................................................................................................S-4
2.3. Optical Spectroscopy......................................................................................................S-4
2.4. Data Analysis and Fitting................................................................................................S-5
2.5. Isothermal Titration Calorimetry.....................................................................................S-6
2.6. Electrochemical Measurements.......................................................................................S-7
2.7. Preparation and X-ray Diffraction of the 2•LCG Crystal .................................................S-7
2.8. HPLC-MS Measurements...............................................................................................S-8
3. Supporting Results and Experimental Raw Data.......................................................................S-8
3.1. Calixarene/LCG Binding in Dependence on Salt Concentration and pH..........................S-8
3.2. Job’s Plot Analyses.......................................................................................................S-10
3.3. Calorimetric Measurements ..........................................................................................S-10
3.4. 1H NMR Measurements................................................................................................S-12
3.5. ORTEP View of the Crystal Structure of the 2•LCG Complex......................................S-12
3.6. Fluorescence Lifetime Measurements ...........................................................................S-12
3.7. Cyclic Voltammetry Measurements ..............................................................................S-13
3.8. Binding Constant of 1•LCG in the Enzymatic Buffers ..................................................S-14
3.9. Supramolecular Tandem Assay for Lysine Decarboxylase ............................................S-14
3.10. Enzyme Kinetic Parameters Extracted from the AChE and ChO Assays .....................S-16
3.11. Mass Spectrometry Measurements..............................................................................S-16
3.12. Fluorescence Control Experiments for the Enzyme Assays .........................................S-17
4. References .............................................................................................................................S-18
Electronic Supplementary Material (ESI) for Chemical ScienceThis journal is © The Royal Society of Chemistry 2011

S-3
1. Expanded Introduction 1.1. Previously Investigated Host/Dye Pairs. Following early reports on the binding of L-carnitine derivatives by resorcinarene hosts,1,2 the first fluorescence sensing system was reported by Inouye et al., who used a complex between 4 (resorcinarene) and PSP (pyrene-modified N-alkylpyridinium cation) in alkaline-alcoholic solution for the selective detection of acetylcholine; other analytes with neurotransmitter activity such as noradrenaline and GABA (γ-aminobutyric acid) had no effect.3 Shinkai and co-workers improved upon this system by using the same PSP dye but with another host 5 (p-sulfonatocalix[6]arene) in an alcoholic medium, resulting in a higher fluorescence response upon binding.4 Zhang et al. introduced RhB (rhodamine B) and host 6 (p-sulfonatocalix[8]arene) as an alternative sensing system in nonalcoholic phosphate-buffered media, with a comparable fluorescence response.5 Jin and co-workers described a related calixarene-based sensing system with host 6 for choline-type neurotransmitters, by exploiting a different rhodamine derivative as a dye Rh6G (rhodamine 6G).6 The same group reported the use of Rh800 (Rhodamine 800) with 6 for sensing of acetylcholine and choline by near-infrared fluorescence detection.7 An alternative system employs DANCh (dansylcholine) in combination with 6 in an aqueous medium to sense neurotransmitters of the choline type.8 Tan et al. have recently also revisited the original work of Inouye, using the same PSP dye, but employing a better water-soluble cyano-modified resorcinarene 7 as a host, thereby constructing a pH-dependent sensor.9 Bakirci et al. have, up to date, designed the most compact and water-soluble host-guest ensemble for choline and L-carnitine sensing, which consists of a small azoalkane as a dye (DBO) and 1 (p-sulfonatocalix[4]arene) as a host.10 The authors have further improved on their host-dye reporter pair by introducing DBO-A (1-aminomethyl derivative of the azoalkane) as a guest,11 which was subsequently successfully implemented for the continuous sensing of biogenic amines.12,13 The work by Korbakov et al. presented a new pyridinium-styrene derivative as a dye (DASP) and the calixarene 5 as an alternative acetylcholine sensor system in the micromolar range.14 2. Experimental Section 2.1. Materials. The three host compounds, p-sulfonatocalix[4]arene tetrasodium (1),15 p-sulfonatocalix[5]arene pentasodium (2),16 and p-sulfonatothiacalix[4]arene tetrasodium (3)17 were synthesised and purified according to the literature. Lucigenin (LCG) was obtained from TCI (Tokyo, Japan) and used without further purification. The concentration of LCG was determined according to an extinction coefficient of ε432 = 1.2 × 10⁴ M−
1 cm−1.18 The phosphate buffer solution
at pH 2 was prepared by dissolving sodium dihydrogen phosphate in distilled deionised water to make a 0.1 M solution, which was then adjusted to pH 2 by addition of phosphoric acid. The phosphate buffer solution at pH 7.2 was prepared by dissolving disodium hydrogen phosphate (Na2HPO4⋅12H2O, 25.79 g) and sodium dihydrogen phosphate (NaH2PO4⋅2H2O, 4.37 g) in distilled
Electronic Supplementary Material (ESI) for Chemical ScienceThis journal is © The Royal Society of Chemistry 2011

S-4
deionised water (1000 ml) to afford a 10-mM solution. The perchlorate solutions of pH 2 and 7 were prepared from 0.1 M perchloric acid and 10 mM sodium perchlorate, respectively. pH values were fine-adjusted by addition of HCl or NaOH. The pH values of the buffer solutions were verified on a Sartorius pp-20 pH-meter calibrated with two standard buffer solutions. For the enzymatic assays L-Lysine dihydrochloride, cadaverine dihydrochloride, choline chloride, and acetylcholine hydrochloride (all ≥ 99%) were used as received from Fluka (Seelze, Germany). Betaine hydrochloride, Tacrine (9-Amino-1,2,3,4-tetra-hydroacridine hydrochloride hydrate), and (–)-Huperizine A (all ≥ 99%) were from Sigma-Aldrich. Lysine decarboxylase (crude acetone extract from Bacterium cadaveris, 0.08 U/mg), acetylcholinesterase (lyophilised powder from electric eel, ≥ 60% content, 236 U/mg), and choline oxidase (lyophilised powder from Alcaligenes species, 12 U/mg) were used as received from Sigma-Aldrich. The concentrations of choline oxidase and acetylcholinesterase were determined spectrophotometrically using extinction coefficients of ε454 = 1.1 × 10⁴ M−
1 cm−1 and ε280 = 5.0 × 10⁵ M−
1 cm−1, respectively. The ammonium
acetate buffer for the enzyme assays (10 mM, pH 6) was prepared freshly on a daily basis from a 100-mM stock solution, made with crystalline NH4OAc (AppliChem, Darmstadt, Germany) in ultrapure water. The sodium phosphate buffer (10 mM, pH 8), was also prepared freshly on a daily basis from a 100-mM stock solution. The pH was adjusted with HCl and NaOH. The reagent solutions were also prepared freshly daily. 2.2. NMR spectroscopy. 1H NMR spectra were recorded at pD 2 and 7.2 on a Varian Mercury VX300 spectrometer using 2,2-dimethyl-2-silapentane-5-sulfonate (DSS) as an external reference. The host and the guest were mixed in a 1:1 stoichiometry. The phosphate D2O buffer solution at pD 2 was prepared by dissolving sodium dihydrogen phosphate (NaH2PO4, 0.2379g) in 20 ml D2O to obtain a 0.1 M solution, and then was further adjusted to pD 2 with DCl. The phosphate D2O buffer solution at pD 7.2 was prepared by dissolving sodium dihydrogen phosphate (NaH2PO4, 0.0672 g) and disodium hydrogen phosphate (Na2HPO4, 0.2045 g) in 20 ml D2O to afford a 0.1 M solution. The pD values of the buffer solutions were verified on a Sartorius pp-20 pH-meter calibrated with two standard buffer solutions. pH readings were converted to pD by adding 0.4 units.19
2.3. Optical Spectroscopy. All measurements were carried out at ambient temperature (25 °C) in 10-mm quartz cuvettes. The absorption spectra were recorded with a Varian Cary 4000 UV-VIS spectrophotometer. The steady-state fluorescence spectra were recorded on an FLS920 fluorometer (Edinburgh Instruments), equipped with Xe900 450W steady-state xenon arc lamp and a red-sensitive PMT with cooled housing. The 1:1 fitting equations used to analyze the binding titrations are discussed below. The fluorescence lifetime measurements were performed on the same instrument by using time correlated single-photon-counting with an NF900 nanosecond flash lamp
Electronic Supplementary Material (ESI) for Chemical ScienceThis journal is © The Royal Society of Chemistry 2011

S-5
for excitation. Typically, 104 counts were collected at the peak channel, and the decay curves were fitted by least-squares reconvolution with the instrument software; the quality of the parameters were judged by the reduced χ2 values (< 1.1) and the randomness of the weighted residuals.
Fluorescence titrations and fluorescence enzyme assays were performed at ambient temperature or at 37 °C, respectively, on a Varian Cary Eclipse fluorometer. The competive fluorescence titrations were performed by successive addition of known amounts of competitor to solutions containing 1 and LCG and following the fluorescence intensity in the spectral area of largest variation. Care was taken to keep the concentration of 1 and LCG constant in the course of the titrations.
Enzyme assays were performed in 1.5-ml quartz cuvettes from Starna (Pfungstadt,
Germany) and the fluorescence was followed in the time-scan mode. The lysine decarboxylase assay was carried out in solutions containing 0.5 µM LCG and 0.5-2.0 µM 1, 50 µM L-Lysine, and
0.003 U/ml enzyme in 10 mM NH4OAc buffer, pH 6, 37 °C (λex = 369 nm, λem = 505 nm). The choline oxidase assay was accomplished in solutions containing 100 nM LCG and 180 nM 1, 5-75 µM choline, and 0.5 U/ml enzyme in 10 mM sodium phosphate buffer, pH 8, 37 °C (λex = 410 nm,
λem = 505 nm).20 The acetylcholinesterase assay was performed in solutions containing 180 nM LCG and 450 nM 1, 5-40 µM choline, and 0.5 U/ml of choline oxidase and 0.1 U/ml of
acetylcholinesterase in 10 mM sodium phosphate buffer, pH 8, 37 °C (λex = 410 nm, λem = 505 nm). 2.4. Data Analysis and Fitting. All fittings were performed in a nonlinear manner with the software ProFit 6.1.9. (QuantumSoft, Zürich, Switzerland). For the direct host-guest titrations, the complexation process of the calixarene macrocycle (M) with the LCG dye (D) was expressed by eq 1 according to a 1:1 host-guest binding stoichiometry.
[M] + [D]Ka
[MD] (1) Here, Ka is the binding constant for the complexation process, and it can be obtained by analyzing the sequential changes of fluorescence intensity of LCG at various concentrations of macrocycle. During the fluorescence titration the intensity of the fluorescence signal corresponds to the combined intensity of the guest and the host-guest complex, which are given by their molar fractions (eq 2). If we substitute in eq 2 the initial concentration of dye and macrocycle we obtain eq 3. The relationship between Ka and the variables in the fluorescence titration is described by eq 4.21
!
"I =xDID + xMDIMD =[D][D]0
ID +[MD][D]0
IMD (2)
!
"I =[D][D]0
(ID #IMD) + IMD (3)
!
"I = IMD + (ID # IMD)([D]0 # [M]0 #1/Ka ) # ([D]0 # [M]0 #1/Ka )
2 + 4[D]0[M]02[D]0
(4)
Electronic Supplementary Material (ESI) for Chemical ScienceThis journal is © The Royal Society of Chemistry 2011

S-6
Here, [D]0 is the initial concentration of LCG and kept constant, [M] is the concentration of macrocycle (calixarene), and ΔI is the change of fluorescence intensity of LCG when [M] is added to the solution. For fitting, the fluorescence intensity change was plotted against the total macrocycle concentration, [M]0, according to eq 4, to afford the association constant Ka.
For the analysis of the competitive titrations, we define [D]0, [C]0, and [M]0 as the total concentrations of dye, competitor (substrate or product), and macrocycle. [D], [C], and [M] are the concentrations of uncomplexed dye, uncomplexed competitor, and uncomplexed macrocycle. [M•D] and [M•C] are the concentrations of the macrocycle-dye and macrocycle-competitor complex, and KC and KD are the association constants of the competitor and dye with the macrocycle.
The relative fluorescence intensity (∆I) in the course of the titration can be expressed as a linear combination of the fluorescence intensity of the uncomplexed dye (ID) and that of the macrocycle-dye complex (IM•D), weighted by their molar fractions according to eq 5. IM•D was further expressed through a 1:1 host-guest binding model21 by the (initial) experimental fluorescence intensity (I0) in the absence of competitor.
!
"I =D[ ]D[ ]0
ID +MD[ ]D[ ]0
IMD (5)
Upon appropriate substitution one obtains eq 6, with the concentration of uncomplexed macrocycle as an unknown; the latter is defined by a cubic equation (eq 7).10,12 For fitting, the fluorescence intensity change was plotted against the total competitor concentration, [C]0, according to eq 6 in a program which solved eq 7 numerically.
!
"I = ID + IMD # ID( ) KD M[ ]1+KD M[ ]
(6)
!
0 = a M[ ]3 + b M[ ]2 + c M[ ] " d, where
a = KCKD, b = KC +KD +KCKD D[ ]0 + C[ ]0 " M[ ]0( ),c = KC C[ ]0 " M[ ]0( ) +KD D[ ]0 " M[ ]0( ) +1, and d = " M[ ]0
(7)
The analysis of the binding constants of metal ions (Metal+) was done according to a previously developed model for competitive metal ion binding,22 where the experimentally observed binding constant (Ka,obs) of the dye with the calixarene macrocycle (M) falls below the actual value (KMD) due to competitive binding by metal ions (KMetal). For fitting, the binding constant of the dye can be plotted against the concentration of metal cation according to eq 8.
!
Ka,obs "KMD
1+KMetal Metal+[ ]0
for [Metal+]0 >> [M]0 (8)
Electronic Supplementary Material (ESI) for Chemical ScienceThis journal is © The Royal Society of Chemistry 2011

S-7
2.5. Isothermal Titration Calorimetry. Titration experiments were carried out at 24 °C in 10 mM sodium perchlorate, pH 7, on a VP-ITC calorimeter from MicroCal, USA. Each experiment consisted of 27 consecutive injections (10 µL) of dye solution into the microcalorimetric reaction cell, which contained the host solution. All solutions were degassed prior to titration. Heats of dilution were subtracted from each data set. The data were analyzed by using a 1:1 binding model in Origin 7.0 software (OriginLab Corporation, Northampton, USA). 2.6. Electrochemical Measurements. The cyclic voltammetry (CV) measurements were carried out on a BAS Epsilon electrochemical analyzer with a C3 cell stand. All solutions were prepared in pH 2 and pH 7.2 phosphate buffers (0.1 M) at 25 °C, and deoxygenated by purging with dry nitrogen for at least 15 minutes before each experiment. The glassy carbon working electrode was polished to a mirror with 0.05 µm BAS alumina suspension on a brown Texmet polishing pad,
sonicated in distilled water for a few minutes to remove any residual alumina particles, and then rinsed with ethanol before usage. A platinum wire was used as the counter electrode. The measured potentials were recorded at a scan rate of 100 mV/s with respect to an Ag/AgCl (immersed in a solution containing 3 M sodium chloride) reference electrode. 2.7. Preparation and X-ray Diffraction of the 2•LCG Crystal. To an aqueous solution of 2 (0.04 mmol, 20 ml) 2.5 equiv. of LCG was added. Under stirring, the pH was adjusted to 6-7. Followed by filtration, the filtrate was left to evaporation for about two weeks. The formed yellow crystal was collected along with its mother liquor for the X-ray crystallographic analysis.
The X-ray intensity data for complex 2•LCG were collected on a Rigaku MM-007 rotating anode diffractometer, equipped with a Saturn CCD Area Detector System, using monochromated Mo-Kα radiation at T = 113(2) K. Data collection and reduction were performed with the
Crystalclear software. The structures were solved by using the direct method and refined by employing full-matrix least squares analysis on F2 (CrystalStructure, SHELXTL-97). X-ray structural data: C154 H167 N6 O63.50 S10, M = 3438.54, monoclinic, a = 29.168(6) Å, b = 27.741(6) Å, c = 20.935(4) Å, α = 90°, β = 105.981(5)°, γ = 90°, space group C2/c, Z = 4, calculated density 1.478, crystal dimensions (mm3): 0.40 × 0.08 × 0.06. µ = 0.243 mm–1, 2θmax = 50.04°, 41985 measured reflections of which 13491 were unique (R(int) = 0.1146), final R indices [I/σ (I) > 2]: R1 =
0.1235, wR2 = 0.3175, R indices (all data): R1 = 0.1952, wR2 = 0.3744, GOF on F2 1.137. CCDC 820542 contains the supplementary crystallographic data, which can be obtained free of charge via www.ccdc.cam.ac.uk/conts/retrieving.html (or from the Cambridge Crystallographic Data Centre, 12 Union Road, Cambridge CB21EZ, UK; fax: (+44) 1223-336-033; or email: [email protected]).
Electronic Supplementary Material (ESI) for Chemical ScienceThis journal is © The Royal Society of Chemistry 2011

S-8
2.8. HPLC-MS measurements: The LC equipment (Agilent 1100 series, Karlsruhe, Germany) comprised a binary pump and an autosampler with a 100-ml loop. This was interfaced with an ion-trap mass spectrometer fitted with an electrospray ionisation (ESI) source (Bruker Daltonics HCT Ultra, Bremen, Germany). Separation was achieved on a Phenomenex C18 column of dimensions 250 mm × 4.6 mm with 5-µm particle size. Solvent A was water/formic acid (1000:0.005 v/v) and solvent B was methanol. Solvents were delivered at a total flow rate of 1 ml/miniute in an isocratic mode of 10% B for 5 minutes. 3. Supporting Results and Experimental Raw Data 3.1. Calixarene/LCG Binding in Dependence on Salt Concentration and pH. The binding constants of LCG with calixarenes 1-3 were determined at pH of 2.0 (Fig. S1) and then at higher pH 7.0 with increasing ionic strength (Fig. S2). Subsequently, the binding constants obtained at different sodium concentrations were plotted (Fig. S3) to obtain estimates for the binding constants of sodium ions with calixarenes 1-3 and to illustrate the strong dependence on cation concentration.
Fig. S1. Direct host-guest titrations of LCG with calixarenes 1-3 (A-B) in 10 mM perchloric acid, pH 2 (λex = 460 nm, λem = 505 nm), fitted according to eq. 4.
Electronic Supplementary Material (ESI) for Chemical ScienceThis journal is © The Royal Society of Chemistry 2011
S-9
Fig. S2. Direct host-guest titration of calixarenes 1-3 (A-C) with LCG at increasing concentration of NaClO4 (0-100 mM, λex = 460 nm, λem = 505 nm) at pH 7, fitted according to eq. 4.
Electronic Supplementary Material (ESI) for Chemical ScienceThis journal is © The Royal Society of Chemistry 2011

S-10
Fig. S3. Dependence of the observed binding constant of LCG with calixarenes 1-3 in dependence on the cation (sodium) concentration, fitted according to eq 8; the binding constants of sodium resulting from fitting are stated inside the graph. 3.2. Job’s Plot Analyses
Fig. S4. Job’s plot analyses for the macrocycles (1-3) with LCG at pH 2 (1-C1) and at pH 7.2 (A2-C2), in 100 mM phosphate buffer, λex = 365 nm, λem = 505 nm, [LCG]+[calixarene] = 8 µM.
Electronic Supplementary Material (ESI) for Chemical ScienceThis journal is © The Royal Society of Chemistry 2011

S-11
3.3. Calorimetric Measurements
Fig. S5. Calorimetric titrations of LCG with calixarene 1 (A), 2 (B), and 3 (C) at 25 °C in 10 mM sodium perchlorate, pH 7 (for comparison reasons the solvent was chosen similar to the fluorescence titration studies). Note the excellent agreement between the binding constants obtained by ITC and by competitive fluorescence titrations (Figure S1 A2, B2, and C2). The top plot shows the instrumental power function versus time (injected aliquots). The bottom plot shows the heats of reaction obtained from the integration of the calorimetric traces, plotted against the host/guest molar ratio.
Table S1. Stability constants (Ka) and thermodynamic parameters for the complex formation
between LCG and calixarenes 1-3 in 10 mM sodium perchlorate, pH 7.
host Ka/ (106 M–1)a ΔG°/ (kJ mol–1) ΔH°/ (kJ mol–1) TΔS°/ (kJ mol–1)
1 25 ± 1 −42.03 ± 0.01 −49.41 ± 0.36 −7.20 ± 0.04
2 22 ± 1 −41.70 ± 0.36 −46.80 ± 0.44 −4.94 ± 0.12
3 7.7 ± 0.1 −29.41 ± 0.19 −39.18 ± 0.01 −3.85 ± 0.26 a Mean values measured from at least two experiments at 25 ºC in aqueous solution, error given as
standard deviation (±1σ).
Electronic Supplementary Material (ESI) for Chemical ScienceThis journal is © The Royal Society of Chemistry 2011
S-12
3.4. 1H NMR Measurements
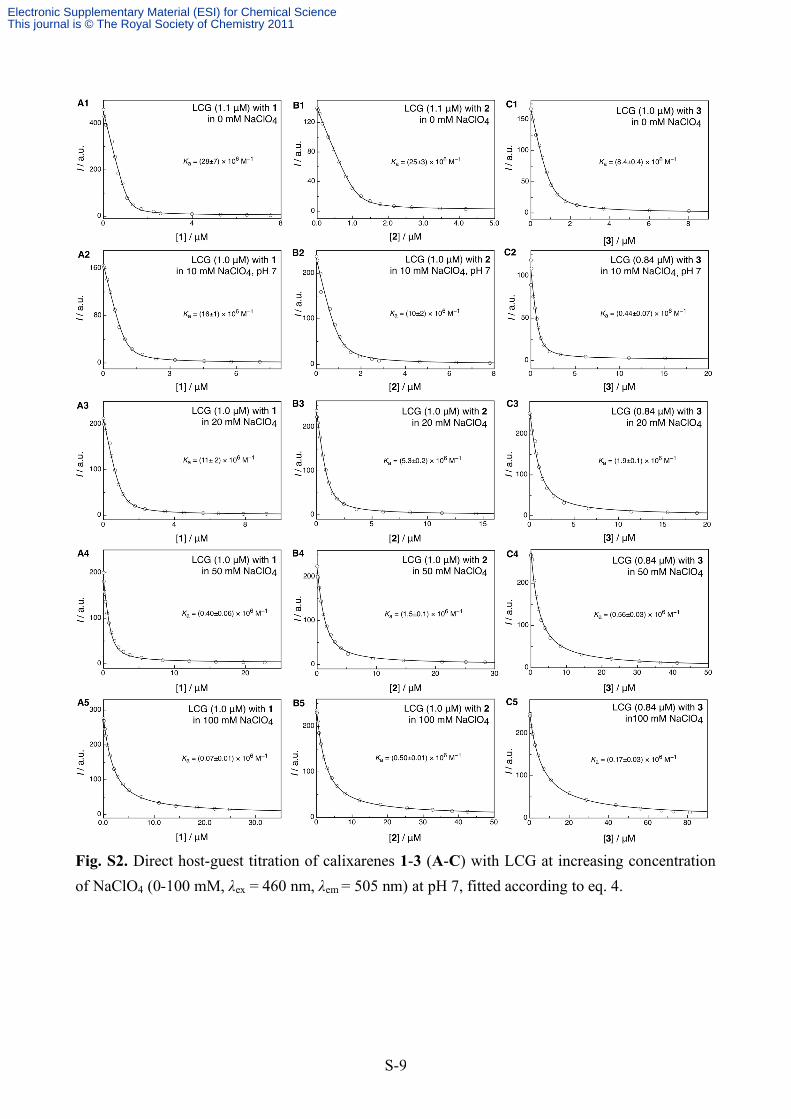
Fig. S6. 1H NMR spectrum (δ/ppm) of 3•LCG in pD 7.2 D2O phosphate buffer. The concentrations of hosts and guest in the experiment were 10 mM each. ‘Ar-H’ represents the aromatic protons of 3. 3.5. ORTEP View of the Crystal Structure of the 2•LCG Complex
Fig. S7. ORTEP view of the 2•LCG complex showing 30% probability displacement ellipsoids. The broken lines represent the intermolecular hydrogen bonds and π-stacking interactions. Note that the oxygen atoms of one of the sulfonato groups are delocalised over 6 positions; for clarity only 3 are shown.
3.6. Fluorescence Lifetime Measurements
Fig. S8. Time-resolved fluorescence decays (λex = 373 nm, λem = 505 nm) of LCG (10 µM) in 10 mM perchloric acid pH 2.0 (black trace) and 10 mM sodium perchlorate pH 7.2 (red trace) on a logarithmic (left) and linear (right) scale.
Electronic Supplementary Material (ESI) for Chemical ScienceThis journal is © The Royal Society of Chemistry 2011

S-13
Table S2. Fluorescence lifetimes of LCG (10 µM) in the absence and presence of calixarene (100 µM) in aerated aqueous solutions at pH 2.0 (10 mM perchloric acid) and 7.2 (10 mM sodium perchlorate); pH values were fine-adjusted by addition of HCl or NaOH.
τ / ns a Analyte
pH 2.0 pH 7.2 LCG 19.4 16.5
1•LCG 19.1 15.8 2•LCG 19.1 15.6 3•LCG 19.0 15.7
a Maximum error in data is 5%. 3.7. Cyclic Voltammetry Measurements
Fig. S9. Cyclic voltammetric (CV) curves of the free calixarenes 1-3 (500 µM) in 100 mM sodium phosphate pH 2 (A) and pH 7.2 (B) as well as of LCG (500 µM) in the absence and presence of calixarenes at pH 2 (C) and pH 7.2 (D); note that calixarenes undergo an irreversible oxidation (ref. 23).
Electronic Supplementary Material (ESI) for Chemical ScienceThis journal is © The Royal Society of Chemistry 2011

S-14
3.8. Binding Constant of 1•LCG in the Enzymatic Buffers
Fig. S10. Host-guest fluorescence titration of LCG (0.7 µM) with 1 in 10 mM NH4OAc buffer, pH 6 (λex = 369 nm, λem = 505 nm) (A) and in 10 mM sodium phosphate buffer, pH 8 (λex = 410 nm, λem
= 505 nm) (B); excitation at 410 nm is recommended to minimise absorption of the choline oxidase flavoprotein, whose characteristic absorption band maxima are near 360 and 455 nm. Note that the titrations shown here and resulting binding constants are slightly different from those obtained in the salt concentration studies (Section 3.1. of ESI) due to the difference in the buffer system of use. 3.9. Supramolecular Tandem Assay for Lysine Decarboxylase. Amino acid decarboxylases convert amino acids (weak competitors) to the corresponding biogenic amines (strong competitors).12 Lysine decarboxylase (LDC), for example, converts L-lysine to cadaverine and CO2 (Scheme S1), and its study is important for understanding abnormal cell growth and proliferation for potential future applications in cancer treatment.24,25
We found that LCG concentrations of 500-700 nM were sufficient for accurate fluorescence detection of LDC activity, and by considering the host-guest binding constant (Ka = 1.90 × 10⁶ M–1, in 10 mM NH4OAc buffer, pH 6, Fig. S11), we selected 3 equiv. of calixarene 1 in order to ensure a large (70%) but non-quantitative degree of dye complexation. Competitive fluorescence titrations with the 1•LCG reporter pair for the substrate L-lysine (Ka < 1.0 × 10³ M–1) and the product cadaverine (Ka = 1.2 × 10⁵ M–1, Fig. S11A) provide direct information on the preferred substrate concentrations and the expected fluorescence response caused by the enzymatic reaction, e.g., at an analyte concentration of 50 µM the enzymatic reaction is expected to show a theoretical fluorescence increase by a factor of ca. 2 (black arrow, corresponding to the conversion of 50 µM substrate to 50 µM product). Indeed, when the enzymatic reaction was initiated by the enzyme (Fig. S11B), the reaction could be directly followed by time-resolved fluorescence in real time, and the experimentally observed fluorescence increase (factor of 1.1-1.6, depending on host-dye ratio) came close to the theoretically expected one. Apparently, impurities in the crude LDC extract have only a minor detrimental effect on the fluorescence differentiation, as previously documented for another enzyme.13
Electronic Supplementary Material (ESI) for Chemical ScienceThis journal is © The Royal Society of Chemistry 2011

S-15
Scheme S1. Reaction catalyzed by lysine decarboxylase and working principle of the corresponding tandem assay.
Fig. S11. (A) Competitive fluorescence titrations of the amino acid L-lysine and its decarboxylated product cadaverine in the presence of LCG (0.5 µM) and 1 (1.5 µM) in 10 mM NH4OAc buffer at pH 6 (λex = 369 nm, λem = 505 nm). The expected fluorescence response in the course of the enzymatic reaction is represented by an arrow. (B) Continuous fluorescent enzyme assay for LDC with the 1•LCG reporter pair (0.003 U/ml enzyme, 50 µM L-lysine, 0.5 µM LCG, and 0.5-2.0 µM 1 in 10 mM NH4OAc buffer, pH 6, λex = 369 nm, λem = 505 nm).
Electronic Supplementary Material (ESI) for Chemical ScienceThis journal is © The Royal Society of Chemistry 2011

S-16
3.10. Enzyme Kinetic Parameters Extracted from the AChE and ChO Assays
Fig. S12. Lineweaver-Burk plots for (A) choline oxidase (0.5 U/ml ChO, 10-75 µM choline, 0.7 µM LCG, and 2.0 µM 1 in 10 mM sodium phosphate buffer, pH 8, λex = 410 nm, λem = 505 nm) and for (B) acetylcholinesterase (0.1 U/ml AChE and 0.5 U/ml ChO, 5-20 µM acetylcholine, 180 nM LCG, and 450 nM 1 in 10 mM sodium phosphate buffer, pH 8, λex = 410 nm, λem = 505 nm).
3.11. Mass Spectrometry Measurements
Fig. S13. HPLC-MS measurements of the enzymatic transformations following the degradation of substrate and appearance of product in the presence of 1•LCG reporter pair (1 µM LCG and 2 µM 1, and 10 µM substrate in 10 mM sodium phosphate buffer, pH 8). Choline oxidase enzymatic transformation (0.5 U/ml enzyme), following the appearance of betaine after 1 minute (A), and after 10 minutes (B); acetylcholinesterase enzymatic transformation (0.05 U/ml enzyme), following the appearance of choline (0.5 U/ml) after 1 minute (C), and after 10 minutes (D).
Electronic Supplementary Material (ESI) for Chemical ScienceThis journal is © The Royal Society of Chemistry 2011

S-17
3.12. Fluorescence Control Experiments for the Enzyme Assays
Fig. S14. Control experiments in 10 mM sodium phosphate buffer, pH 8 (λex = 410 nm, λem = 505 nm). No fluorescence intensity increase of LCG was observed upon addition of enzymes (A); the slight decrease in the fluorescence intensity upon addition of ChO and LDC is presumably due to sample impurities, cf. also ref. 13; the 1•LCG reporter pair was stable in the presence of 200 µM peroxide (B); no fluorescence response of the 1•LCG reporter pair was obtained from acetylcholine in the absence of acetylcholine esterase (C); no fluorescence response of the 1•LCG reporter pair was obtained from the hydrolysis of acetylcholine by acetylcholine esterase but in the absence of choline oxidase (D).
Electronic Supplementary Material (ESI) for Chemical ScienceThis journal is © The Royal Society of Chemistry 2011

S-18
4. References 1. H. J. Schneider, D. Güttes and U. Schneider, J. Am. Chem. Soc., 1988, 110, 6449-6454. 2. H. J. Schneider, D. Güttes and U. Schneider, Angew. Chem. Int. Ed., 1986, 25, 647-649. 3. M. Inouye, K. Hashimoto and K. Isagawa, J. Am. Chem. Soc., 1994, 116, 5517-5518. 4. K. N. Koh, K. Araki, A. Ikeda, H. Otsuka and S. Shinkai, J. Am. Chem. Soc., 1996, 118, 755-
758. 5. Y. J. Zhang, W. X. Cao and J. Xu, Chin. J. Chem., 2002, 20, 322-326. 6. T. Jin, F. Fujii and Y. Ooi, Sensors, 2008, 8, 6777-6790. 7. T. Jin, Sensors, 2010, 10, 2438-2449. 8. T. Jin, J. Inclusion Phenom. Macrocyclic Chem., 2003, 45, 195-201. 9. S. D. Tan, W. H. Chen, A. Satake, B. Wang, Z. L. Xu and Y. Kobuke, Org. Biomol. Chem.,
2004, 2, 2719-2721. 10. H. Bakirci and W. M. Nau, Adv. Funct. Mater., 2006, 16, 237-242. 11. H. Bakirci, A. L. Koner, M. H. Dickman, U. Kortz and W. M. Nau, Angew. Chem. Int. Ed.,
2006, 45, 7400-7404. 12. A. Hennig, H. Bakirci and W. M. Nau, Nat. Methods, 2007, 4, 629-632. 13. W. M. Nau, G. Ghale, A. Hennig, H. Bakirci and D. M. Bailey, J. Am. Chem. Soc., 2009, 131,
11558-11570. 14. N. Korbakov, P. Timmerman, N. Lidich, B. Urbach, A. Sa'ar and S. Yitzchaik, Langmuir,
2008, 24, 2580-2587. 15. S. Shinkai, K. Araki, T. Tsubaki, T. Arimura and O. Manabe, J. Chem. Soc., Perkin Trans. 1,
1987, 2297-2299. 16. J. W. Steed, C. P. Johnson, C. L. Barnes, R. K. Juneja, J. L. Atwood, S. Reilly, R. L. Hollis, P.
H. Smith and D. L. Clark, J. Am. Chem. Soc., 1995, 117, 11426-11433. 17. N. Iki, T. Fujimoto and S. Miyano, Chem. Lett., 1998, 625-626. 18. K. Maeda and T. Hayashi, Bull. Chem. Soc. Jpn., 1967, 40, 169-173. 19. P. K. Glasoe and F. A. Long, J. Phys. Chem., 1960, 64, 188-190. 20. For choline oxidase, the excitation wavelength was changed to 410 nm in order to minimise
absorption by the flavoprotein in this enzyme, whose characteristic absorption band maxima are around 360 and 455 nm.
21. W. M. Nau and X. Y. Zhang, J. Am. Chem. Soc., 1999, 121, 8022-8032. 22. H. Bakirci, A. L. Koner and W. M. Nau, Chem. Commun., 2005, 5411-5413. 23. G. Diao and Z. Wei, J. Electroanal. Chem., 2004, 567, 325-330. 24. A. E. Pegg, Cancer Res., 1988, 48, 759-774. 25. E. W. Gerner and F. L. Meyskens, Nat. Rev. Cancer, 2004, 4, 781-792.
Electronic Supplementary Material (ESI) for Chemical ScienceThis journal is © The Royal Society of Chemistry 2011


![Calixarene A calixarene is a macrocycle or cyclic oligomer based on a hydroxyalkylation product of a phenol and an aldehyde [1]. The word calixarene is.](https://static.fdocuments.us/doc/165x107/56649e365503460f94b250e5/calixarene-a-calixarene-is-a-macrocycle-or-cyclic-oligomer-based-on-a-hydroxyalkylation.jpg)