Electronic Supplementary Information analysis enrichment ...
11
S1 Electronic Supplementary Information Development of magnetic LuPO 4 microspheres for highly selective enrichment and identification of phosphopeptides for MALDI-TOF MS analysis Xing-yu Long 1,2 , Qun Song 1 , Hong-zhen Lian 1 * 1. State Key Laboratory of Analytical Chemistry for Life Science, Collaborative Innovation Center of Chemistry for Life Sciences, School of Chemistry & Chemical Engineering and Center of Materials Analysis, Nanjing University, 22 Hankou Road, Nanjing 210093, China 2. Editorial Department of Journal, Guizhou Normal University, 180 Baoshan North Road, Guiyang 550001, China *Corresponding author. Tel.: +86-25-83686075; fax: +86-25-83325180. E-mail: [email protected] (H. Z. Lian). Electronic Supplementary Material (ESI) for Journal of Materials Chemistry B. This journal is © The Royal Society of Chemistry 2015
Transcript of Electronic Supplementary Information analysis enrichment ...

S1
Electronic Supplementary Information
Development of magnetic LuPO4 microspheres for highly selective
enrichment and identification of phosphopeptides for MALDI-TOF MS
analysis
Xing-yu Long1,2, Qun Song1, Hong-zhen Lian1*
1. State Key Laboratory of Analytical Chemistry for Life Science, Collaborative Innovation
Center of Chemistry for Life Sciences, School of Chemistry & Chemical Engineering and
Center of Materials Analysis, Nanjing University, 22 Hankou Road, Nanjing 210093, China
2. Editorial Department of Journal, Guizhou Normal University, 180 Baoshan North Road,
Guiyang 550001, China
*Corresponding author. Tel.: +86-25-83686075; fax: +86-25-83325180. E-mail:
[email protected] (H. Z. Lian).
Electronic Supplementary Material (ESI) for Journal of Materials Chemistry B.This journal is © The Royal Society of Chemistry 2015

S2
Part 1. Supporting figures
Fig. S1. SEM (left) and TEM (right) images of Fe3O4 (a, c), Fe3O4@SiO2 (b, d), respectively.

S3
Fig. S2. EDX spectra of the prepared Fe3O4, Fe3O4@SiO2, Fe3O4@Lu(OH)CO3 and
Fe3O4@LuPO4 microspheres (From top to down).

S4
Fig. S3. MALDI-TOF MS spectra of phosphopeptides from tryptic digests of bovine β-casein
and BSA (1:50 molar ratio) with different affinity materials. a. Without enrichment; b. Fe3O4;
c. Fe3O4@SiO2; d. Fe3O4@Lu(OH)CO3; e. Fe3O4@LuPO4; f. Commercial TiO2. The data in
parentheses represent S/N ratios.

S5
S6
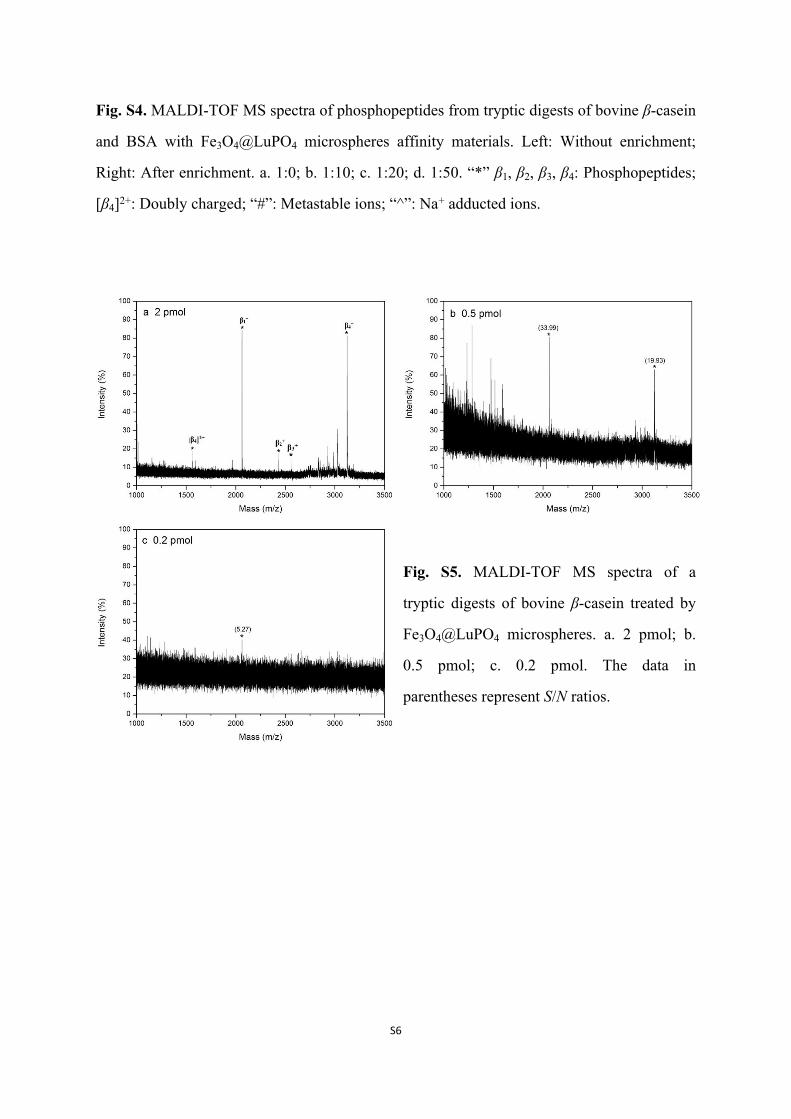
Fig. S4. MALDI-TOF MS spectra of phosphopeptides from tryptic digests of bovine β-casein
and BSA with Fe3O4@LuPO4 microspheres affinity materials. Left: Without enrichment;
Right: After enrichment. a. 1:0; b. 1:10; c. 1:20; d. 1:50. “*” β1, β2, β3, β4: Phosphopeptides;
[β4]2+: Doubly charged; “#”: Metastable ions; “^”: Na+ adducted ions.
Fig. S5. MALDI-TOF MS spectra of a
tryptic digests of bovine β-casein treated by
Fe3O4@LuPO4 microspheres. a. 2 pmol; b.
0.5 pmol; c. 0.2 pmol. The data in
parentheses represent S/N ratios.

S7
Fig. S6. Reusability test of Fe3O4@LuPO4
affinity microspheres in enrichment of 10
pmol β-casein trypsin digest. a-c represent
the 1st to 3rd reuse of the material.

S8
Fig. S7. MALDI-TOF MS spectra of
phosphopeptides from tryptic digests of fresh
pure milk treated with different affinity
materials. a. Without enrichment; b.
Fe3O4@LuPO4; c. Fe3O4@Lu(OH)CO3. “*”
β1, β2, β3: Phosphopeptides; [β3]2+: Doubly
charged; “#”: Metastable ions or Na+
adducted ions; “^”: Non-phosphopeptides.
The data in parentheses represent S/N ratios.
Fig. S8. MALDI-TOF MS spectra of human serum treated with Fe3O4@LuPO4 affinity
microspheres. a. Without enrichment; b. After enrichment. “*”: Phosphopeptides; “#”:
Metastable ions phosphopeptides. The data in parentheses represent S/N ratio.

S9
Part 2. Supporting tables
Table S1. Identified phosphopeptides from proteolytic digests of β-casein and fresh pure
milk, and human serum sample.
m/z S/N Position Amino acid sequence (sites)
1545.99 32.56 HS1 D[pS]GEGDFLAEGGGVR (1P)
1562.05 22.46 β-(16-40)* RELEELNVPGEIVE[pS]L[pS][pS][pS]EESITR (4P)
1617.05 257.08 HS2 AD[pS]GEGDFLAEGGGVR (1P)
1660.41 14.22 α-S1(121-134) VPQLEIVPN[pS]AEER (1P)
1927.23 184.18 α-S1(58-73) DIG[pS]E[pS]TEDQAMEDIK (2P)
1951.49 140.96 α-S1(119-134) YKVPQLEIVPN[pS]AEER (1P)
2061.69 305.65 β-(48-63) FQ[pS]EEQQQTEDELQDK (1P)
2083.69 11.16 β-(48-63)^ FQ[pS]EEQQQTEDELQDK-Na (1P)
2431.89 36.39 β-(45-63) IEKFQ[pS]EEQQQTEDELQDK (1P)
2555.94 21.43 β-(48-67) FQ[pS]EEQQQTEDELQDKIHPF (1P)
2935.50 10.69 α-S1(50-73) EKVNEL[pS]KDIG[pS]E[pS]TEDQAMEDIK (3P)
2984.09 27.98 β-(16-40)^ RELEELNVPGEIVE[pS]L[pS][pS][pS]EESITR-Na (2P)
3042.06 13.68 β-(16-40) RELEELNVPGEIVE[pS]L[pS][pS][pS]EESITR (3P)
3122.04 162.86 β-(16-40) RELEELNVPGEIVE[pS]L[pS][pS][pS]EESITR (4P)
3144.01 10.31 β-(16-40)^ RELEELNVPGEIVE[pS]L[pS][pS][pS]EESITR-Na (4P)
“[pS]/[pS]” shows phosphorylation on serine or probable; “Mo” indicates oxidation on
methionine; “*” denotes doubly charged peak; “^” represents Na+ adducted ions peak.

S10
Table S2. Apparent and true m/z of metastable ions of phosphopeptides*
m/z
Ma Mb Mx Mc (Observed) Mc’ (Calculated)r �̅�
2061.76 1963.76 1870.42 1965.32 1965.44 0.992
3122.21 3024.21 2929.29 3027.05 3025.17 0.988
3122.21 2926.21 2742.51 2929.62 2930.30 0.996
1617.05 1519.05 1426.99 1520.96 1520.96 0.991
1545.99 1447.99 1356.20 1449.20 1449.88 0.993
0.992
* Calculated by Eq. 1 (Harvey derivation formula). Ma: Precursor ion; Mb: Product ion; Mc:
Metastable ion.
𝑀𝑥 =𝑀2
𝑏
𝑀𝑎 𝑟 =
𝑀𝑏 ‒ 𝑀𝑐 + 𝑀𝑐(𝑀𝑎 ‒ 2𝑀𝑏 + 𝑀𝑥)(𝑀𝑐 ‒ 𝑀𝑥)
𝑀'𝑐 = 𝑀𝑎[1 +𝑀𝑏
𝑀𝑎𝑟
(1 + 𝑟) ]2 (1)

S11
Table S3. High-abundant nonphosphopeptides from proteolytic digests of β-casein and BSA
at molar ratio of 1:50.
m/z S/N Position Amino acid sequence
1037.46 6.45 BSA(310-318)^ SHCIAEVEK-Na
1154.58 24.08 β-(113-122) VKEA[Mo]APKHK
1249.59 29.89 BSA(35-44) FKDLGEEHFK
1416.68 27.95 BSA(569-580) TV[Mo]ENFVAFVDK
1495.77 11.65 BSA(387-399) DDPHACYSTVFDK
“Mo” indicates oxidation on methionine; “^” represents Na+ adducted ions peak.
Table S4. High-abundant non-phosphopeptides from proteolytic digest of fresh pure milk
(S/N > 60)
m/z S/N Position Amino acid sequence
1267.22 329.71 α-S1 (106-115) YLGYLEQLLR
1384.19 235.25 α-S1(38-49) FFVAPFPEVFGK
1759.30 92.96 α-S1(23-37) HQGLPQEVLNENLLR
2185.37 250.43 α-S2(18-36) TMEHVSSSEESIISQETYK
2315.30 61.33 α-S1 (148-166) EPMIGVNQELAYFYPELFR