Electron Spin Resonance of Metallocarbonic …electron spin resonance absorption. These ESRI spectra...
11
THE JOURNAL OF BIOLOGICAL CHEMISTRY Vol. 24F, No. 22, Issue of November 25, PP. 7058-7067, 1971 Printed in U.S.A. Electron Spin Resonance of Metallocarbonic Anhydrases* (Received for publication, May 6, 1971) JUNE S. TAYLORI AND JOSEPH E. COLEMAN From The Department of Molecular Biophysics and Biochemistry, Yale University, New Haven, Connecticut 06510 SUMMARY Electron spin resonance (ESR) spectra of Cu(I1) and Co(II) derivatives of human, monkey, and bovine carbonic anhy- drases and their anion complexes are reported. The ESR signals of most of the Cu(I1) derivatives indicate a coordina- tion geometry with axial symmetry. Copper carbonic anhy- drase complexes appear to have one coordination site filled by a monodentate ligand from solution. This ligand causes increasing electron delocalization from the copper ion in the order CH&OO- < OCN- < ethoxzolamide < HCO,- < azosulfamide < H,O < Nq- < SH- < CN- as indicated by decreasing values of g ,, . The presence of highly resolved nitrogen superhyperfine structure in the spectra of the cyanide complexes of Cu(I1) human carbonic anhydrases B and C identifies at least 2 equivalent nitrogen atoms as li- gands to the metal ion. Carboxymethylation of the human B enzyme modifies the coordination site, but appears to leave the metal ligands unchanged. A new 2 : 1 cyanide complex of Co(I1) carbonic anhydrase is described with an intense ESR signal typical of low spin Co(I1) in an axially symmetrical environment. This is in contrast to the broad, weak absorption of the cobalt enzyme and its 1: 1 anion complexes which we have examined and which appear to be high spin Co(I1). While the ESR spectra of the Cu(I1) and Co(I1) carbonic anhydrase complexes which show intense signals are best explained by a square planar or five-coordinate square pyramidal geometry, the geometry of these inactive derivatives probably deviates from that of the catalytically active complex. These studies suggest that there is some flexibility of the ligands at the active site and that certain metal ions or anions may force deviation from the active highly distorted four-coordinate geometry. There are several pieces of evidence which indicate that the metal ion in carbonic anhydrase participates directly in the catalytic process. The metal ion is necessary for enzymatic activity (l-6) and anions such as CN-, N3, and SH- which are * This work was supported by Grant BO-13344 from the Na- tional Science Foundation and by Grant AM-09070-07 from the National Institutes of Health. United States Public Health Service. $ Recipient of a postdoctoral fellowship from the National Institutes of Health, United States Public Health Service. effective monodentate ligands for metal ions are powerful inhibi- tors. Binding of sulfonamides to carbonic anhydrase is also metal ion dependent (7), and the x-ray structure of a human carbonic anhydrase C - acetoxymercurisulfanilamide complex shows the sulfonamide group to occupy a position within the coordination sphere of the zinc ion (8). Bicarbonate also appears to occupy one coordination position in the active Co(I1) deriva- tive of the enzyme (4). Thus it is of importance in elucidating the catalytic mechanism to investigate the identity of the ligands and the coordination geometry at the active site. Cobalt(I1) and copper(I1) substitution of zinc(I1) at the active site of carbonic anhydrase has been a valuable spectroscopic tool for probing the active center of this enzyme because of the rela- tively intense d-d transitions characteristic of the complexes of these ions with the active site (1, 2). The sensitivity of the energies and optical activity of the d-d transitions to the nature, number, and geometry of the ligands has given much valuable information about the active center of carbonic anhydrase (3-6). These ions are also valuable paramagnetic probes, since the spins of their unpaired d electrons give rise to characteristic electron spin resonance absorption. These ESRI spectra can be particularly useful in elucidating the molecular structure around the transition metal ion, since in many cases‘they allow identifi- cation of the ligand donor atoms and the determination of the geometry of the complex. The present paper reports a detailed electron spin resonance study of the cobalt and copper derivatives of carbonic anhydrase. A preliminary account of this work has been published (9). MATERIALS AND METHODS Enzymes and Chemicals-The preparations of human, bovine, and monkey carbonic anhydrase and their metal derivatives have been described previously (4, 10-12). In the preparation of samples of Cu(I1) carbonic anhydrase for electron spin resonance measurements care must be taken that any excess copper is removed by extensive dialysis of the enzyme against metal-free buffer.. We have observed that the presence of excess enzyme- bound Cu(I1) can obscure even the very well resolved superhy- perfine structure of the CN- complexes, the resulting signal being broad and asymmetrical in the gl region. In the case of the Cu(I1) enzyme and the other anion complexes, the signal from this extraneous enzyme-bound Cu(I1) closely overlaps that of the act.ive sit.e Cu(II), obscuring the characteristic differences between the various complexes. Metal ion solutions were pre- pared from spectrographically pure metals or metal salt’s obtained 1 The abbreviation used is: ESR, electron spin resonance. by guest on April 9, 2020 http://www.jbc.org/ Downloaded from
Transcript of Electron Spin Resonance of Metallocarbonic …electron spin resonance absorption. These ESRI spectra...

THE JOURNAL OF BIOLOGICAL CHEMISTRY Vol. 24F, No. 22, Issue of November 25, PP. 7058-7067, 1971
Printed in U.S.A.
Electron Spin Resonance of Metallocarbonic Anhydrases*
(Received for publication, May 6, 1971)
JUNE S. TAYLORI AND JOSEPH E. COLEMAN
From The Department of Molecular Biophysics and Biochemistry, Yale University, New Haven, Connecticut 06510
SUMMARY
Electron spin resonance (ESR) spectra of Cu(I1) and Co(II) derivatives of human, monkey, and bovine carbonic anhy- drases and their anion complexes are reported. The ESR signals of most of the Cu(I1) derivatives indicate a coordina- tion geometry with axial symmetry. Copper carbonic anhy- drase complexes appear to have one coordination site filled by a monodentate ligand from solution. This ligand causes increasing electron delocalization from the copper ion in the order CH&OO- < OCN- < ethoxzolamide < HCO,- < azosulfamide < H,O < Nq- < SH- < CN- as indicated by decreasing values of g ,, . The presence of highly resolved nitrogen superhyperfine structure in the spectra of the cyanide complexes of Cu(I1) human carbonic anhydrases B and C identifies at least 2 equivalent nitrogen atoms as li- gands to the metal ion. Carboxymethylation of the human B enzyme modifies the coordination site, but appears to leave the metal ligands unchanged.
A new 2 : 1 cyanide complex of Co(I1) carbonic anhydrase is described with an intense ESR signal typical of low spin Co(I1) in an axially symmetrical environment. This is in contrast to the broad, weak absorption of the cobalt enzyme and its 1: 1 anion complexes which we have examined and which appear to be high spin Co(I1). While the ESR spectra of the Cu(I1) and Co(I1) carbonic anhydrase complexes which show intense signals are best explained by a square planar or five-coordinate square pyramidal geometry, the geometry of these inactive derivatives probably deviates from that of the catalytically active complex. These studies suggest that there is some flexibility of the ligands at the active site and that certain metal ions or anions may force deviation from the active highly distorted four-coordinate geometry.
There are several pieces of evidence which indicate that the metal ion in carbonic anhydrase participates directly in the catalytic process. The metal ion is necessary for enzymatic activity (l-6) and anions such as CN-, N3, and SH- which are
* This work was supported by Grant BO-13344 from the Na- tional Science Foundation and by Grant AM-09070-07 from the National Institutes of Health. United States Public Health Service.
$ Recipient of a postdoctoral fellowship from the National Institutes of Health, United States Public Health Service.
effective monodentate ligands for metal ions are powerful inhibi- tors. Binding of sulfonamides to carbonic anhydrase is also metal ion dependent (7), and the x-ray structure of a human carbonic anhydrase C - acetoxymercurisulfanilamide complex shows the sulfonamide group to occupy a position within the coordination sphere of the zinc ion (8). Bicarbonate also appears to occupy one coordination position in the active Co(I1) deriva- tive of the enzyme (4). Thus it is of importance in elucidating the catalytic mechanism to investigate the identity of the ligands and the coordination geometry at the active site.
Cobalt(I1) and copper(I1) substitution of zinc(I1) at the active site of carbonic anhydrase has been a valuable spectroscopic tool for probing the active center of this enzyme because of the rela- tively intense d-d transitions characteristic of the complexes of these ions with the active site (1, 2). The sensitivity of the energies and optical activity of the d-d transitions to the nature, number, and geometry of the ligands has given much valuable information about the active center of carbonic anhydrase (3-6).
These ions are also valuable paramagnetic probes, since the spins of their unpaired d electrons give rise to characteristic electron spin resonance absorption. These ESRI spectra can be particularly useful in elucidating the molecular structure around the transition metal ion, since in many cases‘they allow identifi- cation of the ligand donor atoms and the determination of the geometry of the complex. The present paper reports a detailed electron spin resonance study of the cobalt and copper derivatives of carbonic anhydrase. A preliminary account of this work has been published (9).
MATERIALS AND METHODS
Enzymes and Chemicals-The preparations of human, bovine, and monkey carbonic anhydrase and their metal derivatives have been described previously (4, 10-12). In the preparation of samples of Cu(I1) carbonic anhydrase for electron spin resonance measurements care must be taken that any excess copper is removed by extensive dialysis of the enzyme against metal-free buffer.. We have observed that the presence of excess enzyme- bound Cu(I1) can obscure even the very well resolved superhy- perfine structure of the CN- complexes, the resulting signal being broad and asymmetrical in the gl region. In the case of the Cu(I1) enzyme and the other anion complexes, the signal from this extraneous enzyme-bound Cu(I1) closely overlaps that of the act.ive sit.e Cu(II), obscuring the characteristic differences between the various complexes. Metal ion solutions were pre- pared from spectrographically pure metals or metal salt’s obtained
1 The abbreviation used is: ESR, electron spin resonance.
by guest on April 9, 2020
http://ww
w.jbc.org/
Dow
nloaded from

Issue of November 25, 1971 J. X. Taylor and J. E. Coleman 7059
from Johnson Matthey Company, Ltd., London, England. Acetazolamide (2-acetylamino-l , 3,4-thiadiazole-5-sulfonamide) was kindly supplied by the Lederle Research Laboratories. Ethoxzolamide (6-ethoxybenzothiazide-2-sulfonamide) was a gift of Dr. Thomas Maren. Azosulfamide (4’-sulfamylphenyl-2- azo-7-a.cetamido-l-hydroxynaphthalene-3,B-disulfonate (Neo- prontosil)) was purchased from Winthrop Laboratories. The carboxymethylated derivative of Cu(I1) human carbonic an- hydrase B was prepared by first treating the Zn(I1) enzyme with 10v2 M iodoacetate (Eastman Organic Chemicals) in 0.025 M Tris, pH 8.0, for 24 hours. The zinc was then removed by dialysis against 1, IO-phenanthroline, 2 X 10h3 M, in 0.025 M Tris-0.025 M
sodium acetate, pH 5.5, according to previously published tech- niques (5, 13). Zinc removal was monitored by atomic absorp- tion spectroscopy (14) and complete carboxymethylation was checked by reacting an aliquot of the apocarboxymethylated en- zyme with Co(I1) and determining the visible absorption spec- trum. The spectrum of this derivative has been well charac- terized (15, 16). Cu(I1) was then reacted with the remainder of the sample which was then dialyzed extensively against metal- free buffer. Crystalline diphenylpicrylhydrazyl was obtained from Varian Associates. 2,2,6,6-Tetramethyl-4-hydroxypi- peridine-1-oxyl was synthesized by the method of Rozantzev a.nd Krinitzkaya (17). All other chemicals were reagent grade and used without further purification. Metal-free water was used throughout. Metal-free buffers Were prepared a’ previously
FIG. 1. ESR spectra of Cu(I1) human carbonic anhydrase B
described (18, 19). NaCN solutions were prepared fresh for (HCAB), pH 8, and Cu(I1) human carbonic anhydrase B. CN- at pH 6, 7.2, and 8. Conditions: 2 X 10-d M enzyme, 0.025 M Tris,
each experiment. 3 X 10⁻⁴ h cyanide. Electron Spin Resonance-Spectra were measured on a Varian
E-4 spectrometer using a 100 kHz modulation frequency. Tem- TABLE I perature was controlled to hO.5” with a Varian E-257 variable g values and hype&e splitting constants for Cu(ZZ) carbonic temperature controller. All spectra are presented as the first anhydrase complexes
derivative of the absorption curve. The field was calibrated All spectra were taken at pH 8, 112” K. with crystalline diphenylpicrylhydrazyl, g = 2.0036 (20) and with a benzene solution of 2,2,6,6-tetramethyl-4-hydroxypi- peridine-1-oxyl, g = 2.0055 (21). Unless otherwise indicated all spectra were recorded at 112” K. Modulation amplitudes were 10 gauss for Cu(I1) and 8 gauss for Co(I1).
Computer Simulation of Electron Spin Resonance Spectra-In order to determine more accurately the g values and hyperfine coupling constants from the frozen solution ESR spectra, the spectra were simulated on an IBM 7094 computer using a pro- gram kindly supplied by Dr. W. E. Blumberg, Bell Telephone Laboratories. The program assumes a spin Hamiltonian of the form
H = -(3H.g.S + S.A.Z (1)
where II is the magnetic field vector, X and I are the electron and nuclear spins respectively, g is the g tensor, A is the hyperfine tensor, and /3 is the Bohr magneton. Transitions with AM1 # 0 are neglected, as is the slight angular dependence of the transition
Complet g11
Cu(I1) .HCAB.acetate. 2.318” Cu(II).HCAB.OCN- 2.310 Cu(II).HCAB.ethox-
gx g,
-~
,094 2.110
zolamide 2.304 Cu(I1) .HCAB.HCOa-... 2.300 Cu(II).HCAB.azosulf-
2.093 2.07s
amide.. 2.296 2.073 Cu(II).HCAB.HzO.. 2.289* 2.056 Cu(II).HCAC.H20.. 2.289* 2.053 Cu(II).HCAB.Ns-. 2.27~ 2.093 Cu(II).HCAB.SH- 2.249 2.066 Cu(I1) .HCAB.CN-“. 2.197* 2.050 Cu(II).HCAC.CN-. 2.197* 2.050
Cu(II).HCAB(IAA). 2.312 Cu(I1) .HCAB(IAA) .
2.078
probability. A and g are assumed to have the same principal CN-. . 2.20,, 2.083 axes, and a Gaussian lineshape is used. The effects of super- hyperfine splitting due to contact interactions with ligand nuclei 0 HCAB and HCAC, human carbonic anhy . , were included in all simulated spectra. 1oaoace6abe.
Given the values g,, g,, gz, A,, A, and A,, the ESR derivative * Spectral parameters for these complexes were determined by
spectrum is computed by solving for the absorption as a function computer simulation of the spectra (see text). Values of / AlI
of the magnetic field for a range of orientations of the principal (Cu) are given in the text..
axis of g with respect to the magnetic field. The values for the c Note that some of these values differ significantly from pre-
g and A parameters giving the best correspondence of calculated liminary values published previously (9) due to more careful
to experimental spectrum were found by trial and error. exclusion of contaminating copper and the use of computer simu-
The lations to obtain more accurate values.
-
&I
:.091
-
-
If
-
0
-
140 119
150 150
157 150 154 112 117 190 190
138
192
ho I (Cu x 10’ cm-1
16
12
13 10
11 15 16
18
.ase B and C; IAA,
by guest on April 9, 2020
http://ww
w.jbc.org/
Dow
nloaded from

7060 ESR of Metallocarbonic Anh ydrases Vol. 246, No. 22
.-- . _. _ ..̂ . . . - _ . . CU (ItI HCAB.CN-
: .,/ : : !
Low Field g,, Region :.:-
do8
_; ..l : :. _i . . . . 2808 29108
GAUSS ’
FIG. 2. Low field 811 region of the ESR spectrum of Cu(I1) human carbonic anhydrase B (HCAB).CN-, pH 8. .) Upper spectrum, enzyme prepared with 6%~ and G6Cu in natural abun- dance (31% 65Cu, 69% 6%~); Lower spectrum, enzyme prepared with 100% @Cu. Conditions as in Fig. 1.
1 1,’ : j ) i : I
I
:; I
I ‘,’ 1
1.; , I I 2758 3008 3258
GAUSS
FIG. 3. ESR spectra of Cu(I1) human carbonic anhydrase C (HCAC) and Cu(I1) human carbonic anhydrase C.CN- at pH 8. Conditions as in Fig. 1.
calculated as well as the experimental spectra were plotted by a Calcomp plotter.
RESULTS
Cu(II) Carbonic Anhyclrase Cyanide Com,plexes-All of the monodentate anions studied, including the substrate, HCO,-, produce characteristic changes in the ESR spectrum of Cu(I1) human carbonic anhydrase B. Fig. 1 shows the spectrum of Cu(I1) human carbonic anhydrase B and its cyanide complex at pH 6,7.2 and 8. The uncomplexed enzyme shows an ESR spec- trum characteristic of an axially symmetrical complex of Cu(I1) with g Z = g, = g, and gz = g A. It is difficult to estimate A, and A,; however, computer simulations over a range of values (0 to 10 x 10-s cm-l) for the cases A, = A, and A, # A, showed that the best fit was obtained when A, and A, were small (3 x
10e4 cm-l) and equal. It appears from these trials that none of the copper spectra reported here have A, significantly different
FIG. 4. ESR spectra of the complexes of Cu(I1) human carbonic anhydrase B (HUB) with SH-, NV-, OCN-, and CH&OO-. Conditions: 2 X lo+ M enzyme, 0.025 M Tris, pH 9, 4 X 10m4 M
SH-, 4 X 10T4 M Na, BP3 M OCN-, UP2 M acetate.
from A, nor larger than ~10~~ cm-l. There is no well resolved superhyperfine structure apparent in the spectrum of the un- complexed enzyme. Values of g and A are given in Table I.
Addition of CN- causes striking changes in the ESR signal. A 1 increases by 27 % while g 1, decreases considerably; this results in the appearance of a “foldover” peak at 3290 gauss in the perpendicular region due to the MI = -3 transition. Promi- nent nuclear superhyperiine structure appears on the gr signal (Fig. 1). At pH 8 the main gl peak at -3200 gauss due to the MI = ++, &* transitions is split into at least seven equally- spaced superhyperfine lines separated by N 15 gauss. Five lines are resolved on the g, foldover peak at -3290 gauss. This superhyperfine structure is attributable to nitrogen ligands (see “Discussion”). The ESR spectrum of the cyanide complex at pH 9 is almost identical with that observed at pH 8. Seven superhyperfine lines spaced -15 gauss apart are ob- served on the low field copper nuclear hyperfine line at -2700 gauss (MI = +$). An expanded recording of this region is shown in Fig. 2. When pure G3Cu is used, only five lines are observed. As in the case of the uncomplexed enzyme, the best fit for the CN- complex was obtained when A, and A, were small (1.5 x 10e4 cm-l) and equal.
ESR signals of Cu(I1) human carbonic anhydrase C and its CN- complex at pH 8 are shown in Fig. 3. The spectra are similar to those observed for the B enzyme (see g and A values in Table I). The same values of A, used for the B enzyme, namely 3 x ‘10e4 cm-1 for the uncomplexed enzyme and 1.5 x 10e4 cm-1 for the CN- complex, give good fits with the C iso- zyme. The same number of nitrogen superhyperfine lines are resolved on the first L peak of the cyanide complex as were observed in the B isozyme.
Complexes of Cu(II) Carbonic Anhydrase with Sul$de, Azide, Cyan&e, and Acetate-ESR signals of other anion complexes of Cu(II) carbonic anhydrase B also show changes compared with the unliganded enzyme (Fig. 4). The anions SH-, NZ- decrease g i (Table I). Cyanate and acetate, on the other hand, increase
s ., / I I”- i
2758 3008 3258
GAUSS
by guest on April 9, 2020
http://ww
w.jbc.org/
Dow
nloaded from

Issue of November 25, 1071 J. S. Taylor and J. E. Coleman 7061
CutIt) HCAE + Azosulfonomlde
, 1 , 2758 3008 3258
GAUSS
FIG. 5. ESR spectra of the complexes of Cu(I1) human carbonic anhydrase B @CAB) with azosulfamide and ethoxzolamide. Conditions as in Fig. 4, 2 X 10-d M sulfonamide.
g 11. Poorly resolved superhyperfine structure is visible in the g, region of the sulfide and cyanate complexes. From inspec- tion of the ESR signals it appears possible that there is some distortion from axial symmetry for all four of the anion complexes covered in Fig. 4 (see “Discussion”).
Complexes of Cu(II) Carbonic Anhydrase with Xulfonamides- Sulfonamides alter the ESR signal of Cu(I1) carbonic anhydrase in a fashion similar to the alteration caused by the weaker anionic inhibitors (Fig. 5, Table I). The g and A 11 values as well as the hyperfine structure, however, are dependent on the nature of the R group of the sulfonamide (Table I). Two representative examples are given in Fig. 5 showing the complexes of Cu(I1) human carbonic anhydrase B with azosulfamide and ethoxzol- amide. Both show probable nitrogen superhyperfine structure on the gr signal, but it is incompletely resolved.
Carboxymethylated Cu(II) Carbonic Anhydrase-The altera- tions in the activity and physicochemistry of Zn(II) and Co(I1) human carbonic anhydrase B caused by carboxymethylation of a single histidine residue near the active center have been de- scribed extensively (15, 16, 22, 23). In view of the sensitivity of the Cu(I1) ESR signal to additional ligands or changes in geometry at the active center, the ESR signal for the Cu(I1) derivative of the carbosymethylated enzyme and the cyanide complex of this enzyme were examined (Fig. 6). Carboxy- methylation causes significant shifts in the ESR signal of Cu(I1) human carbonic anhydrase B at pH 8. A cyanide complex does form with the carboxymethylated enzyme; the spectrum is similar to that of the unmodified enzyme at pH 7.2 (Fig. 1). The complexity of the g 11 region suggests that in both the car- boxymethylated enzyme and its cyanide complex there may be two species present at pH 8 (see “Discussion”).
Eflect of pH on ESR Spectrum of Cu(II) Human Carbonic
Anhydrase B-Since the enzymatic reaction exhibits a strong pa-dependence in the region pH 6 to 9, it might be expected that the ESR spectrum would also show changes over this pH region. In fact, a dependence on pH was observed not only for the uncomplexed enzyme (Table II), but for the cyanide complex as well (Fig. 1, Table II).
These changes are summarized by the g and IA 11 j (Cu) values given in Table II for five pH values between pH 6 and 9. At intermediate pH the spectra indicate a mixture of two copper
/ Corboxymethyl-Cu(U)HCAB+ CN-
I-. ,I,, I,, ,,‘I,, _LL_I-L-
2758 3008 3258 GAUSS
..J
FIG. 6. ESR spectra of carboxymethylated Cu(I1) human carbonic anhydrase B (HCAB) and carboxymethylated Cu(I1) human carbonic anhydrase B’CN-, pH 8. The enzyme was prepared as described in “Experimental Procedure” and condi- tions were as in Fig. 3.
TABLE II
g and A values of copper carbonic anhydrase B and cyanide complex
PH
G 2.305 2.084 7.2 2.305 2.077 7.5 2.305 2.077 8.0 2.300 2.071 9.0 2.289 2.071
as junction Oj
g,, g,
-
IAIII (copper:
x 10’ cm-l
142
148 148 143 157
g11
2.337 2.236 2.195 2.199 2.197
_-
-
g,
2.093 2.084 2.068 2.058 2.062
I‘% (CoPPer)
x 104 cm-~
114
196 195 188
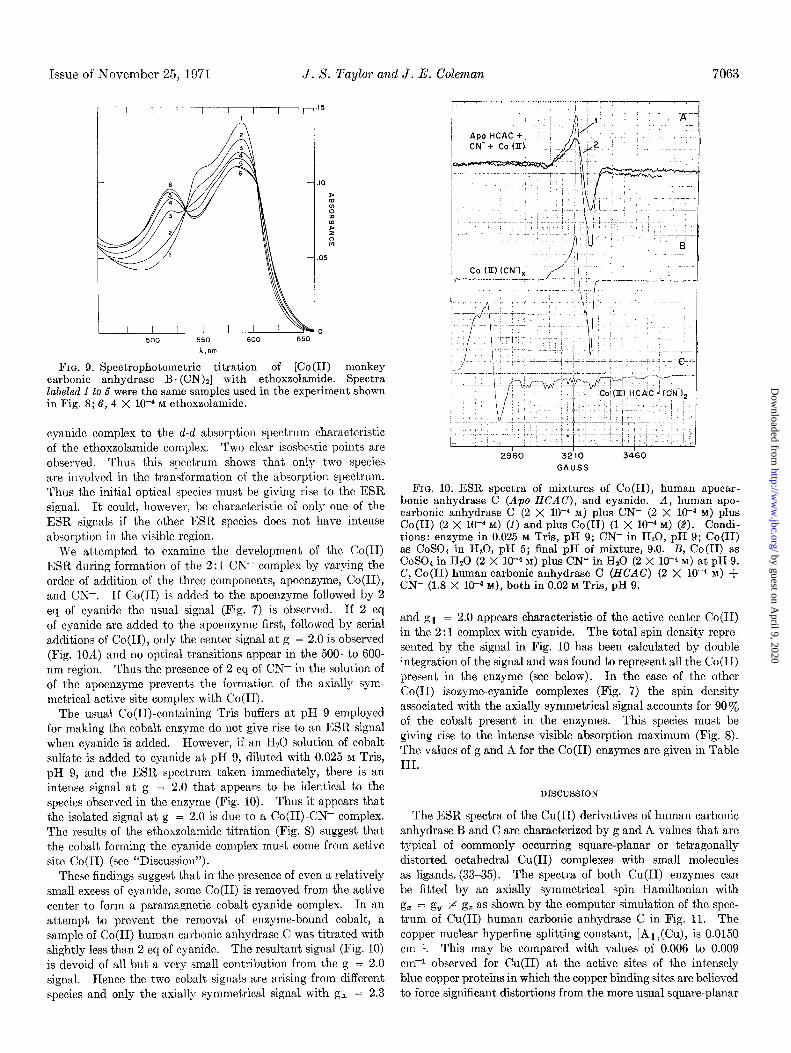
FIG. 7. ESR spectra of Co(I1) bovine carbonic anhydrase B (bovine CAB) (1 X 1W3 M), Co(I1) human carbonic anhydrase I3 (human CAB) (4 X lO+ M), and Co (II) monkey carbonic anhydrase B (monkey CAB) (2 X 10⁻⁴ MI) plus 2 eq of cyanide. Conditions: 0.025 M Tris, pH 9. Instrument gain was adjusted to compensate for protein concentration. Relative amplification is X 1, X 2, and X 5 from top to bottom.
by guest on April 9, 2020
http://ww
w.jbc.org/
Dow
nloaded from
7062 ESR of Metallocarbonic Anhydrases Vol. 246, nTo. 22
TABLE 111
g values and hype&e splitting constants for
Co(II) carbonic anhydrases
ComplexQ g,1
Co(II).HCAC.(CN-)z”. 2.000 Co(II).HCAB. (CN-)2. 2.00 Co(II).MCAB. (CN-)Q.. 2.00 Co(II).BCAB.(CN-)2.. 1.98 Co(H) .HCAB. (IAA)-
(CN-)2.. _. 2.00
i
I -
2.260 96.7 2.26 97 2.26 97 2.26 97
2.26 97
I4 (nitrogen)
x 10’ cm-1
14.7 15 15 15
15
a HCAC and HCAB. human carbonic anhydrase C and B; IAA, iodoacetate.
b Spectral parameters for these complexes were determined by computer simulation of the spectra (see text). For A, and A, the best fit value was A, = A, = A, = 3 X 1OP cm-l.
complexes, a low pH form and a high pH form. Thus except at the extremes of pH, the g and A values given are estimates from composite spectra. The trend in values is clear, however. In going from the low to the high pH form of both the unliganded and cyanide liganded enzymes g 11 decreases very significantly, gr also decreases, while A 11 increases (Table II). The nitrogen superhyperfine structure of the cyanide complex is resolved only in the high pH form of the enzyme (Fig. I).
Complexes of Co(II) Carbonic Anhydrase with Cyanide-
Cobalt ESR signals can be considerably more complex than those of Cu(I1). Two spin states are possible: high spin (S = 4) and low spin (S = $). In many ligand environments cobalt ESR signals are not observed because of rapid spin relaxation. High spin Co(I1) spectra have not been reported except at very low temperatures for Co(I1) inserted in various crystal lattices. Not surprisingly the only Co(I1) complexes that have been studied extensively by ESR are square-planar or square-pyram- idal low spin complexes such as the cobalamins, phthalocy- anins, and a few other complexes of similar geometry (X-30).
In view of the fact that Co(II) carbonic anhydrase and its 1: 1 complexes with several anions and sulfanilamide are reported to be high spin (31), it was not unexpected that Co(I1) carbonic anhydrase and its 1: 1 anion or sulfonamide complexes all give broad poorly resolved signals at liquid nitrogen temperatures (reported in Reference 9). Upon addition of a second equiva- lent of cyanide, however, a narrow signal appears with g values near 2.3 and 2.0 (Fig. 7). This signal is characteristic of the 2:l CN--Co(II) carbonic anhydrase complex of every species and isozyme variant we have examined. The signals for each isozyme have similar g values and differ only in amplitude and hyperfine structure (Fig. 7, Table III). The ESR spectra pre- sented are all taken at 112” K, but the signal for the 2:l CN- complex of the Co(I1) enzyme remains unaltered up to room temperature. The signal consists of a large absorption at g = 2.3 and a series of eight nuclear hyperfine lines at higher
field, centered near g = 2. Each of the eight hyperfine lines is split into a triplet. The part of the signal just described is typical of low spin Co(I1) (S = 3) in an axially symmetric environment with g, = 2.3 and g 11 = 2.0. The enzyme signal contains in addition, however, an anomalous peak at g = 2.0. It is not possible to generate this peak with a computer program for the spin Hamiltonian by manipulat.ion of g values or hyper-
1
FIG. 8. ESR titration of [Co(H) monkey carbonic anhydrase B. (CN)s] with ethoxzolamide. 1, [Co(II) monkey carbonic anhydrase B. (CN)z] (2 X 10-d M); plus 2, 0.5 X lo-” M, 3, 1.0 X W4 M, 4, 1.5 X lO+ M, and 6, 2 X lo+ M ethoxzolamide. Condi- tions as in Fig. 7.
fine interactions (see below) and its isolated appearance suggests a second superimposed signal. Anomalous peaks have been observed in oxygen adducts of low spin Co(I1) complexes (29), but degassing of the sample prior to CN- addition had no effect on this signal. We thus sought other conditions that might separate these two ESR signals, which should theoretically be possible if they were arising from two different species of complex.
In order to determine that the Co(I1) signal is a property of the active site Co(II), the 2:l CN--Co(II) monkey carbonic anhydrase B complex was titrated with ethoxzolamide, an agent highly specific for the metal-containing active center cavity (32). The complex with this sulfonamide is sufficiently stable that at the concentrations of enzyme used (2 to 8 x 10h4 M) this sulfonamide almost completely displaces the CN- from the active center at a 1: 1 ratio of sulfonamide to enzyme. Serial additions of fractional equivalents of ethoxzolamide abolish the ESR signal of of the 2:l cyanide complex in direct proportion to the amount of sulfonamide added up to 1 eq, where the signal is substantially gone (Fig. 8). The ethoxzolamide complex does not have an ESR signal detectable at this gain. Complete dis- placement takes slightly more than 1 eq since there is expected to be competition between CN- and ethoxzolamide (7). The ESR titration shows that both signals are removed simultaneously by the formation of the ethoxzolamide complex. Thus the en- tire ESR signal appears to involve active center Co(I1). This does not rule out, however, two different cyanide complexes, both involving active center Co(I1).
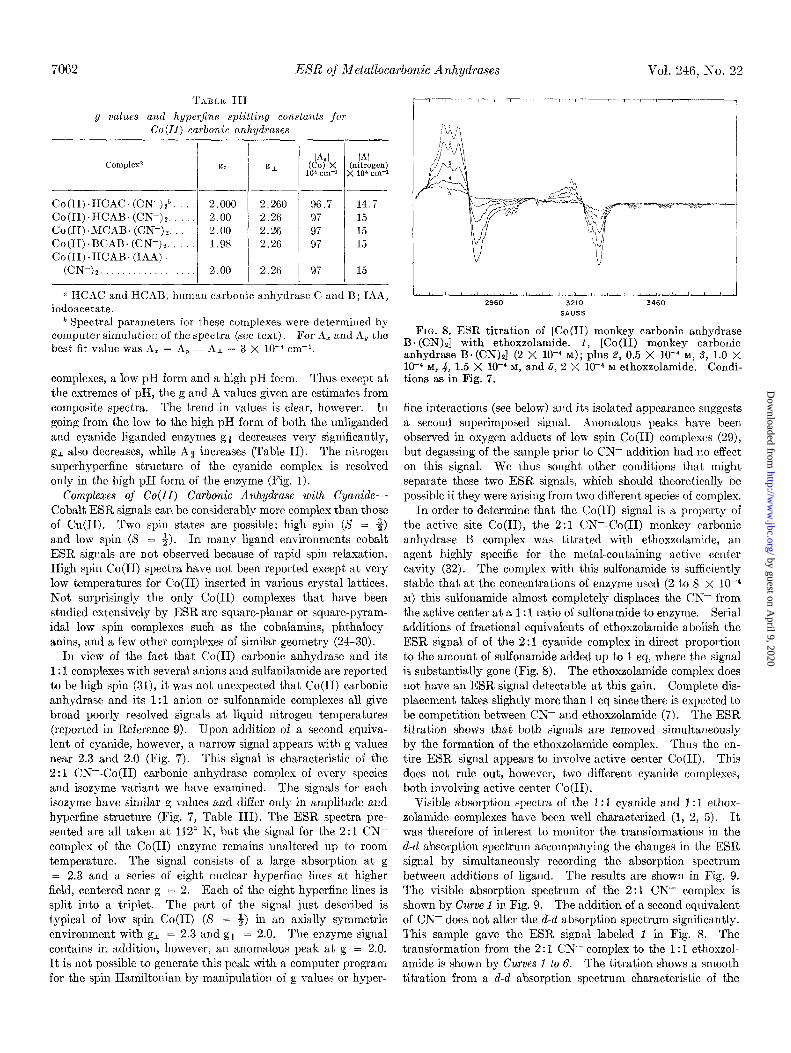
Visible absorption spectra of the 1: 1 cyanide and 1: 1 ethox- zolamide complexes have been well characterized (1, 2, 5). It was therefore of interest to monitor the transformations in the d-d absorption spectrum accompanying the changes in the ESR signal by simultaneously recording the absorption spectrum between additions of ligand. The results are shown in Fig. 9. The visible absorption spectrum of the 2:l CN- complex is shown by Curve 1 in Fig. 9. The addition of a second equivalent of CN- does not alter the d-d absorption spectrum significantly. This sample gave the ESR signal labeled 1 in Fig. 8. The transformation from the 2: 1 CN- complex to the 1: 1 ethoxzol- amide is shown by Curves 1 to 6. The titration shows a smooth titration from a d-d absorption spectrum characteristic of the
by guest on April 9, 2020
http://ww
w.jbc.org/
Dow
nloaded from
Issue of November 25, 1971 J. S. Taylor and J. E. Coleman 7063
A,nm
FIG. 9. Spectrophotometric titration of [Co(D) monkey carbonic anhydrase B. (CN)J with ethoxzolamide. Spectra labeled f to b were the same samples used in the experiment shown in Fig. 8; 6, 4 X 1O-4 M ethoxzolamide.
cyanide complex to the d-d absorption spectrum characteristic of the ethoxzolamide complex. Two clear isosbestic points are observed. Thus this spectrum shows that only two species are involved in the transformation of the absorption spectrum. Thus the initial optical species must be giving rise to the ESR signal. It could, however, be characteristic of only one of the ESR signals if the other ESR species does not have intense absorption in the visible region.
We attempted to examine the development of the Co(I1) ESR during formation of the 2 : 1 CN- complex by varying the order of addition of the three components, apoenzyme, Co(II), and CN-. If Co(I1) is added to the apoenzyme followed by 2 eq of cyanide the usual signal (Fig. 7) is observed. If 2 eq of cyanide are added to the apoenzyme first, followed by serial additions of Co(II), only the center signal at g = 2.0 is observed (Fig. 1OA) and no optical transitions appear in the 500- to 600. nm region. Thus the presence of 2 eq of CN- in the solution of of the apoenzyme prevents the formation of the axially sym- metrical active site complex with Co(I1).
The usual Co(II)-containing Tris buffers at pH 9 employed for making the cobalt enzyme do not give rise to an ESR signal when cyanide is added. However, if an Hz0 solution of cobalt sulfate is added to cyanide at pH 9, diluted with 0.025 M Tris, pH 9, and the ESR spectrum taken immediately, there is an intense signal at g = 2.0 that appears to be identical to the species observed in the enzyme (Fig. 10). Thus it appears that the isolated signal at g = 2.0 is due to a Co(II)-CN- complex. The results of the ethoxzolamide titration (Fig. 8) suggest that the cobalt forming the cyanide complex must come from active site Co(I1) (see “Discussion”).
These findings suggest that in the presence of even a relatively small excess of cyanide, some Co(I1) is removed from the active center to form a paramagnetic cobalt-cyanide complex. In an attempt to prevent the removal of enzyme-bound cobalt, a sample of Co(I1) human carbonic anhydrase C was titrated with slightly less than 2 eq of cyanide. The resultant signal (Fig. 10) is devoid of all but a very small contribution from the g = 2.0 signal. Hence the two cobalt signals are arising from different species and only the axially symmetrical signal with gl = 2.3
29’60 32’10 34’60
GAUSS
FIG. 10. ESR spectra of mixtures of Co(II), human apocar- bonic anhydrase C (APO HCAC), and cyanide. A, human apo- carbonic anhydrase C (2 X 10e4 M) plus CN- (2 X 1O-4 M) plus Co(I1) (2 X 10M4 M) (1) and plus Co(I1) (1 X low4 M) (2). Condi- tions: enzyme in 0.025 M Tris, pH 9; CN- in HZO, pH 9; Co(I1) as CoSOl in H20, pH 5; final pH of mixture, 9.0. B, Co(I1) as COSOJ in Hz0 (2 X low4 M) plus CN- in H20 (2 X lo+ M) at pH 9. C, Co(I1) human carbonic anhydrase C (HCAC) (2 X 10e4 Ma) +
CN- (1.8 X 10v4 M), both in 0.02 M Tris, pH 9.
and gi = 2.0 appears characteristic of the active center Co(I1) in the 2 : 1 complex with cyanide. The total spin density repre- sented by the signal in Fig. 10 has been calculated by double integration of the signal and was found to represent all the Co(I1) present in the enzyme (see below). In the case of the other Co(I1) isozyme-cyanide complexes (Fig. 7) the spin density associated with the axially symmetrical signal accounts for 90% of the cobalt present in the enzymes. This species must be giving rise to the intense visible absorption maximum (Fig. 8). The values of g and A for the Co(I1) enzymes are given in Table III.
DISCUSSION
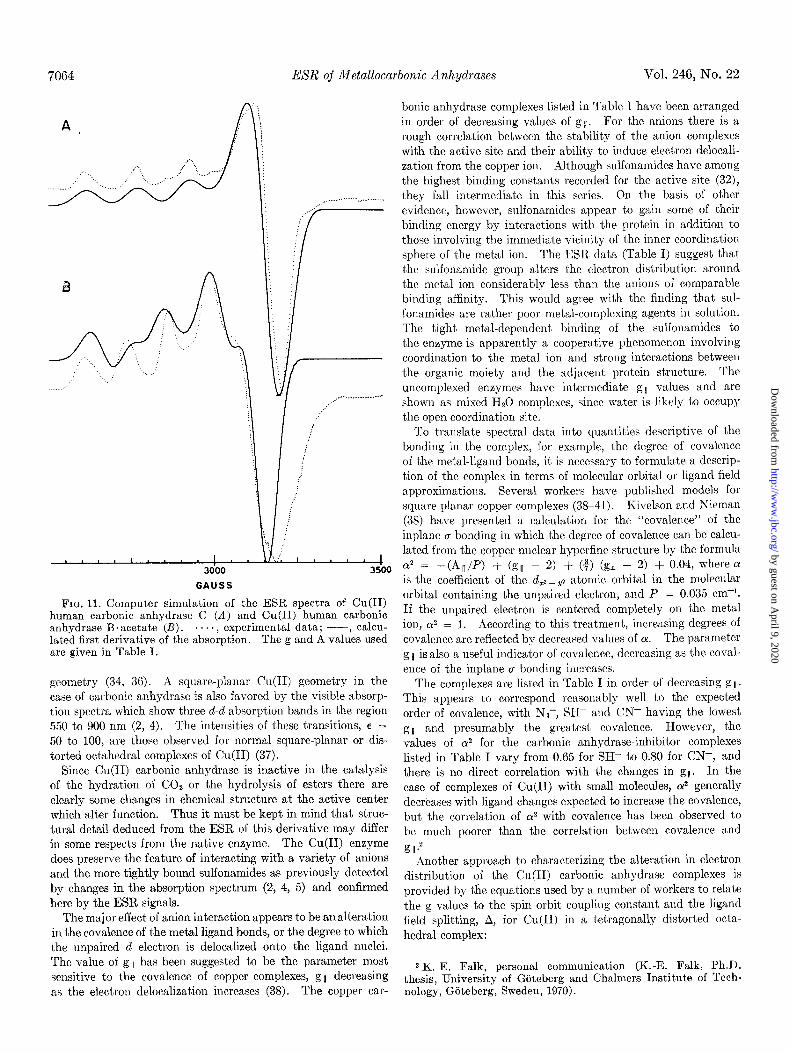
The ESR spectra of the Cu(I1) derivatives of human carbonic anhydrase R and C are characterized by g and A values that are typical of commonly occurring square-planar or tetragonally distorted octahedral Cu(I1) complexes with small molecules as ligands. (33-35). The spectra of both Cu(I1) enzymes can be fitted by an axially symmetrical spin Hamiltonian with g, = g, # gZ as shown by the computer simulation of the spec- trum of Cu(I1) human carbonic anhydrase C in Fig. 11. The copper nuclear hyperfine splitting constant, IA I,[ (Cu), is 0.0150 cm-l. This may be compared with values of 0.006 to 0.009 cm-l observed for Cu(I1) at the active sites of the intensely blue copper proteins in which the copper binding sites are believed to force significant distortions from the more usual square-planar
ApoHCAC+ ~;
by guest on April 9, 2020
http://ww
w.jbc.org/
Dow
nloaded from
7064 EXR oJ Metallocarbonic Anhydrases Vol. 246, No. 22
a
(
d-yb
: : . . . \ ; :
I!
_... _.,......_.,_..._.__...... - ,.” :‘ ;!’
,?
:, ; i : ;,. ;’
GAUSS
FIG. 11. Computer simulation of the ESR spectra of Cu(I1) human carbonic anhydrase C (A) and Cu(I1) human carbonic anhydrase B.acetate (R). . . . . , experimental data; --, calcu- lated first derivative of the absorption. The g and A values used are given in Table I.
geometry (34, 36). A square-planar Cu(I1) geometry in the case of carbonic anhydrase is also favored by the visible absorp- tion spectra which show three d-d absorption bands in the region 550 to 900 nm (2, 4). The intensities of these transitions, e = 50 to 100, are those observed for normal square-planar or dis- torted octahedral complexes of Cu(I1) (37).
Since Cu(I1) carbonic anhydrase is inactive in the catalysis of the hydration of COZ or the hydrolysis of esters there are clearly some changes in chemical structure at the active center which alter function. Thus it must be kept in mind that struc- tural detail deduced from the ESR of this derivative may differ in some respects from the native enzyme. The Cu(I1) enzyme does preserve the feature of interacting with a variety of anions and the more tightly bound sulfonamides as previously detected by changes in the absorption spectrum (2, 4, 5) and confirmed here by the ESR signals.
The major effect of anion interaction appears to be an alteration in the covalence of the metal ligand bonds, or the degree to which the unpaired d electron is delocalized onto the ligand nuclei. The value of gll has been suggested to be the parameter most sensitive to the covalence of copper complexes, gl decreasing as the electron delocalization increases (38). The copper car-
bonic anhydrase complexes listed in Table I have been arranged in order of decreasing values of g 1,. For the anions there is a rough correlation between the stability of the anion complexes with the active site and their ability to induce electron delocali- zation from the copper ion. Although sulfonamides have among the highest binding constants recorded for the active site (32), they fall intermediate in this series. On the basis of other evidence, however, sulfonamides appear to gain some of their binding energy by interactions with the protein in addition to those involving the immediate vicinity of the inner coordination sphere of the metal ion. The ESR data (Table I) suggest that the sulfoimmide group alters the electron distribution around the metal ion considerably less than the anions of comparable binding affinity. This would agree with the finding that sul- fonamides are rather poor metal-complexing agents in solution. The tight metal-dependent binding of the sulfonamides to the enzyme is apparently a cooperative phenomenon involving coordination to the metal ion and strong interactions between the organic moiety and the adjacent protein structure. The uncomplexed enzymes have intermediate g,, values and are shown as mixed Hz0 complexes, since water is likely to OCCUPY the open coordination site.
To translate spectral data into quantities descriptive of the bonding in the complex, for example, the degree of covalence of the metal-ligand bonds, it is necessary to formulate a descrip- tion of the complex in terms of molecular orbital or ligand field approximations. Several workers have published models for square planar copper complexes (38-41). Kivelson and Nieman (38) have presented a calculation for the “covalence” of the inplane (r bonding in which the degree of covalence can be calcu- lated from the copper nuclear hyperfine structure by the formula 01~ = -(AIL/P) + (g,, - 2) + (4) (gI - 2) + 0.04, where (Y is the coefficient of the dZ2- 2/2 atomic orbital in the molecular orbital containing the unpaired electron, and P = 0.035 cm-‘. I f the unpaired electron is centered completely on the metal ion, (Y~ = I. According to this treatment, increasing degrees of covalence are reflected by decreased values of (Y. The parameter g 11 is also a useful indicator of covalence, decreasing as the coval- ence of the inplane IJ bonding increases.
The complexes are listed in Table I in order of decreasing g 11. This appears to correspond reasonably well to the expected order of covalence, with N3, SH- and CN- having the lowest $1, and presumably the greatest covalence. However, the values of cy2 for the carbonic anhydrase-inhibitor complexes listed in Table I vary from 0.65 for SH- to 0.80 for CN-, and there is no direct correlation with the changes in gil. In the case of complexes of Cu(I1) with small molecules, d generally decreases with ligand changes expected to increase the covalence, but the correlation of o? with covalence has been observed to be much poorer than the correlation between covalence and
g11.2 Another approach to characterizing the alteration in electron
distribution of the Cu(I1) carbonic anhydrase complexes is provided by the equations used by a number of workers to relate the g values to the spin orbit coupling constant and the ligand field splitting, A, for Cu(I1) in a tetragonally distorted octa- hedral complex:
2 K.-E. Falk, personal communication (K.-E. Falk, Ph.D. thesis, University of Giiteberg and Chalmers Institute of Tech- nology, Goteberg, Sweden, 1970).
by guest on April 9, 2020
http://ww
w.jbc.org/
Dow
nloaded from

Issue of November 25,197l J. S. Taylor and J. E. Coleman 7065
gli = 2 + 8 / C i/Az, (2)
g, = 2 + 2 1 r I/&z,,, (3)
where { is the spin orbit coupling constant and A is the crystal field splitting for the d,z - ye + d,, and d,, - ye + d,,,d,, transitions, respectively. For the free copper ion, { is 828 cm-l, while [Cu(HzO,J zf requires a value of 620 cm-i to fit the absorp- tion spectrum (42). These apparent reductions of { occur in most Cu(I1) complexes and are usually explained in terms of delocalization of the e, electrons on to the ligand or charge transfer from the ligand to the central metal ion (42). In the present case an estimate of the A values can be made from the absorption spectra of the copper enzyme and its cyanide complex. Analysis of the visible absorption spectra suggest bands at 16,700 cm-l, 13,300 cm-l, and 11,100 cm-1 for the unliganded copper enzyme and bands at 16,000 cm-i, 14,300 cm+, and 10,500 cm-l in the cyanide complex (4). I f either the lowest energy band or the middle band is considered as the d,z _ yz + d,, transition, values of [ are 401 or 480 cm-1 for the unliganded enzyme and 257 or 352 cm-1 for the cyanide complex. Assigning the highest energy band to the d,= - y2 + dzy,gz transition, Equation 2 gives values of { of 467 and 400 cm-1 for the enzyme and the cyanide complex, respectively. The range of values of { suggests delocalization of the electrons onto the ligands in both the enzyme and the cyanide complex, more so in the cyanide complex.
The best computer fit for the N3, OCN- and acetate complexes (Fig. 4) is obtained if a small amount of rhombic distortion is introduced as shown for acetate in Fig. Il. Both the native isozymes and their cyanide complexes appear to be copper complexes with axial symmetry (Figs. 11 and 12). This would not be incompatible with four relatively coplanar ligands, three from the protein and one contributed from solution, probably water in the uncomplexed enzyme. Some of the larger inhibitor complexes may well produce slight distortions from this geometry either because of the ability of some ligands (N3, SH-) to form d-r bonds or because of limitation of bond angles forced by the protein tertiary structure.
The ESR signal of Cu(I1) carbonic anhydrase B as a function of pH suggests that the metal bonding becomes more covalent in the high pH form of the enzyme; both 811 and gr decrease, while IA II/ (Cu) increases (Table II). These changes are also shown by the cyanide complex (Table II, Fig. 1). This suggests that they are not due to the ionization of a coordinated water molecule which presumably has been replaced by CN-, but reflect changes in surrounding protein structure, perhaps ioni- zation of adjacent groups. Such changes in covalence and structure are of interest, since in the case of the active enzyme, the high pH form catalyzes hydration while the low pH form catalyzes dehydration. The ionization of a coordinated water molecule appears to account satisfactorily for the pH-rate profile, although changes in covalency of the metal complex due to shifts in protein tertiary structure may also be involved.
Carboxymethylation of carbonic anhydrase B clearly alters the metal coordination site (Fig. 5). The moderate alteration in g and A values is compatible with coordination of the carboxyl group to the Cu(I1) ion as has been suggested for the Co(I1) enzyme on the basis of absorption spectra (15). The presence of the carboxymethylated histidyl residue does not prevent the coordination of cyanide; however, the structure of the complex is altered from that normally appearing at pH 8 (Fig. 1 and 5). The presence of two overlapping signals in both spectra may be
FIG. 12. Computer-simulated spectra of Cu(I1) human carbonic anhydrase B.CN-. .. .. , experimental data; -, calculated first derivative of the absorption. Nitrogen hyperfine structure was entered in the program as arising from 2 (A), 3 (B) or 4 (C) nitrogen nuclei. The g and A values used are given in Table I.
accounted for by competition for the open coordination site between the carboxyl of the carboxymethyl group and the ligand from solution, Hz0 or CN- (15).
The striking superhyperfine structure on the gs signal of the cyanide complex is attributable to ligand nuclei and the spacing of -15 gauss suggests several equivalent nitrogens as the nuclei involved. On the first perpendicular peak there are seven equally spaced superhyperfine lines. A graphical integration of the areas under these lines gives approximate intensity ratios of 1:4:6:9:6:3:1 compared with 1:3:6:7:6:3:1 expected for 3 eq nitrogen atoms as ligands. Unfortunately, since this peak is a combination of several copper hyperfine lines this finding did not permit us to distinguish unambiguously between two and three nitrogens in previous work (9). The super- hyperfine structure on the single foldover peak is not well enough resolved to be sure whether there are five or seven lines. However, in the gl region at relatively high protein concentration it is possible to see that the nitrogen superhyper- fine structure on the first parallel hyperfine line at -2700 Gauss consists of at least seven line, -15 gauss apart, with approximate intensity ratios of 1:3 : 6 : 7 : 6 : 3 : 1. Computer simulation of the spectrum of the cyanide complex illustrates the difficulty of assigning the number of nitrogen ligands from the nitrogen superhyperfine structure, especially in the gr region (Fig. 12).
by guest on April 9, 2020
http://ww
w.jbc.org/
Dow
nloaded from

7066 EXR of Metallocarbonic Anhydrases Vol. 246, No. 22
Simulated spectra with 2, 3, and 4 equivalent nitrogen atoms as liga.nds are shown. Although the simulated spectrum with 3 equivalent nitrogens would appear to produce the best fit to the experimental data (Fig. 12), a possible ambiguity is introduced by the fact that both ‘j3Cu and G5Cu are present in the enzyme spectra. The splitting of the copper hyperfine lines due to the two isotopes is about the same as that expected from the nitro- gen superhyperiine interaction, thus the superhyperfine lines might be duplicated. A spectrum of pure 63Cu carbonic anhy- drase B (Fig. 2) shows that the nitrogen superhyperfine line at 2648 gauss arises from the interaction with the YJu nucleus and enzyme containing the single isotope shows only five super- hyperfine lines supporting the interpretation of 2 equivalent nitrogens rather than 3. The intensity ratios in this more highly resolved spect,rum are 1:2:3:2 : 1 as expected for the superhyperfine lines arising from 2 nitrogens. These appear to be protein nitrogens. Fine structure from the cyanide nitrogen appears unlikely but cannot be ruled out completely even if the anion is coordinated through carbon (43).
The electron density map of the Zn(I1) human enzyme C determined by x-ray diffraction at 2 A resolution shows three protein ligands to the metal ion. The electron densities appear to be fit by histidyl side chains (44). It appears likely that the 2 equivalent nitrogen ligands in the B enzyme may also be histidyl side chains. It is possible that in the case of the B enzyme the third ligand is not a histidyl nitrogen. We have not yet obtained a spectrum of pure 63Cu carbonic anhydrase C to determine whether the detailed nitrogen superhyperfine structure is different in the C isozyme.
Information on the molecular structure at the active site of the Co(H) enzyme is of additional interest, since the Co(I1) derivative is an active carbonic anhydrase. Studies of the visible absorption spectrum arising from the d-d electronic transitions have suggested a highly distorted geometry for the active site complex (2, 4). The electron density map at 2 A resolution for the human Co(I1) carbonic anhydrase C suggests that the cobalt coordination is similar to zinc with three ligands from the protein and one from solution (44). At liquid nitrogen temperatures the ESR signals of the Co(I1) enzyme and its 1:l anion or sulfonamide complexes are very broad and poorly resolved. This is unfortunate in terms of yielding structural information, but compatible with a high spin Co(I1) complex in which spin lattice interactions provide very rapid electron spin relaxation.
With the addition of a second cyanide molecule, the ESR signal shifts to one characteristic of axially symmetrical low spin Co(H) complexes (X = 3) in which the single unpaired d electron is localized to the d,z orbital. An axially symmetrical spin Hamiltonian does generate a computer spectrum almost identical with the experimental curve with the g and A values given in Table III. The eight cobalt nuclear hf lines at high field are split into triplets by interaction with a single nitrogen nucleus. The axial symmetry of the ESR signal and the nitro- gen shf structure can be adequately accounted for by a geometry in which there is a single vertical nitrogen ligand, the other ligands occupying the perpendicular plane. Since the c&z orbital has little density at ligand nuclei lying in a plane perpendicular to the x axis, an electron confined to this orbital sees only the vertical ligands as has been documented for a number of low spin Co(H) complexes (24-30). The anomalous peak appearing at g = 2.0
when the Co(I1) enzymes are reacted with two equivalents of CN- is cha.racteristic of a cyanide complex of free Co(I1) (45-47).
I f a second cyanide molecule coordinates the active center Co(II), the complex would appear to be a five-coordinate square pyramid with four ligands in the plane. The complex is not tetrahedral, since tetrahedral Co(I1) complexes cannot assume low spin, and anisotropic g values are likewise incompatible with regular tetrahedral geometry. I f there are four planar ligandti they must be two nitrogens from the protein and two CN- ions (or three protein nitrogens and one CN-) depending on the choice for the origin of the vertical ligand, protein or anion. A square pyrimidal geometry can adequately account for the ESR signal of the [Co(II) carbonic anhydrase (CN)s] complex. The signal is very similar to those of Co(I1) phthalocyanine with vertical nitrogen ligands or the five-coordinate 1: 1 complex of pyridine with o(, p, y, b-tetra(p-methoxyphenyl) porphinato cobalt (II) (24, 29). The g values and hyperfine splitting con- stants jL4,, I and [Ai ( ‘t m rogen) of these five-coordinate complexes are almost identical with those observed for [Co(II) carbonic anhydrase.(CN)& as are the spectral parameters for five-coordinate Bizr complexes (50). There are small differences in the cobalt nuclear hyperfine splitting on the gr signal that are related to the particular isozyme used. Variations in the perpendicular hf structure in model low spin Co(I1) complexes have been attributed to such things as difference in length of vertical bonds to the cobalt or variation of the cobalt position in or out of the plane (29). Such minor structure differences may indeed exist between isozymes and species variants of Co(I1) carbonic anhydrase.
The coordination complexes at the active site of carbonic anhydrase which give rise to the ESR signals reported here are all undoubtedly slightly different than the complexes in the active forms of the Zn(I1) or Co(I1) enzymes, but would appear to be closely related to the active coordination complex. For example, the two nitrogen ligands to the Cu(I1) ion are likely to be ligands to Zn(I1) and Co(H), since the binding of these three ions is mutually exclusive. The change in the ESR signals of the enzymes induced by the anions and sulfonamides suggest strongly that the inhibitors contribute a ligand to the inner coordination sphere of the Cu(I1) or Co(I1) ion. (Figs. 1 through 8). Thus it appears likely that most of these metal ions when located at the active site of carbonic anhydrase have an open coordination site or one filled with easily replaceable solvent water. The latter has been postulated for the Zn(I1) and Co(I1) derivatives on the basis of a variety of other evidence (48, 49)
An interesting feature of the carbonic anhydrase complexes with ESR spectra reported here is that they all appear to have close-to-axial symmetry. This finding appears best accommo- dated by a square planar or five-coordinate geometry. This may not be the geometry required by the active complex, particularly in the case of Co(II), where the active enzyme appears to be high spin. On the other hand the low spin form is preferred by the axially symmetrical 2:l cyanide complex. Cu(I1) com- plexes are also stabiliied by a close approach to a square planar geometry. The Cu(I1) enzyme is inactive. It is possible that some feature of the coordination chemistry is catalytical un- favorable, perhaps the geometry of the complex. These facts might suggest that there is some flexibility in the protein metal- binding site that may accommodate the preferred geometry of a particular metal ion, Cu(I1) e.g. or under exceptional circum-
by guest on April 9, 2020
http://ww
w.jbc.org/
Dow
nloaded from
Issue of November 25, 1971 J. S. Taylor and J. E. Coleman 7067
stances add another ligand as in the 2: 1 cyanide complex of the 22.
Co(I1) enzyme. The active geometry in the case of Zn(I1) 23. and Co(I1) may be a distorted four-coordinate complex some- where between a tetrahedral and square planar arrangement.
24 25:
A distortion toward a tetrahedron might favor the rapid es- 26. change of monodentate ligands which is likely to be an essential step in the mechanism of action. 27.
Acknowledgment-We are greatly indebted to Dr. W. E. 28. Blumberg for helpful discussions and for supplying us with the computer program for the spin Hamiltonian.
29
30:
BRADBURY, S. L., J. Biol. Chem., 244, 2002, 2010 (1969). WHITNEY, P. L., NYMAN, P. O., AND MALMSTR~M, B. G., J.
Biol. Chem., 242, 4212 (1967). ASSOUR, J. M., J. Chem. Phys., 43, 2477 (1965). ASSOUR, J. M., J. Amer. Chem. Sot.. 87. 4701 (1965). SCHRAU~ER, G: N., AND LEE, L. P.,‘J. -Amer. ‘Chek Sot., 90,
6541 (1968). SCHMIDT, J. G., BREY, W. S., AND STOUFER, R. C., Inorg.
Chem., 6, 268 (1967). KIMBALL, M. E., PRATT, D. W., AND KASHA, W. C., Znorg.
Chem., 7, 2006 (1968). WALKER, F. A., J. Amer. Chem. Sot., 92,4235 (1970). HOFFMAN, B. M., DIEMENTE, P. L., AND BASOLO, F., J. Amer.
Chem. Sot., 92, 61 (1970).
1. 2. 3.
4. 5.
6. 7. 8.
9.
10.
11. 12. 13.
14.
15.
16.
17.
18.
19. 20.
21.
REFERENCES
LIXDSKOG, S., J. Biol. Chem., 238, 945 (1963). COLEMAN, J. E., Proc. Nut. Acad. Sci. U. S. A., 69, 123 (1968). LINDSKOG, S., AND NYMAN, P. O., Biochim. Biophys. Acta, 86,
462 (1964). COLEMAN, J. E., Biochemistry, 4, 2644 (1965). COLEMAN, J. E., in R. E. FORSTER, J. T. EDSALL, A. B. OTIS,
AND F. J. W. ROUGHTON (Editors), COZ: Chemical, biochemi- cal and physiological aspects, NASA Symposium, SP-188, Washington, D. C., 1969, p. 141.
LINDSICOG, S., Biochemistry, 6, 2641 (1966). COLEMAN, J. E., Nature, 214, 193 (1967). FRIDBORG, K., KANNAN, K. K., LILJAS, A., LUNDIN, J.,
STRANDBERG, B., STRANDBERG, R., TILANDER, B., AND WIR~N, G., J. Mol. Biol., 26, 505 (1967).
TAYLOR, .J. s., MUSHAK, PI, AND COLEMAN, J. E., Proc. Arat. Acad. Sci. U. S. A.. 67. 1410 (1970).
RICKLI, E. E., GHAZ~N~AR, S. ‘A. S., GIBBONS, B. H., AND EDSALL, J. T., J. Biol. Chem., 239, 1065 (1964).
LINDSICOG, S., Biochim. Biophys. Acta, 39, 218 (1960). DUFF, T. A., AND COLEMAN, J. E., Biochemistry, 6, 2009 (1966). RICKLI, E. E., AND EDSALL, J. T., J. Biol. Chem., 237, PC 258
(1962). DUCKWORTH, H. W., AND COLEMAN, J. E.. Anal. Biochem.. 34.
382 (1970): ’ I , I
COLEMAN, J. E., in E. T. KAISER AND F. J. KEZDY (Editors), Progress in bioorganic chemistry, Vol. I, Interscience, New York, 1971, p. 159.
TAYLOR, P. w., KING, 11. W., AND BURGEN, A. S. V., Bio- chemistry, 9, 3894 (1970).
ROZANTZEV, E. G., AND KRINITZI~AYA, L. A., Tetrahedron, 21, 491 (1965).
HARRIS, M. I., AND COLEMAN, J. E., J. Biol. Chem., 243, 5063 (1968).
THIERS, R. E., Methods Biochem. Anal., 6, 273 (1957). 48. HUTCHISON. C. A.. AND PASTOR. R. C.. Phus. Rev. 81. 282 49.
(1951). I ”
BRIERE, R., LEMAIRE, H., AND RASSAT, A., Bull. Sot. Chim. France, 626, 3273 (1965).
31. LINDSKOG, S., AND EHRENBERG, A., J. Mol. Biol., 24, 133 (1967).
32. MAREN, T. H., Physiol. Rev., 47, 595 (1967). 33. WIERSEMA, A. K., AND WINDLE, J. J., J. Phus. Chem.. 68.
34. 2316 (1964).
,
PI~ISACH, J. AND BLUMBERG, W. E., in T. F. YEN (Editor), Electron spin resonance of metal complexes. Plenum Press. New York; 1969, p. 71. -
. I
BLUMBERG, W. E. AND PEISACH, J., J. Chem. Phys., 49, 1793 (1968).
35.
36.
37.
38. 39. 40.
41.
42. DUNN, T. M., in J. LEWIS AND R. G. WILKINS (Editors), Modern coordination chemistry, Interscience, New York, 1960, p. 229.
43. HAYES, R. G., J. Chem. Phys., 47, 1692 (1967). 44. LILJAS, A., Crystal structure studies sf human erythrocute
45.
46.
47.
50.
BLUMBERG, W. E. in J. PEISACH, P. AISEN, AND W. E. BLUM- BERG, (Editors), The biochemistry of copper, Academic Press, New York, 1966, p. 49.
COTTON, F. A., Advanced inorganic chemistry, Ed. 2, Inter- science, New York, 1966, p. 901.
KIVELSON, D., AND NIEMAN, R., J. Chem. Phys., 36,149 (1961). SMITH, D. W., J. Chem. Sot. (A), 3108 (1970). CARRINGTON, A., AND MCLACHLAN, A. D., Introduction to
magnetic resonance, Harper and Row, New York, 1967, p. 146. MAKI, A. H., AND MCGARVEY, B. R., J. Chem. Phys., 29, 31,
35 (1958).
carbonic anhydrase C at high resolution, Acta Universitatis Upsaliensis, Weilands Trvckeri. UDusala. Sweden. 1971.
BAY~TON, J. H., LOONEY, I?. D., ~N~^WIN&ELD, M: E., Aust. J. Chem., 16, 557 (1963).
BAYSTON, J. H., BEALE, R. N., KELSO KING, N., BND WIN- FIELD, M. E., Aust. J. Chem., 16, 954 (1963).
ALEXANDER, J. J., AND GRAY, H. B., J. Amer. Chem. Sot., 89, 3356 (1967).
COLEMAN, J. E., J. Biol. Chem., 242, 5212 (1967). FABRY, M. E., KOENIG, S. H., AND SCHILLINGER, W. E., J.
Biol. Chem., 246, 4256 (1970). BAYSTON, J. H., LOONEY, F. D., PILBROW, J. R., AND WIN-
FIELD. M. E., Biochemistry, 9, 2164 (1970).
by guest on April 9, 2020
http://ww
w.jbc.org/
Dow
nloaded from
June S. Taylor and Joseph E. ColemanElectron Spin Resonance of Metallocarbonic Anhydrases
1971, 246:7058-7067.J. Biol. Chem.
http://www.jbc.org/content/246/22/7058Access the most updated version of this article at
Alerts:
When a correction for this article is posted•
When this article is cited•
to choose from all of JBC's e-mail alertsClick here
http://www.jbc.org/content/246/22/7058.full.html#ref-list-1
This article cites 0 references, 0 of which can be accessed free at
by guest on April 9, 2020
http://ww
w.jbc.org/
Dow
nloaded from